Abstract
The main advantage of phase noise meters with photonic (fiber) delay lines is that they do not require high-performance, low-noise reference oscillators. On the other hand, some additional calibrations are required, which are the subject of this paper. First, the quadrature must be maintained on the mixer by precise adjustment of the phase and/or delay. Next, since the response of the mixer is proportional to the square of the input test signal, a precise amplitude calibration is required. Finally, the frequency response of the FFT spectrum analyzer and its corresponding anti-aliasing low-pass filter needs to be known precisely. In this paper, to the best of our knowledge, we present innovative solutions for all three calibrations. All three calibrations were built in and tested in our phase noise meter. The result is a simple and robust phase noise meter suitable for non-laboratory environments.
1. Introduction
The spectral line width is one of the most important parameters of any oscillator: mechanical, electrical, optical, etc. An increasingly narrower spectral line width is required from electronic radio-frequency oscillators. The spectrum of such oscillators is frequently described with the more accurate term phase noise at many different frequency offsets from the central frequency.
The phase noise of an oscillator mainly depends on the group delay or loaded quality Q of the resonator controlling the frequency of an oscillator [1,2,3,4]. Early radio equipment used lumped LC circuits with Q in the range of around for oscillator frequency control. More demanding radio equipment shifted to electromagnetic cavity oscillators with Q in the range of around . Even better phase noise performance could be obtained with piezoelectric mechanical resonators (quartz crystals) with Q exceeding . The ever-increasing demands for lower phase noise promote new technologies such as dielectric resonators or electro-optical devices. The advance of optoelectronics enabled oscillators that use electro-optical techniques to generate high-quality signals in the microwave and millimeter wave range [5] with applications from precision scientific measurements [6] to consumer communications [7]. As a consequence, phase noise metrology is an increasingly important issue. However, with the request for better signal sources, new methods for measuring phase noise must be developed and/or the established methods must be improved.
There are three established methods for measuring phase noise [8]: the direct method, the phase detector method, and the delay line method, also refereed to as the frequency discrimination method. The first two rely on a high-quality reference. The latter is especially questionable in the case of the direct method. In this case, also the dynamic range of a logarithmic detector poses a serious limitation. The delay line method, on the other hand, does not require a reference, thus making it attractive for the characterization of state-of-the-art oscillators whose phase noise is better than that of standard references. To increase the sensitivity, the dual-channel cross-correlation technique became the norm in phase noise metrology and is therefore often regarded as the fourth method.
When the opto-electronic oscillator (OEO) was introduced in [9], the delay line method with an optical fiber providing the delay was used for the first time. It took 10 years for the method to receive the first in-depth treatment in [10], soon followed by its implementation in the dual-channel cross-correlation topology [11,12,13,14]. Another 10 years later, with the popularization and development of microwave photonics [15,16], the method received a new wave of attention with an emphasis on moving the signal processing in the optical domain. The microwave photonic processor, which provides both phase shift and time delay in the optical domain, was implemented with a polarization-modulated link [17]. However, a microwave mixer was used to down-convert the noise. In [18], the microwave photonic down-converter was implemented, where delayed and non-delayed branches were multiplied on a photodiode. Both techniques were merged in [19,20] so that the phase noise of the microwave source was directly observed at the output of the photodiode. The phase shifter requirement was solved in [21] by using an I/Q mixer for the down-conversion, and the same technique was presented using the photonic delay and microwave I/Q mixer in [22]. The application of all-optical I/Q mixing and digital phase demodulation to the phase noise measurement was presented in [23,24]. In [25], the measured signal was fed into the optical frequency comb followed by the photonic delay method. The use of higher-order comb modes in a delayed self-heterodyne method provides a sensitivity enhancement. This technique was presented in an all-optical form in [26], where both the optical frequency comb and optical I/Q mixing were employed. The photonic delay method was successfully used to characterize the phase noise of the optical frequency comb [27]. A carrier suppression technique traditionally used with an amplifier additive phase noise measurement was successfully implemented with a photonic delay in [28]. The photonic delayed and non-delayed branches were made to interfere in a 3 dB coupler before being fed into the microwave mixer. Such an interference significantly suppresses the noise contribution from the microwave amplifiers and the photonic delay line.
At the time of its emergence two decades ago, the photonic delay line method enabled the research of ultra-low-noise oscillators. The ongoing research, however, shifted towards more and more complex systems, making the method limited to specialized laboratories and often more expensive than commercial phase noise measurement solutions. On the other hand, simple setups require cumbersome calibration with known sources and/or exact knowledge of the parameters of the components used and fine-tuning of the system.
In our work, we describe simple solutions for the calibration of a photonic delay line phase noise meter to make the method more accessible. The proposed calibration techniques can reduce the system complexity and make the setup very robust under non-laboratory conditions. The innovative calibration solutions are presented for the precise adjustment of the phase of the mixer quadrature, mixer amplitude calibration, and beat frequency response. In this paper, we present a simple, automatic, and autonomous solution for the calibration and stabilization of a photonic delay line phase noise meter. First, the theoretical background is presented in Section 2, followed by a more detailed description of individual solutions. In Section 3, the implemented setup is described together with a comparison to the direct method and an evaluation of the sensitivity of the system. Finally, Section 4 concludes the paper with a discussion and a reminder about some of the shortcomings of the presented photonic delay phase noise meter.
2. Materials and Methods
The conceptual schematic of the delay line method is shown in Figure 1.
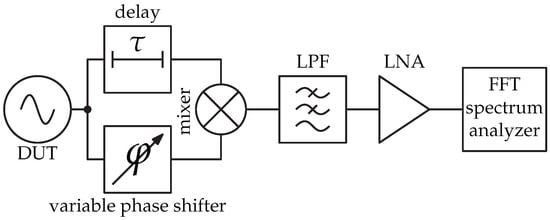
Figure 1.
Conceptual block diagram of the delay line method. The phase shifter is optional, but in practical cases, it is more convenient than tuning the delay line.
The measured signal from the device-under-test (DUT) is first split into two branches, one of which contains a delay. Both branches are then fed to the mixer, followed by a low-pass filter (LPF), a low-noise amplifier (LNA), and a beat frequency (audio) FFT spectrum analyzer.
The signals at the input ports of the mixer can be written as follows:
where and are amplitudes, is the angular frequency of the measured signal, is the delay, is the relative phase difference between the branches, and is the random process of phase noise. The output of the mixer is
where is the phase-to-amplitude conversion factor of the mixer. is a function of frequency and both amplitudes. In order for the mixer to operate as a phase detector, quadrature has to be ensured at the inputs so that
It can be observed from (4) that quadrature can be ensured with two degrees of freedom. Either the delay or the phase can be tuned. In practice, tuning the phase with a phase shifter is more convenient than tuning a long delay. However, for the sake of mathematical derivation, we set and , so that Equation (3) is simplified to
The high-frequency term is not interesting for the measurement and is filtered out by the low-pass characteristics of the mixer IF port and an additional LPF. We took into account rad and the stationarity of the phase noise random process. Since we are interested in the phase noise in the frequency domain, we took the Fourier transform of the mixer output:
where is the Fourier transform of the phase noise random process . Converting it into the power spectrum, we obtain
where is the power spectral density of the phase-fluctuation random process .
In practice, additional amplification is required to observe (7) on a spectrum analyzer. Spectrum analysis in the Fourier bandwidth of the phase noise is performed digitally with the FFT algorithm on the sampled down-converted noise. The response of the analog-to-digital converter (ADC) with its corresponding anti-aliasing filter and amplifier has to be carefully flattened over the frequency band of interest. It is more convenient to include the exact gain of the chain in during calibration. As shown, to measure phase noise, the quadrature condition has to be maintained and has to be known under the assumption that the analyzer’s response is flat. In the following sections, techniques to fulfill these requirement are presented in detail.
2.1. Quadrature Lock Mechanism
The first prerequisite in deriving the response of the described phase noise meter (7) was the quadrature condition at the inputs of the radio-frequency (RF)/microwave mixer. It is also shown that this can be obtained either with tuning the delay or the phase. When the condition of quadrature is satisfied, the mixer acts as a phase detector so that the output amplitude is proportional to the phase fluctuation of the input.
If the quadrature condition (4) is not satisfied, meaning that the phase difference between the delayed and non-delayed branch does not equal an odd multiple of , the output of the mixer (3) is
It can be seen from (9) that the presence of the DC component at the output of the mixer indicates that the quadrature condition is not satisfied. Thus, the DC component can be used as an error signal to the control circuit driving the variable phase shifter. A voltage-controlled variable phase shifter (VPS) offers obvious simplicity compared to a motor-driven mechanical variable phase shifter.
The required quadrature condition occurs every 180°. If only one slope can be used in the feedback, a −180° to 180° phase shift is necessary to reliably lock in quadrature. As the phase difference is relative, the requirement for the phase shifter is at least a 360° shift. However, to prevent the phase shifter becoming stuck at either end of the available phase shift, a mechanism for wrapping the phase shift is required. Figure 2 shows the schematic of the developed quadrature-lock circuit.
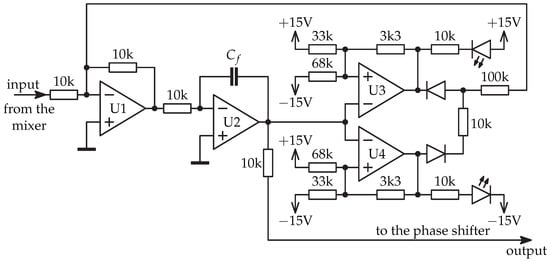
Figure 2.
Schematic of the analog quadrature lock with phase wrap mechanism.
Quadrature correction feedback is achieved by utilizing U2 as an integrator, which sets the tuning voltage for the voltage-controlled variable phase shifter. The value of in the feedback of the integrator was empirically selected to be 30 μF. No additional lead–lag network was required to improve the phase margin of the feedback.
The phase shifter driving signal is also fed to two parallel Schmitt triggers U3 and U4. Their output is fed back to the summing inverting amplifier U1. When the driving signal reaches the maximum tuning voltage, the Schmitt trigger U3 turns on and forces the tuning voltage to the minimum value, thus effectively wrapping the phase. U4 performs the opposite action when the minimum tuning voltage is reached. The diodes and 10 kΩ resistor at the U3 and U4 outputs prevent an illegal state (a stall) when both Schmitt triggers force turnarounds in opposite directions simultaneously. The light-emitting diodes (LEDs) are a visual notification of when the individual trigger is on, since the measurement is not valid during the phase wrap. The quadrature lock circuit is implemented with OPA197 rail-to-rail operational amplifiers. The diodes used are low-leak BAS116.
2.2. Phase-to-Amplitude Conversion Factor Calibration
With the quadrature condition maintained at the mixer inputs, the system is in the correct working regime. However, still needs to be determined to calculate the phase noise from (7). The phase-to-amplitude conversion factor is defined as:
where and are voltage and phase fluctuations, respectively. Since at the output of the mixer, the voltage fluctuation is measured, a known phase fluctuation, namely phase modulation (PM), can be used to extract from the measured demodulated voltage of a calibration tone. A phase modulator at the input of the measurement setup enables mixer response calibration without interrupting the measurement of the phase noise of the DUT.
If the modulator response is unknown, can also be extracted from the measured spectra at the input and output of the delay line measurement system. For a small modulation index m, which for PM equals the peak phase deviation , the relation holds
where is the power of the modulation sideband, is the power of the carrier, and is the modulation-to-carrier ratio. Choosing the modulating frequency so that
ensures that the calibration tone is at the maximum of the system response, thus enabling the detection via a simple peak search. Deriving from (11) and using give
where is the demodulated calibration signal. Using the relation (13), the phase noise can be obtained from (7).
2.3. Phase Shifter and Phase Modulator
Both the quadrature lock mechanism and mixer response calibration require control of the phase. This is provided by the phase shifter and phase modulator, both implemented as varactor-tuned resonant phase shifters in microstrip technology [31], as shown in Figure 3.
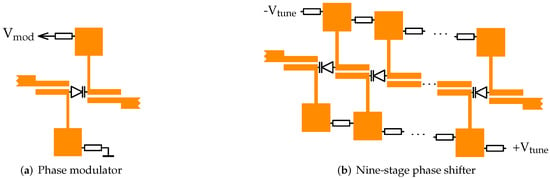
Figure 3.
Layout of the phase modulator and phase shifter realized on 0.76 mm-thick Rogers RO4350B laminate. The varactors are Infineon BB857-02V with 10 kΩ bias resistors.
For the phase modulation, a small phase change in the range of 1° or less is required, meaning that a single resonant element suffices. Figure 4 shows the response of the used modulator.
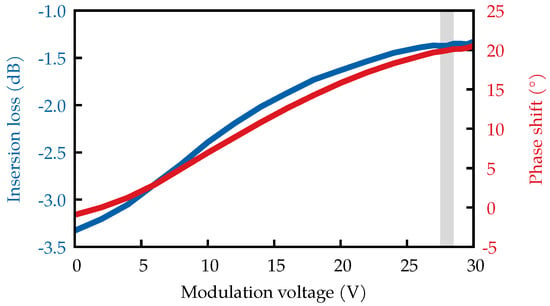
Figure 4.
Response of the phase modulator at 10 GHz. The shaded area shows the region of operation in the presented system.
Apart from the desired phase change, the modulator also exhibits some unwanted amplitude change over the range of usable modulation voltages. However, since only a small fraction of the available phase change is needed, it is possible to optimize the calibration signal for the minimum amplitude fluctuation that occurs as a result of the modulator. In our case, we used 28 V of DC offset to operate the modulator at the upper limit where the amplitude response flattens out.
The phase shifter used to achieve quadrature is shown in Figure 3b. It consists of nine resonators providing approximately 370° over the a tuning voltage span of 30 V. At 10 GHz, the insertion loss varies from 9 dB to 12 dB. The varactors are differentially biased with the anode at −15 V and the cathode driven by the quadrature lock circuit shown in Figure 2. Other types of electronically controlled phase shifters [32] can be used; however, the DC isolation of the tuning elements in the proposed phase shifter simplifies the quadrature lock circuit.
2.4. FFT Spectrum Analyzer and Anti-Aliasing Filter Response Correction
The phase noise of an RF/microwave oscillator is most interesting at relatively small frequency offsets from 10 Hz to 100 kHz. A scanning-receiver-type spectrum analyzer is inefficiently slow while measuring the average of a random noise signal in this frequency range. An FFT spectrum analyzer using an inexpensive computer sound card is much faster, but requires appropriate input filtering and accurate calibration.
To calibrate the response of the FFT spectrum analyzer and its corresponding front-end, a source with a known flat spectrum is required. A pseudo-random bit sequence (PRBS) generator produces a noise spectrum [33] with the envelope proportional to
producing a flat noise spectrum for . The calibration noise should not saturate the ADC and should be higher than the ADC’s own noise. The exact level is not as important as its flatness. At , the spectrum deviates from a flat line for −0.2 dB, thus requiring to be in the range of a few MHz for practical phase noise measurements.
In our experiment, we used the primitive polynomial clocked at an of 4 MHz which gives a negligible deviation from a flat spectrum for a measurement bandwidth of 100 kHz. The measured PRBS spectrum (in logarithmic units) is subtracted from the sampled signal spectrum when performing the final measurements.
3. Results
The presented phase noise meter and the corresponding calibration techniques were built with the emphasis on the affordability and accessibility of photonic-enabled phase noise measurement. It is possible to reproduce the experiment with limited or no specialized equipment, which commonly makes such measurements limited to specialized environments.
3.1. Final Setup
Figure 5 shows the complete phase noise meter with a photonic delay.
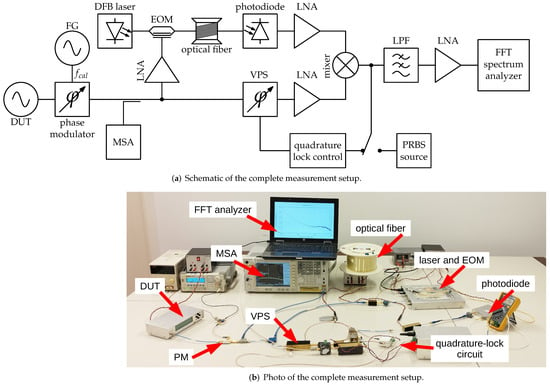
Figure 5.
Complete measurement setup.
The measured signal is first fed into the phase modulator driven by a function generator (FG) with a sine wave of 84 kHz and 1 V , giving an of 0.3°. A −20 dB directional coupler is used as a monitor port observed on a microwave spectrum analyzer (MSA). This enables the simultaneous measurement with the direct method and the modulation-to-carrier ratio verification. The latter agrees with the computed from the modulator response in Figure 4 and Equation (11).
The signal is then split with a −3 dB splitter into a delayed and a non-delayed branch. In the non-delayed branch, there is a variable phase shifter and a microwave amplifier that compensates for the insertion loss of the phase shifter. The delayed branch consists of an analog optical link along with a pre- and a post-amplifier providing the necessary signal levels for the electro-optic modulator (EOM) and the mixer, respectively. The temperature-stabilized distributed feedback (DFB) telecommunication laser with a wavelength of 1550 nm and an optical output power of 5 dBm is modulated with a LiNbO3 Mach–Zehnder modulator biased at the −3 dB point. The delay of 6 μs is provided by 1256 m of standard G.652 optical fiber, while a low-cost PIN photodiode [34] is used for detection. The selected fiber length is the most suitable from the available fiber spools in the laboratory. Both branches are then mixed at the singly balanced HEMT mixer, the output of which is fed to a low-pass anti-aliasing filter with a 3 dB bandwidth of 94 kHz and amplified with a low noise DC-coupled amplifier. The integrated sound card of an HP 8450w laptop operates at a sampling frequency of 192 kHz and is used as an FFT analyzer, limiting the bandwidth of frequency offset measurement to 96 kHz. The required digital signal processing is performed in the Python programming language using the corresponding libraries. The components were built in-house. The mixer is implemented with a CEL CE3512K2 GaAs HEMT. The LNA following the photodiode is a three-stage amplifier built with Infineon BFP840ESD transistors. The other two microwave LNAs are Mini-Circuit GVA-123+ MMICs. The DC-coupled LNA is an OP27 operational amplifier with a discrete input stage that utilizes SSM2212 transistors.
A high-impedance connection is made to the mixer output to feed the DC component to the quadrature lock circuit and to provide an input for the PRBS generator built with standard CMOS logic and a 4 MHz clock frequency. Before the actual phase noise measurements, the PRBS signal is injected into the output of the mixer, and the response is recorded with an FFT spectrum analyzer. The deviation from the flat line is saved and used as a correction for the measurements of the phase noise and the evaluation of the system noise floor.
3.2. Phase Noise Measurements
Three DUTs were measured with the presented phase noise meter. First, a frequency synthesizer based on a MAX2871 FPLL chip was measured and compared to the direct method performed with an Agilent E4445a spectrum analyzer. The results presented in Figure 6 show the good agreement of both methods used. Both methods also agree with the specifications given by the manufacturer of the chip.
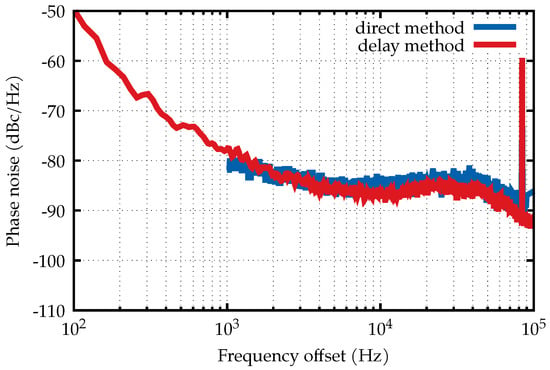
Figure 6.
Comparison of the phase noise measured with the direct method by a commercial spectrum analyzer and the presented phase noise meter with photonic delay.
The strong spike in the measured spectrum is the calibration tone. The presented setup enables measurements with both methods simultaneously.
With confidence in the correct operation of the photonic delay phase noise measurement system, two better-quality devices were implemented and characterized. First, a 125 MHz voltage-controlled crystal oscillator (VCXO) was multiplied to 10 GHz using Mini-Circuits RMK-5-751+ and Analog Devices HMC445 frequency multipliers. Both multipliers were filtered with corresponding bandpass filters to remove unwanted harmonics. Second, a simple single-loop opto-electronic oscillator with 1000 m of G.652 optical fiber as shown in Figure 7 was also implemented. The laser used is a free-running telecommunications DFB 1550 nm laser with a 10 dBm output fed into the Mach–Zehnder modulator operating at the −3 dB point. None of the advanced techniques for stability and noise reduction such as those presented in [35,36,37] were implemented. Thus, the performance of the OEO is expected to be inferior to those presented in some literature on OEOs. The obtained 10.5 GHz OEO performance is comparable to [38], where the same output power and frequency OEO were characterized.
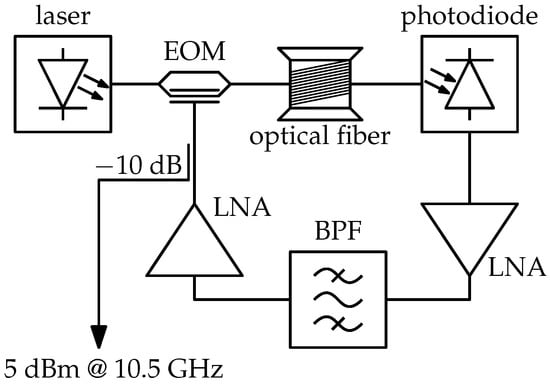
Figure 7.
Opto-electronic oscillator built for measurement with the presented photonic delay phase noise meter.
Figure 8a shows the measured phase noise of both the VCXO and OEO.
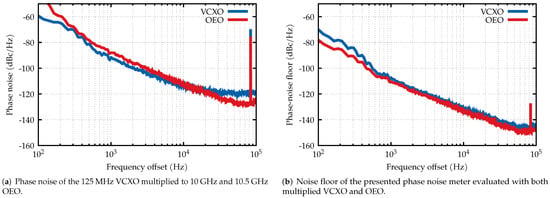
Figure 8.
Measurement of phase noise and system noise floor evaluation.
From the plots of the measured phase noise, it should be noted that below 1 kHz of frequency offset, the measurement accuracy starts to rapidly degrade due to a short delay. This is even more obvious from the noise floor evaluation. To solve this, a longer optical fiber should be used.
3.3. Noise Floor Evaluation
The noise floor of the system was evaluated according to [10]. Simply turning off the DUT greatly underestimates the system noise floor due to the absence of the measured signal at the mixer inputs, resulting in no down-conversion of the noise contribution from the microwave amplifiers, the optical link, and other components used in the system. Reducing the delay , it follows from (7) that phase noise from the DUT is suppressed. Therefore, replacing the spool of optical fiber with a short fiber patch cord, matching the group delay of the phase shifter, suppresses the phase noise from the measured device. At the same time, the presence of the signal ensures the operating conditions of the components, thus enabling the noise contributions to be down-converted. To measure the noise floor of the system, the quadrature condition has to be maintained and has to be determined; thus, both calibration techniques are also used in the noise floor evaluation. It should be noted that (12) does not hold when determining during noise floor evaluation and the sine term from (7) should be taken into account. Using small-angle approximations, Equation (13) is simply multiplied by . The measured noise floor of the presented photonic delay system is shown in Figure 8b. The results are comparable with the noise floor achieved by [10,17,22] and are better than the recently presented all-optical solution [20] while keeping the setup as simple as possible. It was shown in [39] that a careful selection of the components can already significantly reduce the phase noise floor without employing complex sensitivity enhancements as those of [25,26,28].
4. Discussion
The presented photonic delay line phase noise meter is a measurement setup accessible to an average microwave laboratory. The quadrature lock mechanism reduces the environment stabilization requirements and ensures the correct operation regime. The use of a known phase modulation of the measured signal enables the simultaneous measurement of phase noise and system response calibration, thus enabling real-time compensation for the slow amplitude variations due to the variable phase shifter insertion loss voltage dependence. Correction of the FFT analyzer and its corresponding anti-aliasing filter response is performed with a simple pseudo-random noise source where only the spectral flatness is important. Fortunately, this correction has to be performed only once and does not depend on the DUT. Although in principle, this also holds for phase noise floor evaluation, the use of a noisy DUT can lead to overestimation due to insufficient DUT noise suppression. The results of phase noise floor measurements are comparable to those presented in the literature without employing any special sensitivity improvement technique, therefore leaving room for improvement. In the final setup, the only commercial instrument used was a function generator providing the low-frequency calibration tone, which, if necessary, could easily be replaced by a special-purpose low-frequency oscillator. However, introducing a specialized commercial FFT analyzer could remove the need for an anti-aliasing filter and analyzer response calibration because this is handled by the instrument. Yet, it does not necessarily remove the calibration requirement since at least an external low-noise amplifier is still required.
There are some disadvantages of the proposed setup. An important limitation is the measurement bandwidth, which is in the microwave region, limited by the bandwidth of a variable phase shifter and in the baseband by the sampling frequency of 192 kHz of the sound card. The former could be overcome by employing another type of phase shifter. Commercial solutions that provide a bandwidth well beyond 10 GHz and phase shifts in excess of 360° are available. For smaller frequency offsets, a longer delay would be required. This can be elegantly solved with a controllable optical switch switching in different lengths of delay for different frequency offsets. The LEDs of the quadrature lock circuit used for visual notification can be used for automatic triggering of the measurement at the correct operation conditions.
Author Contributions
Conceptualization, A.L., B.B., and M.V.; methodology, A.L. and M.V.; software, A.L. and M.V.; validation, A.L., B.B., and M.V.; formal analysis, A.L. and M.V.; investigation, A.L. and M.V.; resources, A.L., B.B., and M.V.; data curation, A.L. and B.B.; writing—original draft preparation, A.L.; writing—review and editing, A.L., B.B., and M.V.; visualization, A.L.; supervision, B.B. and M.V.; project administration, B.B.; funding acquisition, B.B. All authors have read and agreed to the published version of the manuscript.
Funding
This work was supported by the Slovenian Research Agency under Grant J2-3048 and research core funding No. P2-0246.
Institutional Review Board Statement
Not applicable.
Informed Consent Statement
Not applicable.
Data Availability Statement
Not applicable.
Conflicts of Interest
The authors declare no conflict of interest. The funders had no role in the design of the study; in the collection, analyses, or interpretation of the data; in the writing of the manuscript; nor in the decision to publish the results.
Abbreviations
The following abbreviations are used in this manuscript:
| FFT | Fast Fourier transform |
| DUT | Device-under-test |
| OEO | Opto-electronic oscillator |
| LNA | Low-noise amplifier |
| LPF | Low-pass filter |
| PRBS | Pseudo-random bit sequence |
| MSA | Microwave spectrum analyzer |
| VPS | Variable phase shifter |
| EOM | Electro-optic modulator |
| PM | Phase modulation |
| VCXO | Voltage-controlled crystal oscillator |
| LED | Light-emitting diode |
| DFB | Distributed feedback |
| HEMT | High-electron-mobility transistor |
| FPLL | Fractional phase-locked loop |
| MMIC | Monolithic microwave integrated circuit |
References
- Leeson, D.B. A simple model of feedback oscillator noise spectrum. Proc. IEEE 1966, 54, 329–330. [Google Scholar] [CrossRef]
- Rubiola, E. Phase Noise and Frequency Stability in Oscillators; Cambridge University Press: Cambridge, UK, 2008. [Google Scholar]
- Rubiola, E.; Brendel, R. A generalization of the Leeson effect. arXiv 2010, arXiv:1004.5539.2010. [Google Scholar] [CrossRef]
- Vidmar, M. Extending Leeson’s Equation. Inf. MIDEM 2021, 51, 146. [Google Scholar] [CrossRef]
- Liu, A.; Dai, J.; Xu, K. Stable and Low-Spurs Optoelectronic Oscillators: A Review. Appl. Sci. 2018, 8, 2623. [Google Scholar] [CrossRef]
- Hong, F.L. Optical frequency standards for time and length applications. Meas. Sci. Technol. 2016, 28, 12002. [Google Scholar] [CrossRef]
- Zou, F.; Zou, L.; Yang, B.; Ma, Q.; Zou, X.; Zou, J.; Chen, S.; Milosevic, D.; Cao, Z.; Liu, H. Optoelectronic oscillator for 5G wireless networks and beyond. J. Phys. Appl. Phys. 2021, 54, 423002. [Google Scholar] [CrossRef]
- Rohde, U.L.; Poddar, A.K.; Apte, A.M. Getting Its Measure: Oscillator Phase Noise Measurement Techniques and Limitations. IEEE Microw. Mag. 2013, 14, 73–86. [Google Scholar] [CrossRef]
- Yao, X.S.; Maleki, L. Optoelectronic microwave oscillator. J. Opt. Soc. Am. B 1996, 13, 1725–1735. [Google Scholar] [CrossRef]
- Rubiola, E.; Salik, E.; Huang, S.; Yu, N.; Maleki, L. Photonic-delay technique for phase noise measurement of microwave oscillators. J. Opt. Soc. Am. B 2005, 22, 987–997. [Google Scholar] [CrossRef]
- Volyanskiy, K.; Cussey, J.; Tavernier, H.; Salzenstein, P.; Sauvage, G.; Larger, L.; Rubiola, E. Applications of the optical fiber to the generation and measurement of low-phase noise microwave signals. J. Opt. Soc. Am. B 2008, 25, 2140–2150. [Google Scholar] [CrossRef]
- Eliyahu, D.; Seidel, D.; Maleki, L. Phase noise of a high performance OEO and an ultra low noise floor cross-correlation microwave photonic homodyne system. In Proceedings of the 2008 IEEE International Frequency Control Symposium, Honolulu, HI, USA, 18–21 May 2008; pp. 811–814. [Google Scholar] [CrossRef]
- Salzenstein, P.; Pavlyuchenko, E.; Hmima, A.; Cholley, N.; Zarubin, M.; Galliou, S.; Chembo, Y.K.; Larger, L. Estimation of the uncertainty for a phase noise optoelectronic metrology system. Phys. Scr. 2012, T149, 14025. [Google Scholar] [CrossRef]
- Fan, Z.; Qiu, Q.; Su, J.; Zhang, T.; Lin, Y. Phase noise measurement of an optoelectronic oscillator based on the photonic-delay line cross-correlation method. Opt. Lett. 2019, 44, 1992–1995. [Google Scholar] [CrossRef]
- Zou, X.; Lu, B.; Pan, W.; Yan, L.; Stöhr, A.; Yao, J. Photonics for microwave measurements. Laser Photonics Rev. 2016, 10, 711–734. [Google Scholar] [CrossRef]
- Pan, S.; Yao, J. Photonics-Based Broadband Microwave Measurement. J. Light. Technol. 2017, 35, 3498–3513. [Google Scholar] [CrossRef]
- Zhu, D.; Zhang, F.; Zhou, P.; Zhu, D.; Pan, S. Wideband Phase Noise Measurement Using a Multifunctional Microwave Photonic Processor. IEEE Photonics Technol. Lett. 2014, 26, 2434–2437. [Google Scholar] [CrossRef]
- Zhu, D.; Zhang, F.; Zhou, P.; Pan, S. Phase noise measurement of wideband microwave sources based on a microwave photonic frequency down-converter. Opt. Lett. 2015, 40, 1326–1329. [Google Scholar] [CrossRef]
- Zhang, F.; Zhu, D.; Pan, S. Photonic-assisted wideband phase noise measurement of microwave signal sources. Electron. Lett. 2015, 51, 1272–1274. [Google Scholar] [CrossRef]
- Xie, Y.; Zhou, P.; Jiang, Z.; Zhou, Z.; Li, N. Wideband Microwave Phase Noise Analyzer Based on All-Optical Microwave Signal Processing. IEEE Photonics J. 2022, 14, 1–7. [Google Scholar] [CrossRef]
- Gheidi, H.; Banai, A. Phase-Noise Measurement of Microwave Oscillators Using Phase-Shifterless Delay-Line Discriminator. IEEE Trans. Microw. Theory Tech. 2010, 58, 468–477. [Google Scholar] [CrossRef]
- Shi, J.; Zhang, F.; Pan, S. Phase Noise Measurement of RF Signals by Photonic Time Delay and Digital Phase Demodulation. IEEE Trans. Microw. Theory Tech. 2018, 66, 4306–4315. [Google Scholar] [CrossRef]
- Zhang, F.; Shi, J.; Pan, S. Wideband microwave phase noise measurement based on photonic-assisted I/Q mixing and digital phase demodulation. Opt. Express 2017, 25, 22760–22768. [Google Scholar] [CrossRef]
- Shi, J.; Zhang, F.; Ben, D.; Pan, S. Wideband Microwave Phase Noise Analyzer Based on an All-Optical Microwave I/Q Mixer. J. Light. Technol. 2018, 36, 4319–4325. [Google Scholar] [CrossRef]
- Kuse, N.; Fermann, M. Electro-optic comb based real time ultra-high sensitivity phase noise measurement system for high frequency microwaves. Sci. Rep. 2017, 7, 2847. [Google Scholar] [CrossRef]
- Zhang, F.; Shi, J.; Zhang, Y.; Ben, D.; Sun, L.; Pan, S. Self-calibrating and high-sensitivity microwave phase noise analyzer applying an optical frequency comb generator and an optical-hybrid-based I/Q detector. Opt. Lett. 2018, 43, 5029–5032. [Google Scholar] [CrossRef]
- Wada, M.; Hong, F.L.; Inaba, H. Frequency noise measurement and its uncertainty estimation of an optical frequency comb using a delay line interferometer. Meas. Sci. Technol. 2020, 31, 125012. [Google Scholar] [CrossRef]
- Wang, X.; Yao, X.S.; Hao, P.; Feng, T.; Chen, X.; Chong, Y. Ultra-Low Phase Noise Measurement of Microwave Sources Using Carrier Suppression Enabled by a Photonic Delay Line. J. Light. Technol. 2021, 39, 7028–7039. [Google Scholar] [CrossRef]
- IEEE Standard Definitions of Physical Quantities for Fundamental Frequency and Time Metrology–Random Instabilities; IEEE: New York, NY, USA, 2009; pp. 1–50. [CrossRef]
- Riley, W.J. Handbook of Frequency Stability Analysis; National Institute of Standards and Technology, US Department of Commerce: Gaithersburg, MD, USA, 2008. [Google Scholar]
- Vidmar, M. Microstrip resonant phase shifters. Microw. J. Int. Ed. 1999, 42, 127–137. [Google Scholar]
- ElKhorassani, M.T.; Palomares-Caballero, A.; Alex-Amor, A.; Segura-Gómez, C.; Escobedo, P.; Valenzuela-Valdés, J.F.; Padilla, P. Electronically Controllable Phase Shifter with Progressive Impedance Transformation at K Band. Appl. Sci. 2019, 9, 5229. [Google Scholar] [CrossRef]
- Vidmar, M. Noise in radio/optical communications. In Proceedings of the 7th International Beam Instrumentation Conference (IBIC’18), Shanghai, China, 9–13 September 2018; Number 7 in International Beam Instrumentation Conference. JACoW Publishing: Geneva, Switzerland, 2019; pp. 1–5. [Google Scholar] [CrossRef]
- Lavrič, A.; Batagelj, B. An affordable laboratory photodiode up to 11.5 GHz for microwave photonics experiments. In Proceedings of the 2019 International Workshop on Fiber Optics in Access Networks (FOAN), Sarajevo, Bosnia and Herzegovina, 2–4 September 2019; pp. 47–50. [Google Scholar] [CrossRef]
- Eliyahu, D.; Seidel, D.; Maleki, L. RF Amplitude and Phase-Noise Reduction of an Optical Link and an Opto-Electronic Oscillator. IEEE Trans. Microw. Theory Tech. 2008, 56, 449–456. [Google Scholar] [CrossRef]
- Bogataj, L.; Vidmar, M.; Batagelj, B. A Feedback Control Loop for Frequency Stabilization in an Opto-Electronic Oscillator. J. Light. Technol. 2014, 32, 3690–3694. [Google Scholar] [CrossRef]
- Cho, J.H.; Jeong, H.S.; Sung, H.K. Spurious Tone Reduction and Signal Stabilization of Optoelectronic Oscillators by Low-Frequency RF Signal Modulation. Photonics 2022, 9, 339. [Google Scholar] [CrossRef]
- Salzenstein, P.; Pavlyuchenko, E. Uncertainty Evaluation on a 10.52 GHz (5 dBm) Optoelectronic Oscillator Phase Noise Performance. Micromachines 2021, 12, 474. [Google Scholar] [CrossRef] [PubMed]
- Hong, J.; Yin, L. Photonic-delay homodyne technology for low-phase noise measurement. Optik 2014, 125, 1868–1870. [Google Scholar] [CrossRef]
Publisher’s Note: MDPI stays neutral with regard to jurisdictional claims in published maps and institutional affiliations. |
© 2022 by the authors. Licensee MDPI, Basel, Switzerland. This article is an open access article distributed under the terms and conditions of the Creative Commons Attribution (CC BY) license (https://creativecommons.org/licenses/by/4.0/).