1. Introduction
Spectroscopic Reflectance (SR) is a simple and well-established methodology for accessing the thickness of transparent and semi-transparent films. It relies on inverting the reflectance signal using the Fresnel equations [
1,
2] and the known index of refraction of film and substrate. By employing SR, the thickness of films in a very wide thickness range, from 1 nm to more than 1 mm can be measured accurately and in a very short time [
3,
4] by employing well-calibrated and high optical resolution spectrometers. In addition, spectroscopic reflectance has been successfully employed in the measurement of the optical properties of transparent and semi-transparent films, such as real and imaginary parts of the refractive index and band gap [
5]. Besides thin-film metrology [
3], SR has also been demonstrated in sensing applications [
6,
7], whereby nanometer-scale changes in thickness due to the presence of an analyte can be easily monitored and recorded.
In the standard SR setup, the light from a light source is coupled to the illumination branch (6 fibers on a circle) of a reflection probe and illuminates at 90° the sample under characterization; the specular reflectance is collected by the receiving fiber of the reflection probe. Successful application of SR requires the thin film and substrate to have flat surfaces. For non-uniform films, the spot size, i.e., the area from which the specular signal is collected, should be quite small to exclude the macroscale roughness effect and allow for discrimination of the interference fringes. In those cases, the optical set-up is built around a microscope and the spot size is mainly defined by the magnification of the objective lens. When this is not the case, e.g., in the case of nanoscale roughness, additional film layers are required in order to model the rough thin film [
8]. In the simplest approximation, an extra “roughness” layer is assumed on top of the thin film. Its refractive index is usually modelled by Maxwell–Garnett (MG) [
9] or Bruggeman (BR) [
10] Effective Medium Theories (EMT) assuming a volume mixture of the thin film material and air. The thickness and refractive index of the roughness layer follow from the average roughness (top-to-bottom) height and the volume coverage of the thin film material, both of which now become free parameters for fitting the SR signal. In more elaborated schemes, the roughness layer is discretized into several thinner slices, each having a different volume coverage depending on its vertical position and the actual roughness shape [
8]. A Fresnel layout considering the effective multilayer system can now be easily solved. Nevertheless, we will show that using a static (i.e., with the same fixed depolarization factor [
11]) EMT model in all cases [
12] does not yield an optimal description, and thus the post-processing of the SR spectra will not lead to a quantitative evaluation of the film surface quality.
However, it turns out that even an EMT that varies according to the volume coverage (i.e., non-static) is not enough to represent all the roughness details, such as different aspect ratios, shapes, etc. In fact, different roughness shapes set different geometrical overlaps between successive slices, and thus slightly different light interactions, pointing towards a nonlocal effective medium model. That is, the effective medium of a slice depends not only on the microstructure of the slice itself (local model) but also on the microstructure of the neighboring (top and bottom) slices. Here, we present such a nonlocal and non-static effective medium (NLEM) model, extracted with the aid of rigorous numerical simulations, and parametrized within the context of traditional EMTs. We show that the model results in a remarkably good description of roughness (RMS and shape) effects in the reflectance spectrum. For simplicity, we assume non-dispersive non-absorbing materials and create a unified NLEM model that covers a range of film indices and roughness sizes and shapes.
The model parametrization and its relevant parameters are tabulated and ready to use, which may offer added value in roughness characterization to SR systems. The developed methodology can be used on-the-fly during numerical fitting of SR data without significant effect on the time-to-result calculation time. At the same time, however, by using the NLEM model, we find the existence of groups of roughness geometries that are optically similar (i.e., they produce the same reflectance spectrum), which precludes the simultaneous determination of both roughness height and roughness shape by a single reflectance measurement. As a result, prior knowledge of either the surface morphology or roughness height is needed to uniquely determine the roughness geometry. This is not a weakness of the NLEM model but an inherent property of nanoroughness in the reflection spectra.
2. Methodology and Results
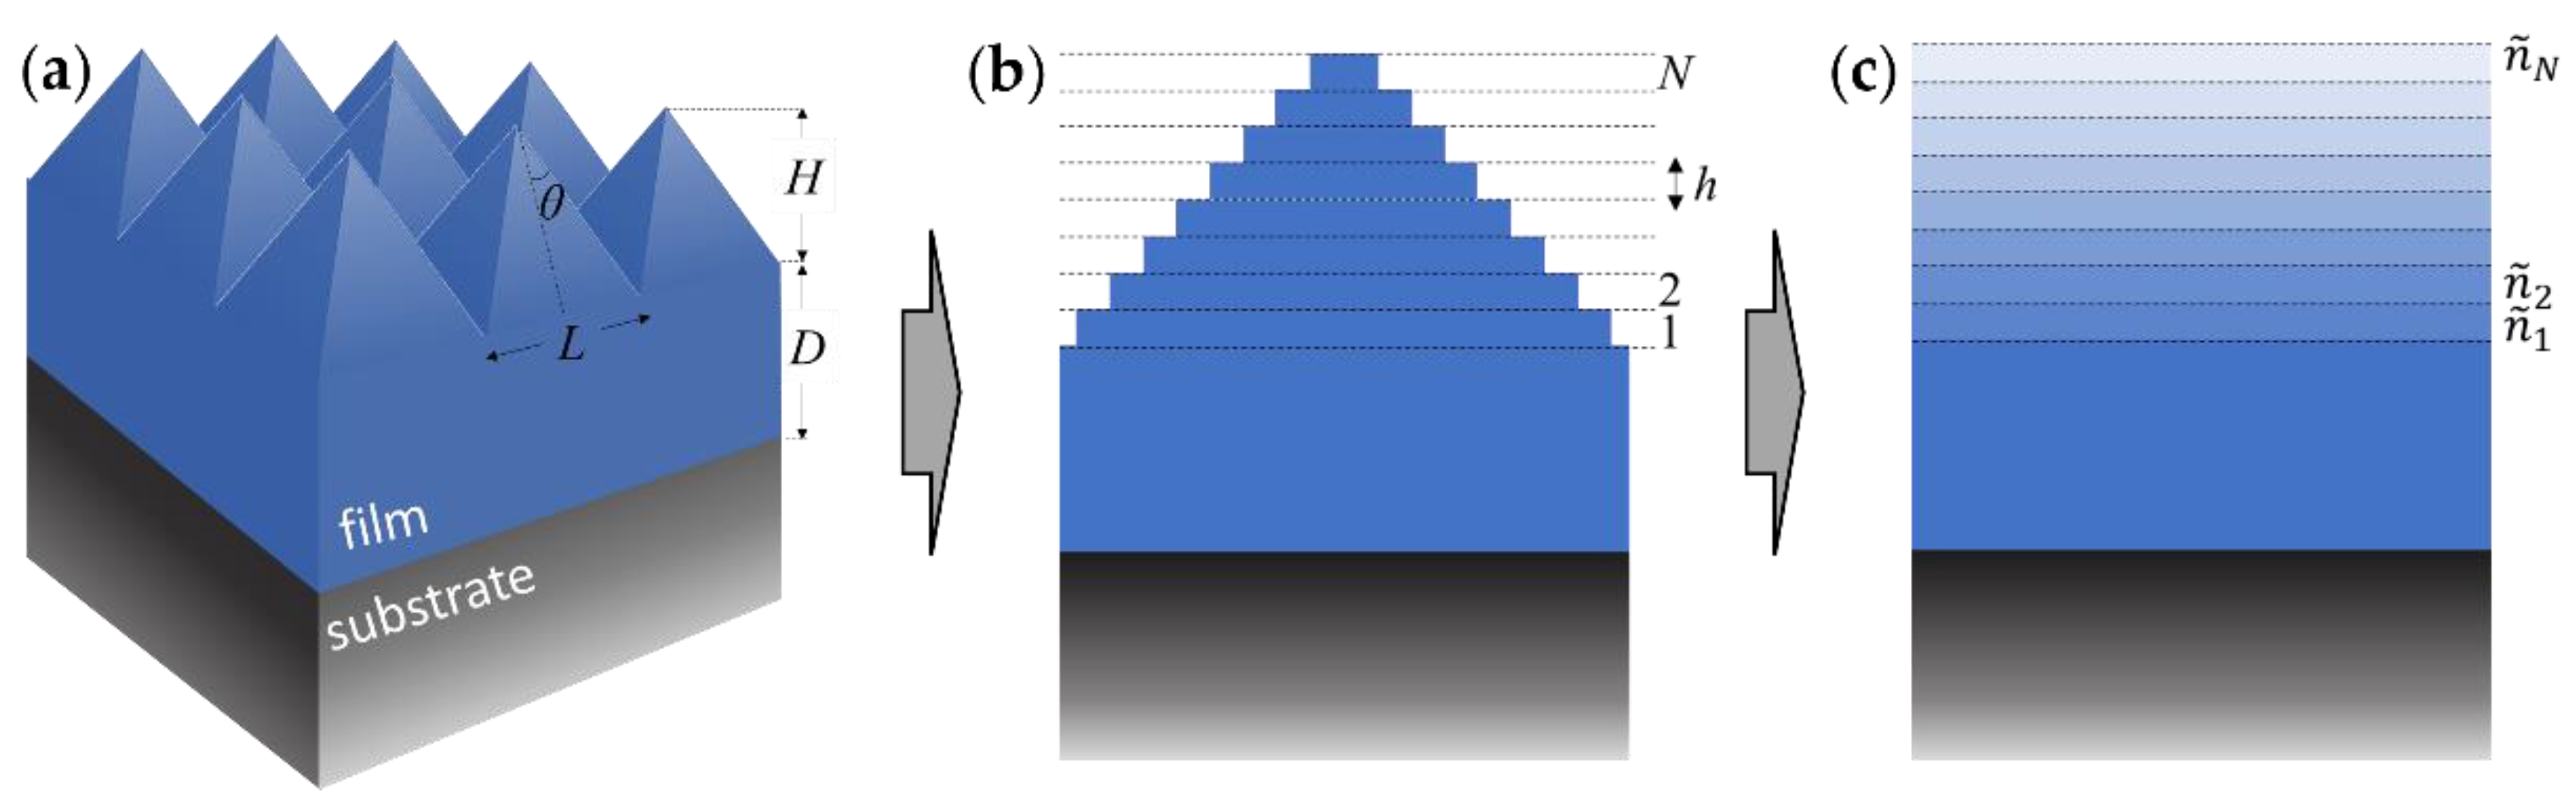
In its simplest embodiment, thin film roughness can be modelled as a periodic square array of linear square-based pyramids, as depicted in
Figure 1a. Note that diffuse scattering and/or diffraction are completely suppressed in our system because we assume the roughness as a periodic array of identical scatterers arranged at a subwavelength periodicity (i.e., below the diffraction limit
where
is the maximum refractive index and
Φ is the diffraction angle). While this is not realistic in the case of a rough film (where diffuse scattering is always present), it allows us to develop our model with well-controlled simulation data. The chosen pyramid period
is fixed (without loss of generality) to a subwavelength value
nm (a tenth of the smallest wavelength typically used in RS), with the half-angle
defined by the roughness height
as
.
Thus,
is much smaller than the wavelength range considered (300–1200 nm) ensuring the validity of an effective medium approach. The bulk film underneath has thickness
, which in turn is on top of the substrate. In a SR set-up, light is incident normally from the top (i.e., from the air) and due to the absence of diffraction (subwavelength surface features), it is partially reflected vertically and partially transmitted through the substrate. For simplicity, we will assume the refractive index of the film and substrate to be constant (non-dispersive) and real (transparent). The theoretical reflection spectra, on top of which we will develop our NLEM model, are obtained using the finite-difference time-domain (FDTD) method [
13] (using the Lumerical FDTD solver).
To create the NLEM model we split the pyramid into
thin slices, as depicted in
Figure 1b. The slice thickness
(where
is the pyramid thickness and N the number of slices) needs to be small enough to ensure a good description of fine pyramidal shapes and to avoid staircasing artifacts. We use
. The effective refractive index
of each slice is calculated via the FDTD method using representative cells [
8], allowing the construction of an effective 1D stratified model shown in
Figure 1c, which can then be straightforwardly solved by the Transfer Matrix Method (TMM) [
14]. For N material layers, the final transfer matrix
is defined as the reverse order product:
where
is the interface matrix between two material layers
and
with corresponding refractive indices
and
(
for air), defined as
and
is the propagation matrix for the material
where
is the wavevector and
is the thickness of the material. According to the Fresnel equations the reflectance is calculated as
.
This approach was first shown in [
8], where Aspnes et al. split the roughness layer into sublayers and developed the corresponding effective medium models. This method has also been used in analyzing spectroscopic ellipsometry measurements [
15,
16,
17,
18] of rough surfaces. However, in all cases, the EMT was static, without the flexibility to be adjusted to different shapes and slopes.
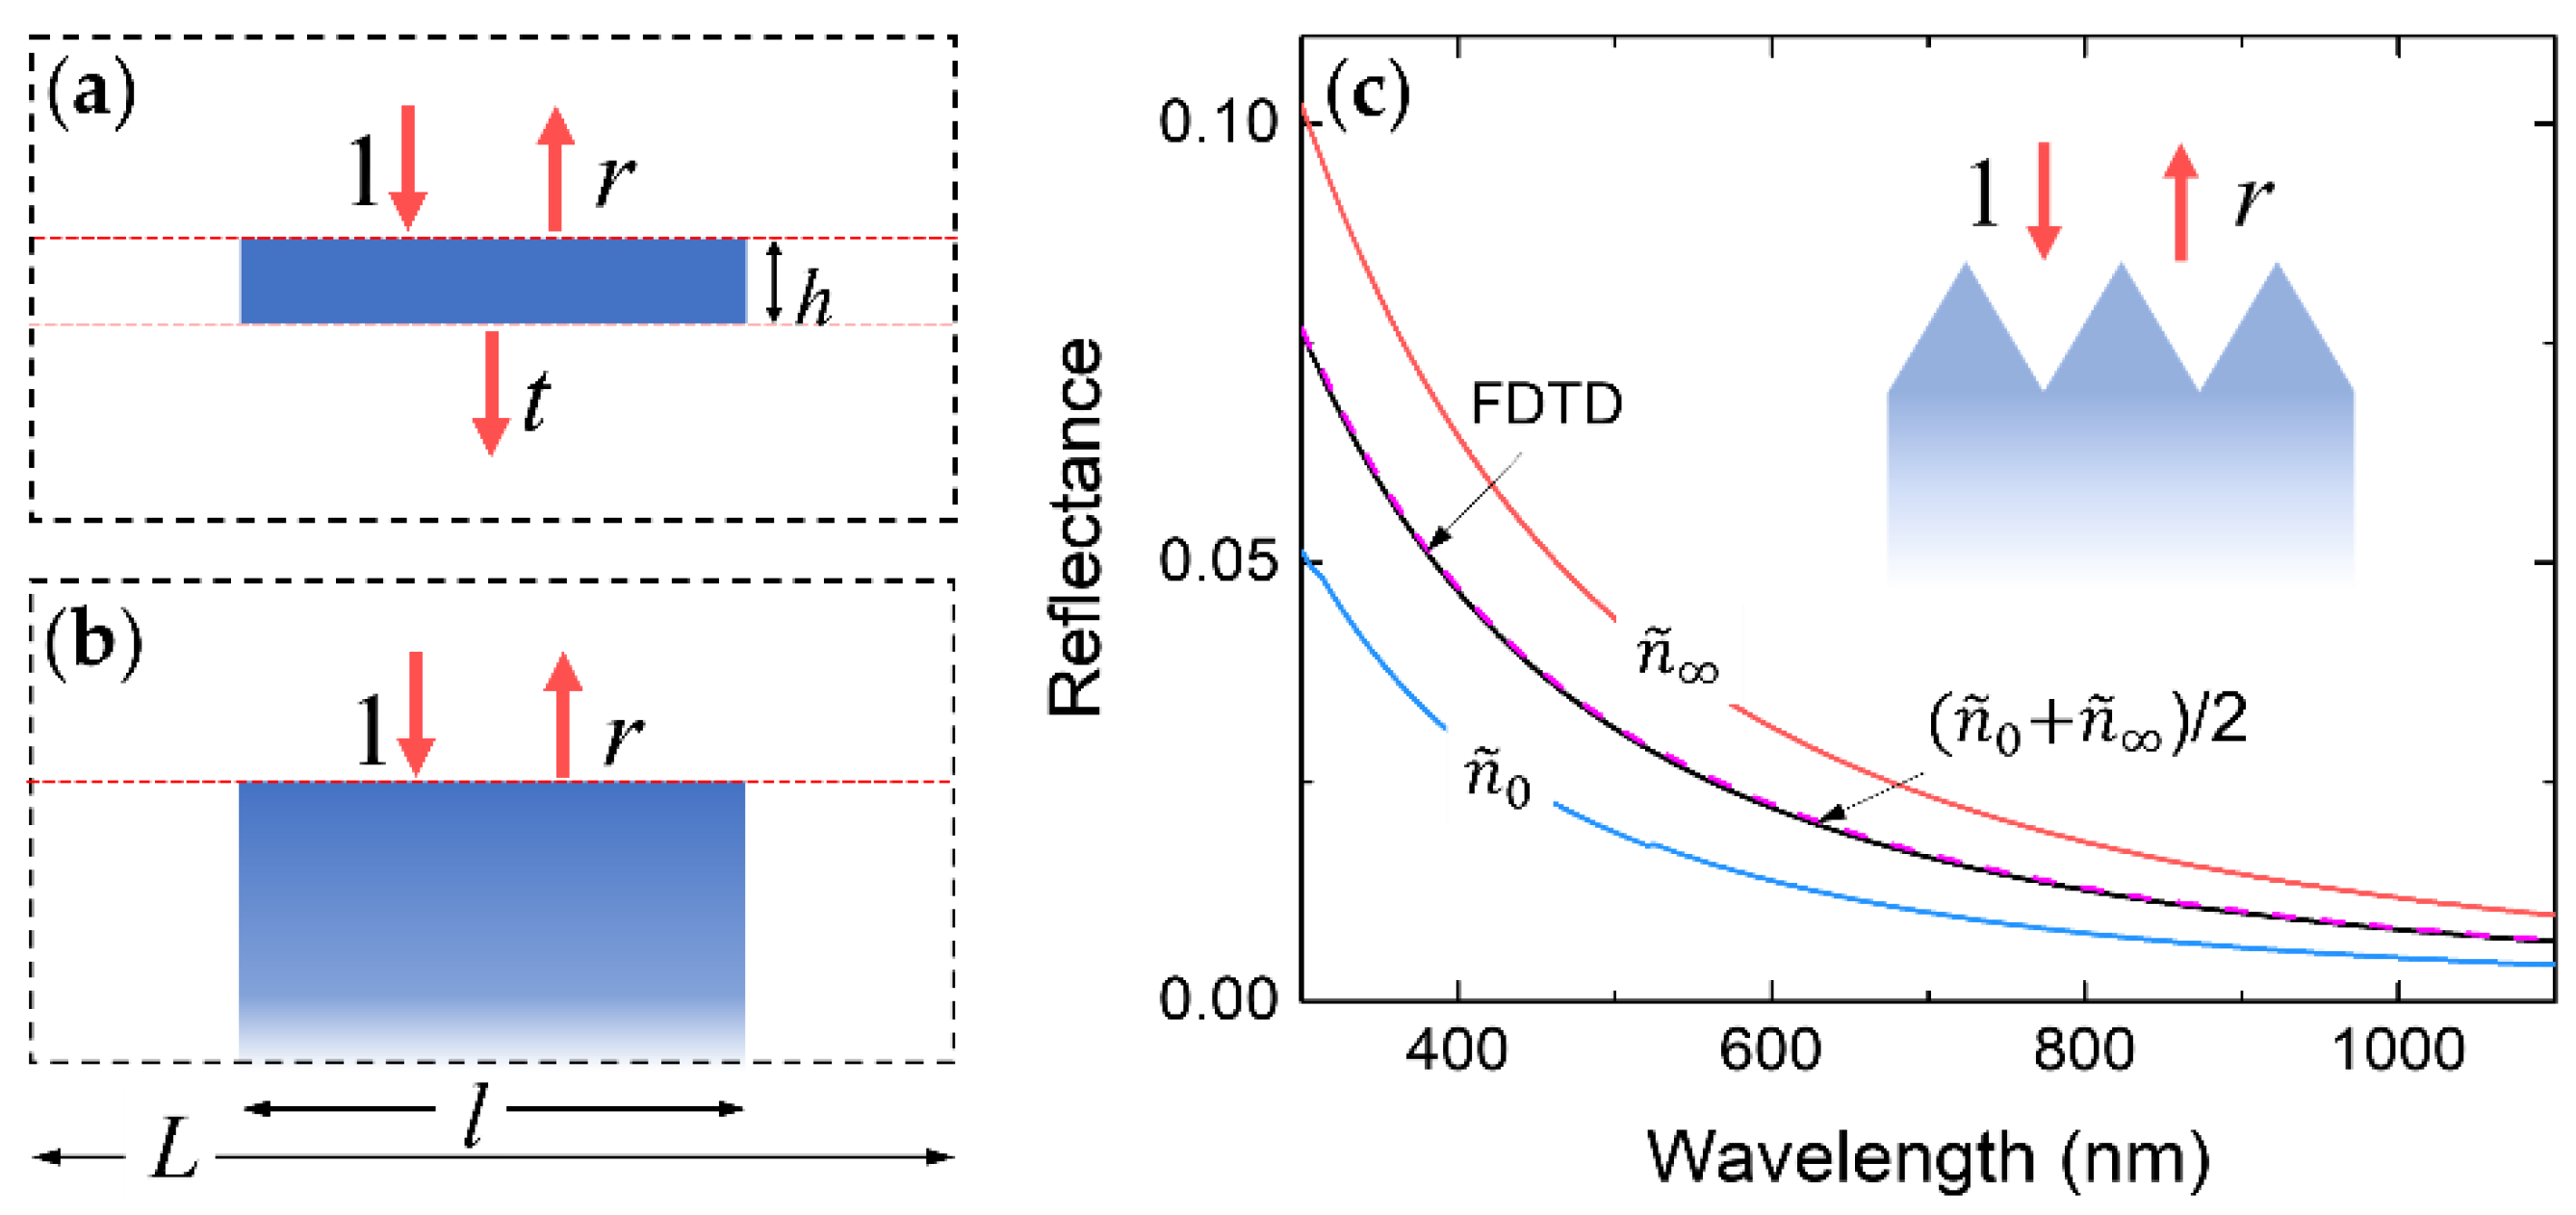
We use explicit FDTD simulations to extract an effective refractive index [
19]. We distinguish two main representations of a slice cross-section, as shown in
Figure 2: (a) the infinitesimal thickness case with a slice of thickness
suspended in a vacuum, and (b) the semi-infinite thickness case, where only the top surface is probed, and multiple reflections are absent. The reason we need both representations is that case (a) alone is inadequate to properly describe columnar (high slope) roughness. We will show that the correct effective index is of the form
where
,
are the wavelength-dependent effective indices for the thin slice (case a) and semi-infinite (case b) respectively, and
is a weight factor.
will be shown to depend on the actual refractive index of the film material, on the relative volume fraction of the material in air, and on the slope of the pyramid walls.
In case (a), each slice
(starting from the bottom) of the pyramid is treated as a square area of thickness
and side length
embedded in air, where
is the slice index. In our linear pyramid,
. The embedding air box (red dashed lines in
Figure 2a) has the same thickness
and side length
L. To get the effective medium of this composite (slice in embedding air box) we perform FDTD simulation of a plane wave at normal incidence (
Figure 2a) and record the complex reflection and transmition amplitudes
and
respectively, at the embedding box top and bottom surfaces. Then, the effective refractive index
(λ) is calculated from the relation [
19]:
In case (b), the complex reflection amplitude
of the semi-infinite column (i.e., the bottom of the column enters into the PML boundaries [
20,
21]) is simulated by FDTD. For non-magnetic materials, the effective refractive index
is extracted from the relation [
19]:
As the first test of our hypothesis of two different effective index extremes, we plot in
Figure 2c the reflectance of a semi-infinite SiO
2 substrate with roughness modelled by pyramids of
, along with three effective refractive indices obtained by using
,
and (
)/2. A remarkable agreement is achieved with the average index, which validates our approach of combining the two extreme cases.
The above effective refractive indices were then calculated as a function of side length
for four film refractive indices:
(e.g., SiO
2),
(e.g., Si
3N
4),
(e.g., TiO
2), and
(e.g., Si). The aim of the NLEM model is to be used on-the-fly during the numerical fitting of SR data. Thus, the FDTD-extracted effective indices need to be properly parametrized by an analytical formula. To this end we adopt the MG model [
9]:
where
is the effective dielectric function
,
is the dielectric function of the film material, the host is assumed to be air,
is the surface filling factor, and
is the MG depolarization factor. The choice of the Maxwell–Garnett model over Bruggeman model is mainly motivated by its algebraic simplicity, i.e., it is first order in the effective dielectric constant, compared to second order for the latter. Here, instead of using one fixed value for
, we treat it as an adjustable parameter to ensure the best possible fit of Equation 7 to the FDTD effective index.
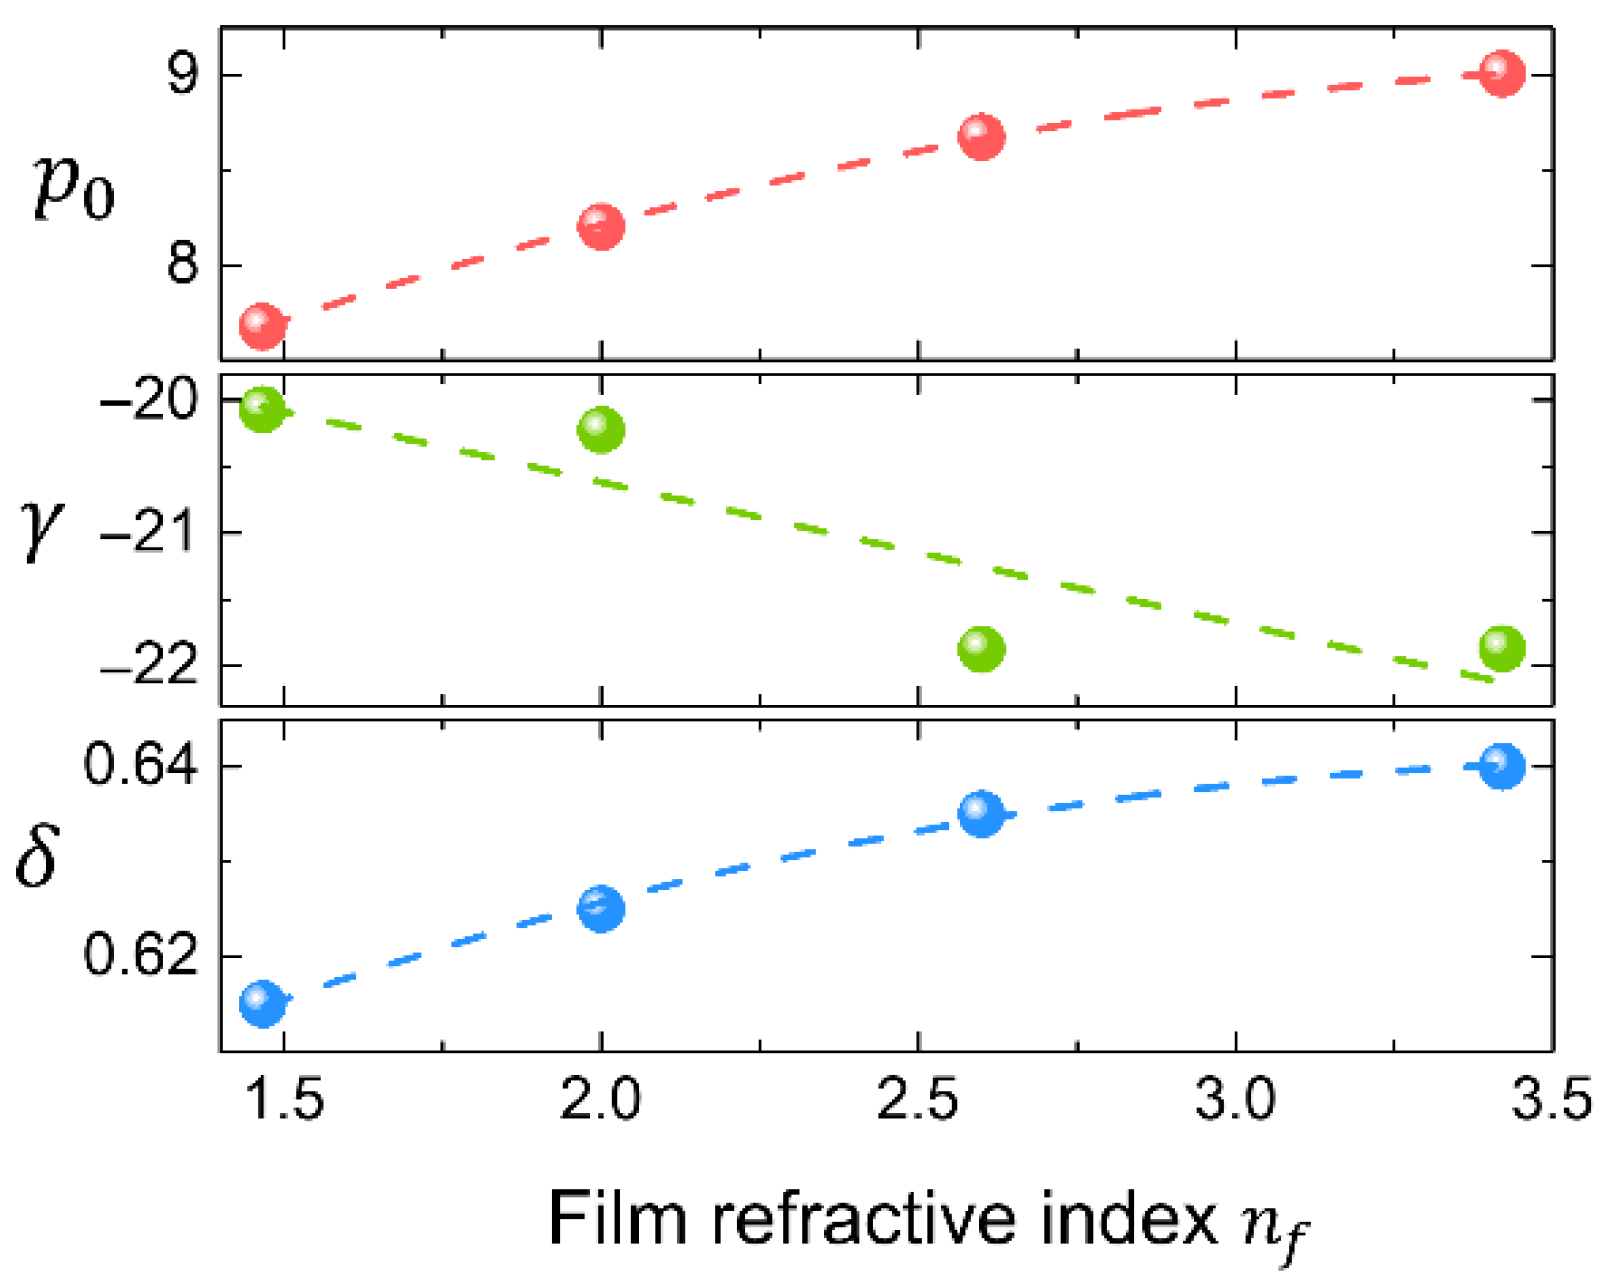
We use the filling factor
as the independent variable, and find that the slice (case a) FDTD effective index is best reproduced by Equation (7) when the depolarization factor
follows the parametrization:
where
and
,
, and
are adjustable parameters, which depend on the film refractive index
. To augment the NLEM model so that it describes all refractive indices, we repeat the above process for all modelled film indices and extract the index dependent parameters, as shown in
Figure 3. These are parametrized as
where
stands for any of the three adjustable parameters
,
, and
. The corresponding values of the expansion coefficients are shown in
Table 1. For the semi-infinite column (case b), on the other hand, we find that the best value of the depolarization factor
is always approximately equal to
, irrespective of
and
.
Having parametrized
and
through their MG representation, the next step is to find the proper weighting factors
. These will depend on the pyramid shape, i.e., if it is closer to a rod shape (small half-angle
) or not. To this end, we fit the NLEM model to FDTD simulations of the full pyramids of various half-angles
, using
as a free parameter. This procedure works well if there are multiple reflections involved (i.e., spectrally dense interference fringes), so we adopt a simulation system involving a thin film on top of a substrate, as depicted in
Figure 1a. We will simulate the layouts SiO
2/Si, SiN/Si, TiO
2/Si, and Si/SiO
2.
The error function used to fit the simulated reflectance is
where the reflectance
. The sum runs over all modelled wavelengths (300–1200 nm nm spectral range with wavelength step of 1 nm),
is the numerically obtained reflectance, and
the NLEM reflectance using
slices in a TMM to describe the pyramids. The simulated
values ranged from
to
, while the periodicity is kept fixed at
. The bulk film thickness is in all cases fixed at
. The weight
is optimized to minimize
for each different
and each different film index
.
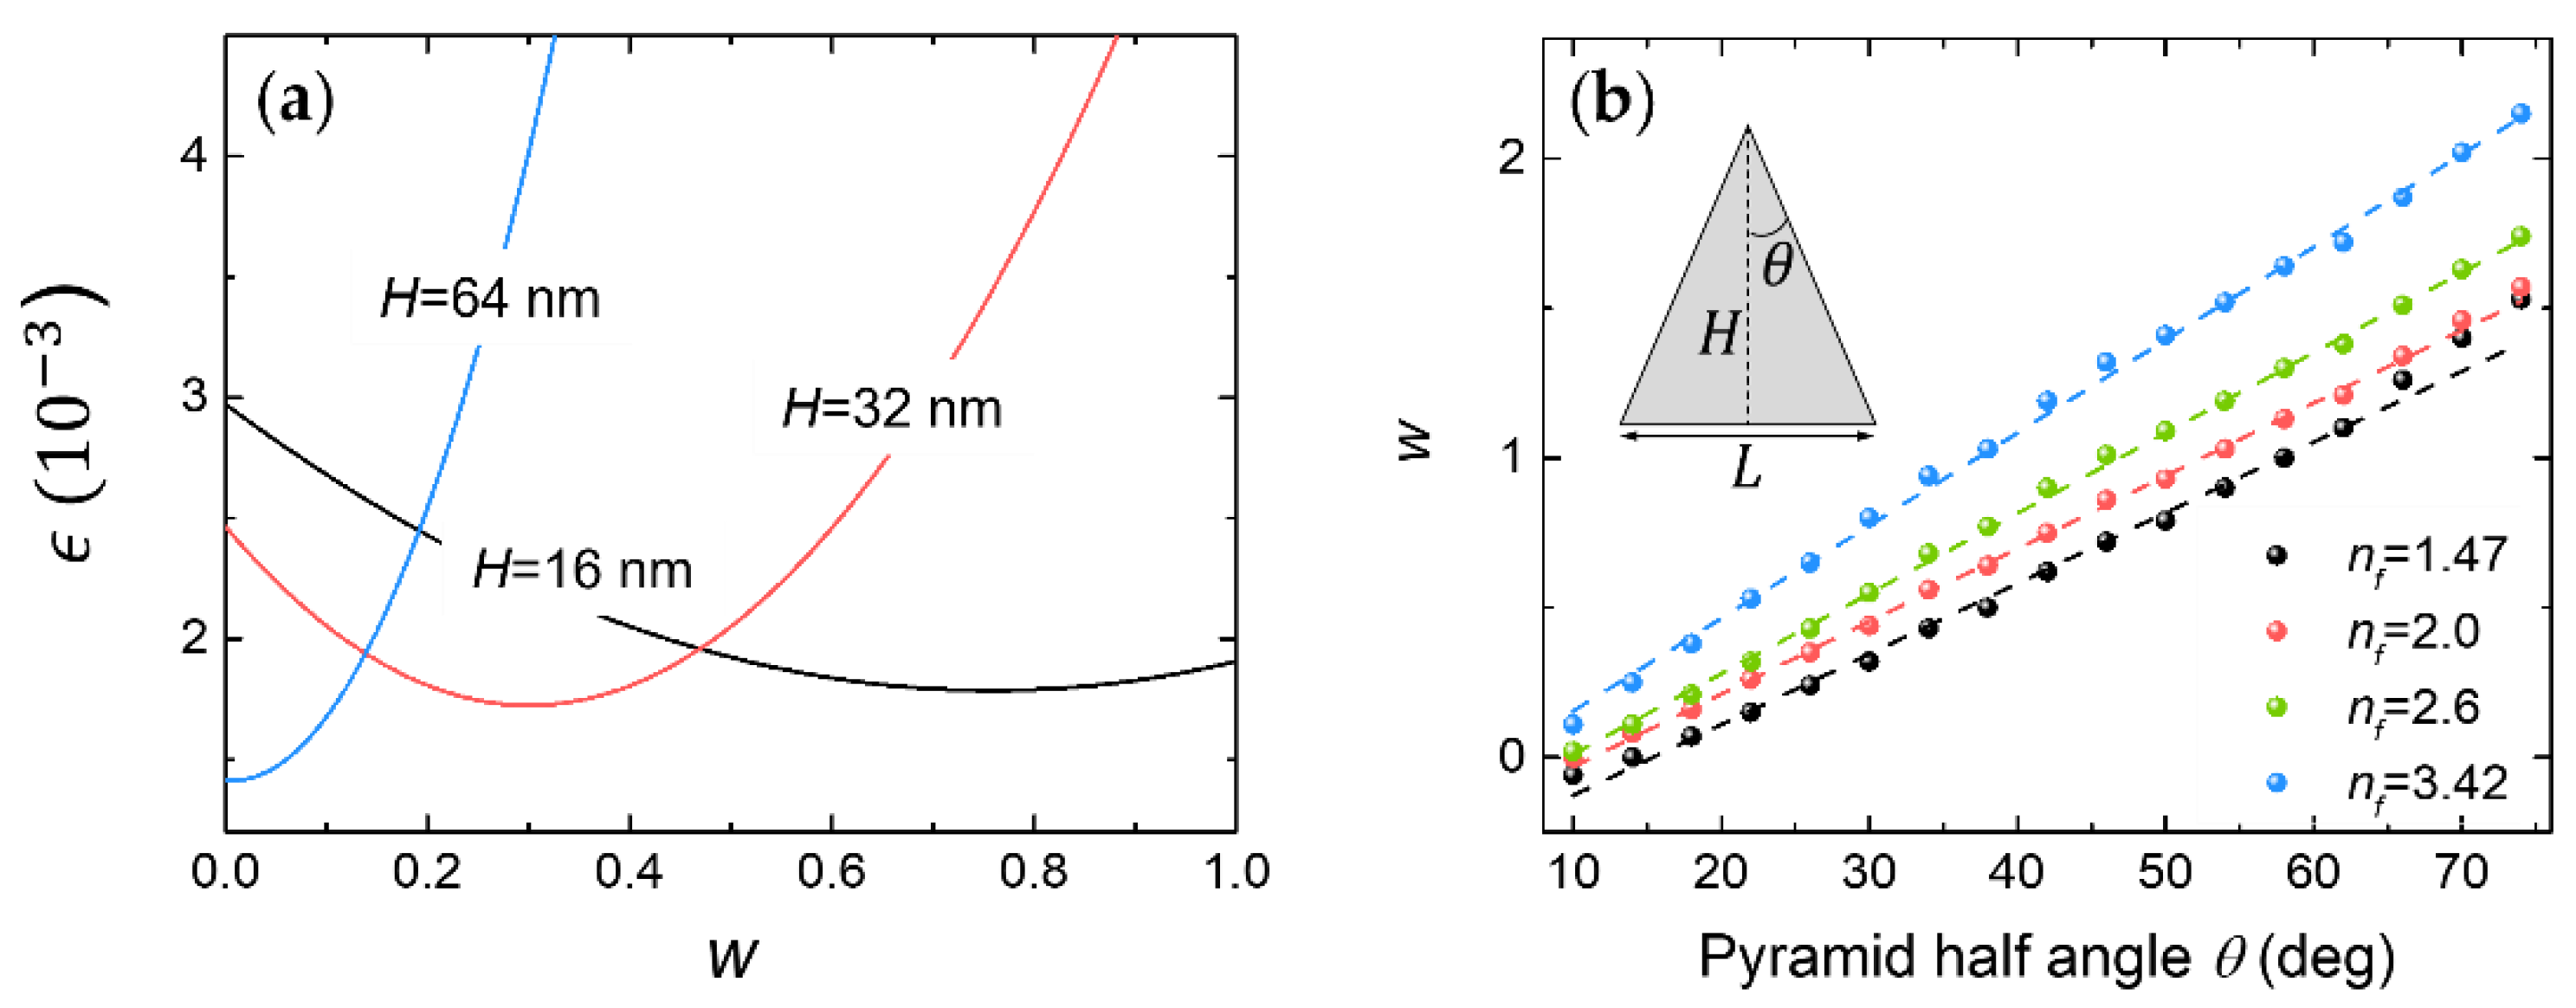
The result of this optimization for the SiO
2/Si system and three values of
is shown in
Figure 4a. A different value of
produces the minimum error between the FDTD and NLEM reflectance for different
values. Specifically,
(maximal weight for
) is needed for the larger
(tall columnar-like roughness) and
(maximal weight for
) is needed for the smaller
(short wide-angle roughness). This finding aligns well with our intuition regarding shape-dependent behavior. Thus, it calls for a nonlocal approach, which we will develop by parametrization, using the basis of the two distinct topological representations (
and
) for the effective medium.
Specifically, we proceed with repeating this exercise for all four material systems and present in
Figure 4b the scaling of the weight
with the pyramid half-angle
(see
Figure 4b inset). Remarkably, a simplelinear scaling law is found, which is nicely parametrized by
where the constants
,
are linear functions of film’s refractive index
, with the coefficients
,
given in
Table 1. It is interesting that we may find values of
for the large angles (flat pyramids) and
for the very small angles (spike-like pyramids). This points to the fact that our
and
do not represent the two extreme limits of the effective medium. This is particularly true for
(large angle limit, where
w > 1) and could be expected:
is calculated for a thin slice suspended in air, while in reality the film is sandwiched between two other films. For simplicity, rather than exploring a redefinition of what the
extreme should stand for and how it should be calculated, we acknowledge that our extrapolation with the extended
values does allow NLEM to provide an excellent representation of the nonlocal effective medium, and thus continue with this formulation.
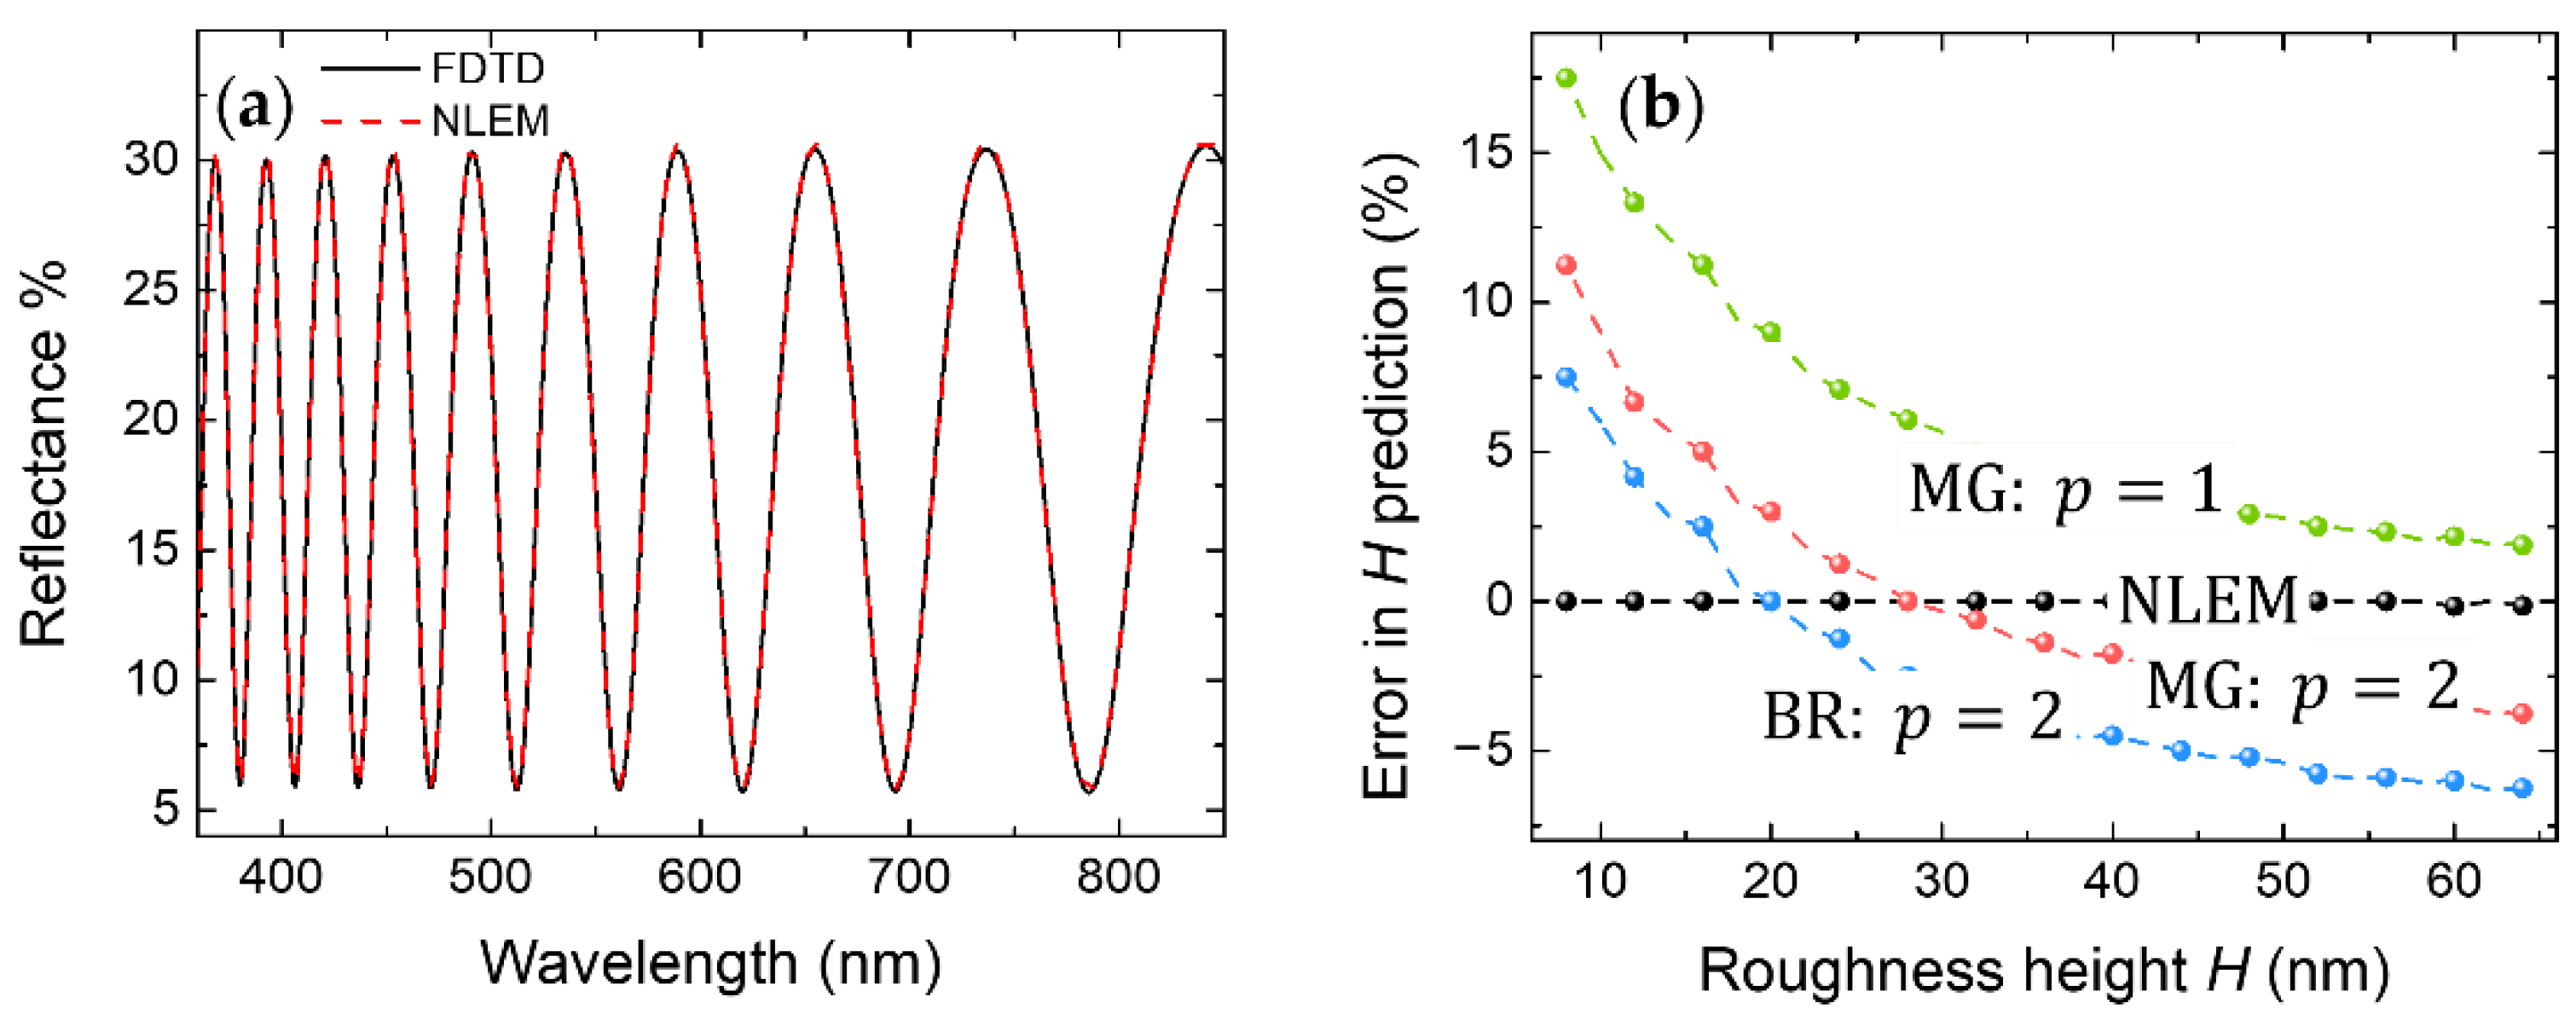
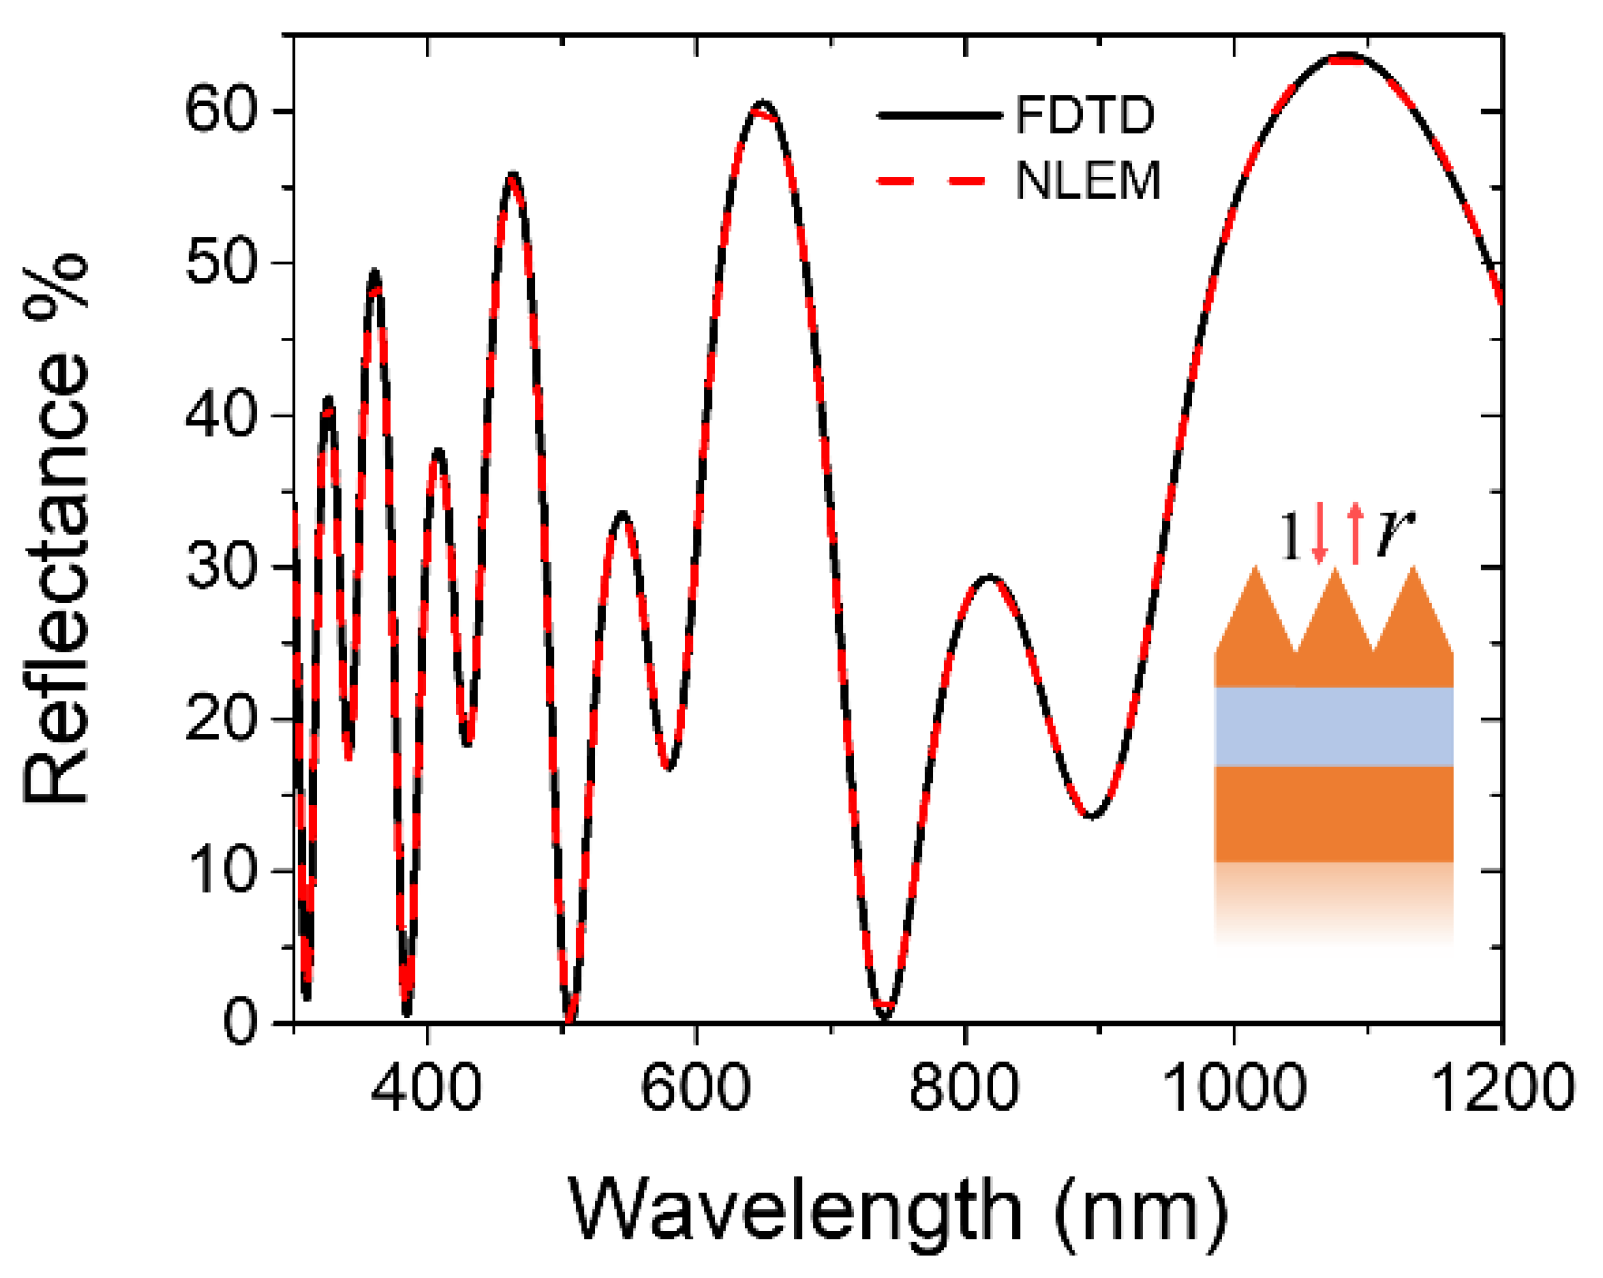
The quantitative accuracy of NLEM is shown in
Figure 5a, where we plot
and
(using
discretization for the film roughness) in the SiO
2/Si case for
. The
displays a remarkably accurate reproduction of
. This NLEM accuracy also ensures a strong predictive capability. We demonstrate this in
Figure 5b, where the
spectra from a series of FDTD run with different
values are used as the “measured” signal, and optimization runs of various models (NLEM vs. other EMT models, all at
discretization) try to fit
by using
as the free parameter. The relative error in the predicted
value is shown in
Figure 5b as a function of the real
value used in the FDTD simulation. It is impressive that the NLEM error is close to zero for all
values (i.e., accurate prediction of
), while it smoothly varies between overestimation and underestimation for the other EMTs, crossing at some
H value the zero-error line. The latter means that there is always one specific height
H for each EMT where it will make a correct prediction, but as evident from
Figure 5b, this is accidental. This is clear proof that the effective medium of each slice does not depend on its geometrical features only, but on the overall slope it creates with its neighbors, i.e., it is nonlocal.
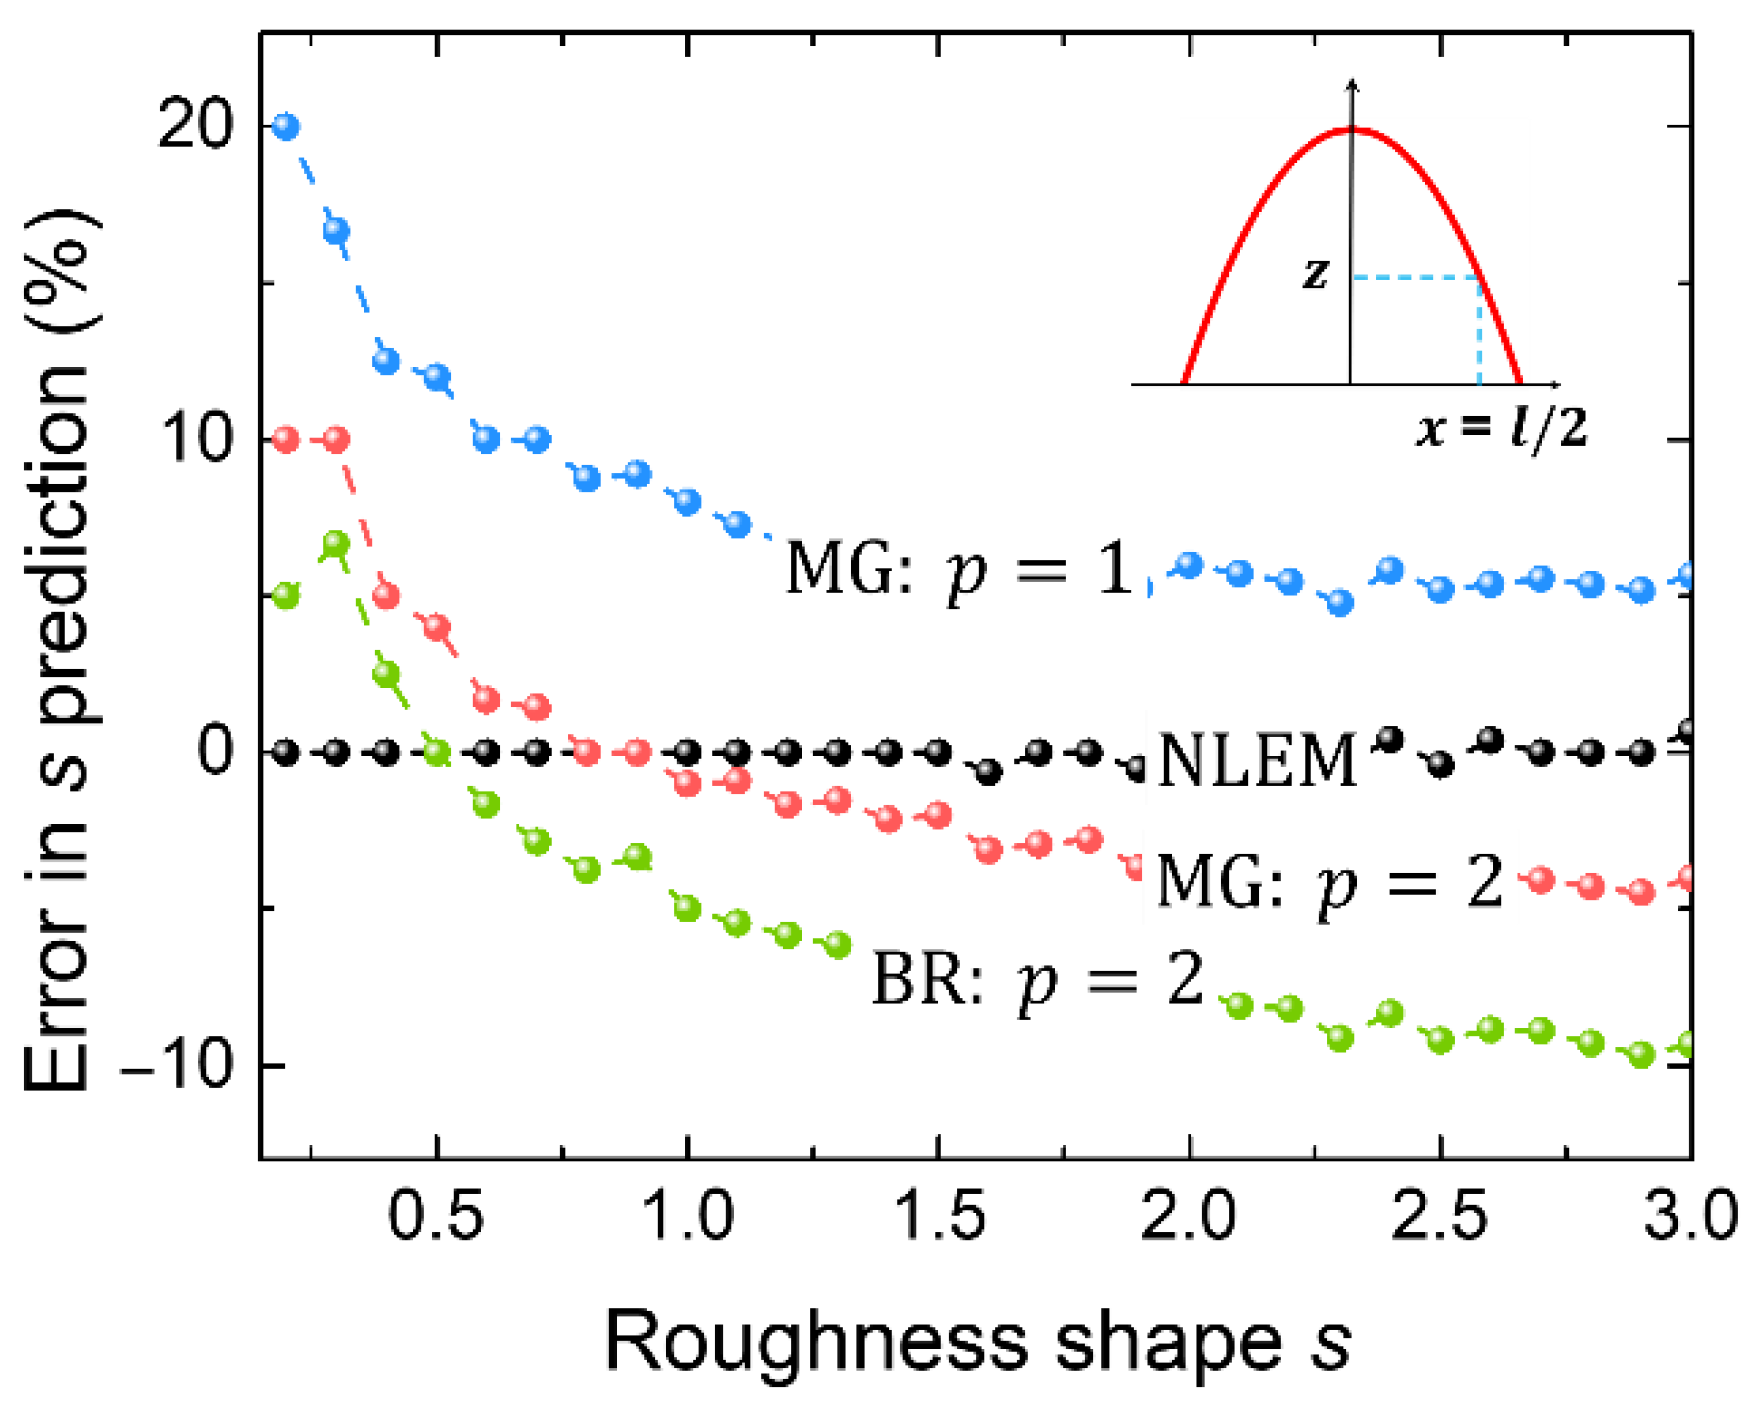
We now put the NLEM model to the test by simulating different roughness shapes modelled by square-based pyramids. We parametrize the pyramid sidewalls by the exponent
:
where
is the side-wall height at lateral position
(see inset of
Figure 6), where
is the local width. Equation (12) satisfies
at
and
at
, while for
it falls back to the linear pyramid studied above. By inverting Equation (12), we solve for the width
l (and thus the surface coverage
) of a slice at vertical position
z. The surface coverage for slice
(starting from the bottom) is then
.
We assume a fixed pyramid height of
and vary the shape factor
s between 0.2 and 3. The FDTD simulated reflectance is then fitted by the NLEM model with
s being the free parameter. The percentage error in
s prediction is shown in
Figure 6 as a function of the actual
s value. For comparison, the prediction errors of the other EMTs are also shown. Similarly, with the linear pyramids studied above, the NLEM error is close to zero for all
values (i.e., accurate prediction of pyramid shape), while other EMTs smoothly vary between overestimation and underestimation.
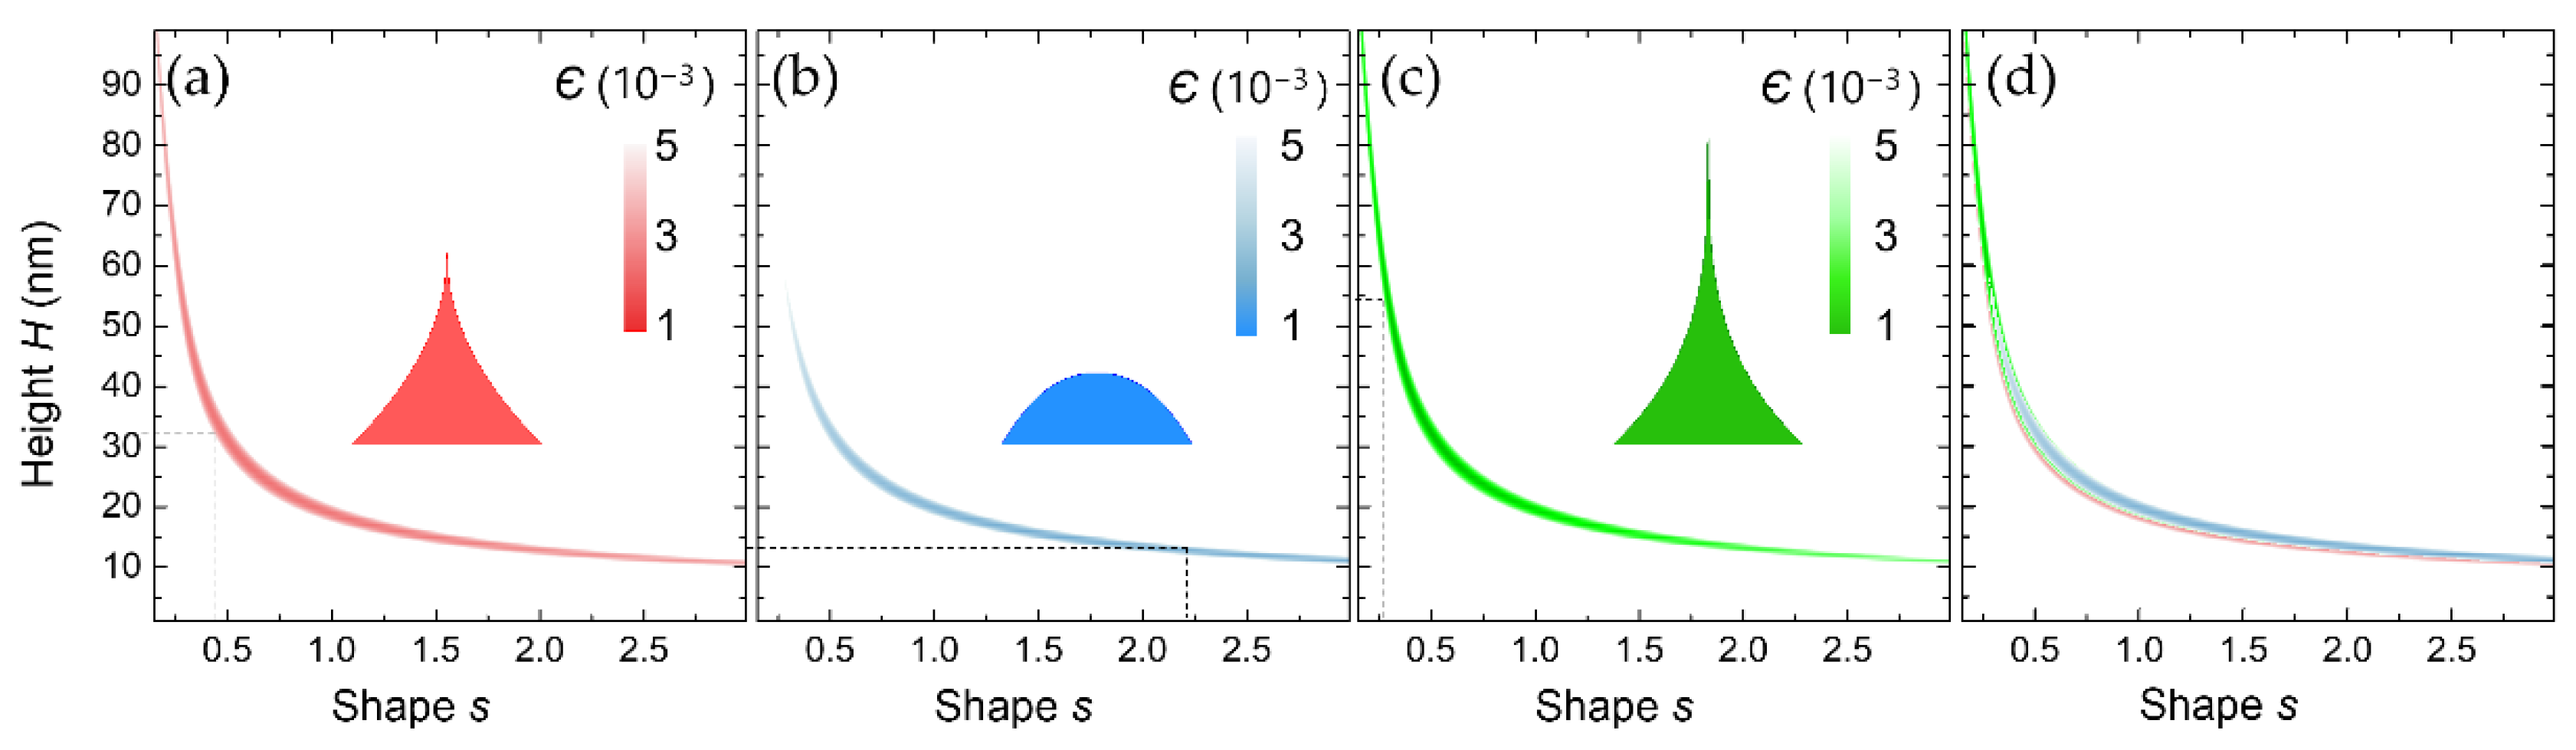
The final test of our model is on its predictive capability when both roughness height
and shape
are treated simultaneously as free parameters. For this, we use the
for
,
(see inset of
Figure 7a) and color-code the NLEM error function (Equation (10)) as a function of
and
in
Figure 7a. A unique solution (i.e., with an error significantly different than that of any other
H,
s combination), is not found. Instead, a continuous thin band emerges of possible
,
combinations (of practically the same minimum error), which include the correct
,
values. All these combinations yield the same error to
and thus are characterized by the same exact reflectance. That is, they correspond to different roughness geometries that produce the same exact optical effect and are thus indistinguishable based on their optical response, i.e., they correspond to optically similar roughness. To confirm this, we pick two points from the two extremes,
,
and
,
and plot in
Figure 7b,c respectively, the color-coded error in fitting the corresponding
. The roughness shapes are shown in the figure insets. For clarity, we use a different color-code scheme. For each case, a continuous thin band is predicted, which includes the simulated
,
.
In
Figure 7d, the 3 error functions are overlayed, showing that they are on top of each other. All three
spectra are practically identical. This band, thus, traces between different height–shape combinations (i.e., different geometries, as shown in the insets of
Figure 7) that nevertheless produce the same reflectance spectrum, i.e., it traces between optically similar roughness geometries. This is a real, inherent, property of rough surfaces, predicted by the NLEM model and validated by the FDTD calculations. While this precludes the simultaneous and unique determination of both
and
by a reflection spectrum, it does highlight our NLEM as a unique analytical tool in exploring subtle effects coming from variations in the roughness characteristics. No other EMT, to our knowledge, can reliably explore and identify optical similarity in roughness. NLEM eliminates the need for heavy numerical simulations for roughness. It may thus evolve into an important supplement for spectroscopic reflectance, with its usefulness being maximal when roughness variations across the wafer are small and sources of noise and errors in the measurements are low.


