Abstract
A noise elimination method based on an improved particle swarm algorithm is applied to direct absorption spectroscopy. The algorithm combines the theory of spectral line shape to calculate a fitness function according to the original spectra. Comparing the particles and the fitness function to calculate the updating direction, and position of particles, the iterative update finally finds the optimal solution. The algorithm is applied to direct absorption spectroscopy to measure methane; compared with the signal without algorithm processing, the signal-to-noise ratio (SNR) is improved by 4.17 times, and the minimum detection limit in the experiment is 15.3 ppb. R2 = 0.9999 is calculated in the calibration experiment, and the error is less than 0.1 ppm in the repeatability experiment of constant methane at 2 ppm concentration.
1. Introduction
Infrared detection technology has been widely used in the field of gas detection. The methods for gas detection include tunable diode laser absorption spectroscopy [1], photoacoustic spectroscopy [2], cavity-enhanced absorption spectroscopy [3], and cavity ring-down spectroscopy [4]. Among these, the application of tunable diode laser absorption spectroscopy has relatively matured in the field of trace gas detection. The tunable diode laser absorption spectroscopy includes direct absorption spectroscopy [5] and wavelength modulation spectroscopy [6].
The wavelength modulation spectroscopy can reduce the background noise influence on measurement accuracy by superimposing a high-frequency signal [7]. However, the system cost of wavelength modulation spectroscopy is higher, and the peak of the absorption spectrum is easily affected by modulated signal, which reduces the system sensitivity [8], especially in high modulating value conditions. In contrast, direct absorption spectroscopy can work effectively at a low cost but has the downside of a relatively simple back-end processing system [9], and the absorption spectroscopy signal is influenced by the interference fringe. Therefore, to measure trace gas concentration, a software algorithm is applied to direct absorption spectroscopy that can increase the accuracy and stability of the system.
The software algorithm shows a lower cost and better ability to debug than complicated hardware circuits and is widely used in the field of digital signal processing [10]. The averaging algorithm is widely used in the field of real-time signal processing [11]. P.Werle investigated an average algorithm on multi periodic signals to eliminate the system noise [12]. The average algorithm is simple and easy to use and effective for eliminating white noise but needs large sample data and much time to support the algorithm, and the denoising ability of the average algorithm has not good with small amounts of data. The idea of using wavelet transform is to decompose a signal into high-frequency components and low-frequency components, and then eliminate the high-frequency noise [13]. Work by Li et al. detailed that the use of wavelet transform for detecting carbon dioxide concentration could improve the signal-to-noise ratio (SNR) and eliminate the interference fringe [14], however, there exist some limitations on the decomposition level and difficulty of debugging. The main strength of wavelet transform is that it can identify sudden noise and extract useful signals. However, the wavelet transform needs to select a reasonable wavelet basis function and adjust decomposition level and thresholds several times [15].
The particle swarm algorithm is an intelligent solution algorithm that simulates the population behavior of birds [16]; the individuals of the population are considered to only have speed and direction, and the population tends to be an optimal solution [17]. Each particle receives information from the population and other particles, and then the fitness value is calculated. The particle swarm algorithm can calculate the updating direction and position of particles by learning factors and making the particles converge to a global optimum solution [18]. We use three learning factors to eliminate white noise and interference fringes, and only retain the concentration information. Therefore, the particle swarm algorithm applied to direct absorption spectroscopy can eliminate the system noise quickly and effectively.
A particle swarm algorithm applied to direct absorption spectroscopy is designed based on the above background. Firstly, we introduce the experimental system, such as the selection of absorption line, the principle of the methane detection system, and noise analysis of the experimental system. We describe in detail how to construct and improve the particle swarm algorithm, including computing the fitness function and configuring learning factors. Then we show the denoising performance of the algorithm and comparison with other filtering algorithms. Finally, we evaluate the accuracy and stability of the improved particle swarm algorithm through the calibration experiment and repeatability experiment.
2. Experiment System
2.1. The Absorption Line of CH4
The absorption line of 100 ppm CH4 in the spectral range of 1650–1657 nm based on HITRAN database is depicted in Figure 1. The parameters for the simulation in the inset of Figure 1 are as follows: temperature T = 300 K, pressure P = 1 atm, and optical path length L= 2000 cm.
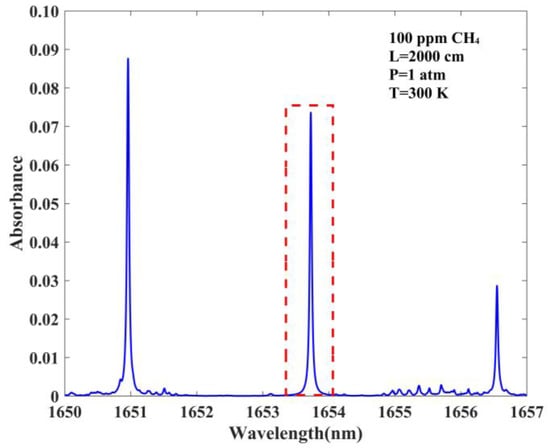
Figure 1.
Absorption lines of CH4 in the spectral range of 1650–1657 nm based on the HITRAN database, absorption spectra of 100 ppm CH4 near 1653.74 nm with L= 2000 cm, P = 1 atm, and T = 300 K.
2.2. Principle of the CH4 Detection System
The experimental data used in the particle swarm algorithm are absorption spectra of CH4 measured in temperature T = 300 K, pressure P = 1 atm, and optical path length L = 2000 cm. We choose the 1653 nm near-infrared laser. Figure 2 illustrates the principle of the CH4 detection system. The laser is controlled by a laser diode controller, and its driving signal is a sawtooth wave generated by a signal generator. The output beam of the laser is propagated to a multiple-reflection optical cell, and variable concentration CH4 is configured in the multiple-reflection optical cell. Subsequently, the output light intensity from the multiple-reflection optical cell is converted to a voltage signal by a photodetector. Finally, the experimental data processing is completed by the PC.
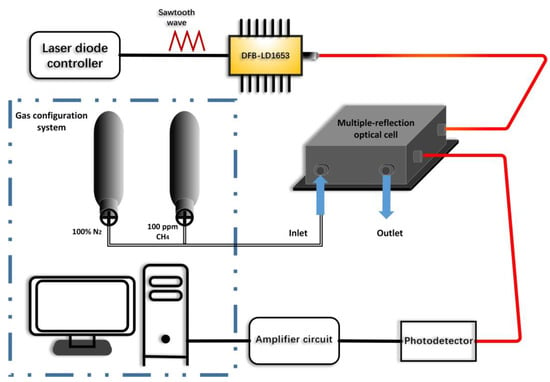
Figure 2.
Schematic of the CH4 detection system.
2.3. Noise Analysis
The absorption spectrum signal will be disturbed by system noise, especially in the case of low gas concentration the peak value of absorption spectrum signal is submerged in noise. Figure 3 illustrates the absorption spectrum signal of 0.2 ppm CH4, it can be seen that the system noise interferes with the concentration information seriously. The system noise consists of two parts: the first one is white noise generated by current pulse [19], this kind of noise has the characteristics of strong randomness and short duration, therefore, it can be removed by calculation of the average. The second one is interference fringe. This disturbance is mainly generated in the multiple-reflection optical cell [20], which is composed of cosine signals with multiple frequencies and is periodic [21]. Etalon length is the main factor affecting the interference fringe [22]. Although interference fringe can be suppressed by applying anti-reflection coating to optical elements or changing the structure of the light path [23], it also has disadvantages, such as high cost and complexity of the system [24].
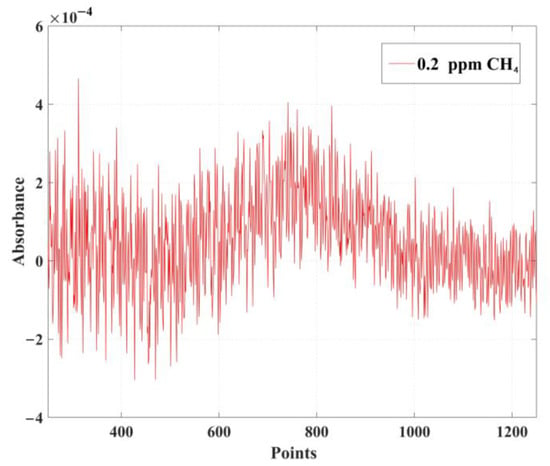
Figure 3.
The original absorption spectrum signal of 0.2 ppm CH4.
3. The Improved Particle Swarm Algorithm
3.1. Simulation
The particle swarm algorithm we use with regards to the original spectra as feasible solutions, and the algorithm calculates a fitness function based on the original spectra. The fitness values are calculated by comparing the original spectra with the fitness function, which shows the advantages and disadvantages of the data. Subsequently, based on the fitness values and learning factors, we can calculate the updating direction and position and update the data accordingly. The algorithm updates the new position of the data and determines whether the maximum number of iterations has been reached. Finally, get an optimal solution. Figure 4 illustrates the effect of the improved particle swarm algorithm applied to an analog signal. By using the particle swarm algorithm, the noise can be removed with details of the analog signal well-preserved.
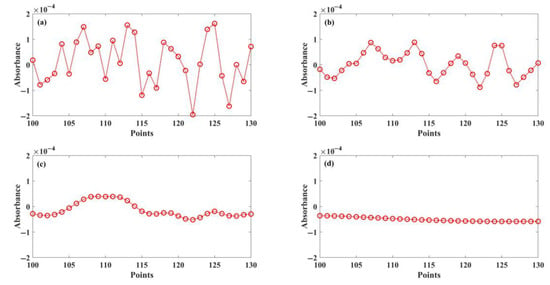
Figure 4.
The result of analog signal processing with particle swarm algorithm. (a) The number of iterations is 0, (b) the number of iterations is 1, (c) the number of iterations is 5, and (d) the number of iterations is 80.
3.2. Fitness Function
Calculating the fitness function is the most important part of the improved particle swarm algorithm [25]. The gas absorption line shapes agree with the theory of spectral line shape [26], therefore half-width at half-maximum and center frequency are the main parameters. According to the experimental environment, the gas absorption line shape has a Lorentzian profile:
Therefore, the expression of fitness function:
where is an amplification parameter of the system, which is mainly related to the laser, amplifier circuit and data acquisition card. is a constant. The algorithm calculates the values of , , and according to the original spectra, and the obtained fitness function is compared with the original spectra until the root mean square error is the smallest.
3.3. Learning Factors
Learning factors affect the convergence speed and updating direction of the improved particle swarm algorithm [27,28]. The learning factors of the particle swarm algorithm we use consist of three parts: self-learning factor “”, learning factor of population “”, and learning factor of adjacent particle “”.
The self-learning factor “” is an acceleration factor that the feasible solution tends to the fitness function . The expression of particle fitness value :
The expression of the particle fitness value indicates the deviation degree to which the feasible solution deviates from the optimal solution and has the characteristics of randomness and instability. When the optimal solution is unknown, it is impossible to judge whether the larger fitness value is caused by noise or concentration information. Therefore, the self-learning factor “” is relatively smaller.
The learning factor of population “” is an acceleration factor that the population tends to the fitness function. The expression of population fitness value :
is the size of the population, the population fitness value is calculated by summing all particle fitness values and dividing by the population size . This value indicates a convergence trend of the population. Although there are individual particles with large deviations, the population tends to an optimal solution. Therefore, the learning factor of population “” is relatively large.
The learning factor of adjacent particle “” is our newly added learning factor. For direct absorption spectroscopy, the disturbance mainly comes from the interference fringe generated by the multiple-reflection optical cell. This disturbance is roughly periodic, and the mean is 0. The expression of adjacent particle fitness value :
The introduction of the learning factor of adjacent particle “” enhances the ability to search for the optimal solution, and each particle can be compared with the adjacent particles. Therefore, the learning factor of the adjacent particle “” should be relatively large. Compared with the traditional particle swarm algorithm, the improved particle swarm algorithm can speed up the convergence speed of the algorithm and effectively remove the interference fringe.
4. Experimental Results and Analysis
4.1. Denoising Performance and Analysis
The data used for the test algorithm are four groups of normalizing original spectra of 1 ppm CH4. The collected original spectra are shown in Figure 5.
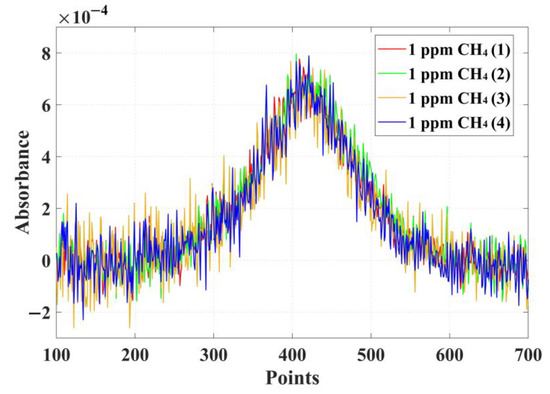
Figure 5.
Four groups of normalizing original spectra of 1 ppm CH4.
We set the iteration maximum number of the algorithm to 1, 5, 20, and 80, and the outputs are shown in Figure 6.
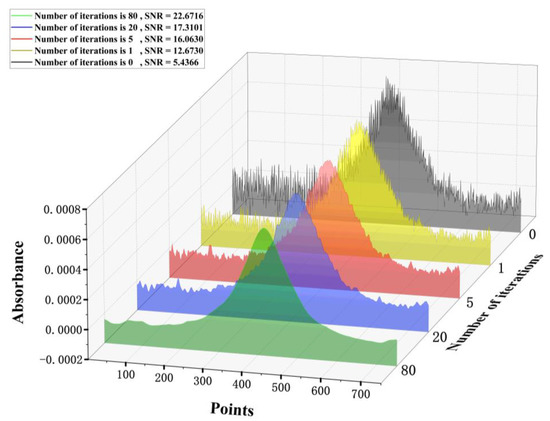
Figure 6.
The result of 1 ppm CH4 original spectra processing with improved particle swarm algorithm. The number of iterations is 0 (black), 1 (yellow), 5 (red), 20 (blue), and 80 (green).
It can be concluded from Figure 6 that our particle swarm algorithm can increase the SNR of the original signal obviously with the small number of iterations. When the number of iterations increased, although the improvement of the SNR slowed down, the signal was smoother. If the number of iterations was large, the output signal converged to a Lorentzian line, and the peak containing the concentration information can be easily calculated.
The denoising ability of the improved particle swarm algorithm is compared with that of the average algorithm, averaging window algorithm, and wavelet transform by calculating the SNR of the signal. As shown in Figure 7, the average algorithm shows the worst denoising ability, even though it improved the low SNR original signal by around 3.8349 dB, and with large sample size, the disturbance of interference fringes is still very serious. Based on the averaging algorithm, we used the averaging window algorithm. When the number of iterations was reasonable, the output signal was relatively smooth, and the signal-to-noise ratio was improved by 8.3578 dB. However, when the number of iterations was large, the peak will be weakened, which in turn affects the calculated concentration. By contrast, the wavelet transform was much more obvious, and the SNR was improved by about 8.6778 dB. Standing out from the above algorithms, our proposed particle swarm algorithm showed the best performance and the highest SNR. The SNR of the original signal was improved by about 17.235 dB. Our particle swarm algorithm can extract the concentration information from the original signal and eliminate the influence of white noise and interference fringes. The algorithm also had the function of smoothing the signal. The SNR calculated by the improved particle swarm algorithm was 4.17 times higher than the SNR of the original signal.
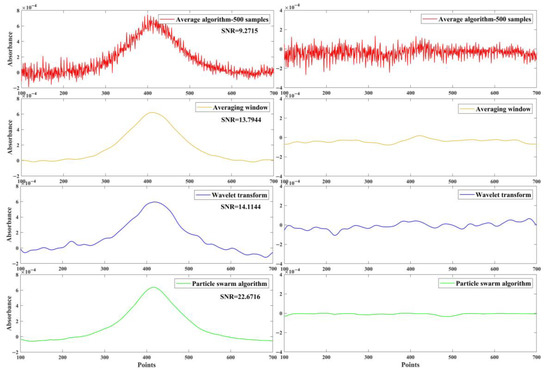
Figure 7.
On the left are the results of original spectra processing with average algorithm, averaging window algorithm, wavelet transform, and our improved particle swarm algorithm. On the right is noise analysis.
The indicators of iterative experiment and comparative experiment are shown in Table 1.

Table 1.
The SNR of different algorithms.
4.2. Results and Analysis of Calibration Experiment
We configure the CH4 with different concentrations, the collected original spectra were processed by the improved particle swarm algorithm and then the peaks of absorption spectra were calculated, and a straight line was fitted according to the concentration and the peaks of absorption spectra, the expression of the straight line:
The fitting result is shown in Figure 8. After calculation, the coefficient of determination R2 = 0.9999.
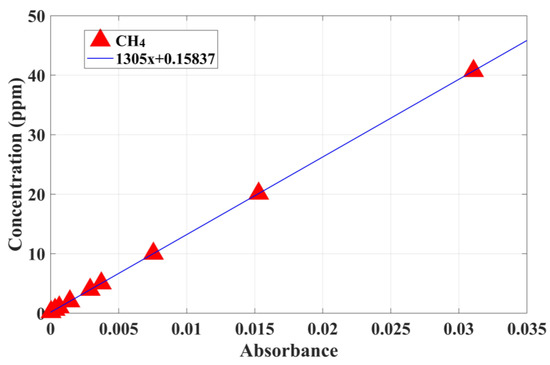
Figure 8.
The fitting result in the calibration experiment.
We used the original spectra collected in the calibration experiment and calculated the peaks of the absorption spectrum that have not been processed by the particle swarm algorithm. Then we calculated the peaks of the absorption spectrum, which were obtained through the particle swarm algorithm and brought the two sets of peaks into expression (6) to calculate the concentrations. Table 2 shows the calculated CH4 concentrations for the two absorption spectrum treatment methods (when the peak of the absorption spectrum had no maximum value, it was represented by a concentration range). The minimum detection limit in the experiment was 15.3 ppb.

Table 2.
The concentration of original spectra with two processing methods.
4.3. Results and Analysis of Repeatability Experiment
We configure the 2 ppm CH4 and lead the gas into the gas cell for two hours, calculating the concentration every 15 min. The result is shown in Figure 9 and Table 3. The error is less than 0.1 ppm in the repeatability experiment, therefore, our improved particle swarm algorithm has good stability.
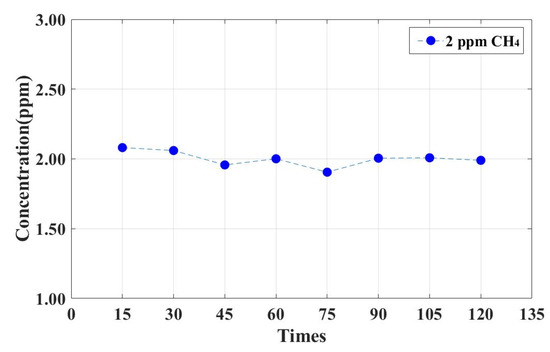
Figure 9.
The result of the repeatability experiment.

Table 3.
The calculated concentration of 2 ppm CH4 original spectra in the repeatability experiment.
5. Conclusions
The system noise affects the measurement accuracy and stability of the direct absorption spectroscopy. To solve the problem, a way of denoising is proposed based on the improved particle swarm algorithm. The improved particle swarm algorithm calculates the fitness function according to the theory of spectral line shape and sets three learning factors based on the noise analysis of gas absorption spectra, which is more reasonable than the traditional denoising algorithm. The improved particle swarm algorithm can extract potential information from the original signal, whether this information is concentration information or noise, this method greatly weakens the subjective purpose of the researcher and objectively respects the information in the original signal. The improved particle swarm algorithm has the ability to accurately extract the concentration information and smooth the signal, it also can eliminate the white noise and interference fringe effectively compared with the original spectra without algorithm processing, the SNR is improved by 4.17 times. The coefficient of determination R2 = 0.9999 is calculated in the calibration experiment and the minimum detection limit is 15.3 ppb. The error is less than 0.1 ppm in the repeatability experiment.
Author Contributions
Methodology, L.Z.; software, L.Z.; validation, L.Z. and Q.Z.; investigation, L.Z.; resources, Y.L., T.Z. and W.G.; data curation, L.Z.; writing—original draft preparation, L.Z.; writing—review and editing, L.Z., Q.Z. and Z.W.; supervision, Y.W. All authors have read and agreed to the published version of the manuscript.
Funding
This work was supported by the National Key Research and Development Program of China (2021YFB3201904, 2021YFB3201905), the Talent Introduction Project of Qilu University of Technology (2021YY01005), The Major Scientific and Technological Innovation Project of Shandong Province (ZR2020KC012), the Natural Science Foundation of Shandong Province (ZR2020QF098, ZR2019PF016), and the Project of Ji’nan (2020GXRC032).
Institutional Review Board Statement
Not applicable.
Informed Consent Statement
Not applicable.
Data Availability Statement
Not applicable.
Conflicts of Interest
The authors declare no conflict of interest.
References
- Shemshad, J.; Aminossadati, S.M.; Kizil, M.S. A review of developments in near infrared methane detection based on tunable diode laser. Sens. Actuators B Chem. 2012, 171, 77–92. [Google Scholar] [CrossRef]
- Lin, H.; Zheng, H.; Montano, B.A.Z.; Wu, H.; Giglio, M.; Sampaolo, A.; Patimisco, P.; Zhu, W.; Zhong, Y.; Dong, L.; et al. Ppb-Level gas detection using on-beam quartz-enhanced photoacoustic spectroscopy based on a 28 kHz tuning fork. Photoacoustics 2022, 25, 100321. [Google Scholar] [CrossRef] [PubMed]
- Richard, L.; Ventrillard, I.; Chau, G.; Jaulin, K.; Kerstel, E.; Romanini, D. Optical-Feedback cavity-enhanced absorption spectroscopy with an interband cascade laser: Application to SO2 trace analysis. Appl. Phys. B 2016, 122, 247. [Google Scholar] [CrossRef]
- Adkins, E.M.; Long, D.A.; Fleisher, A.J.; Hodges, J.T. Near-Infrared cavity ring-down spectroscopy measurements of nitrous oxide in the (4200)←(0000) and (5000)←(0000) bands. J. Quant. Spectrosc. Radiat. Transf. 2021, 262, 107527. [Google Scholar] [CrossRef]
- Raza, M.; Ma, L.; Yao, C.; Yang, M.; Wang, Z.; Wang, Q.; Kan, R.; Ren, W. MHz-Rate scanned-wavelength direct absorption spectroscopy using a distributed feedback diode laser at 2.3 μm. Opt. Laser Technol. 2020, 130, 106344. [Google Scholar] [CrossRef]
- Rieker, G.B.; Jeffries, J.B.; Hanson, R.K. Calibration-Free wavelength-modulation spectroscopy for measurements of gas temperature and concentration in harsh environments. Appl. Opt. 2009, 48, 5546–5560. [Google Scholar] [CrossRef]
- Rieker, G.B. Wavelength-Modulation Spectroscopy for Measurements of Gas Temperature and Concentration in Harsh Environments; Stanford University: Stanford, CA, USA, 2009. [Google Scholar]
- Whittaker, E.A.; Gehrtz, M.; Bjorklund, G.C. Residual amplitude modulation in laser electro-optic phase modulation. JOSA B 1985, 2, 1320–1326. [Google Scholar] [CrossRef]
- Goldenstein, C.S.; Spearrin, R.M.; Jeffries, J.B.; Hanson, R.K. Infrared laser-absorption sensing for combustion gases. Prog. Energy Combust. Sci. 2017, 60, 132–176. [Google Scholar] [CrossRef] [Green Version]
- Yang, R.; Zhang, Y. A method of low concentration methane measurement in tunable diode laser absorption spectroscopy and Levenberg-Marquardt algorithm. Optik 2020, 224, 165657. [Google Scholar] [CrossRef]
- Li, J.; Yu, B.; Zhao, W.; Chen, W. A review of signal enhancement and noise reduction techniques for tunable diode laser absorption spectroscopy. Appl. Spectrosc. Rev. 2014, 49, 666–691. [Google Scholar] [CrossRef]
- Werle, P.O.; Mücke, R.; Slemr, F. The limits of signal averaging in atmospheric trace-gas monitoring by tunable diode-laser absorption spectroscopy (TDLAS). Appl. Phys. B 1993, 57, 131–139. [Google Scholar] [CrossRef]
- Liu, L.; Huan, H.; Li, W.; Mandelis, A.; Wang, Y.; Zhang, L.; Zhang, X.; Yin, X.; Wu, Y.; Shao, X. Highly sensitive broadband differential infrared photoacoustic spectroscopy with wavelet denoising algorithm for trace gas detection. Photoacoustics 2021, 21, 100228. [Google Scholar] [CrossRef] [PubMed]
- Li, C.; Guo, X.; Ji, W.; Wei, J.; Qiu, X.; Ma, W. Etalon fringe removal of tunable diode laser multi-pass spectroscopy by wavelet transforms. Opt. Quantum Electron. 2018, 50, 275. [Google Scholar] [CrossRef]
- Mappe-Fogaing, I.; Joly, L.; Durry, G.; Dumelié, N. Wavelet denoising for infrared laser spectroscopy and gas detection. Appl. Spectrosc. 2012, 66, 700–710. [Google Scholar] [CrossRef]
- Reynolds, C.W. Flocks, herds and schools: A distributed behavioral model. In Proceedings of the 14th Annual Conference on Computer Graphics and Interactive Techniques, Anaheim, CA, USA, 27–31 July 1987; pp. 25–34. [Google Scholar]
- Shi, Y.; Eberhart, R. A modified particle swarm optimizer. In Proceedings of the 1998 IEEE International Conference on Evolutionary Computation. IEEE World Congress on Computational Intelligence, (Cat. No. 98TH8360). Anchorage, AK, USA, 4–9 May 1998; IEEE: Piscataway, NJ, USA, 1998; pp. 69–73. [Google Scholar]
- Zhang, X.; Lin, Q. Three-Learning strategy particle swarm algorithm for global optimization problems. Inf. Sci. 2022, 593, 289–313. [Google Scholar] [CrossRef]
- Bryant, H.L.; Segundo, J.P. Spike initiation by transmembrane current: A white-noise analysis. J. Physiol. 1976, 260, 279–314. [Google Scholar] [CrossRef]
- Cassidy, D.T.; Reid, J. Atmospheric pressure monitoring of trace gases using tunable diode lasers. Appl. Opt. 1982, 21, 1185–1190. [Google Scholar] [CrossRef]
- Okada, K.; Yokoyama, E.; Miike, H. Interference fringe pattern analysis using inverse cosine function. Electron. Commun. Jpn. (Part II Electron.) 2007, 90, 61–73. [Google Scholar] [CrossRef]
- Yang, R.; Dong, X.; Bi, Y.; Lv, T. A method of reducing background fluctuation in tunable diode laser absorption spectroscopy. Opt. Commun. 2018, 410, 782–786. [Google Scholar] [CrossRef]
- Webster, C.R. Brewster-Plate spoiler: A novel method for reducing the amplitude of interference fringes that limit tunable-laser absorption sensitivities. JOSA B 1985, 2, 1464–1470. [Google Scholar] [CrossRef]
- Chakraborty, A.L.; Ruxton, K.; Johnstone, W.; Lengden, M.; Duffin, K. Elimination of residual amplitude modulation in tunable diode laser wavelength modulation spectroscopy using an optical fiber delay line. Opt. Express 2009, 17, 9602–9607. [Google Scholar] [CrossRef]
- Feng, H.M. Self-Generation RBFNs using evolutional PSO learning. Neurocomputing 2006, 70, 241–251. [Google Scholar] [CrossRef]
- Ciuryło, R. Shapes of pressure-and Doppler-broadened spectral lines in the core and near wings. Phys. Rev. A 1998, 58, 1029. [Google Scholar] [CrossRef]
- Suganthan, P.N. Particle swarm optimiser with neighbourhood operator. In Proceedings of the 1999 Congress on Evolutionary Computation-CEC99, (Cat. No. 99TH8406). Washington, DC, USA, 6–9 July 1999; IEEE: Piscataway, NJ, USA, 1999; Volume 3, pp. 1958–1962. [Google Scholar]
- Ratnaweera, A.; Halgamuge, S.K.; Watson, H.C. Self-Organizing hierarchical particle swarm optimizer with time-varying acceleration coefficients. IEEE Trans. Evol. Comput. 2004, 8, 240–255. [Google Scholar] [CrossRef]
Publisher’s Note: MDPI stays neutral with regard to jurisdictional claims in published maps and institutional affiliations. |
© 2022 by the authors. Licensee MDPI, Basel, Switzerland. This article is an open access article distributed under the terms and conditions of the Creative Commons Attribution (CC BY) license (https://creativecommons.org/licenses/by/4.0/).