Article

Fast and Inexpensive Separation of Bright Phosphor Particles from Commercial Sources by Gravitational and Centrifugal Sedimentation for Deep Tissue X-ray Luminescence Imaging

1
Department of Chemistry, Clemson University, Clemson, SC 29634, USA
2
Clemson Nanomaterials Institute, Department of Physics and Astronomy, Clemson University, Clemson, SC 29634, USA
3
Center for Optical Materials Science Engineering Technology (COMSET), Clemson University, Clemson, SC 29634, USA
*
Authors to whom correspondence should be addressed.
Present address: Research & Development Scientist, Cardinal CG (Coating Glass) Technology Center, Spring Green, WI 53588, USA.
Photonics 2022, 9(5), 347; https://doi.org/10.3390/photonics9050347
Submission received: 28 March 2022 / Revised: 3 May 2022 / Accepted: 9 May 2022 / Published: 15 May 2022
(This article belongs to the Special Issue X-ray Luminescence and Fluorescence)

Abstract

:
X-ray luminescence tomography (XLT) detects X-ray scintillators contrast agents using a focused or collimated X-ray beam to provide high spatial resolution excitation through thick tissue. The approach requires bright nanophosphors that are either synthesized or purchased. However, currently available commercial nanophosphors are mostly composed of a polydisperse mixture of several micro- to nano-sized particles that are unsuitable for biomedical imaging applications because of their size and aggregated form. Here, we demonstrate a fast and robust method to obtain uniform nano to submicron phosphor particles from a commercial source of polydisperse Eu- and Tb-doped Gd2O2S particles by separating the smaller particles present using gravitational and centrifugal sedimentation. In contrast to ball milling for 15–60 min, which drastically degraded the particles’ brightness while reducing their size, our sedimentation method enabled the extraction of comparatively bright nanophosphors (≈100–300 nm in size) with a luminescence intensity of ≈10–20% of the several micron particles in the sample. Moreover, if scale up for higher yielding is required, the sedimentation process can be accelerated using fixed-angle and/or swinging bucket rotating centrifugation. Finally, after separation and characterization, nano and submicron phosphors were suspended and imaged through 5 mm thick porcine tissue using our in-house-built scanning X-ray induced luminescence chemical imaging (XELCI) system.

1. Introduction and Theory

X-ray luminescence tomography (XLT) is a recently developed modality that combines the high spatial resolution of X-ray imaging through tissue with the chemical sensitivity of optical indicators [1,2]. It relies on phosphors injected or implanted in the tissue, which serve as contrast agents that generate visible and near-infrared light when irradiated by an X-ray beam, which scans through the sample [3,4]. Since the signal relies upon the scintillators, there is a need for bright nano-sized phosphors, which can be easily acquired and standardized across different labs. Unfortunately, most commercially available bright X-ray scintillators are micron-sized phosphors, which are inappropriate for many biological applications [5,6]. Our group and others are making efforts to synthesize and control the size of bright phosphor particles in nano scale [7,8,9,10]. For example, both conventional and non-conventional methods have been explored in the synthesis of nanomaterials doped with lanthanides for development of luminescent materials. [11,12] In addition, the impact of particle size on the luminescence quantum efficiency has been investigated in many nanocrystalline particles [13]. It is well known that crystal defects and domain boundaries can quench phosphor luminescence. However, annealing methods to reduce crystal defects cause particle fusion or require multiple core–shell structures. To enhance the luminescence of the Gd2O2S:Eu3+ nanophosphors, Chen et al. [7] synthesized core–shell nanoparticles with NaF in the core, which increased both crystal domain size and luminescence intensity, without affecting the physical particle diameter. Furthermore, Monte Carlo simulations indicated that small crystal domains have significant surface quenching that decreases with increasing crystal domain growth, elucidating the correlation between crystal domain size and luminescence intensity [7]. In a different study, Bulin et al. [14] simulated the spatial distribution of energy deposited by the interacting X-rays on nanoscintillators and their surrounding media. According to this study, depending on the X-ray energy, a large amount of energy leaves the nanoscintillator and is deposited in the surrounding medium, which leads to significant loss in light emission efficiency. Indeed, there is a need for materials, which multiple labs can purchase inexpensively for better standardization and comparison.
To reduce the size of commercial microphosphors, we first tried a high-energy ball-milling technique [15,16], which is a facile, industrially scalable process for downsizing. However, after ball milling, the luminescence intensity decreased dramatically compared to the pristine commercial microspheres, presumably due to the introduction of crystalline defects, which quench luminescence and/or phase changes during milling due to local high temperatures above 1000 °C and/or high pressure up to several GPa [15,17].
Herein, we describe a simple method to obtain nano- or submicron-sized phosphors via gravitational and centrifugal sedimentation. The approach is similar to classic analytical ultracentrifugation technique invented by Svedberg and his co-workers [18,19,20]. During sedimentation, the gravitational force pulls the particles down with a force given by
F g r a v i t y = ( Δ m ) g = ( ρ n p ρ L ) ( π d 3 6 ) g
The gravitational force is balanced by the Stokes viscous drag, which for a sphere is given as
F d r a g = 3 π d η v
Equating the two forces at terminal velocity, we obtain
v = d 2 18 η ( ρ n p ρ L ) g
Here, Δ m is the buoyancy-corrected nanoparticle mass, d is the nanoparticle diameter, ρ n p and ρ l are, respectively, the density of the nanophosphors and solvent, g is the gravitational acceleration (~9.81 N/kg), v is the nanoparticle velocity, η is the solvent viscosity. Nonetheless, at normal gravity, it takes longer to separate smaller nanoparticles mixed with larger submicron to several micron particles at a given density. Hence, to speed up the separation of nano–submicron particles from the several micron particles, a centrifugation with stronger g -force is introduced. During centrifugation, the gravitational force can be replaced with a relative centrifugal force ( F c = ( Δ m ) ω 2 R ) , according to Equation (4). Using Stokes law,
v = d 2 18 η ω 2 R ( ρ n p ρ L )
where ω is the rotor angular velocity, R is the distance from the center of rotation. Note that for both gravitational and centrifugal force, if the initial velocity is different from the final velocity, there is a brief period of exponential acceleration toward terminal velocity with a time constant given by Equation (5) [21]:
τ = ( 6 π η r m ) 1
However, for 100 nm diameter particles in water, the time constant is ~0.4 µs, which is negligible, and over periods of minutes to days, we can treat the particles as moving with a constant velocity according to Equations (3) and (4) above. Based on the calculated velocity, Figure 1 shows the time required for sedimentation for a given length of a graduated cylinder.
After centrifugation, it can be anticipated that the larger–heavier particles are sedimented at the lower portion or bottom of the centrifuge tube as pellets, and the smaller-lighter particles are suspended in the upper supernatant. Figure 1a,b show the commercial microphosphors suspended in water before the gravitational/centrifugal separation, for instance. The schematic diagram represents the two balancing forces, viz., the gravitational force and the viscous drag, as discussed in Equations (1) and (2) (cf. Figure 1c). The optimal times required to reach the settling distance for the different-sized nanophosphors when the relative centrifugal force is 1000× g vs. 1× g are compared in Figure 1d,e.
Clearly, the settling time was significantly reduced via centrifugation speed. Furthermore, the shape and size of the particles extracted from the different fractions of the supernatant are characterized by dynamic light scattering measurements and electron microscope imaging. Additionally, the brightness of the particles is also checked qualitatively and quantitatively using UV 365 nm (as shown in Figure 1b) and X-ray-excited optical luminescence (XEOL) spectroscopy, respectively. Post confirmation of the successful separations, the particles with known size and properties are concentrated and resuspended in a polyethylene glycol suspension. In addition, the surface of the separated particles is being functionalized [1,22] to activate or enhance their possibility of tethering with the target biomolecules inside the live animal tissues.

2. Materials and Methods

2.1. Materials

The Gd2O2S:Eu3+ (8 µm median diameter, part number UKL63/N-R1; 2.5 µm median diameter, part number UKL63/UF-R1) and the Gd2O2S:Tb3+ (10 µm median diameter, part number UKL63/N-R1; and 2.5 µm median diameter, part number UKL65/UF-R1) microphosphors were obtained from Phosphor Technology LTD, Stevenage, UK. Both of the commercial Gd2O2S samples (Eu- and Tb-doped) contain a polydisperse mixture of microparticles. The sucrose crystals (SU-103) were obtained from Spectrum Chemical MFG Corp.

2.2. Methods

2.2.1. Ball Milling

Initially, commercially available 8 μm sized (as labeled by the supplier) Eu-doped Gd2O2S (or, Gd2O2S:Eu) particles were ball milled for 0–8 h employing a desktop high-speed ball mill (MTI, MSK-SFM-3) with 3D rotational motion (using Al2O3 jar and alumina mixing balls at a ball-to-powder ratio of 7:1 by mass). The ball-milled particles were then tested for structural and luminescence properties after each hour, as shown in Figures S1 and S2. After ball milling for 2 h, the luminescence intensity was drastically reduced (cf. bottom panel of Figure S1). Hence, short-term ball milling was considered, and the commercial 2.5 μm sized (labeled by the supplier) Gd2O2S:Eu particles were ball milled under the same conditions as described above. The scintillator powders were ball milled for different times, e.g., 15, 30, 45 min and 1 h. As it is well known that the number of balls and ball-to-material mass ratio can lead to significant differences in the grinding power of the ball mill, hence we kept the number of balls and the ball-to-powder mass ratio a constant throughout the experiment.

2.2.2. Particles Separation via Spontaneous Sedimentation in a Sucrose Gradient Solution Column

Initially, commercial Gd2O2S:Eu particles (~2.5 μm in size as labeled by the supplier) were selected for separation by normal gravitational sedimentation in a sucrose solution. The sucrose gradient column was prepared in a 50 mL conical bottom centrifuge tube and started with transferring 10 mL from a stock of 60 wt% sucrose solution prepared using deionized (DI) water. This 10 mL 60% sucrose solution is the first and the very bottom layer of the particles separating solutions gradient column. Later, second, third and fourth distinct layers were created by carefully and sequentially pouring 10 mL of 45%, followed by 30% and 15% sucrose solutions. Finally, a homogeneously mixed 5 mL of 5% sucrose solution with 50 mg of commercial 2.5-micron Gd2O2S:Eu particles were poured as gently as possible on the very top of the sucrose gradient column. Finally, the gradient column with the mixed particles on top was left for about 2 weeks to allow heavier and larger particles to settle to the bottom, while lighter and smaller particles remained suspended at the upper portion of the gradient column. Different layers by volume from the top of suspension were collected and washed simply using DI water. Later, the sizes and luminescence properties of the separated particles were checked in DLS and EM imaging and compared with the pristine commercial particles.

2.2.3. Commercial Particles Separation by Sedimentation under Normal Gravity Using DI Water Column

After separating and collecting particles from the sucrose gradient solution (described above), it was difficult to remove excess sucrose from the sample. Therefore, to make the separation process easier, ~10 g of (both Tb- and Eu-doped were used in different trials) Gd2O2S 2.5 μm particles was suspended in 1000 mL of DI water inside a cleaned glass cylinder of 1 L capacity (keeping the concentration ~10 mg/mL). The total suspension volume of the particles was sonicated for at least 20–30 min and vortexed for 10–30 s before transferring them into a 1 L (1000 mL) glass cylinder (See Figure S3 in Supplementary Information section). After 10 days, the supernatant fractions (Fs) were collected from the top in the following sequence and will be referred to as follows: first 150 mL (F1), second 150 mL (F2), third 150 mL (F3), etc. The sedimented particles at the very bottom of the glass cylinder were left to dry and stored for reuse.

2.2.4. Particle Separation by Centrifugation in Deionized Water

The spontaneous gravitational sedimentation process described above was found to be more efficient in separating the nano- and submicron-sized phosphor particles from the polydispersed and mixed-sized commercial powders. Nevertheless, spontaneous sedimentation is inconvenient for rapid separation with high yield, if required. Therefore, to accelerate the particles separation process, approximately 350 mg of commercial Gd2O2S:Eu or Gd2O2S:Tb polydisperse microphosphors were suspended in a transparent round-bottom centrifuge tube (50 mL capacity) containing about 35 mL of DI water (at an arbitrary concentration of ~10 mg/mL), which was sonicated for 20–30 min and vortexed for 10–30 s, before placing them into the slots of a fixed/swinging bucket rotor. A total of 8 centrifuge tubes with mixed particle suspension were centrifuged with a relative centrifugal force (RCF) of ~1000× g for a duration of 15 min. Each centrifuge tube was graduated, and the total height of the suspension was about 8 cm. The supernatant fractions (Fs) were collected from the top in the following sequence and will be referred to as: first 2 cm (F1), second 2 cm (F2), third 2 cm (F3), fourth 1 cm (F4) and final 1 cm (F5). The sedimented particles at the bottom of the centrifuge tube were discarded/restored for recycling or used for other purposes.

2.3. Characterization

The structural and optical properties of the as-purchased Gd2O2S micron particles, the ball-milled and the separated multi-sized particles were characterized and evaluated using different analytical tools, such as X-ray powder diffraction (XRD), scanning tunneling electron microscopy (STEM), energy-dispersive X-ray spectroscopy (EDX), dynamic light scattering (DLS) and X-ray-excited optical luminescence (XEOL) spectroscopy, as described below.

2.3.1. X-ray Diffraction (XRD)

The crystal structures of the commercial microphosphors were confirmed before and after ball milling by high-resolution XRD (HR-XRD) measured on a RIGAKU Ultima IV diffractometer (Cu Kα radiation, λ = 1.5406 Å). Quantitative analysis using Rietveld refinement was performed on the XRD peaks using the PDXL software to determine the crystallite size and the strain on the powders after ball milling. Powdered samples were spread on zero-background sample holders, and the data were collected in 0.02° increments at a rate of 0.5° min−1 from a 2 θ of 20° to 80° at room temperature.

2.3.2. Dynamic Light Scattering (DLS) Measurements

DLS measurements were carried out to confirm the accuracy of particle size distribution, and the Malvern Zetasizer Nano ZS90 model was used to analyze and to determine the hydrodynamic radius, as well as the polydispersity index of the separated nano–micron particles. Particles were dispersed in DI water. Standard 1.0 mL disposable polystyrene cuvettes were used (DTS0012, Malvern Instruments, Westborough, MA, USA). Using the Stokes–Einstein equation D h = k B T / 3 π η D t , which connects the diffusion coefficient D t measured by DLS to the particle size or the hydrodynamic diameter D h , we obtained the particle size distribution for the different ball-milled particles.

2.3.3. Electron Microscope Imaging

The sizes of the commercial, ball-milled and separated nanophosphors were verified using a scanning transmission electron microscope (STEM, Hitachi SU9000) and a transmission electric microscope (TEM, Hitachi HT7800). Elemental analyses of the separated particles were performed via EDX. For TEM imaging, 400 mesh carbon-coated copper grids were prepared by deposition of 10–20 μL solution droplets containing the separated particles, which were dried before taking TEM micrographs.

2.3.4. XEOL Spectroscopic Measurements

The intensity of the X-ray-excited optical luminescence of the ball-milled and separated particles was measured by irradiating them with an X-ray beam. A 96-well plate containing uniform coatings of dried and powdered particles was placed on the stage of an inverted microscope and irradiated with an X-ray beam generated using MINI-X (Ag) X-ray source at 40 kV and 100 µA. The luminescence emission of nanoparticles was collected by 5× objective lens and a cylindrical lens focused this light on the entrance slit of a spectrograph (DNS 300, DeltaNu, Laramie, WY, USA) equipped with a cooled CCD camera (iDUS-420BV, Andor, South Windsor, CT, USA).

2.3.5. XELCI Imaging through Tissue

Phosphor particle samples (submicron and nanoparticles) with a concentration of 10 mg/mL were prepared in capillaries with 1 mm inner diameters. A rectangular area of the capillaries was scanned first with 500 μm step size and 5 mm s−1 speed for a low-resolution scan. Later, the same area was scanned with 250 μm step size and 1 mm s−1 for a high-resolution scan. XELCI imaging was performed under two conditions: without tissue and through a 5 mm porcine tissue. A lower X-ray energy (50 kV, 200 µA) was used to image the capillaries without tissue, while the imaging through tissue was performed using a higher X-ray energy (50 kV, 600 µA). A plain radiograph was also obtained under 50 kV and 600 µA. The raw data were analyzed in MATLAB.

3. Results and Discussion
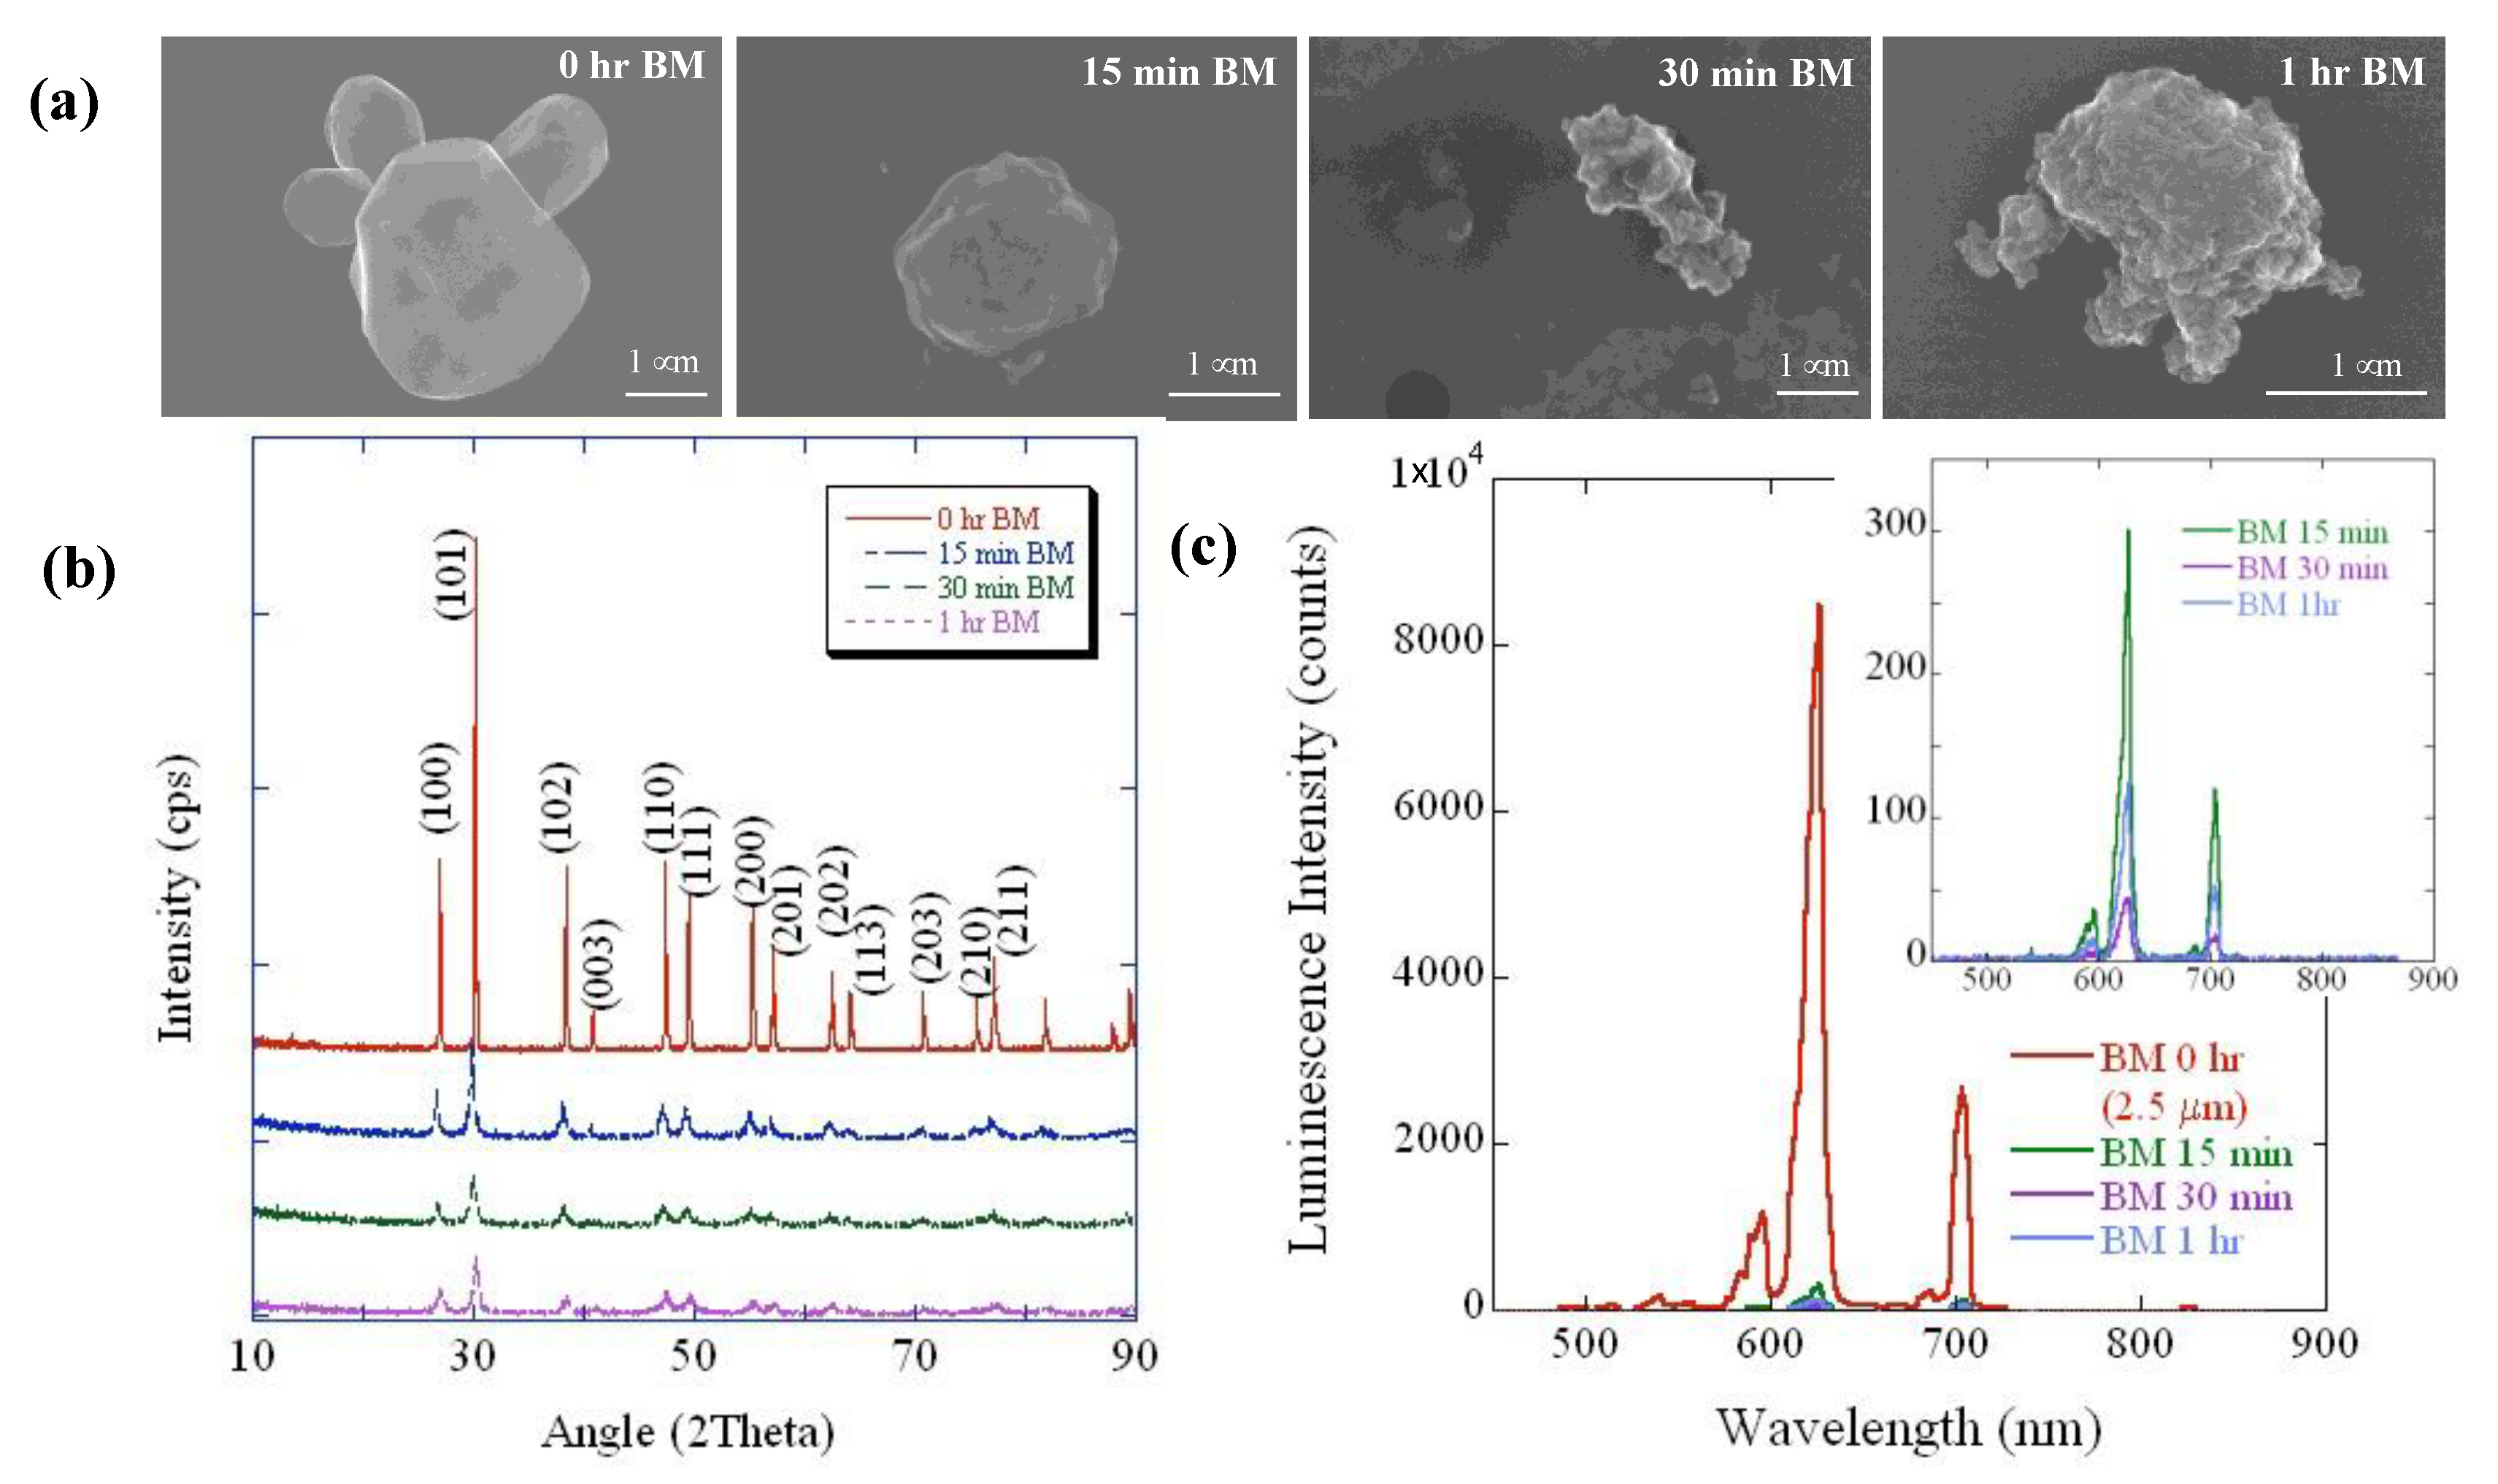
3.1. Ball Milling

High-energy ball milling is a facile, industrially scalable process for nanostructuring of materials from larger particles and was a potential alternative method to acquire nanophosphors from commercial microphosphor sources. Unfortunately, the process can introduce defects into the particles, which can reduce their brightness. We studied the effect of ball-milling time on particle size and brightness to assess the tradeoff and compare it with the sedimentation approach. Commercial ~2.5 μm Gd2O2S:Eu microphosphors were chosen for size reduction through ball milling as a function of ball milling. STEM images in Figure 2a show the commercial and ball-milled Gd2O2S:Eu particles for different ball-milling (BM) periods at 0–60 min range.
The top left panel shows a polydispersed mixture of commercial Gd2O2S:Eu particles (~2.5 μm in size, as labeled by the supplier) with characteristic hexagon-like single crystals, where the overall size distribution ranges from ~0.5 to 2.5 μm. Notably, compared to the commercial particles (0 h BM), the ball-milled particles exhibit increased roughness with increasing ball-milling times. The STEM images indicate apparent reduction in particle sizes with increased ball-milling times. Nonetheless, ball milling is known to produce a bell curve or Gaussian particle size distribution [23,24], due to which an accurate estimation of the individual particle size via electron microscopy was not possible. Hence, we estimated the average crystallite size using the Scherrer equation [25] through XRD measurements to confirm the particle size reduction through ball milling.
Figure 2b shows the X-ray diffraction patterns of the commercial and ball-milled Gd2O2S:Eu particles as a function of ball-milling time. Rietveld analysis indicated that the approximate strain on the ball-milled particles increased from ~0.5 to ~0.6 for the ball-milling time of 15 and 30 min, respectively, while the crystallite size decreased from 209 Å to 132 Å. The X-ray-excited luminescence spectrum of Gd2O2S:Eu shown in Figure 2c. Gd2O2S:Eu exhibits intense peaks at ~625 nm and 705 nm, which are attributed to the 5D07F2 and 5D07F4 transitions of Eu3+, respectively. Clearly, the luminescence intensity decreases with increasing ball-milling time by almost a factor of 30 after 15 min of ball milling, possibly due to the introduction of non-radiative recombination centers in Gd2O2S, which could be attributed to induced lattice strain and/or impurities added during the mechanical milling process [26,27].

3.2. Particles Separation via Spontaneous Sedimentation in a Sucrose Solutions Gradient Column

After collecting different layers of separated Gd2O2S:Eu particles from the sucrose solutions gradient, they were washed a few times using DI water, with shaking, followed by repetitive centrifugation. After washing, the particles were resuspended in fresh DI water with a concentration of about 0.25–0.5 mg/mL. The separated nanoparticles suspension obtained in this method was stable in the suspension state and fluoresced when exposed to UV radiation. However, after separation in a sucrose gradient, it was difficult to wash off all traces of sucrose, and incomplete removal affected electron microscopy images. Interestingly, nanoparticles obtained in the sucrose gradient sedimentation process were found to be coated with a thin coating (see Figure 3a) which EDX elemental mapping supports, showing the presence of silicon and oxygen (see Figure S4, Supplementary Information section). The luminescence properties of the particles prepared using the separated Eu-doped nano and submicron Gd2O2S particles were tested and compared with the pristine commercial particles as shown in Figure 3b,c. Both pristine commercial and separated Eu-doped phosphor particles exhibit intense peak positioned almost identically at around ~625 nm and ~705 nm, which are attributed to the 5D07F2 and 5D07F4 transitions of Eu3+, respectively. Nevertheless, the measured luminescence peak intensity of the separated NPs and SMPs was found at ≈10% and ≈20% of the peak intensity as measured for the pristine commercial particles, respectively. Such difference in luminescence brightness of the particles can be attributed to the change in size and potential for surface quenching of the corresponding nano and submicron phosphor particles [28,29,30].

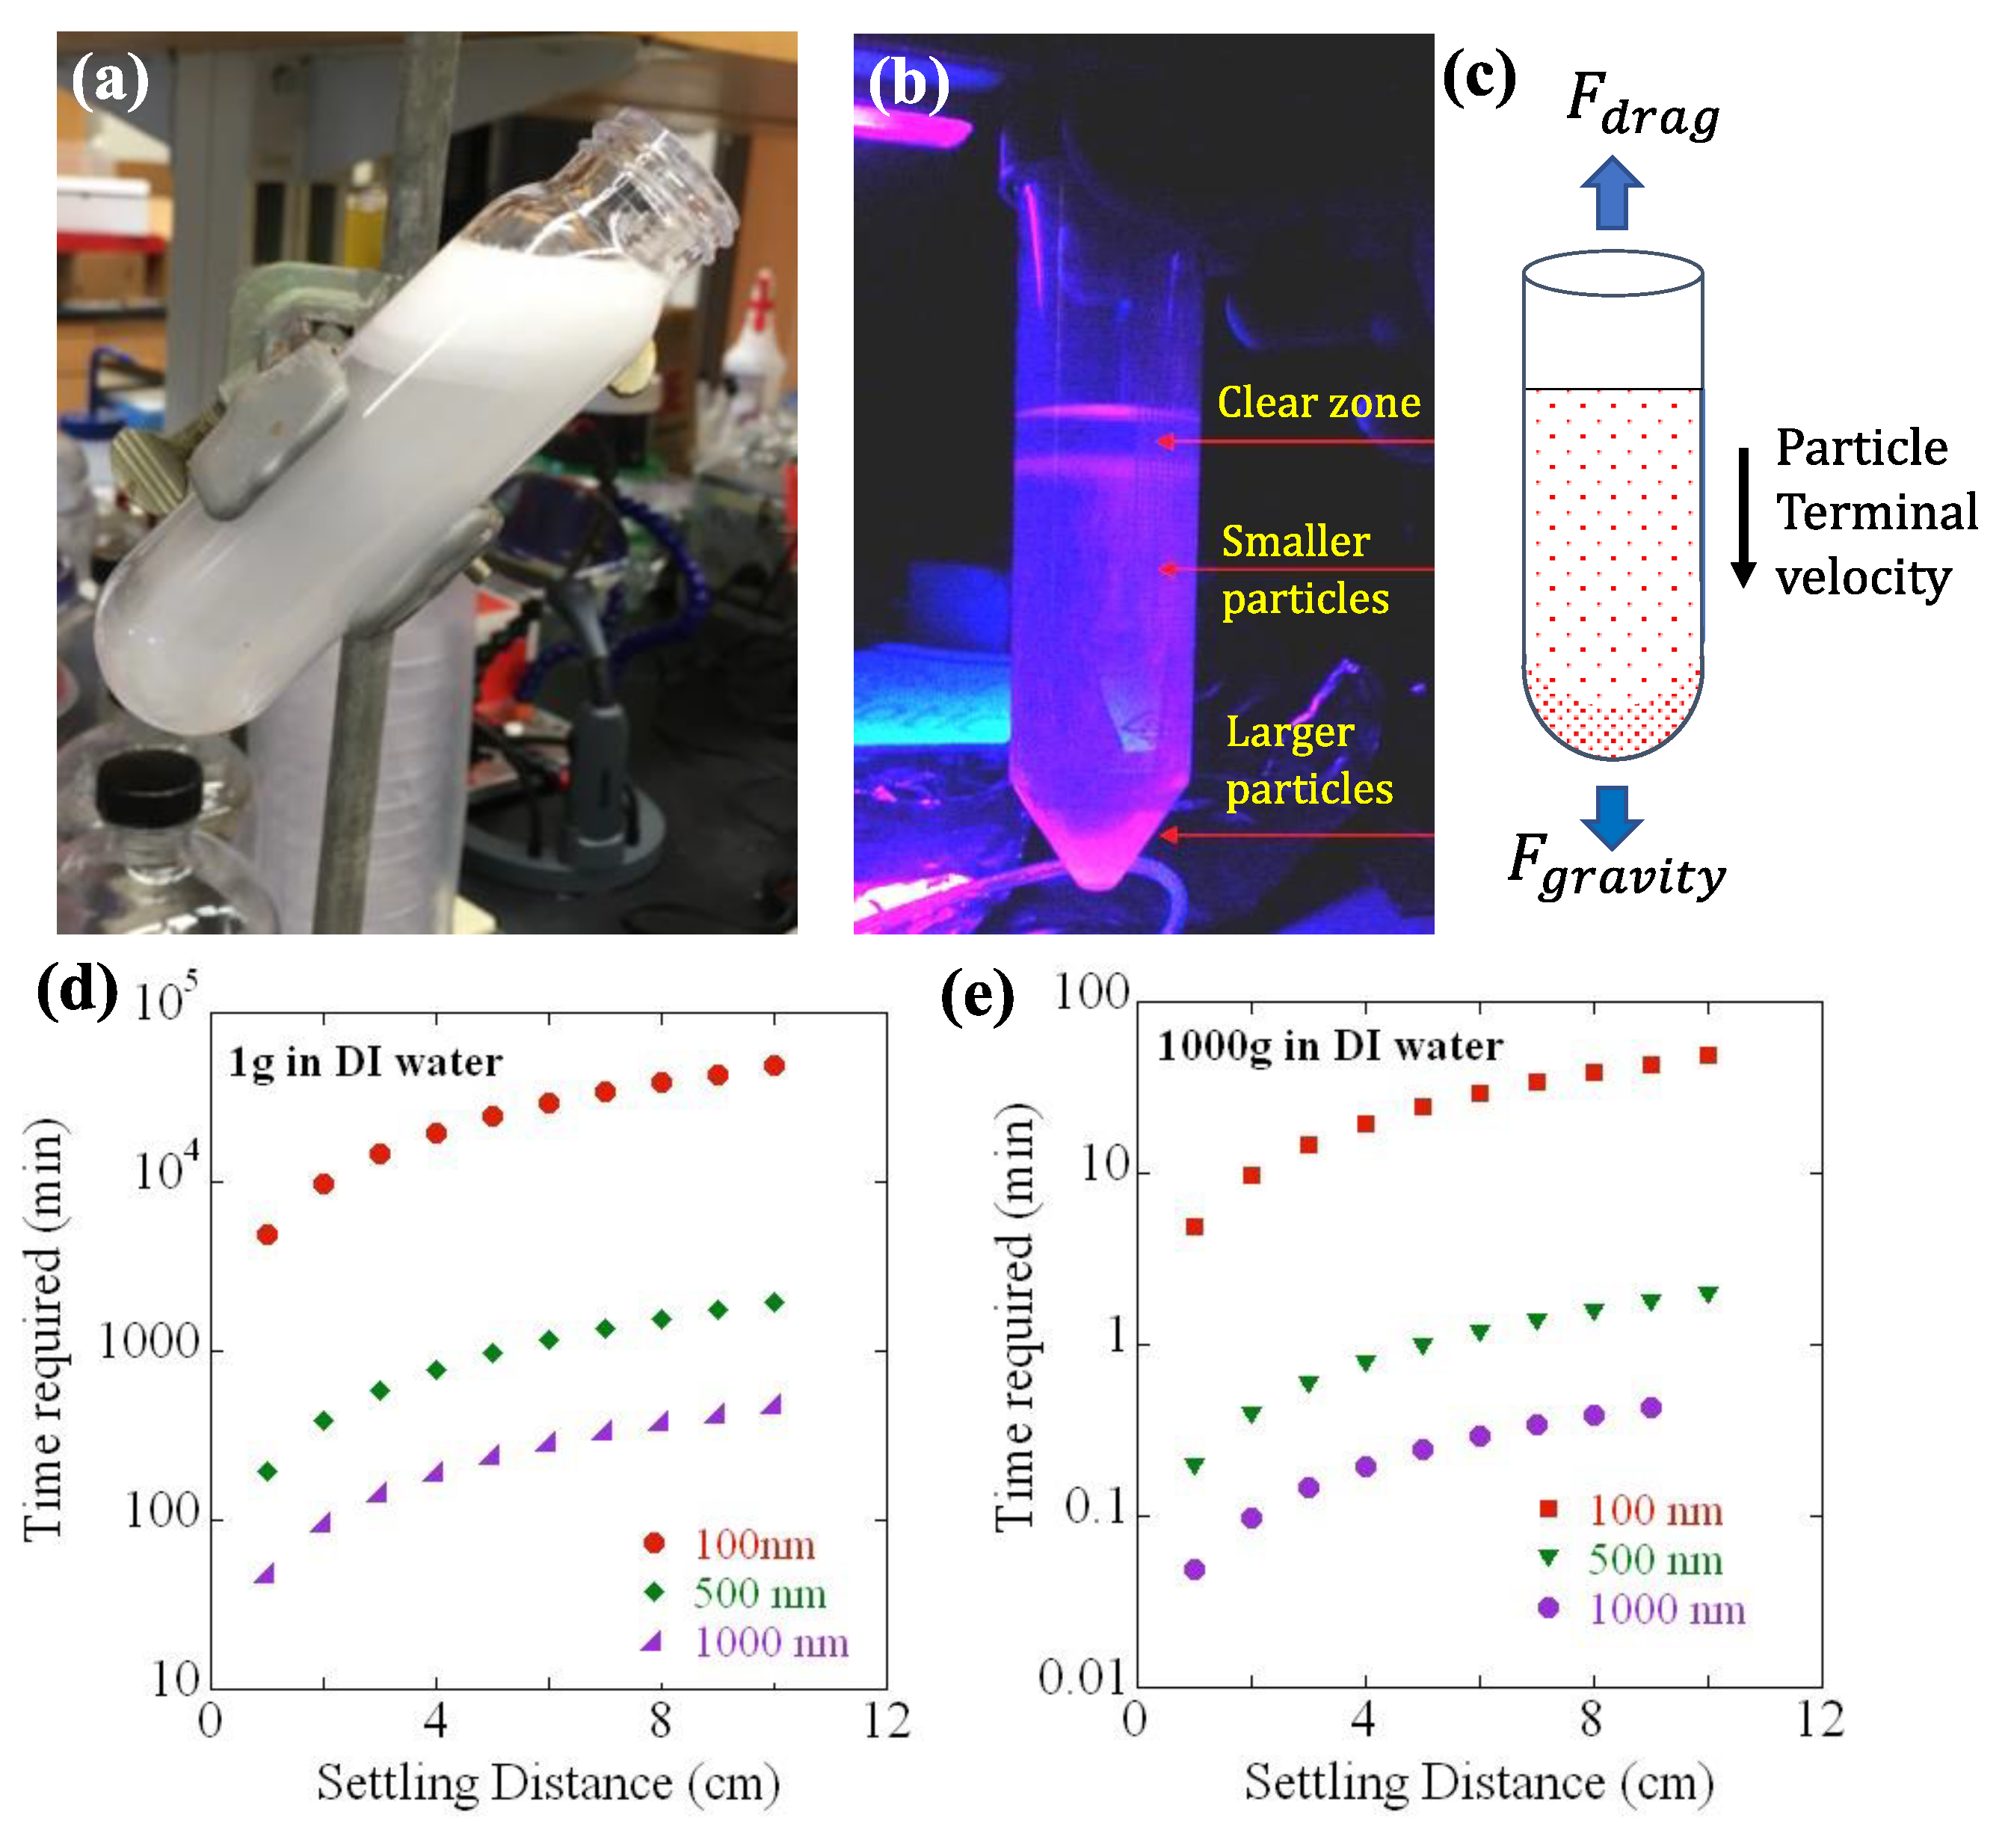
3.3. Nanoparticles Separation from a Polydispersed Mix of Commercial Micron-Sized Particles by Sedimentation under Normal Gravity Simply Using DI Water Column

After 10 days of spontaneous sedimentation, ~50–150 mL of the suspension from the top (as the fraction F1) of the settled water column was collected, and the concentration of separated particles in this layer was measured ~0.025 mg/mL. The suspension of the layer with this concentration was found quite stable and fluoresced well under ultraviolet radiation. The luminescence intensity of the separated nanoparticles was checked with respect to the intensity of the initial commercial microparticles. The spectral shape and peaks positions were found similar for both separated nanoparticles and pristine micron-sized particles (Figure 4). However, both Eu- and Tb-doped separated nanophosphors, exhibited decreased intensity for the most intense peak (~625 nm for Gd2O2S:Eu and ~544 nm for Gd2O2S:Tb) compared to the commercial particles as received from the supplier. These commercial particles had a yield of ~60,000 photons/MeV [31] and could serve as a standard. For the separated Gd2O2S:Eu nanoparticles (Figure 4c), we found a yield of ~13,400 photons/MeV, which corresponds to ~22% of the luminescence intensity of commercial Gd2O2S:Eu particles measured under the same conditions. Compared with previously reported synthesized particles, we found a yield of ~600 photons/MeV for the silica-coated 60 nm NaGdF4:Eu [8] and ~2400 photons/MeV and ~24,000 photons/MeV for ~60 nm Gd2O2S:Eu nanoparticles, synthesized with and without 7.5% NaF in the core, respectively [7].
The suspension of particles with increased concentration might exhibit greater luminescence intensity in XEOL spectroscopy. Nonetheless, it is important to mention here that when the nanoparticles concentration was increased to ~1.0 mg/mL by simply evaporating the water, this caused the suspension to become unstable, as particles aggregated (Figure S5, Supplementary Information section). Therefore, based on the necessity for injecting the particles suspension inside a living system, particles are required to be functionalized, for instance, by employing PEG-Silane prior to performing concentrated suspension.

3.4. Faster Process of Phosphor Particles Separation Employing High-Speed Centrifugation Where DI Water Was Also Used as a Dispersion Medium

After comparing the particles obtained from spontaneous gravitational sedimentation process to as-received commercial microparticles, two different colors (Eu- and Tb-doped) and sizes (2.5–10 microns) were separated using the high-speed centrifugation method. As expected, the heavier Gd2O2S particles were pelleted at the bottom of the centrifuge tube, and the lighter nanoparticles were suspended in the supernatant, residing at the upper portion of the tube, after centrifugation of the mixed particles suspension. Fractions F1F5 of the liquid were collected in separated glass vials, and afterward, the hydrodynamic size of the particles in each fraction was characterized by DLS measurements. Later, electron microscope imaging (cf. Figure 5) was conducted to check and confirm the shape and size of the particles, and XELCI imaging was also performed using these separated Gd2O2S:Eu as shown in Figure 6.
DLS measurements of the supernatant fractions show that most (>60%) of the particles, at least in F1 to F3, are in the range of 100–300 nm. The majority of particles in F4 and F5 are submicron to micron sized. Note, these values are the intensity-weighted distributions, and since large particles scatter much more strongly than smaller particles, weighting by number or even volume would provide smaller average hydrodynamic radii. Based on DLS measurements, the polydispersity index (PdI) or the size-dependent heterogeneity of the separated Gd2O2S:Eu and Gd2O2S:Tb particles in the F1 layer were found to be ~0.13 and ~0.068, respectively, for the entire distribution (cf. Figure S6). Calculating the PdI for just peak 1 from the square of the standard deviation divided by the square of the mean for the F1 layer of the separated Gd2O2S:Eu and Gd2O2S:Tb particles yielded ~0.09 and ~0.05, respectively (cf. Figure S6). Subsequent EM imaging rather agrees with the DLS measurements; however, it was hard to find sharp and clear boundary and to measure the size of individual nanoparticles (especially for F1 to F3), since they were significantly overlapped with different grains and created a necklace-like structure in almost all the grids as prepared in this part of the study. Lastly, compared to the previous trial using a sucrose gradient solution column, in cases of accelerated separation efforts, the silica-coated nanoparticles were rarely found, which can be explained, as the presence of such smaller particles might be very low in numbers in the pristine mixed particles supplied from different batches.

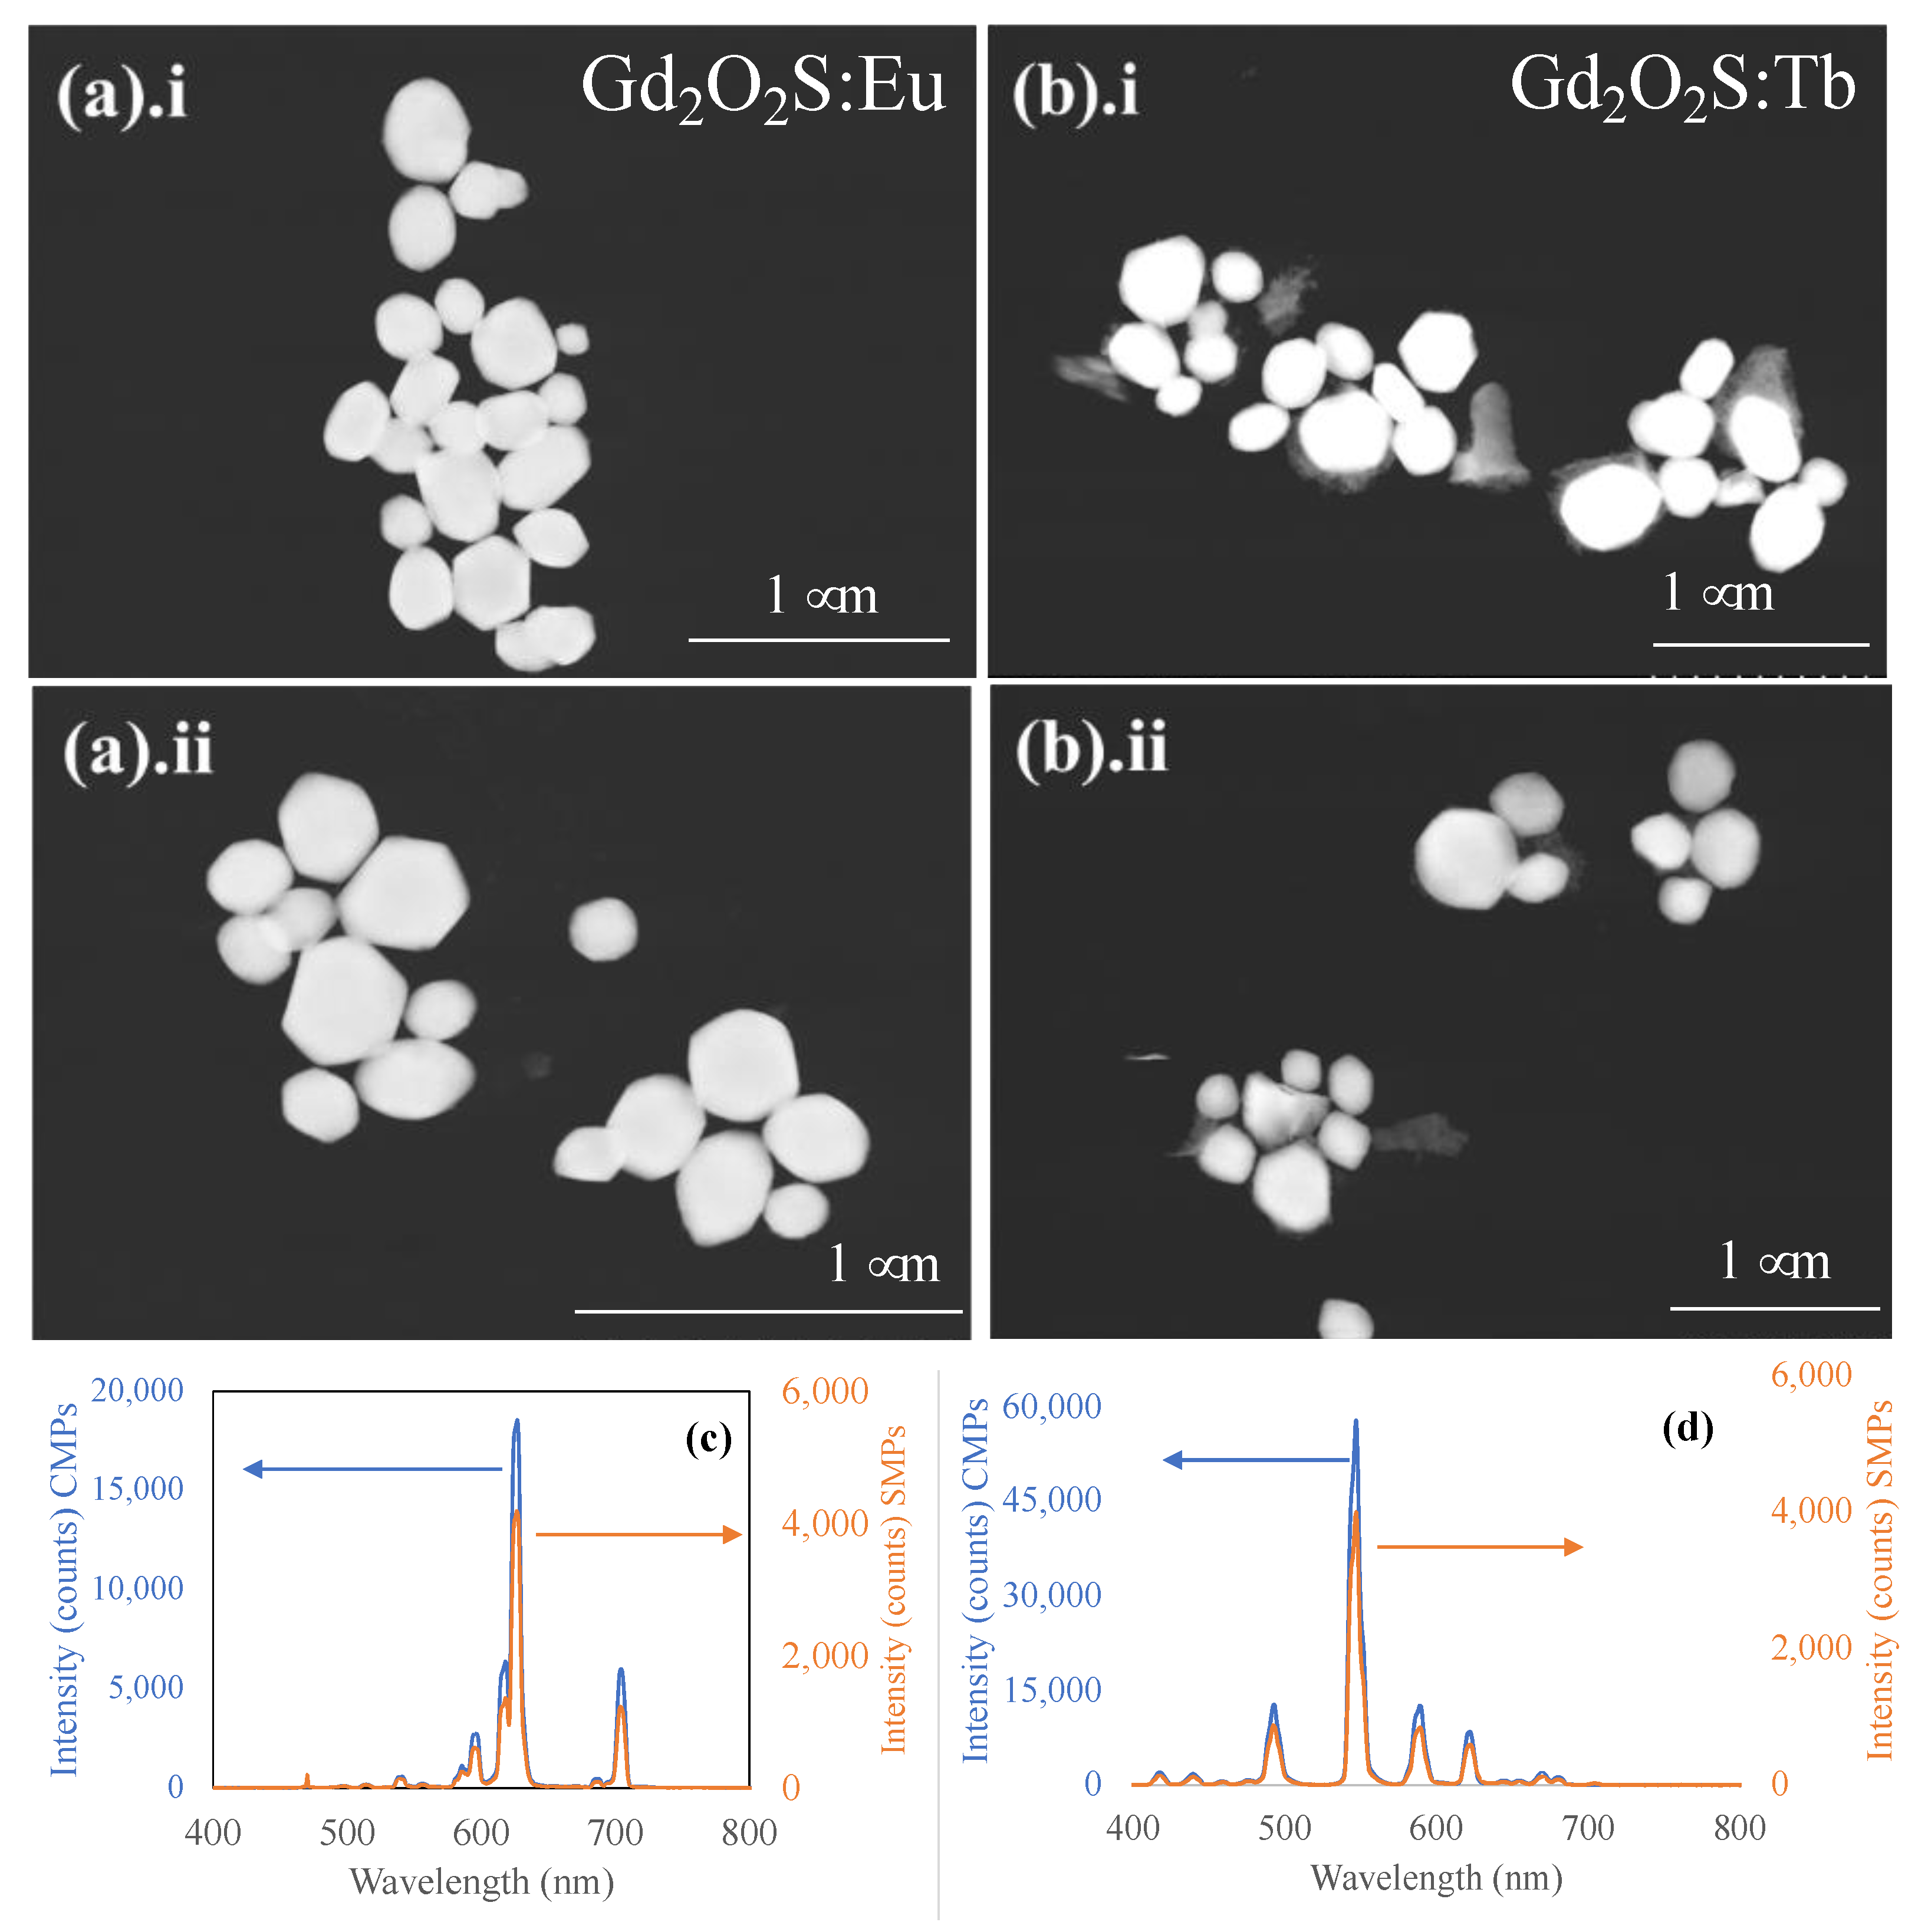
3.5. X-ray-Excited Luminescence Chemical Imaging (XELCI) of Separated Gd2O2S: Eu Particles

To demonstrate that the luminescence of our high-speed centrifugation-separated micro and nanophosphors was sufficiently bright for chemical imaging through tissue, we loaded glass capillary tubes (1 mm inner diameter) with the separated Gd2O2S: Eu particles suspended in DI water and excited them with a focused X-ray source. Using our XELCI scanning system, we imaged the separated nanoparticles sealed in glass capillary tubes beneath ex vivo porcine tissue (~5 mm thick), which portrayed realistic tissue morphology and heterogeneity.
Since tissue attenuates green light more than red light, we imaged the separated red-emitting Gd2O2S: Eu through tissue instead of the green-emitting Gd2O2S: Tb nanophosphors. Two capillaries were prepared using the separated Gd2O2S: Eu micro- and nanophosphors from the two layers, F1 and F2, respectively. Figure 6 shows the XELCI images of the capillary tubes containing luminescent nanophosphors with and without the porcine tissue.
Not surprisingly, a greater intensity signal was detected for the capillaries (i) containing microparticles compared to that of the nanoparticles and (ii) imaged without tissue (Figure 6a) compared to that through tissue (Figure 6b). The last figures in both panels (Figure 6a(iv),b(iv) depict the ratiometric XELCI images superimposed on X-ray images of the capillary tubes containing the micro- and nanoparticles. As is evident from the XELCI images, the nanoparticles had sedimented at the bottom of the capillaries just a few hours after being loaded in the capillary tubes, which are observed as bright lines of sedimented particles inside the capillaries.

4. Conclusions

In summary, we present an inexpensive and robust method for extracting nano- and submicron-sized bright phosphor particles collected from commercially available phosphors mixed in nonuniform and broad ranges of particles sizes. Starting with the commercial Gd2O2S: Eu and Gd2O2S: Tb microphosphors, our sedimentation, followed by high-speed centrifugation process, enabled the separation of nanophosphors in the range of 100–300 nm. Interestingly, our STEM images also reveal the presence of a protective Si coating on the nanophosphors. The X-ray-excited optical luminescence (XEOL) spectra of the separated nanophosphors indicate that they are bright in luminescence for exhibiting an intensity of ~10–20% of the pristine commercial microparticles, which could be imaged with our XELCI setup through 5 mm thick porcine tissue.

Supplementary Materials

The following supporting information can be downloaded at: https://www.mdpi.com/article/10.3390/photonics9050347/s1, Figure S1: XRD and X-ray luminescence spectra of long term ball-milled commercial 8 micron Gd2O2S:Eu particles. Structural characterization of the commercial 8 μm Gd2O2S: Eu microparticles before and after ball milling using (a) X-ray diffraction, (b) crystallite size and strain calculated from Rietveld analysis. (c) Corresponding luminescence intensity of the commercial and ball-milled particles as a function of emission wavelength. The double y-axis represents the luminescence intensity of the following: 0 h ball-milled (Com 8 µm) particles (right axis) and the 1–8 h ball-milled particles (left axis). Figure S2: Electron microscopy and EDX of long term ball-milled commercial 8 micron Gd2O2S:Eu particles. STEM images of the commercial 8 µm Gd2O2S: Eu microparticles before (0 h) (top left panel) and after (3 h) ball milling (top right panel) using STEM. Energy-dispersive X-ray (EDX) of the commercial 8 µm Gd2O2S: Eu microparticles. Figure S3: Photograph showing the separation process of nano- and submicron-sized particles from commercially available phosphors in DI water simply via spontaneous sedimentation under normal gravity in a 1000 mL graduated cylinder. Figure S4: Energy-dispersive X-ray (EDX) analysis of separated nanoparticles from commercial Gd2O2S:Eu 2.5 µm particles. (a) SEM image shows possible Si coating on the nanoparticles. (a) Elemental analysis using EDX confirming the presence of Si. (c) EDX elemental mapping on the same cluster of nanoparticles confirming the presence of Gd, Eu, S, O and Si (starting from left to right). Figure S5: Dynamic light scattering size distribution plot weighted by scattering intensity for separated nanophosphors in DI water of the F1 layer (a) with well-dispersed suspension of diluted nano-sized particles (0.024 mg/mL), (b) showing aggregation after evaporative concentration to 1 mg/mL. Figure S6: Polydispersity index (PDI) obtained through DLS measurements for the F1 layers of the separated (a) Gd2O2S:Eu and (b) Gd2O2S:Tb nanophosphors. The insets show the PdI values calculated for just peak 1 from the square of the standard deviation divided by the square of the mean, for the separated Gd2O2S:Eu and Gd2O2S:Tb particles, respectively.

Author Contributions

Conceptualization, M.A. and J.N.A.; methodology, M.A., M.R., A.C.R., S.B. and J.N.A.; validation, M.A., M.R., A.C.R., S.B. and J.N.A.; formal analysis, M.A., S.B. and J.N.A.; investigation, M.A., M.R., A.C.R. and S.B.; writing—original draft preparation, S.B., M.A. and J.N.A.; writing—review and editing, M.A., M.R., A.C.R., S.B. and J.N.A.; visualization, M.A., M.R., A.C.R. and S.B.; supervision, J.N.A.; project administration, J.N.A.; funding acquisition, J.N.A. All authors have read and agreed to the published version of the manuscript.

Funding

This research was funded by the National Institute of Health, NIH NIBIB grant R01 EB026646. The XELCI scanner was fabricated using funds from NIH NIAMS R01 AR070305-01.

Institutional Review Board Statement

Not applicable.

Informed Consent Statement

Not applicable.

Data Availability Statement

The authors confirm that the data supporting the findings of this study are available within the article (and/or) its Supplementary Materials.

Acknowledgments

The authors would like to acknowledge Clemson Nanomaterials Institute for the use of ball-milling and DLS measurement facilities.

Conflicts of Interest

The authors declare no conflict of interest.

References

  1. Lun, M.C.; Cong, W.; Arifuzzaman, M.; Ranasinghe, M.; Bhattacharya, S.; Anker, J.N.; Wang, G.; Li, C. Focused X-ray luminescence imaging system for small animals based on a rotary gantry. JBO 2021, 26, 036004. [Google Scholar] [CrossRef] [PubMed]
  2. Lun, M.C.; Ranasinghe, M.; Arifuzzaman, M.; Fang, Y.; Guo, Y.; Anker, J.N.; Anker, J.N.; Li, C.; Li, C. Contrast agents for X-ray luminescence computed tomography. Appl. Opt. AO 2021, 60, 6769–6775. [Google Scholar] [CrossRef] [PubMed]
  3. Wang, F.; Raval, Y.; Chen, H.; Tzeng, T.-R.J.; DesJardins, J.D.; Anker, J.N. Development of Luminescent pH Sensor Films for Monitoring Bacterial Growth Through Tissue. Adv. Healthc. Mater. 2014, 3, 197–204. [Google Scholar] [CrossRef] [PubMed] [Green Version]
  4. Uzair, U.; Johnson, C.; Beladi-Behbahani, S.; Rajamanthrilage, A.C.; Raval, Y.S.; Benza, D.; Ranasinghe, M.; Schober, G.; Tzeng, T.-R.J.; Anker, J.N. Conformal Coating of Orthopedic Plates with X-ray Scintillators and pH Indicators for X-ray Excited Luminescence Chemical Imaging through Tissue. ACS Appl. Mater. Interfaces 2020, 12, 52343–52353. [Google Scholar] [CrossRef] [PubMed]
  5. Nune, S.K.; Gunda, P.; Thallapally, P.K.; Lin, Y.-Y.; Forrest, M.L.; Berkland, C.J. Nanoparticles for biomedical imaging. Expert Opin. Drug Deliv. 2009, 6, 1175–1194. [Google Scholar] [CrossRef] [Green Version]
  6. Sudheendra, L.; Das, G.K.; Li, C.; Stark, D.; Cena, J.; Cherry, S.; Kennedy, I.M. NaGdF4:Eu3+ Nanoparticles for Enhanced X-ray Excited Optical Imaging. Chem. Mater. 2014, 26, 1881–1888. [Google Scholar] [CrossRef]
  7. Chen, H.; Wang, F.; Moore, T.L.; Qi, B.; Sulejmanovic, D.; Hwu, S.-J.; Mefford, O.T.; Alexis, F.; Anker, J.N. Bright X-ray and up-conversion nanophosphors annealed using encapsulated sintering agents for bioimaging applications. J. Mater. Chem. B 2017, 5, 5412–5424. [Google Scholar] [CrossRef]
  8. Ranasinghe, M.; Arifuzzaman, M.; Rajamanthrilage, A.C.; Willoughby, W.R.; Dickey, A.; McMillen, C.; Kolis, J.W.; Bolding, M.; Anker, J.N. X-ray excited luminescence spectroscopy and imaging with NaGdF4:Eu and Tb. RSC Adv. 2021, 11, 31717–31726. [Google Scholar] [CrossRef]
  9. Ren, Y.; Winter, H.; Rosch, J.G.; Jung, K.; Duross, A.N.; Landry, M.R.; Pratx, G.; Sun, C. PEGylated β-NaGdF4/Tb@CaF2 Core/Shell Nanophosphors for Enhanced Radioluminescence and Folate Receptor Targeting. ACS Appl. Nano Mater. 2019, 2, 3718–3727. [Google Scholar] [CrossRef]
  10. Zhang, W.; Shen, Y.; Liu, M.; Gao, P.; Pu, H.; Fan, L.; Jiang, R.; Liu, Z.; Shi, F.; Lu, H. Sub-10 nm Water-Dispersible β-NaGdF4: X% Eu3+ Nanoparticles with Enhanced Biocompatibility for in Vivo X-ray Luminescence Computed Tomography. ACS Appl. Mater. Interfaces 2017, 9, 39985–39993. [Google Scholar] [CrossRef]
  11. Thirumalai, J.; Chandramohan, R.; Divakar, R.; Mohandas, E.; Sekar, M.; Parameswaran, P. Eu3+ doped gadolinium oxysulfide (Gd2O2S) nanostructures—synthesis and optical and electronic properties. Nanotechnology 2008, 19, 395703. [Google Scholar] [CrossRef] [PubMed]
  12. Armetta, F.; Saladino, M.L.; Giordano, C.; Defilippi, C.; Marciniak, Ł.; Hreniak, D.; Caponetti, E. Non-conventional Ce:YAG nanostructures via urea complexes. Sci. Rep. 2019, 9, 3368. [Google Scholar] [CrossRef] [PubMed]
  13. van Dijken, A.; Makkinje, J.; Meijerink, A. The influence of particle size on the luminescence quantum efficiency of nanocrystalline ZnO particles. J. Lumin. 2001, 92, 323–328. [Google Scholar] [CrossRef]
  14. Bulin, A.-L.; Vasil’ev, A.; Belsky, A.; Amans, D.; Ledoux, G.; Dujardin, C. Modelling energy deposition in nanoscintillators to predict the efficiency of the X-ray-induced photodynamic effect. Nanoscale 2015, 7, 5744–5751. [Google Scholar] [CrossRef] [PubMed]
  15. Xing, T.; Sunarso, J.; Yang, W.; Yin, Y.; Glushenkov, A.M.; Li, L.H.; Howlett, P.C.; Chen, Y. Ball milling: A green mechanochemical approach for synthesis of nitrogen doped carbon nanoparticles. Nanoscale 2013, 5, 7970–7976. [Google Scholar] [CrossRef] [Green Version]
  16. Heise, M.; Scholz, G.; Krahl, T.; Kemnitz, E. Luminescent properties of Eu3+ doped CaF2, SrF2, BaF2 and PbF2 powders prepared by high-energy ball milling. Solid State Sci. 2019, 91, 113–118. [Google Scholar] [CrossRef]
  17. Rojas-Hernandez, R.E.; Rubio-Marcos, F.; Enríquez, E.; Rubia, M.A.D.L.; Fernandez, J.F. A low-energy milling approach to reduce particle size maintains the luminescence of strontium aluminates. RSC Adv. 2015, 5, 42559–42567. [Google Scholar] [CrossRef]
  18. Cölfen, H. Feature Article: Analytical Ultracentrifugation of Nanoparticles. Polym. News 2004, 29, 101–116. [Google Scholar] [CrossRef]
  19. Svedberg, T.; Rinde, H. The ultra-centrifuge, a new instrument for the determination of size and distribution of size of particle in amicroscopic colloids. J. Am. Chem. Soc. 1924, 46, 2677–2693. [Google Scholar] [CrossRef]
  20. Svedberg, T.; Nichols, J.B. Determination of size and distribution of size of particle by centrifugal methods. J. Am. Chem. Soc. 1923, 45, 2910–2917. [Google Scholar] [CrossRef]
  21. Purcell, E.M. Life at low Reynolds number. Am. J. Phys. 1977, 45, 3–11. [Google Scholar] [CrossRef] [Green Version]
  22. van Eijk, C.W.E. Inorganic scintillators in medical imaging. Phys. Med. Biol. 2002, 47, R85–R106. [Google Scholar] [CrossRef] [PubMed]
  23. Wu, Z.; Liang, Y.; Fu, E.; Du, J.; Wang, P.; Fan, Y.; Zhao, Y. Effect of Ball Milling Parameters on the Refinement of Tungsten Powder. Metals 2018, 8, 281. [Google Scholar] [CrossRef] [Green Version]
  24. Hlabangana, N.; Danha, G.; Muzenda, E. Effect of ball and feed particle size distribution on the milling efficiency of a ball mill: An attainable region approach. S. Afr. J. Chem. Eng. 2018, 25, 79–84. [Google Scholar] [CrossRef]
  25. Patterson, A.L. The Scherrer Formula for X-ray Particle Size Determination. Phys. Rev. 1939, 56, 978–982. [Google Scholar] [CrossRef]
  26. Giri, P.K.; Bhattacharyya, S.; Singh, D.K.; Kesavamoorthy, R.; Panigrahi, B.K.; Nair, K.G.M. Correlation between microstructure and optical properties of ZnO nanoparticles synthesized by ball milling. J. Appl. Phys. 2007, 102, 093515. [Google Scholar] [CrossRef] [Green Version]
  27. Wang, L.; Ma, D.; Guo, C.; Jiang, X.; Li, M.; Xu, T.; Zhu, J.; Fan, B.; Liu, W.; Shao, G.; et al. CsPbBr3 nanocrystals prepared by high energy ball milling in one-step and structural transformation from CsPbBr3 to CsPb2Br5. Appl. Surf. Sci. 2021, 543, 148782. [Google Scholar] [CrossRef]
  28. Praveenkumar, P.; Subashini, T.; Venkatasubbu, G.D.; Prakash, T. Crystallite size effect on low-dose X-ray sensing behaviour of Y2O3 nanocrystals. Sens. Actuators A Phys. 2019, 297, 111544. [Google Scholar] [CrossRef]
  29. Boiko, V.; Dai, Z.; Markowska, M.; Leonelli, C.; Mortalò, C.; Armetta, F.; Ursi, F.; Nasillo, G.; Saladino, M.L.; Hreniak, D. Particle size-related limitations of persistent phosphors based on the doped Y3Al2Ga3O12 system. Sci. Rep. 2021, 11, 141. [Google Scholar] [CrossRef]
  30. Wang, W.-N.; Widiyastuti, W.; Ogi, T.; Lenggoro, I.W.; Okuyama, K. Correlations between Crystallite/Particle Size and Photoluminescence Properties of Submicrometer Phosphors. Chem. Mater. 2007, 19, 1723–1730. [Google Scholar] [CrossRef]
  31. Michail, C.M.; Fountos, G.P.; David, S.L.; Valais, I.G.; Toutountzis, A.E.; Kalyvas, N.E.; Kandarakis, I.S.; Panayiotakis, G.S. A comparative investigation of Lu2SiO5:Ce and Gd2O2S:Eu powder scintillators for use in X-ray mammography detectors. Meas. Sci. Technol. 2009, 20, 104008. [Google Scholar] [CrossRef]
Figure 1. Gravitational/centrifugal separation of nano/submicron-sized particles from commercial several micron-sized phosphors. (a) Gd2O2S:Eu pristine particles being suspended in deionized water. (b) The 2.5 micron-sized Gd2O2S:Eu particle layers suspended in sucrose fluoresces under UV exposure exhibiting a clear gradient in size due to gravitational force pulling the heavier particles down to the bottom of the tube. (c) A schematic of the two forces acting on the suspended particles, viz., the gravitational force ( F g r a v i t y ) balanced by the viscous drag ( F d r a g ). Calculated settling distance vs. time for various particle diameters for sedimentation at (d) 1 g and (e) 1000 g , respectively [ g = 9.8 ms−2].
Photonics 09 00347 g001
Figure 2. Short-term ball milling of commercial Gd2O2S:Eu 2.5 micron particles. Structural characterization of the commercial 2.5 μm Gd2O2S: Eu microparticles before and after ball milling using (a) STEM and (b) X-ray diffraction. (c) Corresponding luminescence intensity of the commercial and ball-milled particles. Inset shows the magnified plot of luminescence intensity of the ball-milled particles only.
Photonics 09 00347 g002
Figure 3. Particles separation via spontaneous sedimentation in a sucrose solution gradient column. (a) STEM images of Gd2O2S: Eu nanoparticles (NPs) (left), submicron particles (SMPs) (middle) separated from 2.5 μm commercial Gd2O2S: Eu microparticles (MPs) (right) via spontaneous sedimentation in a sucrose gradient solution. The luminescence spectra of the separated Gd2O2S: Eu (b) NPs and (c) SMPs compared to those of the commercial mixed larger MPs.
Photonics 09 00347 g003
Figure 4. Particle separation via spontaneous sedimentation using DI water as a dispersion medium. STEM images of nano- and submicron-sized particles of (a). (i,ii) Gd2O2S:Eu and (b). (i,ii) Gd2O2S:Tb separated from 2.5 μm commercial microparticles (CMPs) via sedimentation under normal gravity. Corresponding luminescence spectra of the separated nano- and submicron particles (SMPs) (c) Gd2O2S:Eu and (d) Gd2O2S:Tb particles compared to those of the pristine commercial 2.5 μm microparticles.
Photonics 09 00347 g004
Figure 5. Particles separation via high-speed centrifugation simply using DI water as a dispersive medium. STEM images of nanometer-sized particles separated from 2.5 µm Gd2O2S:Eu [(a). (i,ii)] and 8–10 µm average diameter Gd2O2S:Tb [(b). (i,ii)] commercial microparticles (CMPs) via centrifugal sedimentation in DI water.
Photonics 09 00347 g005
Figure 6. XELCI images of Eu-doped Gd2O2S pristine commercial microparticles (CMPs) and separated nanoparticles (SNPs) in glass capillaries (1 mm inner diameter). (a) XELCI images without tissue (i) image of intensity (counts) vs. pixel number at 625 nm (ii) image of intensity (counts) vs. pixel number at 700 nm (iii) Ratiometric XELCI image (intensity ratio of 625 nm and 705 nm vs. pixel number) (b) XELCI images with 5 mm thick porcine tissue (i) image of intensity (counts) vs. pixel number at 625 nm (ii) image of intensity (counts) vs. pixel number at 705 nm (iii) Ratiometric XELCI image (intensity ratio of 600 nm and 700 nm vs. pixel number). (iv) corresponding images both in (a) and (b) Superimposed I6 image and X-ray images.
Photonics 09 00347 g006
Publisher’s Note: MDPI stays neutral with regard to jurisdictional claims in published maps and institutional affiliations.

