Abstract
Infrared images can provide clear contrast information to distinguish between the target and the background under any lighting conditions. In contrast, visible images can provide rich texture details and are compatible with the human visual system. The fusion of a visible image and infrared image will thus contain both comprehensive contrast information and texture details. In this study, a novel approach for the fusion of infrared and visible images is proposed based on a dual-discriminator generative adversarial network with a squeeze-and-excitation module (DDGANSE). Our approach establishes confrontation training between one generator and two discriminators. The goal of the generator is to generate images that are similar to the source images, and contain the information from both infrared and visible source images. The purpose of the two discriminators is to increase the similarity between the image generated by the generator and the infrared and visible images. We experimentally demonstrated that using continuous adversarial training, DDGANSE outputs images retain the advantages of both infrared and visible images with significant contrast information and rich texture details. Finally, we compared the performance of our proposed method with previously reported techniques for fusing infrared and visible images using both quantitative and qualitative assessments. Our experiments on the TNO dataset demonstrate that our proposed method shows superior performance compared to other similar reported methods in the literature using various performance metrics.
1. Introduction
Image fusion is a technique to gather all the important information from multiple images to produce fewer images or a single comprehensive and informative image for subsequent processing functions [1]. In particular, the image fusion technique is widely used in infrared and visible images for object detection and target recognition applications [2,3,4]. Infrared (IR) images can provide enhanced contrast between the target object and the background which is an important feature in imaging systems. However, IR images usually do not provide detailed texture which leads to low quality or low resolution images. On the other hand, visible images have the advantage of higher resolution and detailed texture information at the expense of poor contrast between target object and the background. Figure 1 illustrates examples of visible and infrared images of a same scene. As seen in Figure 1, the visible images contain rich texture details but poor contrast (top row), while IR images have high contrast (bottom row) and poor texture details. Image fusion can combine the advantages of IR and visible images to provide high quality images with detailed texture and high contrast. As such, image fusion technology is an important technique which can illustrate the target information in a complete and clear manner.
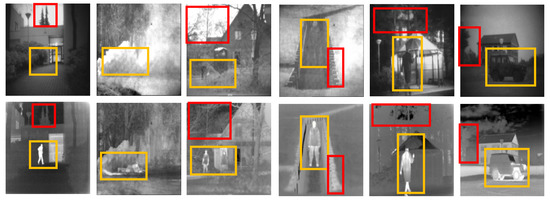
Figure 1.
Illustration of visible (top row) and infrared (bottom row) images of the same scene. It is clear that the visible images contain rich texture details (top row), as show in the red boxes, while the infrared images have high contrast (bottom row), as shown in the orange boxes.
The key aspect of image fusion is to extract the most important information from the input images and fusing them into an image containing all important information from the input images. For IR and visible images, the most important information are contrast and texture details and as such, a fused image should contain both information. Many fusion methods for IR and visible images have been introduced in the past decades. These methods can be classified into traditional methods and deep learning methods. Typical traditional methods include multi-scale transformation-based methods, sparse representation-based methods [5,6], subspace-based methods [7], saliency-based methods [8,9], hybrid methods [10,11,12], and other fusion methods [13,14,15]. In these methods, information extraction and fusion rules are designed manually to achieve a better fusion performance. However, due to the diversity of information extraction and fusion rule designs, fusion methods have become increasingly complex. Recently, deep learning methods have been applied extensively for image fusion tasks with IR and visible images, such as FusionGAN [16], Densefuse [17], convolutional sparse representation [18], proportional maintenance of gradient and intensity [19], and other methods [20,21,22]. Although existing methods have yielded good results under most conditions, there are certain limitations that should not be overlooked.
First, most of the proposed generative adversarial networks (GAN) [23] only utilize one discriminator for image fusion. These methods only retain the information of one source image and can lose a significant amount of information from the other source image, resulting in a final fused image which does not contain all the details from source images.
Second, with most of the existing methods, it is difficult to achieve a good balance in maintaining all of the source image information.
Finally, in the case where the actual problem of utilizing one discriminator is not addressed, it is not sufficient to rely only on the loss function to solve the problem.
To overcome these limitations, we propose a dual-discriminator-based GAN with squeeze-and-excitation (SE) networks [24]. Our main contributions are summarized as follows. First, we used a GAN with dual discriminators. The two discriminators are trained with the generator to ensure that the fused image retains the high contrast of the IR image and the richly detailed texture information of the visible image. We use the source image as the real data for comparison with the fused image to ensure that the fused image is analogous to the source image.
Second, we added SE networks to the generator to assist in learning the correlation between channels, screen out attention for the channel, and further improving the performance of the network.
Third, a dense connection is added to the generator to realize feature reuse and solve the problem of gradient vanishing.
Next, we have designed a specific loss function comprising two parts: LG and LD. The generator loss integrates the traditional loss, which further enhances the constraint of the generator. At the same time, the discriminator loss focuses more on the relationship between the original image and fused image. LD has two parts: LDi and LDV; the LDi loss function improves the contrast information of the fused image through confrontation training, and the LDV loss function further enriches the details of the fused image. The loss function designed in this study is crucial for obtaining a larger amount of information from source images, including contrast information and detailed texture information.
Finally, the dual-discriminator GAN with squeeze-and-excitation module (DDGANSE) network is tested on the TNO dataset. Our extensive experimental data clearly demonstrate that our proposed fusing technique has significant advantages compared to other existing methods.
2. Methods
This chapter describes in detail the DDGANSE method proposed in this study. First, the overall framework of the DDGANSE is explained in detail. Second, we describe the network architecture for the generator and discriminator. Finally, we provide details regarding the loss of function of the network.
2.1. Overall Framework
As illustrated in Figure 2, the DDGANSE framework consist of two main parts. The first part is the generator. We have added the SE module based on the traditional convolutional neural network and reasonably use the advantage of a dense connection. The second part is the discriminator, which is improved using a traditional GAN. In this study, two discriminators are used for adversary learning. In addition, adversarial learning between the generation and discrimination networks can effectively correct the prediction error.
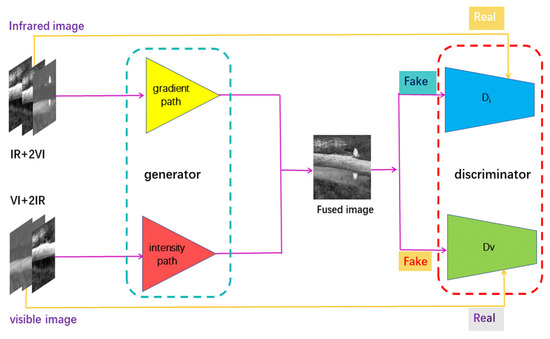
Figure 2.
Overall fusion framework of our DDGANSE.
2.2. DDGANSE of the Generator
The generator part of the network architecture is illustrated in Figure 3. We divide the generator into two paths, a gradient path and a contrast path, to extract information in a complete and clear manner. The gradient path mainly extracts the texture information which is mainly represented in the visible images with few information in the IR images.
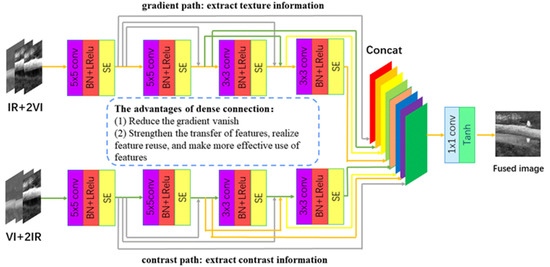
Figure 3.
Network architecture of the generator.
Therefore, one IR and two visible images together comprise the input of the gradient path as indicated in Figure 3 (top path). Similarly, the contrast path will extract the contrast information of the target object and the background where IR images contain more information than visible images. Therefore, two IR images and one visible image together comprise the input of the contrast path as indicated in Figure 3 (bottom path).
The experimental results on the TNO dataset using the proposed network architecture is presented in Table 1. We used a four-layer convolutional neural network in each information extraction path. The first and second layers use 5 × 5 filters, and the third and fourth layers utilize 3 × 3 filters. The stride in each layer is set to 1 with batch normalization and the Leaky ReLU activation function. In contrast to the ReLU activation function, the Leaky ReLU activation function assigns a non-zero slope to all negative values (instead of setting all assignments to zero in ReLU). As a result, the utilization of the Leaky ReLU function solves the problem of neuron death encountered with the ReLU function. In addition, we added a SE module after each convolutional layer. The SE module can help with learning the correlation between channels to allow the image generated by the generator to contain more information from the source image. On this basis, we also added dense connections to the generator. Using dense connections enables the mitigating gradient disappearance enhancing feature delivery, and feature reuse, which allows the generator to use the feature information of the source image more effectively and enhance the network properties of the generator. Among them, we use two paths to extract information from the generator, and introduce the attention module in the generator, which is also one of the main differences between this study and DDcGAN [25].

Table 1.
Quantization results for the selection of 3 × 3 and 5 × 5 filters in DDGANSE on the TNO dataset (the best value is marked in yellow, and the second-best value is marked in red).
We then fuse the features proposed in the two paths using the concat method. To merge the information from the source images completely, the fused images are processed by a 1 × 1 kernel convolution with a stride size of 1 and a Tanh activation function. Throughout the process, we use convolutions with a stride size of 1 and therefore, the size of the feature map is the same as the size of the input image.
2.3. DDGANSE of the Discriminator
The DDGANSE of the discriminator is illustrated in Figure 4. In our DDGANSE architecture, we use two discriminators. Di is used to discriminate the fused image and IR image, and Dv is used to discriminate the fused image and visible image. Both discriminators are composed of four convolution layers and a linear layer. According to the experimental results presented in Table 1, the four convolutional layers use 3 × 3 convolution kernels and the Leaky ReLU activation function. In addition, batch normalization is added to the last three convolution layers and the step size of each convolutional layer is set to be 2. The architecture of discriminator is not similar to generator network. The reason is that the discriminator is a classifier which first obtains the feature maps from the input image and proceeds to categorize them. Thus, by assigning the stride to 2, it functions similar to a pooling layer. The linear layer discriminates the input against the features extracted from the first four convolutional layers and outputs the categorization probabilities. The contrast of the fusion image can be improved by confrontation training of the Di discriminator, and the texture details can be enriched by learning of the DV discriminator. The adversarial network containing two discriminators enables the generator to generate fused images that not only contain rich detailed information but also have significant contrast. For the dual discriminator part, our network structure is different from DDcGAN. We use four-layer convolution and add pool layer and linear layer. In summary, the performance of the fused image can be improved by utilizing two discriminators.
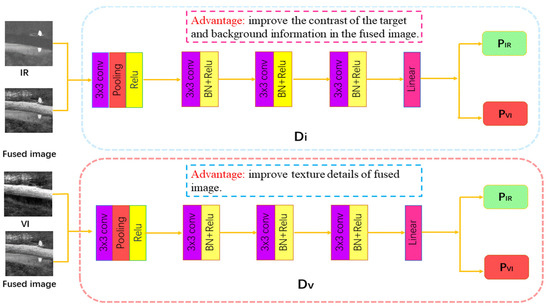
Figure 4.
Network architecture of discriminators.
2.4. Loss Function
The loss function of our DDGANSE consists of two components: the loss function LG, and the loss functions LDi and LDv, which will be described one by one. The loss function of G (LG) consists of two terms and can be obtained as,
in which LG is the general loss of the generator, and λ is applied to strike a balance between LDDGANSE(G) and Lcontent. The first term on the right side of the equation, LDDGANSE(G), means the adversarial loss between G, and Di and Dv, and is defined as,
where represents the fused image with , N denotes the count of fused images, and and are the output probabilities of the discriminator, where corresponds to discriminator Di discriminating the fused image from the IR image, and corresponds to discriminator Dv discriminating the fused image from the visible image. Since the generator is not expecting the discriminator to be able to discriminate between the fused image and the real image, both and are set to be 1. The second term, Lcontent, represents the content loss. Our content loss function consists of two parts: contrast loss and gradient loss. The contrast loss constrains the contrast between the target object and the background, and the gradient loss causes the fused image to have more abundant texture information. Specifically, Lcontent is defined as,
In this case H and W represent the height and width of the input images, respectively. and are constants that ought to be modified to accomplish the primary and secondary correlation between the parameters in Equation (3).
The contrast loss is then defined as
Additionally, the gradient loss is defined as
where Ifused is the fused image generated by the DDGANSE, Iir is the IR source image, Ivis is the visible source image, ‖ ⋅ ‖F indicates the matrix Frobenius norm, and ∇ is the gradient operator.
The discriminators in DDGANSE are DV and Di; DV is used to distinguish the source image from the visible image, and Di is used to discriminate the source image from the IR image. Through the adversary loss of the discriminators, the generator can generate a fusion image closer to the source image. The discriminator loss is defined as:
where b, bi, and bv stand for the labels of the fused image Ifused, IR image, Ii, and visible image, Iv, respectively. and stand for the classification results of the visible and fused images, separately; and and indicate the classification outcomes of the IR and fused images, respectively.
3. Experiments
In this chapter, we evaluate the performance of the proposed DDGANSE using the TNO dataset. To evaluate the merits of our proposed method, we compare the image-fusing performance of our approach to seven published methods in the literature. These methods are LPP [26] , LP [27] , CVT [28] , DTCWT [29] , GTF [30] , CNN [31] , GANMcC [32] , PMGI [33] , FusionGAN , DDcGAN, RFN-Nest [34] , and RCGAN [35] . We also provide an additional ablation experiment to compare the proposed DDGANSE with FusionGAN, GANMcC, PMGI, and DDcGAN. First, we introduce the TNO dataset. Second, we demonstrate the evaluation index used in the experiments. Finally, in order to evaluate the performance of DDGANSE, we analyze our approach according to qualitative and quantitative aspects.
3.1. Data
We evaluate DDGANSE and other comparison methods using the TNO dataset. The image pairs in the TNO dataset consisted mainly of various military scenes. In the TNO dataset, there are 60 infrared and visible image pairs, as well as three more serials involving 19, 32, and 23 image pairs. For testing, we used 16 image pairs from the TNO dataset. For training, we adopted overlapping cropping strategies for extension of the data set.
3.2. Training Details
The generator and discriminator are trained repeatedly, with a percentage of training times r. The batch size is represented by b, and it takes m steps to iterate through the entire training data, and the total number of training epochs is M. In practice, we set b = 32, r = 1/2, M = 10, and m as the ratio between the total number of patches and b. The original learning rate as 0.0001, and Adam is used as the optimizer. The overall training process is described in the summary of Algorithm 1.
| Algorithm 1: Training procedure for DDGANSE. |
| 1: for M epochs do |
| 2: for m steps do |
| 3: for r times do |
| 4: Select b visible patches ; |
| 5: Select b infrared patches ; |
| 6: Select b fused patches ; |
| 7: Update the parameters of the discriminator by |
| Adam Optimizer: ∇D(LD); |
| 8: end for |
| 9: Select b visible patches ; |
| 10: Select b infrared patches ; |
| 11: Update the parameters of the generator by |
| AdamOptimizer: ∇G(LG); |
| 12: end for |
| 13: end for |
The experiments were carried out on a workstation in our laboratory, which was configured with an Intel® Xeon(R) CPU E5-2620 v4 @ 2.10 GHz × 32 and equipped with two 12 GB TITAN Xp graphics cards.
3.3. Performance Metrics
The quality assessment of image fusion is a sophisticated problem and therefore, we conducted not just a qualitative assessment but also a quantitative one.
In this study, we use the structural similarity index (SSIM) [36], peak signal-to-noise ratio (PSNR), entropy (EN) [37], sum of the correlations of differences (SCD) [38], correlation coefficient (CC) [39], and standard deviation (SD) [40] for assessment of the network fusion performance.
(1) Structural Similarity Index (SSIM)
SSIM is applied to model the image loss and distortion, and it measures the structural similarity between the source and fused images. The larger the value of SSIM, the better the structure is maintained.
(2) Peak Signal-to-Noise Ratio (PSNR)
PSNR is an image quality evaluation index based on error sensitivity. It is a full-reference image quality evaluation index. It is the most common and widely used objective image evaluation index.
PSNR is used to measure the ratio between the effective information and noise of an image, which can reflect whether the image is distorted. A larger PSNR value indicates less distortion of the image and a higher image quality.
(3) Entropy (EN)
EN measures the amount of information contained in a fused image. EN is the most commonly used metric to represent the amount of information in an image, and a large EN value indicates that the fused result contains a large volume of information.
(4) Sum of the Correlations of Differences (SCD)
SCD is a similarity measurement. SCD will achieve the maximum value if images t and t’ are identical. In contrast, SCD will achieve the minimum value −1 when the absolute difference is always equal to π. The SCD metric is primarily concerned with the difference between the fused image and the source image, and then measures the correlation between the difference and the other source image. To a certain extent, SCD can also evaluate pseudo-information. It means that the larger the SCD value, the less pseudo-information the image contains.
(5) Correlation Coefficient (CC)
CC measures the degree of linear correlation between the fused image and source images. The larger the CC, the more similar the fused image is to the source images, and as a result, the better the fusion performance.
(6) Standard Deviation (SD)
SD is defined based on the statistical concept and reflects the extent to which the values of individual pixels in the image vary from the average value. The regions with high contrast always attract the attention of the human eye, and the fused image with higher contrast often leads to a larger SD, which represents a better visual effect of the fused image.
3.4. Results for the TNO Dataset
(1) Qualitative Comparison
Figure 5 presents the results of our proposed network architecture. The fused image shows that DDGANSE is clearly better than the other popular fusion methods, including FusionGAN , GANMcC , PMGI, and DDCGAN . On the one hand, the DDGANSE retains the characteristics of IR images with a rich thermal radiation information which can clearly identify the target from the background. This is crucial as most existing algorithms only have good texture details, but lose most of the thermal radiation information which leads to weak target detection. On the other hand, while reserving plenty of thermal radiation information, the results of DDGANSE still retain a high amount of texture details from visible images.
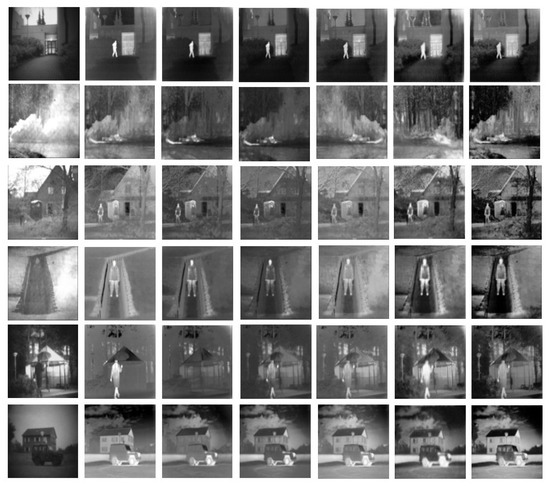
Figure 5.
Qualitative results for the TNO dataset. From left to right: visible images, infrared images, and fused results with FusionGAN, GANMcC, PMGI, DDCGAN, and DDGANSE (Ours).
The image display of the fusion results is shown in Figure 5. The four fusion algorithms mentioned above can be roughly divided into two types. In the first type, the fusion results retain the advantages of the IR images. Although there is a strong contrast between the background and the target, the texture details are not sufficiently rich, as shown in Figure 6. In the FusionGAN method in the first row and the third column and the PMGI method in the first row and fourth column, the object (person) and the background information (tree) have obvious contrast, but the texture details of the tree are unclear. In comparison (the fifth column in Figure 6), our proposed method contains more texture details. In the second type of fusion algorithm, the fused image retains more information from the visible light image. Although the result has rich texture information, the contrast between the target and the background is not obvious, e.g., the DDCGAN method in the first row and third column of Figure 7. In the resulting image, it is almost impossible to find objects (boats and people) in the background (forest). However, the details of the forest are relatively clear. In contrast, the method proposed in this study can clearly distinguish people and ships in the fusion results. In summary, compared with the other four methods, DDGANSE contains rich texture information on top of the obvious contrast, as shown in the first row and last column of Figure 5. In our results, the contrast between the person (the target) and the tree (the background) is very strong, and tree texture details are equally clear.
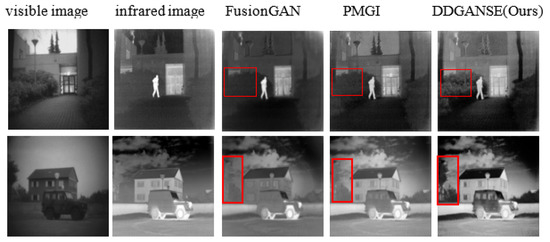
Figure 6.
Comparison of texture details in the experimental results. From left to right: visible images, infrared images, and fused results obtained with fusionGAN, PMGI, and DDGANSE (ours).
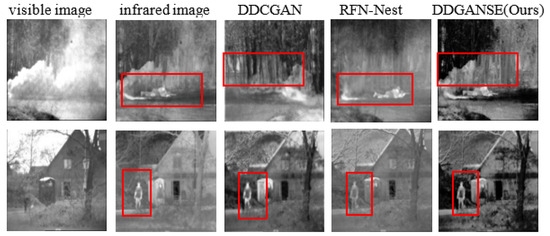
Figure 7.
Comparison of the contrast between target information and background information in the experimental results. From left to right: visible images, infrared images, and fused results obtained with DDCGAN, RFN-Nest, and DDGANSE (ours).
(2) Quantitative Assessment of Fusion Networks
Quantification results for DDGANSE for different performance metrics is demonstrated in Table 2. According to performance metrics in Table 2, It is clear that our method of DDGANSE has the best fusion performance in comparison with other advanced methods, including LPP , LP , CVT , DTCWT , GTF , CNN, FusionGAN, GANMcC, PMGI, DDCGAN, RFN-Nest , and RCGAN . The SSIM is 0.86, PSNR is 19.60, EN is 7.09, SCD is 1.79, CC is 0.52, and SD is 0.13. The detail of the quantitative results can be seen in Figure 8 and Figure 9. Based on the above results, the fusion method of DDGANSE has the obvious advantages of strong contrast and rich texture details over former methods.
Table 2.
Quantification results for our proposed method and state-of-art fusion methods (the best value is marked in yellow, and the second-best value is marked in red).
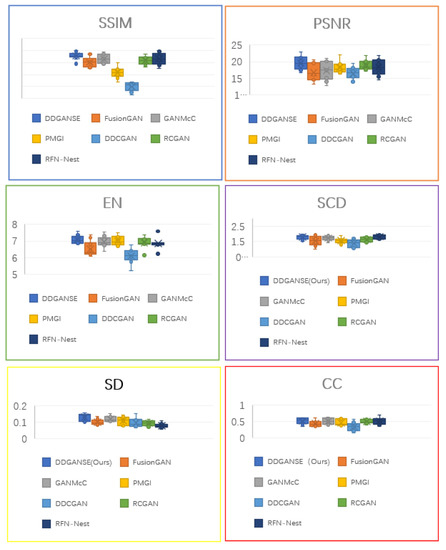
Figure 8.
Box charts of the quantitative results for six indicators of infrared and visible image fusion.
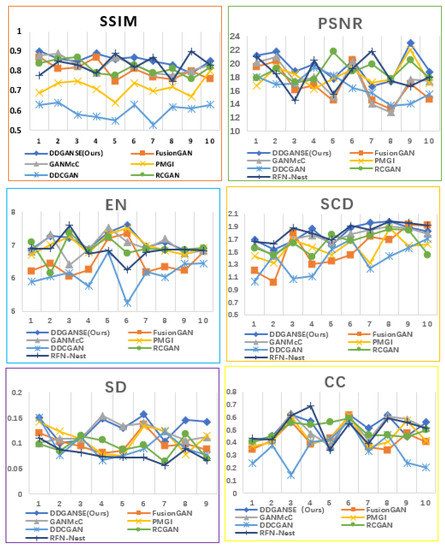
Figure 9.
Line charts of the quantitative results for six indicators of infrared and visible image fusion.
(3) Advantages of the DDGANSE Architecture
As seen in Table 3, each of the technological innovations in the DDGANSE method improves the performance of the image fusion and the performance of the network. To further evaluate our method, DDGANSE without two discriminators (only the generator), without one discriminator (generator with only one discriminator), and without SE (two discriminators but a generator without SE) are implemented individually. As shown in Figure 10, our networks are superior to the single-discriminator GAN. A network with only one discriminator can only retain the advantages of one source image in the fused image. For example, the advantages of richly detailed information from the visible image can be retained, but the contrast would be poor, as shown in the red boxes in the third and sixth columns in Figure 10. Alternatively, only the contrast advantage of the IR image can be retained while the texture details are neglected, as shown in the yellow boxes in the third and sixth columns in Figure 10. In this study, a dual discriminator network is presented to preserve both the detail and contrast of the source image in the fused image. In addition, we also include an SE module in the generator part of the network. In Figure 10, the sixth column is better than the fifth column, indicating that the SE module can help the network learn important feature information and improve the performance of the generator. This is because the SE can facilitate learning the correlation between channels, which allows the image generated by the generator to contain more information from the source image. The quantitative results are shown in Figure 11. It is clear that DDGANSE exhibits better performances.
Table 3.
Quantification results is for our proposed method with different innovative components. (The best value is marked in yellow, and the second-best value is marked in red).
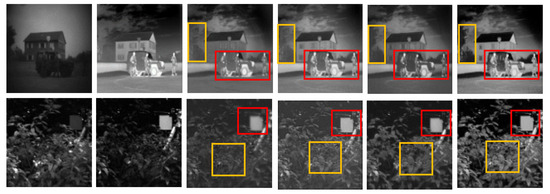
Figure 10.
Comparison of the segmentation results of DDGANSE with different innovative components. From left to right: visible images, infrared images, and fused results of DDGANSE without two discriminators, DDGANSE without one discriminator, DDGANSE without the SE module, and the complete DDGANSE.
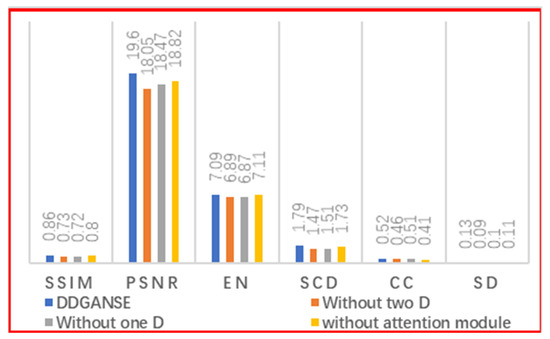
Figure 11.
Quantification results for DDGANSE for different performance metrics.
(4) Complexity Evaluation
We calculated the running time required to apply the above method for image fusion, which can illustrate the complexity of the DDGANSE.
In the training process, the generator and discriminator are trained many times. At this point, the overall number of parameters is the sum of the parameters in the generator and discriminator, which is approximately 3.168 M. These parameters require approximately 180 min for optimization. In the testing process, only the generator is used to generate fused images, and the number of parameters used for testing is 1.867 M. Since the generator is used to complete the task of image fusion, comparing the average running times of various methods during the testing phase gives an indication of the time complexity of the methods. The results are presented in Table 4. Even though the operational efficiencies of FusionGAN and LP are slightly higher than that of DDGANSE, as can be seen from Table 2, the fusion effect of our method is superior compared to both methods.
Table 4.
Average running times of different methods (unit: second).
4. Conclusions
In the present study, an efficient infrared and visible image fusion method called DDGANSE is proposed. Based on the characteristics of visible and infrared images, it is desirable that the fused images have the high contrast of infrared images and rich texture details of visible images. The proposed DDGANSE method utilizes a generator with two paths and two discriminators to realize a fusion task. Extensive experiments on the TNO dataset indicated that the best performance can be achieved using our proposed DDGANSE method compared to other similar reported methods in the literature.
Author Contributions
Conceptualization, Z.S. and H.L.; methodology, J.W. and J.R.; software, J.R.; validation, J.W. and J.R.; formal analysis, J.W. and J.R.; investigation, Z.L.; resources, J.W.; data curation, J.R.; writing—original draft preparation, J.R.; writing—review and editing, J.W. and Y.E.M.; visualization, J.R. and Z.Y.; supervision, J.W. and C.L.; project administration, Q.H. and H.X. All authors have read and agreed to the published version of the manuscript.
Funding
This research received no external funding.
Informed Consent Statement
Informed consent was obtained from all subjects involved in the study.
Conflicts of Interest
The authors declare no conflict of interest.
References
- Ma, J.; Ma, Y.; Li, C. Infrared and visible image fusion methods and applications: A survey. Inf. Fusion 2019, 45, 153–178. [Google Scholar] [CrossRef]
- Das, S.; Zhang, Y. Color Night vision for navigation and surveillance. Transp. Res. Rec. J. Transp. Res. Board 2000, 1708, 40–46. [Google Scholar] [CrossRef]
- Li, H.; Wu, X.-J.; Durrani, T. NestFuse: An Infrared and Visible Image Fusion Architecture Based on Nest Connection and Spatial/Channel Attention Models. IEEE Trans. Instrum. Meas. 2020, 69, 9645–9656. [Google Scholar] [CrossRef]
- Yang, Y.; Que, Y.; Huang, S.; Lin, P. Multiple Visual Features Measurement with Gradient Domain Guided Filtering for Multisensor Image Fusion. IEEE Trans. Instrum. Meas. 2017, 66, 691–703. [Google Scholar] [CrossRef]
- Yang, Y.; Zhang, Y.; Huang, S.; Zuo, Y.; Sun, J. Infrared and Visible Image Fusion Using Visual Saliency Sparse Representation and Detail Injection Model. IEEE Trans. Instrum. Meas. 2021, 70, 1–15. [Google Scholar] [CrossRef]
- Zhang, Q.; Liu, Y.; Blum, R.S.; Han, J.; Tao, D. Sparse representation based multi-sensor image fusion for multi-focus and multi-modality images: A review. Inf. Fusion 2018, 40, 57–75. [Google Scholar] [CrossRef]
- Kong, W.; Lei, Y.; Zhao, H. Adaptive fusion method of visible light and infrared images based on non-subsampled shearlet transform and fast non-negative matrix factorization. Infrared Phys. Technol. 2014, 67, 161–172. [Google Scholar] [CrossRef]
- Zhang, X.; Ma, Y.; Fan, F.; Zhang, Y.; Huang, J. Infrared and visible image fusion via saliency analysis and local edge-preserving multi-scale decomposition. J. Opt. Soc. Am. A 2017, 34, 1400–1410. [Google Scholar] [CrossRef]
- Zhao, J.; Chen, Y.; Feng, H.; Xu, Z.; Li, Q. Infrared image enhancement through saliency feature analysis based on multi-scale decomposition. Infrared Phys. Technol. 2014, 62, 86–93. [Google Scholar] [CrossRef]
- Ma, J.; Zhou, Z.; Wang, B.; Zong, H. Infrared and visible image fusion based on visual saliency map and weighted least square optimization. Infrared Phys. Technol. 2017, 82, 8–17. [Google Scholar] [CrossRef]
- Li, S.; Yang, B.; Hu, J. Performance comparison of different multi-resolution transforms for image fusion. Inf. Fusion 2011, 12, 74–84. [Google Scholar] [CrossRef]
- Liu, Y.; Liu, S.; Wang, Z. A general framework for image fusion based on multi-scale transform and sparse representation. Inf. Fusion 2015, 24, 147–164. [Google Scholar] [CrossRef]
- Wang, H.; Li, S.; Song, L.; Cui, L.; Wang, P. An Enhanced Intelligent Diagnosis Method Based on Multi-Sensor Image Fusion via Improved Deep Learning Network. IEEE Trans. Instrum. Meas. 2020, 69, 2648–2657. [Google Scholar] [CrossRef]
- Ma, J.; Chen, C.; Li, C.; Huang, J. Infrared and visible image fusion via gradient transfer and total variation minimization. Inf. Fusion 2016, 31, 100–109. [Google Scholar] [CrossRef]
- Zhao, J.; Cui, G.; Gong, X.; Zang, Y.; Tao, S.; Wang, D. Fusion of visible and infrared images using global entropy and gradient constrained regularization. Infrared Phys. Technol. 2017, 81, 201–209. [Google Scholar] [CrossRef]
- Ma, J.; Yu, W.; Liang, P.; Li, C.; Jiang, J. FusionGAN: A generative adversarial network for infrared and visible image fusion. Inf. Fusion 2019, 48, 11–26. [Google Scholar] [CrossRef]
- Li, H.; Wu, X.-J. DenseFuse: A Fusion Approach to Infrared and Visible Images. IEEE Trans. Image Process. 2019, 28, 2614–2623. [Google Scholar] [CrossRef] [Green Version]
- Liu, Y.; Chen, X.; Ward, R.K.; Wang, Z.J. Image fusion with convolutional sparse representation. IEEE Signal Process. Lett. 2016, 23, 1882–1886. [Google Scholar] [CrossRef]
- Li, H.; Wu, X.; Kittler, J. MDLatLRR: A Novel Decomposition Method for Infrared and Visible Image Fusion. IEEE Trans. Image Process. 2020, 29, 4733–4746. [Google Scholar] [CrossRef] [Green Version]
- Li, H.; Wu, X.; Durrani, T. Infrared and visible image fusion with ResNet and zero-phase component analysis. Infrared Phys. Technol. 2019, 102, 103039. [Google Scholar] [CrossRef] [Green Version]
- Zhong, J.; Yang, B.; Li, Y.; Zhong, F.; Chen, Z. Image Fusion and Super-Resolution with Convolutional Neural Network. In Proceedings of the Informatics and Intelligent Applications, Cairo, Egypt, 24–26 October 2016; Springer Science and Business Media LLC: Berlin/Heidelberg, Germany, 2016; pp. 78–88. [Google Scholar]
- Toet, A. Image fusion by a ratio of low-pass pyramid. Pattern Recognit. Lett. 1989, 9, 245–253. [Google Scholar] [CrossRef]
- Goodfellow, I.; Pouget-Abadie, J.; Mirza, M.; Xu, B.; Warde-Farley, D.; Ozair, S.; Courville, A.; Bengio, Y. Generative Adversarial Networks. Adv. Neural Inf. Process. Syst. 2014, 63, 2672–2680. [Google Scholar] [CrossRef]
- Hu, J.; Shen, L.; Albanie, S.; Sun, G.; Wu, E. Squeeze-and-Excitation Networks. IEEE Trans. Pattern Anal. Mach. Intell. 2020, 42, 2011–2023. [Google Scholar] [CrossRef] [PubMed] [Green Version]
- Ma, J.; Xu, H.; Jiang, J.; Mei, X.; Zhang, X.-P. DDcGAN: A Dual-Discriminator Conditional Generative Adversarial Network for Multi-Resolution Image Fusion. IEEE Trans. Image Process. 2020, 29, 4980–4995. [Google Scholar] [CrossRef] [PubMed]
- Wang, Z.; Bovik, A. A universal image quality index. IEEE Signal Process. Lett. 2002, 9, 81–84. [Google Scholar] [CrossRef]
- Nencini, F.; Garzelli, A.; Baronti, S.; Alparone, L. Remote sensing image fusion using the curvelet transform. Inf. Fusion 2007, 8, 143–156. [Google Scholar] [CrossRef]
- Lewis, J.J.; O’Callaghan, R.J.; Nikolov, S.G.; Bull, D.R.; Canagarajah, N. Pixel-and region-based image fusion with complex wavelets. Inf. Fusion 2007, 8, 119–130. [Google Scholar] [CrossRef]
- Gan, W.; Wu, X.; Wu, W.; Yang, X.; Ren, C.; He, X.; Liu, K. Infrared and visible image fusion with the use of multi-scale edge-preserving decomposition and guided image filter. Infrared Phys. Technol. 2015, 72, 37–51. [Google Scholar] [CrossRef]
- Liu, Y.; Chen, X.; Cheng, J.; Peng, H.; Wang, Z. Infrared and visible image fusion with convolutional neural networks. Int. J. Wavelets Multiresolut. Inf. Process. 2018, 16, 1850018. [Google Scholar] [CrossRef]
- Minahil, S.; Kim, J.-H.; Hwang, Y. Patch-Wise Infrared and Visible Image Fusion Using Spatial Adaptive Weights. Appl. Sci. 2021, 11, 9255. [Google Scholar] [CrossRef]
- Ma, J.; Zhang, H.; Shao, Z.; Liang, P.; Xu, W. GANMcC: A generative adversarial network with multiclassification constraints for infrared and visible image fusion. IEEE Trans. Instrum. Meas. 2020, 70, 1–14. [Google Scholar] [CrossRef]
- Zhang, H.; Xu, H.; Xiao, Y.; Guo, X.; Ma, J. Rethinking the Image Fusion: A Fast Unified Image Fusion Network based on Proportional Maintenance of Gradient and Intensity. In Proceedings of the AAAI Conference on Artificial Intelligence, New York, NY, USA, 7–12 February 2020; The AAAI Press: Palo Alto, CA, USA, 2020; Volume 34, pp. 12797–12804. [Google Scholar] [CrossRef]
- Li, H.; Wu, X.-J.; Kittler, J. RFN-Nest: An end-to-end residual fusion network for infrared and visible images. Inf. Fusion 2021, 73, 72–86. [Google Scholar] [CrossRef]
- Li, Q.; Lu, L.; Li, Z.; Wu, W.; Liu, Z.; Jeon, G.; Yang, X. Coupled GAN with Relativistic Discriminators for Infrared and Visible Images Fusion. IEEE Sens. J. 2021, 21, 7458–7467. [Google Scholar] [CrossRef]
- Burt, P.; Adelson, E. The Laplacian Pyramid as a Compact Image Code. IEEE Trans. Commun. 1983, 31, 532–540. [Google Scholar] [CrossRef]
- Van Aardt, J.; Roberts, J.W.; Ahmed, F. Assessment of image fusion procedures using entropy, image quality, and multispectral classification. J. Appl. Remote Sens. 2008, 2, 023522. [Google Scholar] [CrossRef]
- Aslantas, V.; Bendes, E. A new image quality metric for image fusion: The sum of the correlations of differences. AEU-Int. J. Electron. Commun. 2015, 69, 1890–1896. [Google Scholar] [CrossRef]
- Deshmukh, M.; Bhosale, U. Image fusion and image quality assessment of fused images. Int. J. Image Process. 2010, 4, 484. [Google Scholar]
- Rao, Y.-J. In-fibre bragg grating sensors. Meas. Sci. Technol. 1997, 8, 355. [Google Scholar] [CrossRef]
Publisher’s Note: MDPI stays neutral with regard to jurisdictional claims in published maps and institutional affiliations. |
© 2022 by the authors. Licensee MDPI, Basel, Switzerland. This article is an open access article distributed under the terms and conditions of the Creative Commons Attribution (CC BY) license (https://creativecommons.org/licenses/by/4.0/).