Abstract
The defocus curve (DC) has become the gold standard method for assessing the visual performance at different distances, and hence, to evaluate the depth of focus that is provided by modern presbyopia-compensating intraocular lenses that are used in cataract surgery. A former study, carried out by other authors, reported that the DC method, based on placing the chart at far distance and using trial negative lenses, underestimated the visual acuity that was measured by varying the test distance (VD) in pseudophakic patients. We have revisited the issue with pseudophakic subjects and have extended the study to include young phakic observers with their natural accommodation preserved. Our results show that both the VD and DC methods are equivalent in precision and accuracy and can be used indistinctly. However, the DC method is more practical in the clinics because it does not require further control of the chart positioning and illuminance.
1. Introduction
The broad use of various presbyopia-correcting strategies in ophthalmic compensation aim to achieve near-, intermediate-, and far-distinct vision has led to test the visual acuity (VA) at different distances -or vergence values- and plot the outcomes in the form of a defocus curve. The object region with distinct vision can be related to the depth of focus in the retinal image space. This concept is very useful to evaluate the subjective amplitude of accommodation of presbyopia-correction strategies [1]; in particular, it has been widely used and recommended in cataract and refractive surgery since the implantation, first, of bifocal and multifocal intraocular lenses (IOLs) [2], and later, extended depth of focus (EDOF) IOLs [3,4].
A method to test the depth of focus and draw up a defocus curve consists of placing an optotype chart at different distances from the patient whose VA is being assessed [5,6]. Hereinafter, we use the abbreviated form, VD method, to refer to such a method based on varying the test distance. Although the visual observation of the test in the VD method would be natural for the emmetropic eye, this procedure has important disadvantages in practice: it requires scaled charts with proper angular image sizes and control of luminance. Moreover, eyes with refractive errors would need, in all cases, trial spectacles for best distance correction.
Alternatively, a defocus curve is obtained in clinical studies by defocusing the patient with trial lenses while keeping the optotype chart at a constant far distance. With this standard and more convenient procedure, hereinafter named the defocus curve (DC) method, the clinician optically simulates a range of object vergences. The best-corrected distance refraction must be used to ensure the subject’s vision is optimally corrected for the testing distance [3,4]. The chart is placed typically at the distance corresponding to far vision. Such a distance in clinical settings is traditionally set at six meters (20 ft) from the patient, although, in practice, an ambiguous region from four meters to infinity is often assumed to represent distance vision. IOL standards, however, indicate that, during a clinical study, refractions at a given distance should be adjusted to infinity [7].
The defocus curve has become the gold standard metric for assessing the visual performance at different distances, more specifically, to evaluate the depth of focus that is provided by a variety of modern presbyopia-compensating IOLs [1,2] and yet to explore correlation with on-bench optical measurements [8]. According to the Food and Drugs Administration (FDA) recommendations [3], the monocular defocus curve should measure the visual acuity between 1.50 D and −2.50 D in 0.5 D or 0.25 D defocus steps. It is common to consider larger ranges [3], even though defocus measurements are time consuming for the practitioner and boring for the patient. The useful range of vision is limited to the negative object vergences (i.e., objects placed in front of the subject).
A concern is raised about the hypothetical equivalence of both the DC and VD methods. Pieh et al. [9] addressed the issue studying a group of monofocal pseudophakic patients and investigating whether changes in VA that were caused by different object distances were reproducible by defocusing. They concluded that the DC method was not suitable for determining possible VA at near object distances and should be used only as a comparative method for evaluating the depth of focus. More specifically, Pieh et al. found that the DC method underestimated the VA values that were measured with the VD method, even after applying two corrections: one, for the diminution of minus lenses, with 1% per diopter, and two, for the starting test position at six meters from the patient. The authors hypothesized a physiological reason for the discrepancies that were observed between the results that were obtained with the VD and DC methods. Since accommodation was not possible after cataract surgery, the differences should be due to the disrupted natural pupil response that is associated to convergence (miosis) in the DC method. The work that was reported by Pieh et al. was echoed by other researchers who also proposed a mathematical compensation of the lens-induced magnification [10,11]. Pieh and colleagues’ investigation [9] has led us to revisit the issue and extend the comparison of the two VD and DC methods to young phakic observers with their natural accommodation preserved. By including young subjects, we analyse the possible influence of two features that are not present in a pseudophakic group: accommodation and high VA. If VD and DC methods are equivalent, these features will not play any role, but they still will allow us to broaden and deepen the analysis. Moreover, by expanding the research to young subjects, who naturally reach high VA values, we attempt to cover the range of intermediate and near-vision distances with more precision and accuracy than limiting the study to just monofocal pseudophakic subjects. To date, and to the best of our knowledge, we have not found any study that has conducted this extended experiment yet.
The basic question could be expressed as: in the context of intermediate and near-vision, is vergence by a negative lens equivalent to changing the distance of the object? Although the question can be considered rather simple at first, it is relevant and useful for the clinical practice to sustain the answer with further experimental results that were carefully obtained for various subject’s conditions.
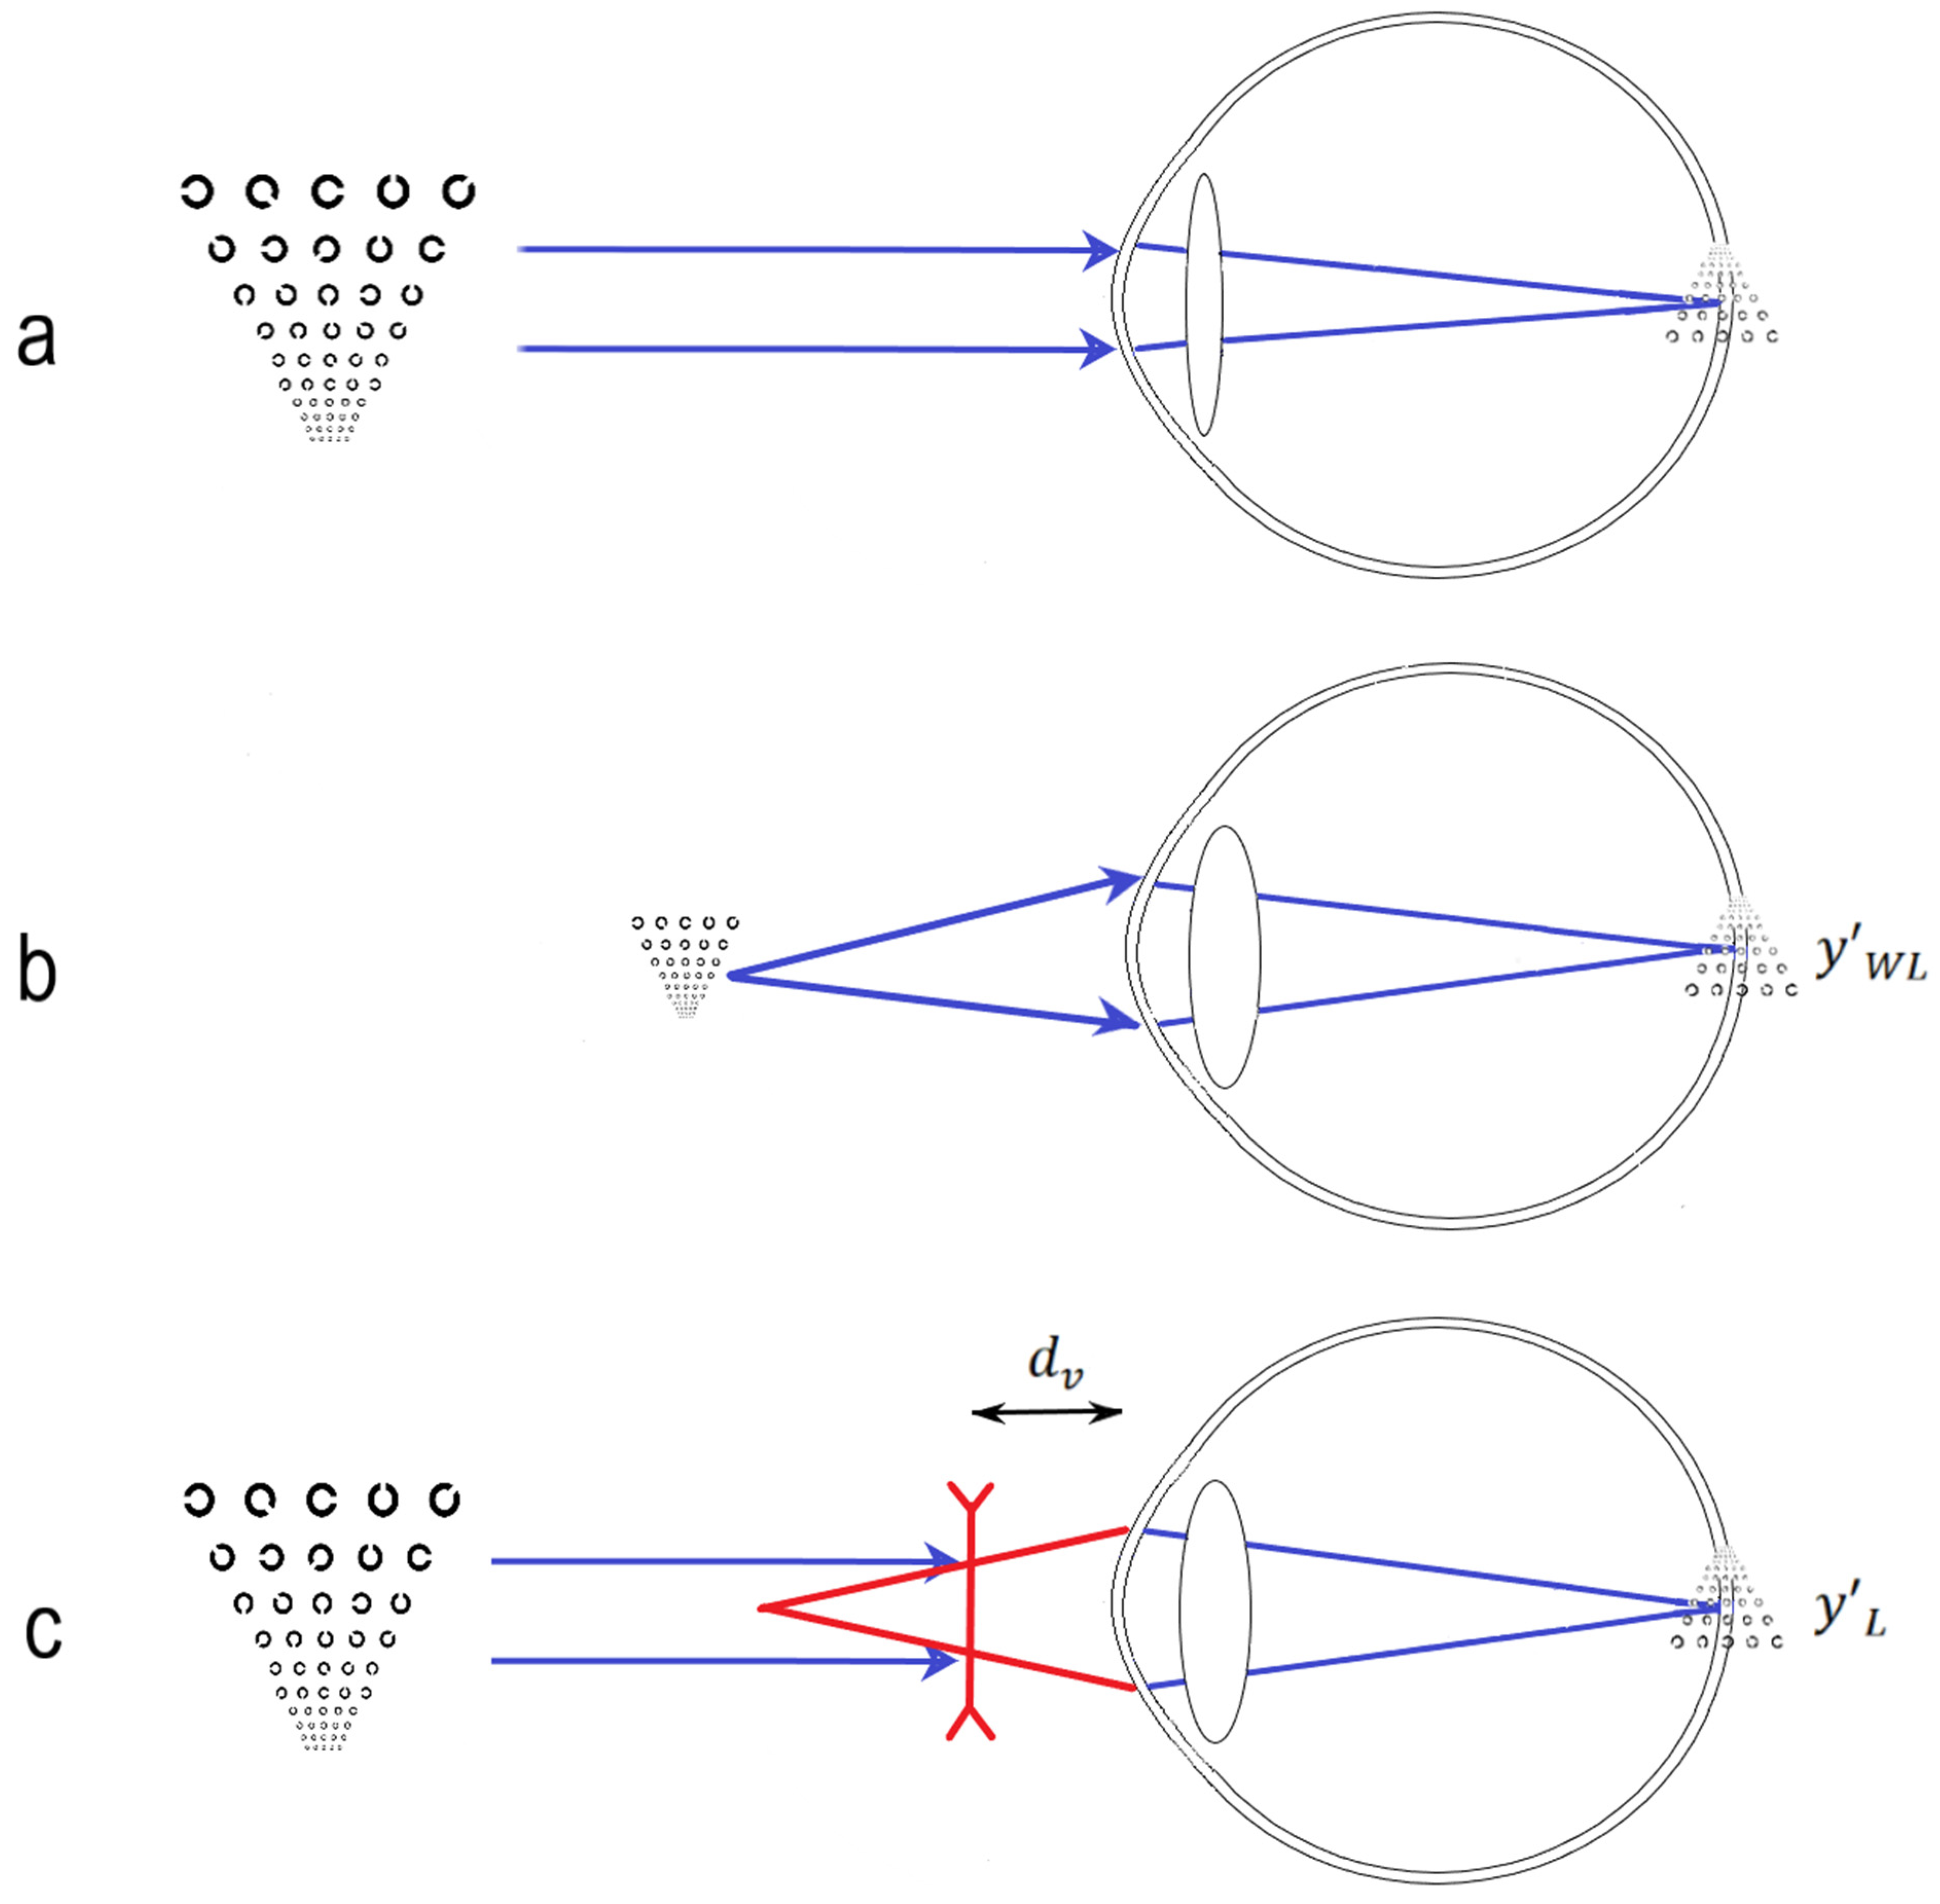
The purpose of this work is to evaluate the equivalence of the VD and DC methods through the assessment of the best-distance-corrected high-contrast VA for different object distances in two groups: young phakic subjects and pseudophakic monofocal patients. After best-distance-correction the pseudophakic monofocal group, as in the experiment that was carried out by Pieh et al. [9], can focus only on a distance chart, while the young phakic observers, with accommodation preserved, can focus on a test at a range of distances (Figure 1). The same six distances will be tested in both groups with the two methods using custom optotypes, control of the angular optotype size, and luminance. Plots of VA versus defocus will be drawn up from the VA outcomes in logMAR scale. The results will be discussed and compared with those that were reported by Pieh et al. [9].
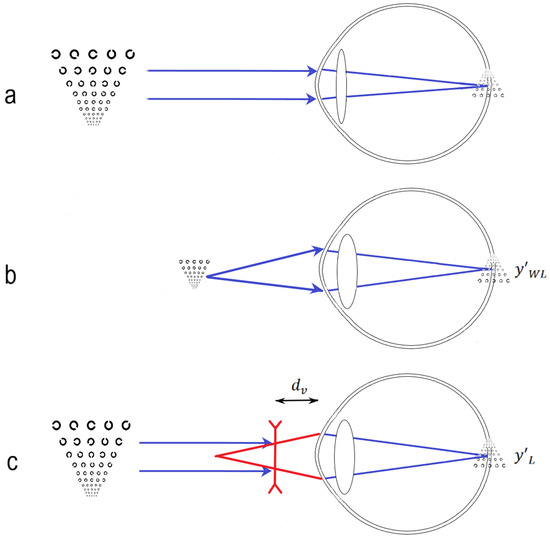
Figure 1.
Visual observation of a C-Landolt test chart by an emmetropic young phakic eye with accommodation preserved in different circumstances: (a) far vision with the optotype in infinity. The retinal image is in focus; (b) near-vision, with the optotype at a near distance. The eye accommodates sufficiently to bring the image of size to focus onto the retina; and (c) near-vision, with the optotype in infinity and a minus trial lens placed at from the eye vertex. The virtual image that is formed by the lens simulates a near object vergence. Eye accommodation brings the final image to focus onto the retina, now with size .
2. Materials and Methods
2.1. Subjects
We recruited 50 subjects: 35 young phakic subjects and 15 pseudophakic patients that were implanted with a monofocal IOL.
The participants of the phakic group were students from the Faculty of Optics and Optometry of the Universitat Politècnica de Catalunya-BarcelonaTECH, in Terrassa (Barcelona, Spain) with a mean age of 24.6 years ± 3.4 standard deviation (SD) (range 19 to 30 years). The inclusion criteria were visual acuity with refractive correction that was better than 0.1 logMAR, refractive error (spherical equivalent) less than ±5.0 D and accommodation preserved. The presence of any ocular pathology and accommodation disorders were grounds for exclusion.
The participants of the pseudophakic group were patients from the Hospital de Mataró (Consorci Sanitari del Maresme, Barcelona, Spain) with a mean age of 72.3 ± 3.2 years (range 67 to 78 years) who had undergone cataract surgery. All the patients were implanted with a monofocal intraocular lens (EyeCee One, Bausch&Lomb, Rochester, NY, USA) (mean power 23.1 ± 2.4 D).
The surgery was performed between one and three months before the examination. The inclusion criteria were patients that were undergoing cataract surgery using the phacoemulsification technique, with monofocal intraocular lens implant, post-surgical VA with refractive correction that was better than 0.1 logMAR, and a prior refractive error (spherical equivalent) that was less than ±5.0 D. The key exclusion criteria were complications during or post-surgery and prior ocular pathology or ocular surgery. After surgery, the evaluated mean distance correction was 0.50 ± 0.37 D sph and −0.69 ± 0.41 D cyl.
Informed consent was obtained from all the participants, following an explanation of the study examinations in accordance with the tenets of the Declaration of Helsinki. Ethical approval was obtained from the Ethical Committee of the Hospital de Mataró (Consorci Sanitari del Maresme, Barcelona, Spain).
2.2. Materials
We used six optotype charts that were designed on purpose and printed for measuring VA in this study. The angular size of the stimulus was calculated for the testing distances of 5.0 m, 3.5 m, 1.0 m, 66 cm, 50 cm, and 33 cm. The optotypes consisted of a high contrast black stimulus on a white background. The stimuli were presented aligned in groups of five; the test area and spacing between stimulus agreed the ISO 8596:2018 [12] to avoid a crowding effect. The stimulus size of successive lines followed decimal progression in steps of 0.1 decimal. Unlike the recommended logarithmic progression, this design permitted smaller increments in the stimulus size, thus allowing us to detect subtle VA variations [13]. These additional decimal acuity grades, permitted by ISO 8596 (2018) [12], are particularly necessary when assessing young healthy observers, who can generally reach high VA levels. The high-resolution printing quality of the 66 cm, 50 cm, and 33 cm charts was checked with a microscope to ensure adequacy. We used printing techniques that can achieve accurate print sizes of the stimulus with a deviation that was no larger than 0.01–0.03 mm.
We chose Landolt rings as stimuli for the measurement of VA, in accordance to the recommendations of the Universal Ophthalmological council of 1984 and the guidelines set by the ISO 8596 standard [12,14]. The Landolt ring is the reference optotype for our VA measurement. We chose the 8-position test to minimize the possibility of obtaining false positives and avoid cognitive issues. A total of three C Landolt charts were printed and used for each tested distance to prevent memorization during the VA assessment.
The measurements were taken in a room with uniform artificial illumination. Additionally, a Thorlabs MCWHL5 white LED light source with adjustable intensity was used in all test distances to illuminate the optotypes in a direction that was slightly deviated from the observation direction to avoid specular artifacts. The illuminance on the optotypes was constantly controlled with a Mavolux 5032C photometer and set to 600 Lux. The background luminance of the chart was 145 ± 10 cd/m2.
2.3. Method
Monocular VA with the refractive correction was assessed at six distances (5.0 m, 3.5 m, 1 m, 66 cm, 50 cm, and 33 cm) by two methods:
- (1)
- VD method: by varying the distance from the subject, using six optotype charts made on purpose and placed at the fixed positions.
- (2)
- DC method: by a defocus curve, placing the optotype chart at 5 m and defocusing with negative lenses to simulate the fixed vergences.
All examinations of subjects in both groups were carried out by three experienced optometrists. Retinoscopy and subjective refraction (Rx) at 5 m using a trial frame and a standard spectacle trial lens set was performed in both groups prior to the experiment. To ensure that the accommodation was preserved in all the young phakic subjects, monocular accommodation facility at 50 cm (with ±2.00 D lenses) and monocular accommodation amplitude were previously tested.
The subjects were prompted once for each VA. According to ISO standard 8596 [12], the criterion for determination the VA grade corresponded to the last visual level where the subject called correctly 3 stimuli out of the 5 that were presented in the same line. If a subject was not emmetropic, their Rx was used in all the measurements that were performed subsequently. A vergence of −0.20 D, corresponding to the VA assessment at the distance position of 5.0 m, was included in the manifest refraction to adjust the measurements to infinity.
VA was measured monocularly [4] with the eye of better VA, under natural pupil, with the custom optotypes at 5.0 m, 3.5 m, 1.0 m, 66 cm, 50 cm, and 33 cm, which belong to the negative range of vergences. Positive object vergences within the range that is recommended by FDA [3] were not considered in our work because they can only be implemented with the DC method, that is, using trial lenses, and not with the VD method. Therefore, since the DC and VD methods cannot be compared in the positive range of vergence, we limited ourselves to test the negative range.
The order of the distance chart presentation was randomized in the VD method. The DC method was performed with the 5 m-optotype chart. A set of minus lenses (−0.25 D, −1.0 D, −1.5 D, −2.0 D, and −3.0 D) were added to optically simulate the corresponding object distances (3.5 m, 1.0 m, 66 cm, 50 cm, and 33 cm). The trial lens was randomized within the set as well. Before statistical analysis, decimal VA values that were obtained through the DC and VD methods were converted to the logMAR equivalent values [15].
We evaluated the diminution of the retinal image size for each lens power that was used in the examinations at a vertex distance of (Figure 1c) from the eye. This diminution was calculated using the reduced eye model compensated by a thin lens. Thus, we calculated first the size and magnification of the virtual image that was formed by a back vertex power negative trial lens of an object that was placed at 5.0 m away. This image, in turn, became an object for the eye, which accommodated to bring the final image to focus onto the retina. The size ratio of the retinal images that were obtained with () (Figure 1c) and without a trial lens () (Figure 1b), called spectacle magnification or fractional change (), is [16].
Considering that the product takes small values in general in our study, Equation (1) can be approached by . For a −3 D trial lens (the most powerful lens of our study and, therefore, the least favourable case), we obtained , which implies a 3.6% diminution on the retinal image size. In general, the diminution is approximately 1.2% per diopter of lens power. We have applied such FC to the test size to evaluate how the visual acuity would be affected by the observation through the negative lenses (the more severe the diminution of the optotype identified correctly, the higher the actual VA). For VA = 0.0 logMAR, the actual VA value through a −3 D lens, which produces the greatest change (3.6% diminution), should be corrected to VA = −0.012. This tiny correction has no relevance in the general clinical practice. It can be neglected because is much smaller than the uncertainty (0.1 logMAR) that is existing between two successive lines of the chart in the logMAR scale.
Statistical analysis was performed using SPSS software version 13.0 (SPSS Inc., Chicago, IL, USA). Descriptive statistics (mean and standard deviation) were used to characterize the sample. The Kolmogorov–Smirnov test was used to determine whether the results that were obtained from each measurement followed a normal distribution. The Wilcoxon test was used for non-normal-distributed data to assess the differences of VA between the two methods for each distance. p-values that were under 0.05 were considered statistically significant and, when multiple comparisons were made, the relevance of Bonferroni corrections were considered [17].
3. Results
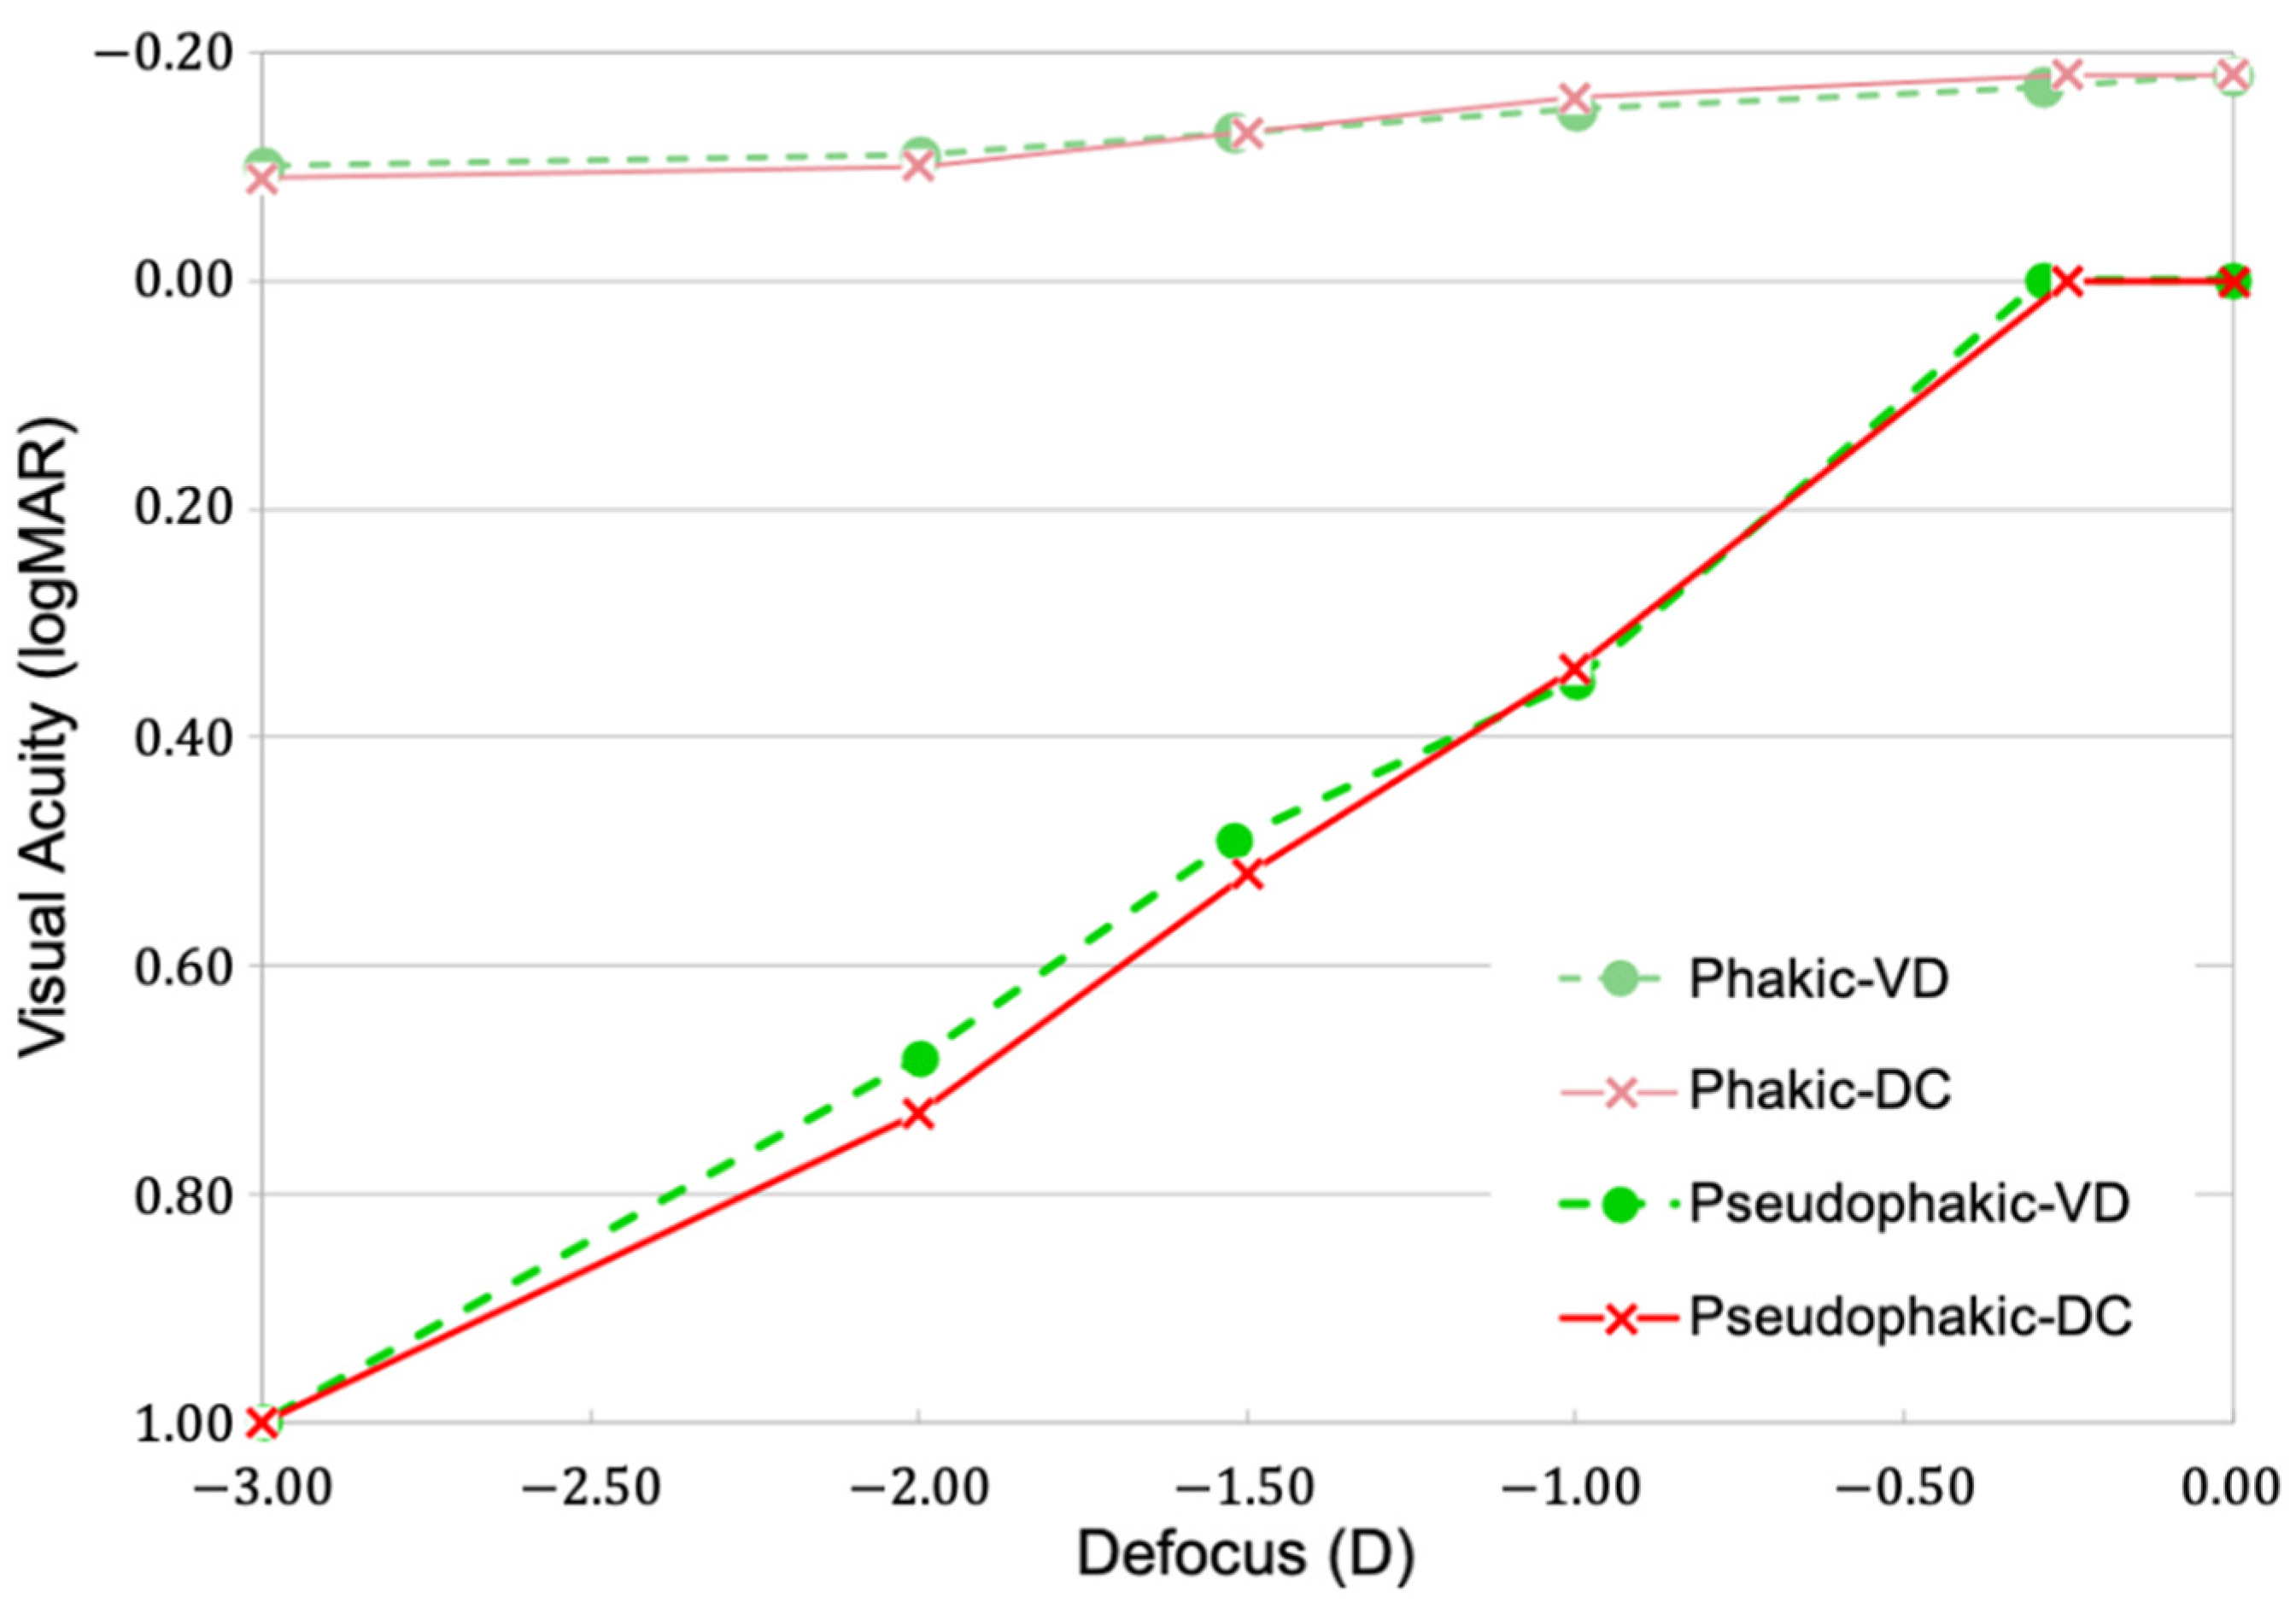
We measured the VA with the DC and VD methods at the six fixed distances following the procedures that are described above. We set 0.0 D defocus with the chart at 5 m from the subject in both the VD and DC methods. The uncorrected results (i.e., without applying any correction for the five meter distance position of the chart and the diminution of minus lenses) are shown in Table 1 and plotted in Figure 2. According to them, both the methods led to very similar VA results in the two groups for all the tested defocus conditions. The comparison of the VA that was obtained by the two methods was assessed with the Wilcoxon test. The results showed no significant effect of the method that was used at any condition of the VA that was tested in the two groups.

Table 1.
Visual acuity (mean (SD), uncorrected results) that was obtained with the VD and DC methods in the phakic and pseudophakic groups. The measurements were taken with the best distance correction. The accommodative stimulus of 3.5 m is rounded from 0.285 D to 0.29 D. p values > 0.05 appear boldface.
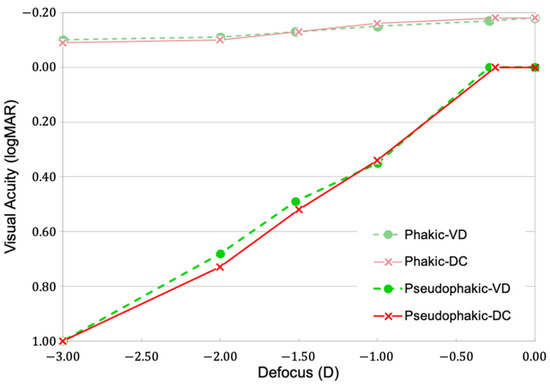
Figure 2.
Visual acuity (logMAR, uncorrected results) versus defocus that was obtained with the VD and DC methods for the phakic (with accommodation preserved) and pseudophakic groups. All the measurements were taken with the best distance correction.
Although the expected changes were little, we have applied the two mentioned corrections to the defocus curve results for further accuracy. The vergence (−0.20 D) of measuring VA at 5 m was already included in the manifest refraction that was used for best distance correction. Therefore, we set 0.0 D defocus at such distance in both the VD and DC methods. For each position of the chart in the VD method, the corrected defocus was equal to the object vergence minus (−0.20 D) of distance correction. In the DC method, with the chart at a constant distance of five meters and assuming the best distance correction for this chart position, defocus was just given by the power of each additional trial lens. Further adjustment of the retinal image size due to the diminution of minus lenses, with 1.2% per diopter, was considered also. The VA values (logMAR) that were obtained with the DC method were recalculated accordingly. Table 2 shows the corrected results with both the VD and DC methods for the two groups of subjects. Mean pairwise VA values comparison at each distance showed no statistically significant differences between the two methods (VD and DC) in both groups.

Table 2.
The corrected VA values (mean ± SD) for a starting position of the chart at 5 m (−0.2 D) in both the VD and DC methods and a diminution of the minus lenses in the DC method. The measurements were taken with the best distance correction. p values > 0.05 appear boldface.
Despite the multiple comparisons, the Bonferroni correction was not applied because none of the VA differences reached statistical significance (all p > 0.05 in Table 1 and Table 2) [17].
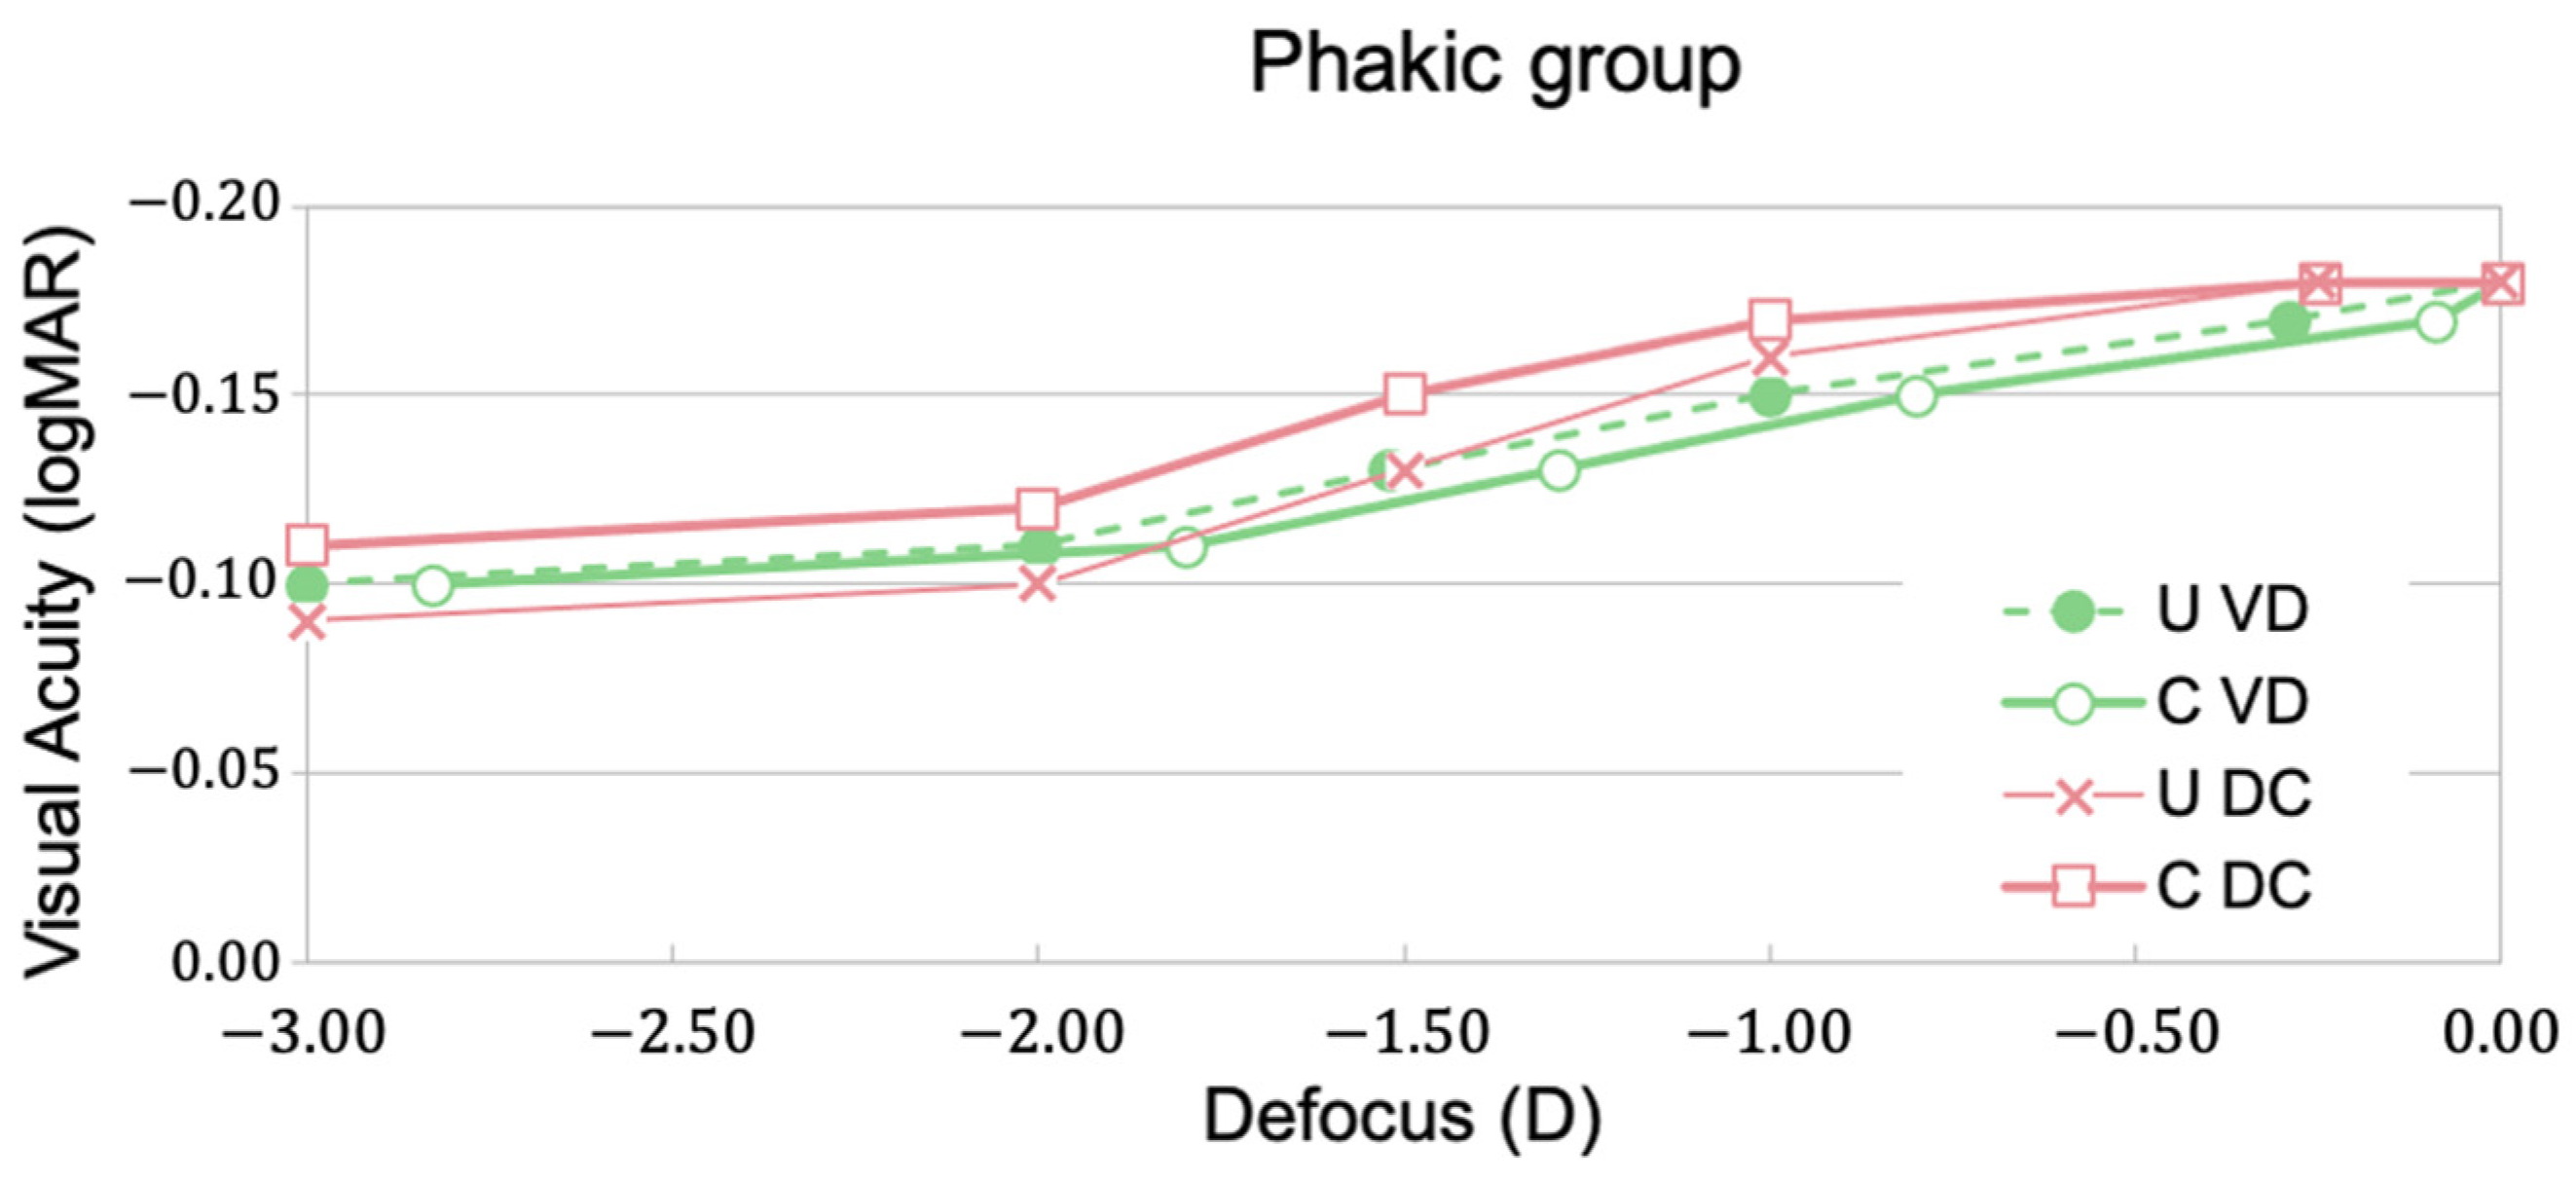
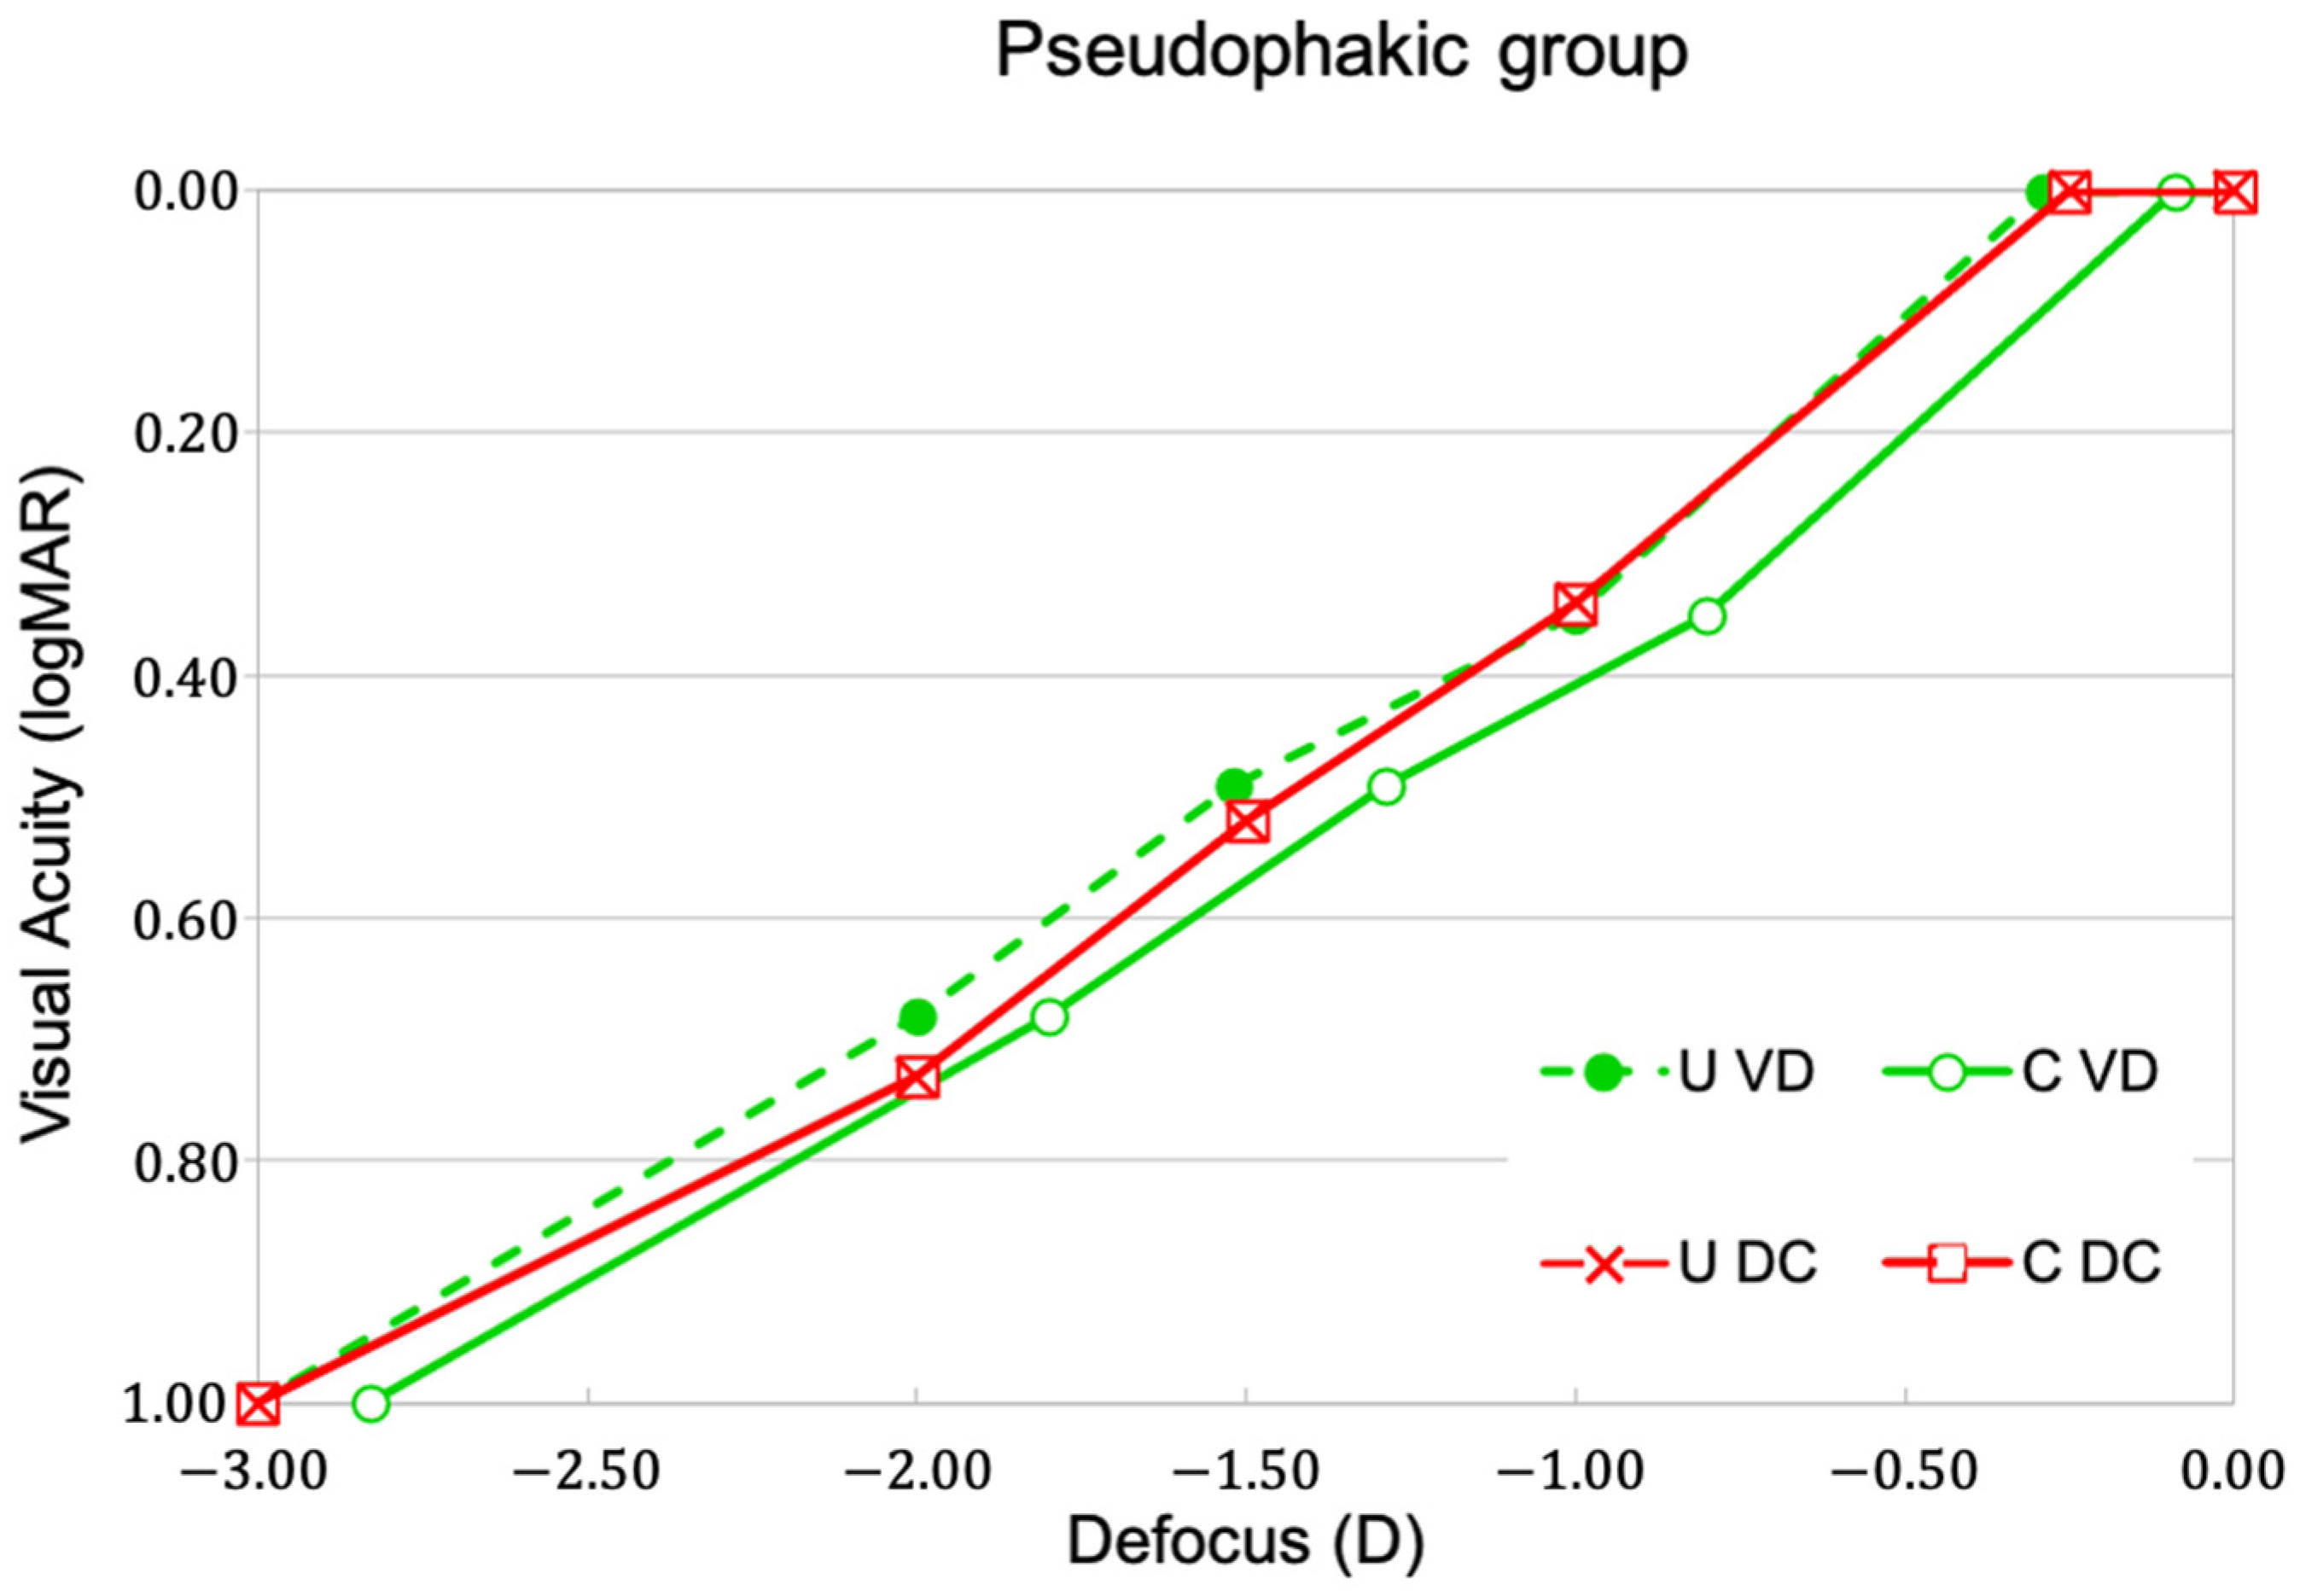
Figure 3 shows the uncorrected and corrected VA values (from Table 1 and Table 2, respectively) that were obtained with the VD and DC methods for the phakic group. The differences between the two methods, even considering the corrected values, are still minute and barely noticeable unless great magnification in the VA (logMAR) scale is introduced, as we have done in Figure 3. Likewise, Figure 4 shows the uncorrected and corrected VA values that were obtained with both the VD and DC methods for the pseudophakic group. In this case, the differences between the two methods, using the corrected values, are still very small but greater than those that were obtained with the phakic group. The correction for the starting position of the chart in the VD plot seems to be the factor with stronger influence in this difference. As stated above, however, the overall differences between the two VD and DC methods are very little for both groups of subjects and no statistically significant differences were obtained at any distance.
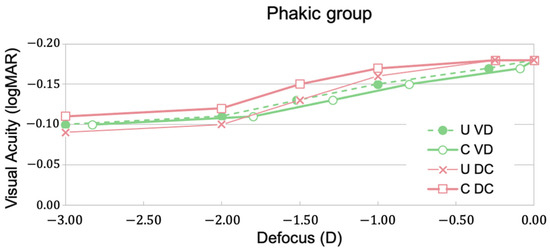
Figure 3.
Visual acuity (logMAR) versus defocus that was obtained with VD and DC methods for the phakic group (with accommodation preserved): uncorrected (U) results and results that were corrected (C) for the starting position of the chart (5 m) and the diminution of the minus lenses. All the measurements were taken with the best distance correction.
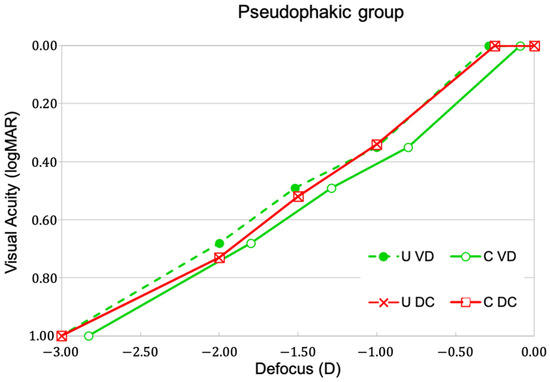
Figure 4.
Visual acuity (logMAR) versus defocus that was obtained with VD and DC methods for the monofocal pseudophakic group: uncorrected (U) results and results that were corrected (C) for the starting position of the chart (5 m) and the diminution of minus lenses. All the measurements were taken with the best distance correction.
4. Discussion
The defocus curve (DC) method has gained importance as one of the methods for evaluating the visual quality of IOLs, in particular the depth of focus of multifocal [7] and extended depth of focus [4] IOLs, from high-contrast VA outcomes in implanted patients. Hence the need for further checking if the VA that is measured at any distance by such a method is equivalent to the VA that would be obtained in natural vision conditions. We tested the fundamental equivalence of the VD and DC methods using a simple method that, in essence, reproduces the experiment that was conducted by Pieh et al. [9], but extended to two kinds of subjects: young phakics and monofocal pseudophakics. We paid particular attention to the experimental conditions (such as the target illumination and size, among other details) in measurements that were involving visual psychophysics.
Our results (Figure 2, Figure 3 and Figure 4 and Table 1 and Table 2) show that the DC method, with the addition of minus trial lenses of different powers while the VA chart remains at a fixed distant position, correctly reproduces the VA that is obtained in natural conditions when the chart is placed at various distances (VD) from the subject whose VA is being assessed. The experiment that was conducted with a group of young phakic observers (age 24.6 ± 3.4 years), with accommodation preserved, allowed us to verify the hypothesis with a very high level of coincidence in the distance range of 5 m to 33 cm from the subject. In this case, the observer was able to compensate the accommodative demand (or distance demand)- that was introduced by either the DC or VD method- with accommodation, and thus, to reach similar VA. The same experiment, repeated with a group of monofocal pseudophakic patients (age 72.33 ± 3.19 years), with accommodation disabled, confirmed the validity of the hypothesis also for this sort of subject. In this latter case, however, the observer could not compensate the accommodative demand that was introduced by either the DC or VD method. For closer vision distances, defocus limited the VA of monofocal pseudophakic subjects, but this limitation was very similar with both methods, as derived from the lack of statistically significant differences between them at any tested distance.
The phakic group reached mean VA values that were higher than the pseudophakic group in general, also for distance vision. This result was expected from the great difference in age existing between both groups (mean age 24.6 ± 3.4 years for the phakic and 72.33 ± 3.19 years for the pseudophakic) and the natural decline of vision with age (see, for instance, [18,19]). In addition to this, unlike the phakic young observers with accommodation preserved, monofocal pseudophakic’s VA decreased quite fast with close vision distances because of their incapacity for defocus compensation.
The young phakic observers’ group showed a very subtle VA decrease at near distances using both methods. Either the accommodative demand in the DC method or the crowded effect in the VD method could have possibly discouraged subjects to make further effort at close vision distances. Although the analysis of this interesting trend is beyond the scope of the paper, the influence of the vision distance on the visual acuity that was reached by observers with accommodation preserved deserves further attention in future investigation.
We have refined the VA results by introducing two considerations that were also considered by other authors in a former work [9]. One, the starting position of the chart at 5 m, which induces a vergence of −0.20 D in the best distance correction and, therefore, in the subsequent measurements of VA at closer distances from the subject. Two, the diminution of the minus trial lenses that were used in the DC method, which has been estimated in 1.2% per diopter in our experiment. In the case of the −3 D lens, which represents the most unfavourable case, the VA change is less than half a decimal line, which in logMAR corresponds to the same VA level. The corrected results (Table 2 and Figure 3 and Figure 4) do not lead us to modify our previous analysis and interpretation. The changes with respect to the uncorrected results are unnoticeable for phakic group, whereas very small and by no means clinically relevant for the pseudophakic group.
Moreover, as they represent less than half a decimal line of VA, they are below the clinical threshold considered in the VA measurements [12].
We further compare our corrected VA results for the pseudophakic group with those that were reported by Pieh et al. [9] The statistical power of the pseudophakic sample (n = 15) is somewhat low in both studies, which can be pointed as a limitation. In their paper, Pieh et al. compared the same two methods we have studied, but there are some differences with respect to our experiment. They did not include any phakic group of young observers with accommodation preserved, but just a group of 14 monofocal (silicone 911A IOL, Pharmacia) pseudophakic patients that were aged 67.9 ± 9.7 years on average (range 53.5 to 79.6 years). They assessed VA in 15 eyes (6 m distance test). For the VD method, they used only two tests, a near and a far ETDRS chart that was designed to test VA at two defined distances. They placed these charts at seven distances (6 m, 2 m, 1 m, 67 cm, 50 cm, 40 cm, and 33 cm) from the subject and calculated the corresponding VA (logMAR) taking into account the effective viewing in each case. For the DC method, they performed defocus using the 6 m chart in 0.5 D steps, from −3.0 D to −0.5 D. The comparison of the results that were obtained by Pieh et al. revealed that the DC method underestimated the VA, even after correcting the results that were obtained with the DC method for a starting position of −0.167 D (6 m) of the chart and a diminution of the minus trial lenses with 1% per diopter. They suggested that pupillary constriction or miosis, which enlarges the depth of focus and occurs at near distances when the proximal triad (pupillary constriction, accommodation, and convergence) takes place, could be a reason for their results. Nevertheless, taking into account that VA was determined monocularly and that an overall reduction in the performance of the proximal triad occurs upon removal of binocular cues [20] and accommodation alone does not induce pupillary constriction [21] (not confirmed for pseudophakics), it is reasonable to think that the effects that are due to the pupil response would have been negligible.
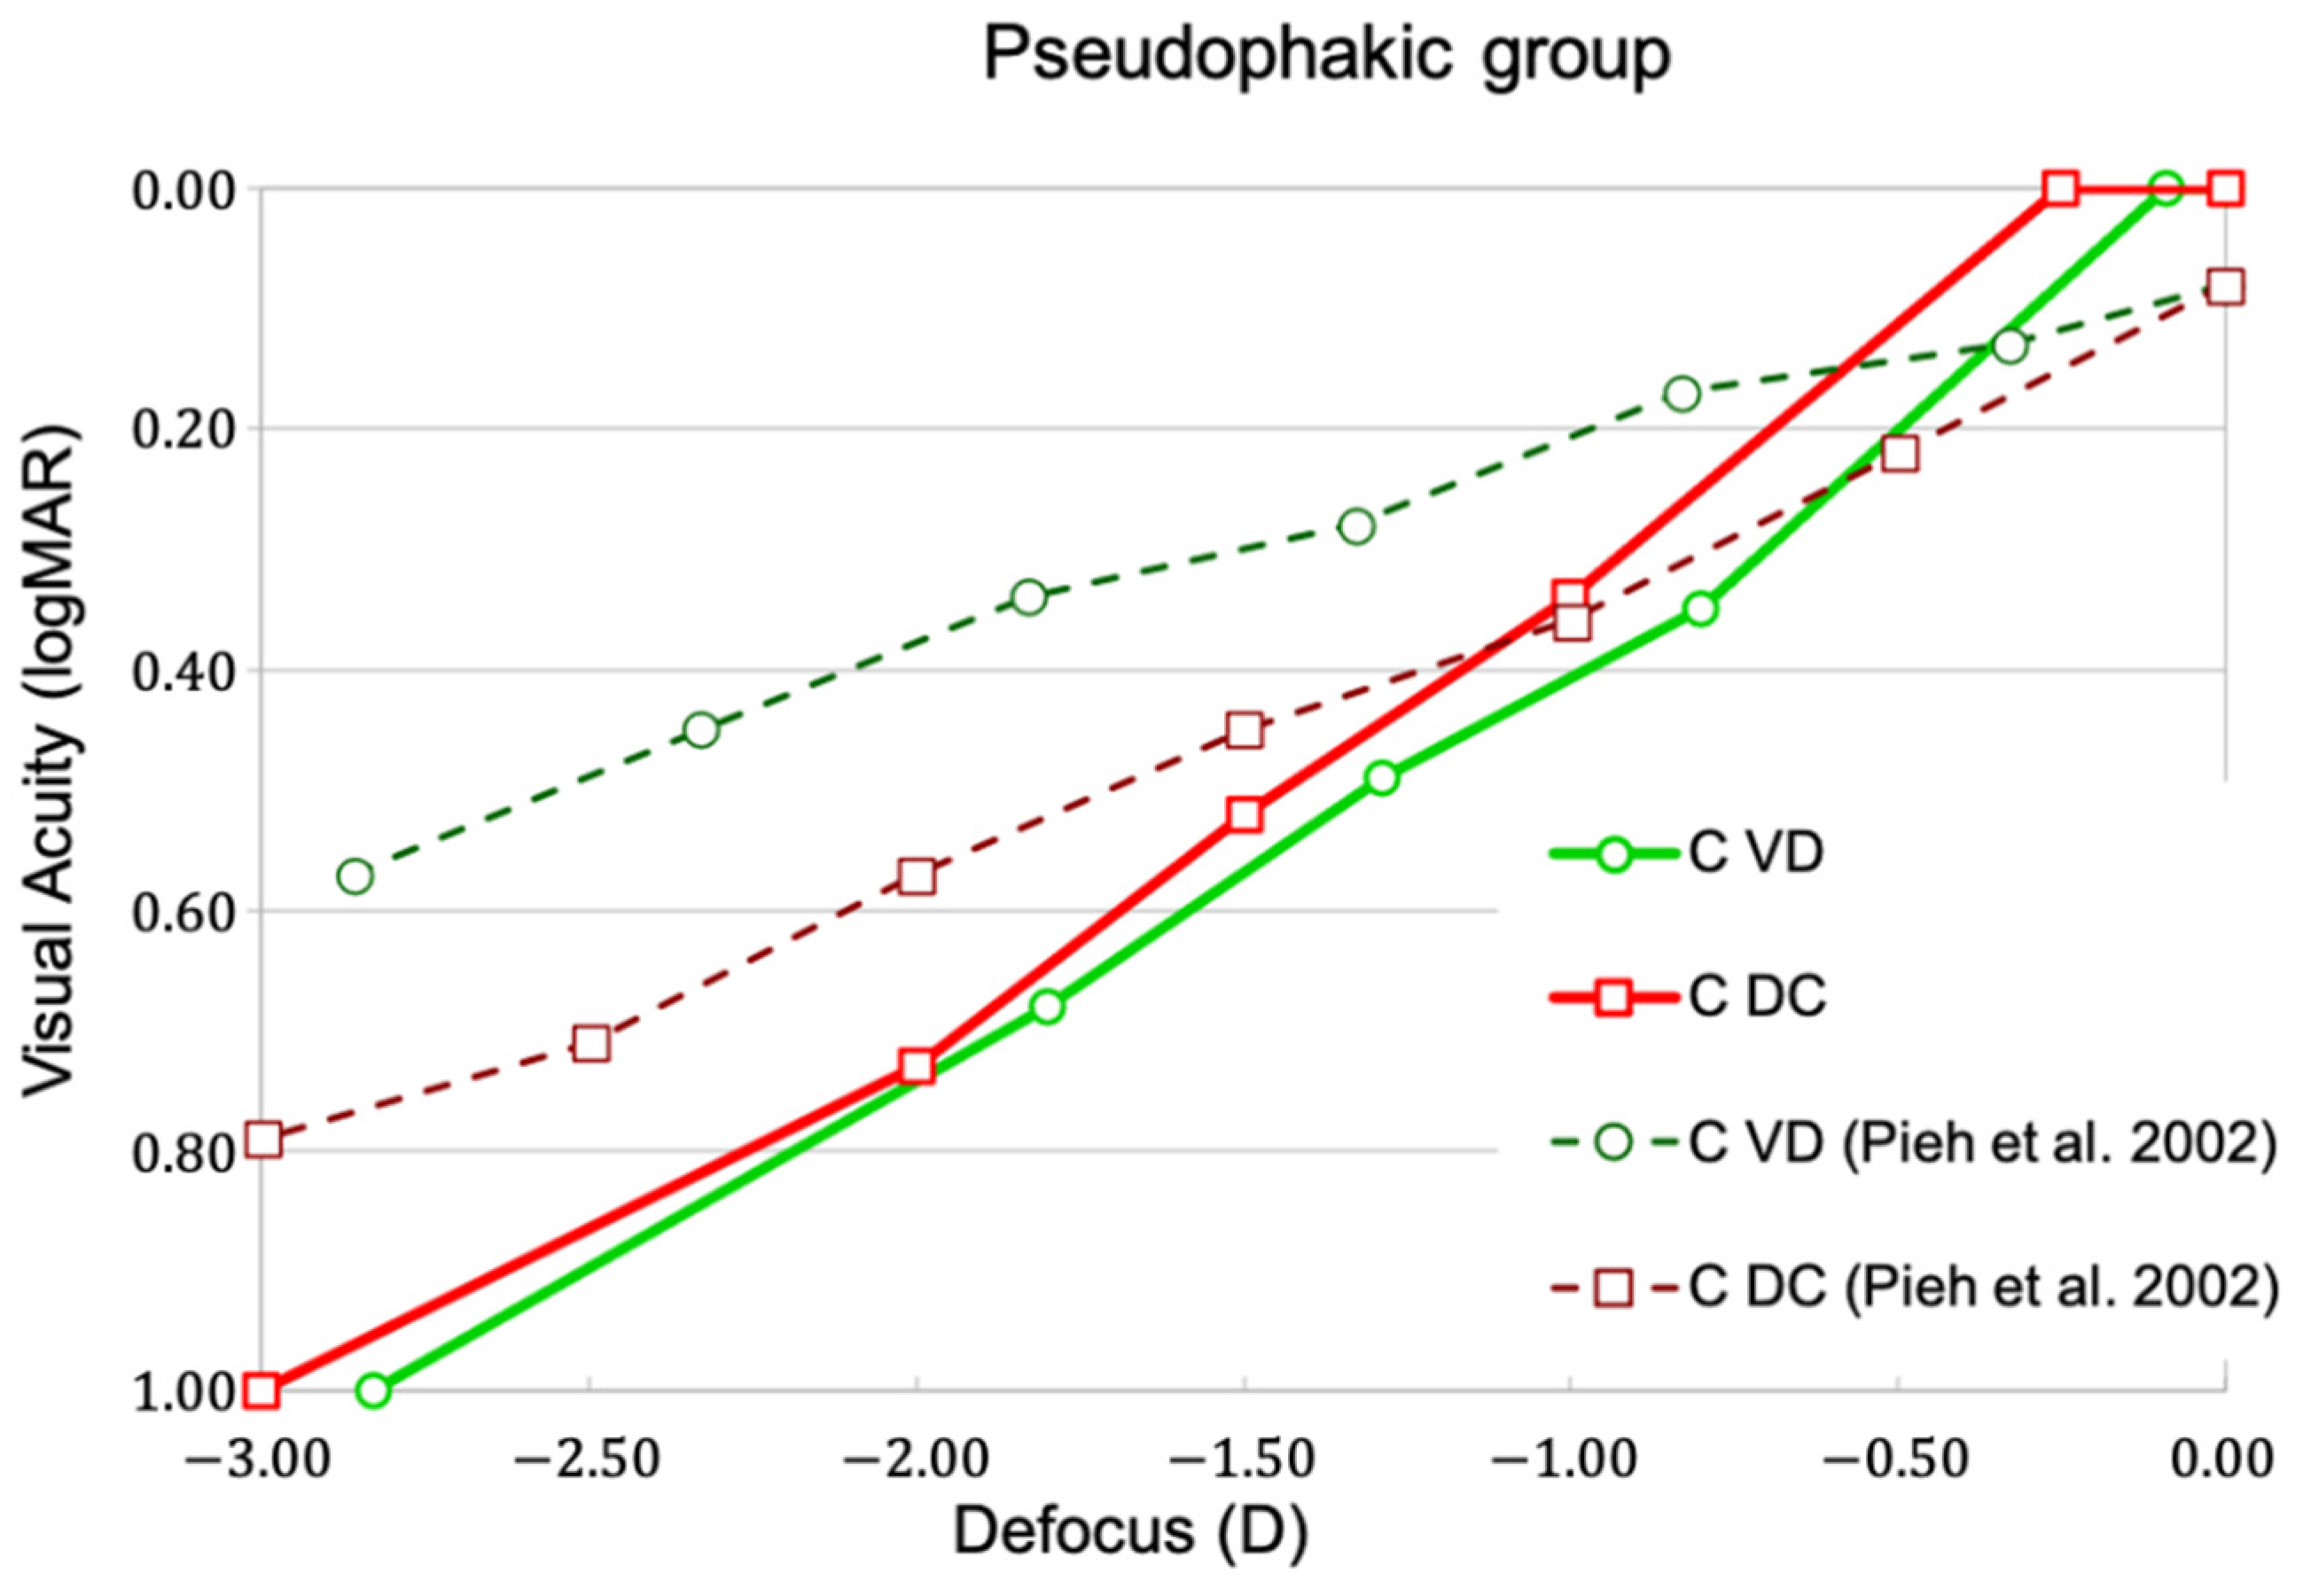
Figure 5 shows our corrected VA results for the pseudophakic group with those that were obtained by Pieh et al. [9] after correcting them for diminution of minus glasses (1% per diopter) and a starting position of −0.167 D.
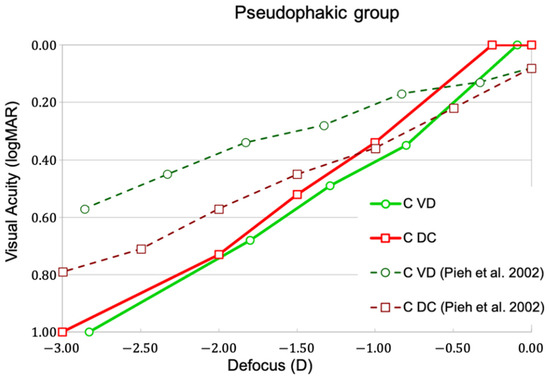
Figure 5.
The corrected VA results that were obtained with the VD and DC methods for the pseudophakic group of this study (C VD, C DC) and those that were obtained by Pieh et al. [9] after corrections for minus lenses and the starting position of the chart (data extracted from figure 2 of Ref. [9] and adapted to this figure for the sake of comparison).
From the figure, Pieh et al.’s results have similar magnitude as ours and show the same general trend: the VA reaches a maximum value in far vision, to which all the subjects were adjusted for best distance correction (0.0 D defocus) and decreases monotonously with defocus, until the vergence −3 D (33 cm) examined in both works. However, it is worth remarking on an important difference. Pieh et al. reported statistically significant differences between the VA values that were obtained with the VD and DC methods that could not be explained after the correction for diminution of the minus lenses and the starting position of the chart. Therefore, Pieh et al. concluded that defocus curves do not constitute a suitable method for determining possible visual acuities at near-object distances. The results that were obtained in our experiment rebut that the DC method understimates VA as reported by Pieh et al. [9]. In our study, we have obtained no statistically significant differences between both the VD and DC methods at any distance in two groups of subjects: a first group of 35 young phakic subjects with accommodation preserved, and a second group of monofocal pseudophakic patients with disabled accommodation. Concerning the pseudophakic group, the patients that were recruited by Pieh et al. were 4.4 years younger than ours on average. Although age has an influence on the pupil size (a decrease rate of around −0.17 mm/decade [22]), the effect of such a difference in the pupil reduction can be neglected.
In consequence, we conclude that both the VD and DC methods are fairly equivalent in precision and accuracy for the phakic and pseudophakic subjects and can be used indistinctly in clinical studies and in the clinical practice. However, DC is more practical and clearly advantageous than VD in the clinics because it does not require any further control of the chart positioning and illuminance.
Author Contributions
Conceptualization, L.C., A.T. and M.S.M.; methodology, L.C., A.T. and M.S.M.; validation, L.C., A.T. and M.S.M.; formal analysis L.C., A.T. and M.S.M.; investigation, L.C., A.T. and M.S.M.; resources L.C., A.T. and M.S.M.; data curation, L.C.; writing original draft preparation, L.C., A.T. and M.S.M.; writing—review and editing, L.C., A.T. and M.S.M.; visualization, L.C., A.T. and M.S.M.; supervision, A.T. and M.S.M.; project administration, M.S.M.; funding acquisition, M.S.M. All authors have read and agreed to the published version of the manuscript.
Funding
This research funded by the Agencia Estatal de Investigación, Ministerio de Ciencia e Innovación of the Spanish government (PID2020-114582RB-I00/AEI/10.13039/501100011033).
Institutional Review Board Statement
The study was conducted in accordance with the Declaration of Helsinki, and approved by the Ethics Committee of the Hospital de Mataró (Consorci Sanitari del Maresme, Mataró, Barcelona, Spain), protocol code: 20/19, date of approval 24 April 2019.
Informed Consent Statement
Informed consent was obtained from all subjects involved in the study.
Data Availability Statement
The datasets generated and analyzed during the study are available from the corresponding authors upon reasonable request.
Conflicts of Interest
The authors declare no conflict of interest.
References
- Gupta, N.; Wolffsohn, J.S.W.; Naroo, S.A. Optimizing measurement of subjective amplitude of accommodation with defocus curves. J. Cataract. Refract. Surg. 2008, 34, 1329–1338. [Google Scholar] [CrossRef] [PubMed] [Green Version]
- Plaza-Puche, A.B.; Alio, J.L. Analysis of defocus curves of different modern multifocal intraocular lenses. Eur. J. Ophthalmol. 2016, 26, 412–417. [Google Scholar] [CrossRef] [PubMed]
- MacRae, S.; Holladay, J.T.; Glasser, A.; Calogero, D.; Hilmantel, G.; Masket, S.; Stark, W.; Tarver, M.; Nguyen, T. Special Report: American Academy of Ophthalmology Task Force Consensus Statement for Extended Depth of Focus Intraocular Lenses; American Academy of Ophthalmology: San Francisco, CA, USA, 2017. [Google Scholar] [CrossRef] [Green Version]
- ANSI Z80.35-2018; American National Standard Institute, Ophthalmics. Extended Depth of Focus Intraocular Lenses. The Vision Council: Alexandria, VA, USA, 2018.
- Pedrotti, E.; Carones, F.; Aiello, F.; Mastropasqua, R.; Bruni, E.; Bonacci, E.; Talli, P.; Nucci, C.; Mariotti, C.; Marchini, G. Comparative analysis of visual outcomes with 4 intraocular lenses: Monofocal, multifocal, and extended range of vision. J. Cataract. Refract. Surg. 2018, 44, 156–167. [Google Scholar] [CrossRef] [PubMed]
- Hayashi, K.; Manabe, S.; Hayashi, H. Visual acuity from far to near and contrast sensitivity in eyes with a diffractive multifocal intraocular lens with a low addition power. J. Cataract. Refract. Surg. 2009, 35, 2070–2076. [Google Scholar] [CrossRef] [PubMed]
- ISO 11979-9:2006; Ophthalmic Implants. Intraocular Lenses. Part 9: Multifocal Intraocular Lenses. Annex B. ISO: Geneva, Switzerland, 2006.
- Vega, F.; Millán, M.S.; Garzón, N.; Altemir, I.; Poyales, F.; Larrosa, J.M. Visual acuity of pseudophakic patients predicted from in-vitro measurements of intraocular lenses with different design. Biomed. Opt. Express 2018, 9, 4893–4906. [Google Scholar] [CrossRef] [PubMed]
- Pieh, S.; Kellner, C.; Hanselmayer, G.; Lackner, B.; Schmidinger, G.; Walkow, T.; Sticker, M.; Weghaupt, H.; Fercher, A.F.; Skorpik, C. Comparison of visual acuities at different distances and defocus curves. J. Cataract. Refract. Surg. 2002, 28, 1964–1967. [Google Scholar] [CrossRef]
- Buckhurst, P.J.; Wolffsohn, J.; Naroo, S.A.; Davies, L.N.; Bhogal, G.K.; Kipioti, A.; Shah, S. Multifocal intraocular lens differentiation using defocus curves. Investig. Ophthalmol. Vis. Sci. 2012, 53, 3920–3926. [Google Scholar] [CrossRef] [PubMed] [Green Version]
- Wolffsohn, J.S.; Jinabhai, A.; Kingsnorth, A.; Sheppard, A.; Naroo, S.A.; Shah, S.; Buckhurst, P.; Hall, L.A.; Young, G. Exploring the optimum step size for defocus curves. J. Cataract. Refract. Surg. 2013, 39, 873–880. [Google Scholar] [CrossRef] [PubMed]
- EN ISO 8596:2018; Ophthalmic Optics—Visual Acuity Testing—Standard and Clinical Optotypes and Their Presentation. ISO: Geneva, Switzerland, 2018.
- Clavé, L.; Torrents, A.; Ralló, M.; Millan, M. Visual acuity assessment in phakic and pseudophakic eyes under red, green, and blue illumination. Óptica Pura Apl. 2020, 53, 1–10. [Google Scholar] [CrossRef]
- International Council of Ophthalmology. Visual Acuity Measurement Standard; International Council of Ophthalmology: Brussels, Belgium, 1984. [Google Scholar]
- Holladay, J.T. Visual acuity measurements. J. Cataract. Refract. Surg. 2004, 30, 287–290. [Google Scholar] [CrossRef] [PubMed]
- Rabbetts, R.B. Bennett & Rabbetts’ Clinical Visual Optics, 4th ed.; Butterworth Heinemann: Edinburgh, UK, 2007; Chapter 13; p. 246. [Google Scholar]
- Amstrong, R.A. When to use Bonferroni correction. Ophthalmic Physiol. Opt. 2014, 34, 502–508. [Google Scholar] [CrossRef] [PubMed]
- Elliot, D.B.; Yang, K.; Whitaker, D. Visual acuity changes throughout adulthood in normal, healthy eyes: Seeing beyond 6/6. Optom. Vis. Sci. 1995, 72, 186–191. [Google Scholar] [CrossRef] [PubMed]
- Sjöstrand, J.; Laatikainen, L.; Hirvelä, H.; Popovic, Z.; Jonsson, R. The decline in visual acuity in elderly people with healthy eyes or eyes with early age-related maculopathy in two Scandinavian population samples. Acta Ophthalmol. 2011, 89, 116–123. [Google Scholar] [CrossRef] [PubMed]
- Bharadwaj, S.R.; Wang, J.; Candy, T.R. Pupil responses to near visual demand during human visual development. J. Vis. 2011, 11, 1–14. [Google Scholar] [CrossRef] [PubMed]
- Feil, M.; Moser, B.; Abegg, M. The interaction of pupil response with the vergence system. Graefe’s Arch. Clin. Exp. Ophthalmol. 2017, 255, 2247–2253. [Google Scholar] [CrossRef] [PubMed]
- Winn, B.; Whitaker, D.; David, F.; Elliott, B.; Phillips; Nicholas, J. Factors affecting light-adapted pupil size in normal human subjects. Investig. Ophthalmol. Vis. Sci. 1994, 35, 1132–1137. [Google Scholar]
Publisher’s Note: MDPI stays neutral with regard to jurisdictional claims in published maps and institutional affiliations. |
© 2022 by the authors. Licensee MDPI, Basel, Switzerland. This article is an open access article distributed under the terms and conditions of the Creative Commons Attribution (CC BY) license (https://creativecommons.org/licenses/by/4.0/).

