1. Introduction
High-contrast imaging of biological samples is critical in the diagnosis of several pathological conditions. Different mechanisms for contrast enhancement, such as exogenous contrast agents [
1], phase contrast [
2], polarization contrast [
3], illumination contrast [
4], etc., have been demonstrated. Polarization-sensitive optical coherence tomography (PS-OCT) [
5,
6] and cross-polarized optical coherence tomography (CP-OCT) [
7,
8] are emerging as new imaging techniques which can image tissue with improved contrast from a few microns up to submicron axial resolution in its native state.
Polarization-based OCT systems exploit the birefringence and depolarization properties of the tissue to achieve additional contrast between the different structures. To do so, the change in the polarization of the input light from the sample is measured using a reference light signal which has some known relation to the light used for illumination of the sample. Both PS-OCT [
9,
10,
11,
12] and CP-OCT [
13,
14,
15,
16] systems have been developed for this purpose. PS-OCT has been used to reconstruct entire Jones matrices for the tissue, which allows measuring the birefringence as well as the optic axis orientation of the sample. CP-OCT, on the other hand, can measure only the combined effect of the tissue’s birefringence and optic axis orientation, which contributes to the polarization change of the light after interacting with the sample. In many cases, however, it is sufficient to know the overall change in polarization without the need for the full Jones matrix of the tissue. CP-OCT systems offer an advantage over PS-OCT systems, due to being simpler in their implementation, and have been used for esophageal cancer detection [
14], brain tumor imaging [
13], bladder cancer detection [
15], endomyocardial imaging [
17], and dental biofilm imaging [
16].
In the CP-OCT technique, two images of the tissue, one with the same polarization as the input light (co-polarized) and another in the orthogonal polarization state (cross-polarized), are acquired. The ratio of the cross-polarized signal to the sum of the co-polarized and cross-polarized signals, termed the depolarization ratio, can then be used to describe the birefringence properties of the tissue. A majority of CP-OCT systems operate around the 1300 nm wavelength range because of low tissue scattering in this wavelength region, which allows larger penetration depth (up to a few millimeters) of light in the tissue. For some studies related to imaging of superficial layers, such as the epithelium and lamina propria in the gastrointestinal tract, only a few hundred microns of penetration of light into the tissue is required. Thus, shorter wavelengths of around 800 nm can be used, which offer better resolution and higher polarization contrast compared to the 1300 nm wavelength region. One such CP-OCT system was demonstrated recently [
17], where broadband light from a supercontinuum laser was used to measure the depolarization in human myocardium tissue.
CP-OCT systems working in both wavelength regimes use optical fibers and several polarization controlling elements to control the polarization of the light targeting the sample and the reference surface. The use of optical fibers in those schemes poses a significant challenge, as stretching and bending of the optical fibers can change the polarization state of light. To minimize such complications, the polarization of light used in the systems is optimized using fiber polarization controllers followed by fixing the optical fibers, so that this state of polarization can be maintained. In clinical settings, or even in research settings, it is not always possible to keep the fiber position fixed; consequently, the polarization changes, and hence the system requires realignment. A system that is free from those changes induced by optical fibers with minimal polarization controlling optics would be a major step towards the clinical adoption of the technique. Furthermore, to our knowledge, a system utilizing unpolarized light for sample illumination for obtaining cross-polarized images of the sample has not been reported yet.
In this work, we demonstrate a CP-OCT system using only two quarter-wave plates and an unpolarized light source that does not require any other polarization controlling element.
2. Materials and Methods
Our proposed CP-OCT system is shown in
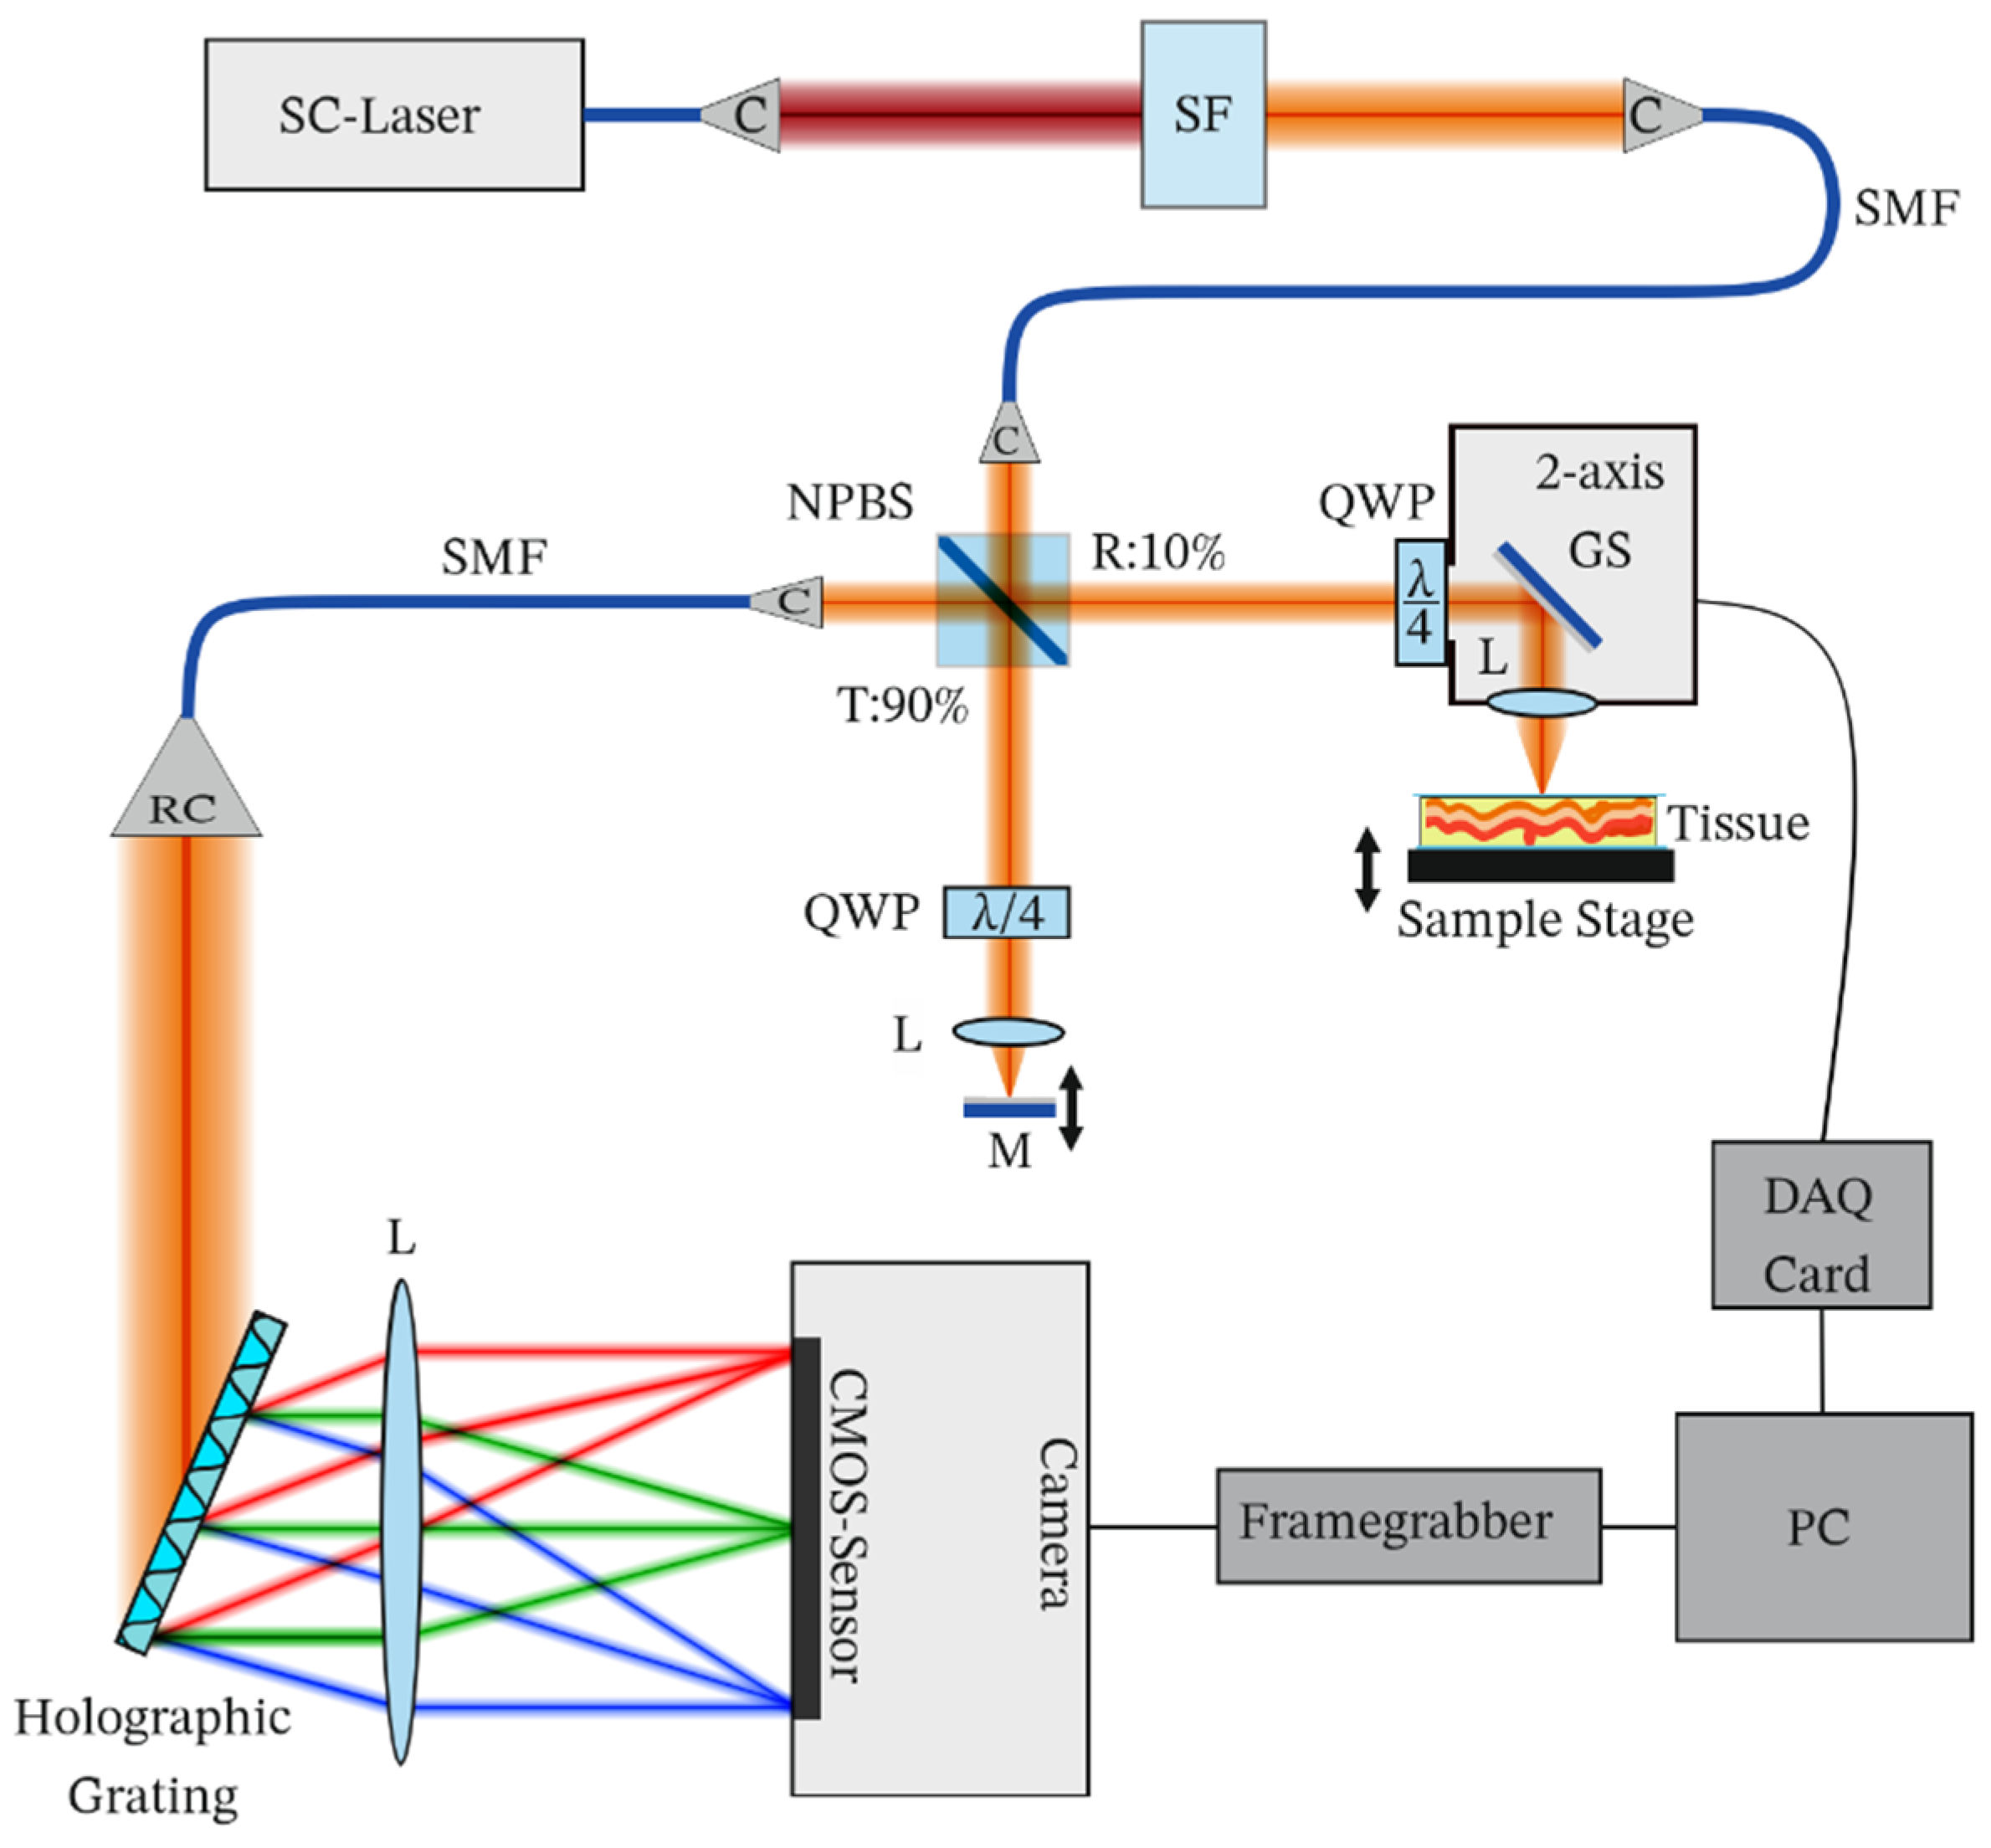
Figure 1. Light from a broadband supercontinuum laser (SC-OEM, YSL Photonics, Wuhan, China) was filtered using a short-pass dichroic mirror (SF, DMSP950T, Thorlabs, Newton, NJ, USA) and wavelengths below 950 nm were coupled to a single-mode fiber (SMF, SM600, Thorlabs Newton, NJ, USA). The laser was operated at 200 MHz, at which it provided a spectrum centered at 885 nm and a full width at half maximum of 80 nm at the spectrometer. Light from the single-mode fiber was collimated using a collimator (C, F230APC, Thorlabs, Newton, NJ, USA). A 90/10 beam splitter (NPBS, BS025, Thorlabs, Newton, NJ, USA) was used to split the light into a reference path and a sample path. Ten percent of the input light (15 mW) was used to illuminate the sample and 90 percent of the input light was used to illuminate the reference mirror.
In the reference path, a quarter-wave plate (QWP, SAQWP05M-1700, Thorlabs, Newton, NJ, USA), a lens (AC254-030-AB, Thorlabs, Newton, NJ, USA), and a mirror were placed. The sample path duplicates this configuration, except for an additional galvo-scanner (GS, GVS012, Thorlabs, Newton, NJ, USA), controlled via a data acquisition card (DAQ, USB-6211, NI, Austin, TX, USA), and a sample stage and a sample replacing the mirror. The reflected light from the sample and the reference mirror were recombined and coupled to a single-mode fiber using a collimator (C). The combined light was sent to a custom-designed spectrometer which consisted of a reflective collimator (RC, RC08APC, Thorlabs, Newton, NJ, USA), a holographic grating (1200 lines per millimeter, 840 nm, Wasatch, Logan, UT, USA), a lens (AC-254-080-B, Thorlabs, Newton, NJ, USA), and a line scan camera (2048 pixels, ral2048-48gm, Basler, Ahrensburg, Germany). The spectrometer signal was acquired using a computer connected via GigE-vision at 25 kHz. The signal was processed using custom-designed LabVIEW software, which involved spectral calibration from wavelength space to wavenumber space and a fast Fourier transform to obtain an axial profile of the sample. For wavelength space to wavenumber space conversion, a previously reported method was used [
18].
The QWPs used in the system had their optic axes aligned at 45° with respect to each other. Assuming that the optic axis of the QWP in the sample beam path is aligned at 0° in the laboratory reference frame and the QWP in the reference beam path is aligned at 45°, the Jones matrices for such QWPs in the return path, which then act in total as half-wave plates, can be represented as
where θ is the angle between the optic axis of the QWP and the laboratory reference frame.
The light of the supercontinuum light source was unpolarized and can be considered as a mixture of two orthogonally linearly polarized states. If we consider one polarization component of the input light parallel to the laboratory reference frame, and another in the perpendicular plane, then such components can be described by Jones matrices as
Now we can consider two cases to check the effect of the system on the and the components.
Case 1: The Jones matrix for the
components reflected from the sample and the reference surfaces, which are guided towards the spectrometer after the NPBS, can be found by multiplying the Jones matrix of the input
component (Equation (2)) with the Jones matrix of the sample (Equation (1)) and reference beam path QWPs.
From Equation (3), we can see that the parallel component of the input light is unaffected by the QWP in the sample path, whereas the reference component is converted to an orthogonal component by the QWP in the reference path. Hence, these two components will not interfere at the detector.
Case 2: Similar to case 1, the Jones matrix for the
components after the NPBS can be represented as
which are again orthogonal and do not interfere at the spectrometer. In mathematical terms, the electric fields are orthogonal if the dot product of their Jones vectors is zero.
where
is the complex transpose of the Jones vector of the sample electric field and
is the Jones vector of the reference electric field. Considering the two interfered orthogonal components of the electric field after the NPBS in
Figure 1, we can test their orthogonality by using Equation (5):
From Equation (6), we can see that both the parallel and the perpendicular components of the unpolarized light produce orthogonal components from the sample and the reference surface if the two QWPs are oriented at 45° with respect to each other. These two components do not interfere with each other, thus generating the cross-polarized image of the sample. Similar equations can be derived for the case where both QWPs are oriented at 0° with respect to each other, which would produce a co-polarized image of the sample. Hence, by adjusting the angle between the QWPs to 0° or 45°, one can obtain co-polarized and cross-polarized images of the sample.
Since the light reflected from the sample is composed of two signals, one with the same polarization (co-polarization) as the input signal and another with orthogonal polarization (cross-polarization), a complete reflectivity image can be obtained after combining the co-polarized image and the cross-polarized image. The reflectivity
and depolarization ratio
of the sample can be calculated using the amplitude of the co- (
) and cross- (
) polarized images using the following equations [
19]
To obtain the reflectivity and the depolarization ratio images of the sample, the laser beam was scanned over the sample. First, the QWP in the reference path was positioned at 0° with respect to the QWP in the sample path, and the sample images, termed co-polarized images, were acquired. Then, the QWP in the reference beam path was rotated by 45°, followed by sample image acquisition, resulting in cross-polarized images of the sample. Sample reflectivity and the depolarization ratio were then calculated using Equation (7).
3. Results
The developed system had an axial resolution of approximately 5 µm, a lateral resolution of 20 µm, a sensitivity of 93.6 dB (5 dB drop-off at 1 mm), and an imaging range of 2.5 mm. The sample images were acquired at 25,000 axial lines (A-lines) per second and were limited by the camera acquisition speed.
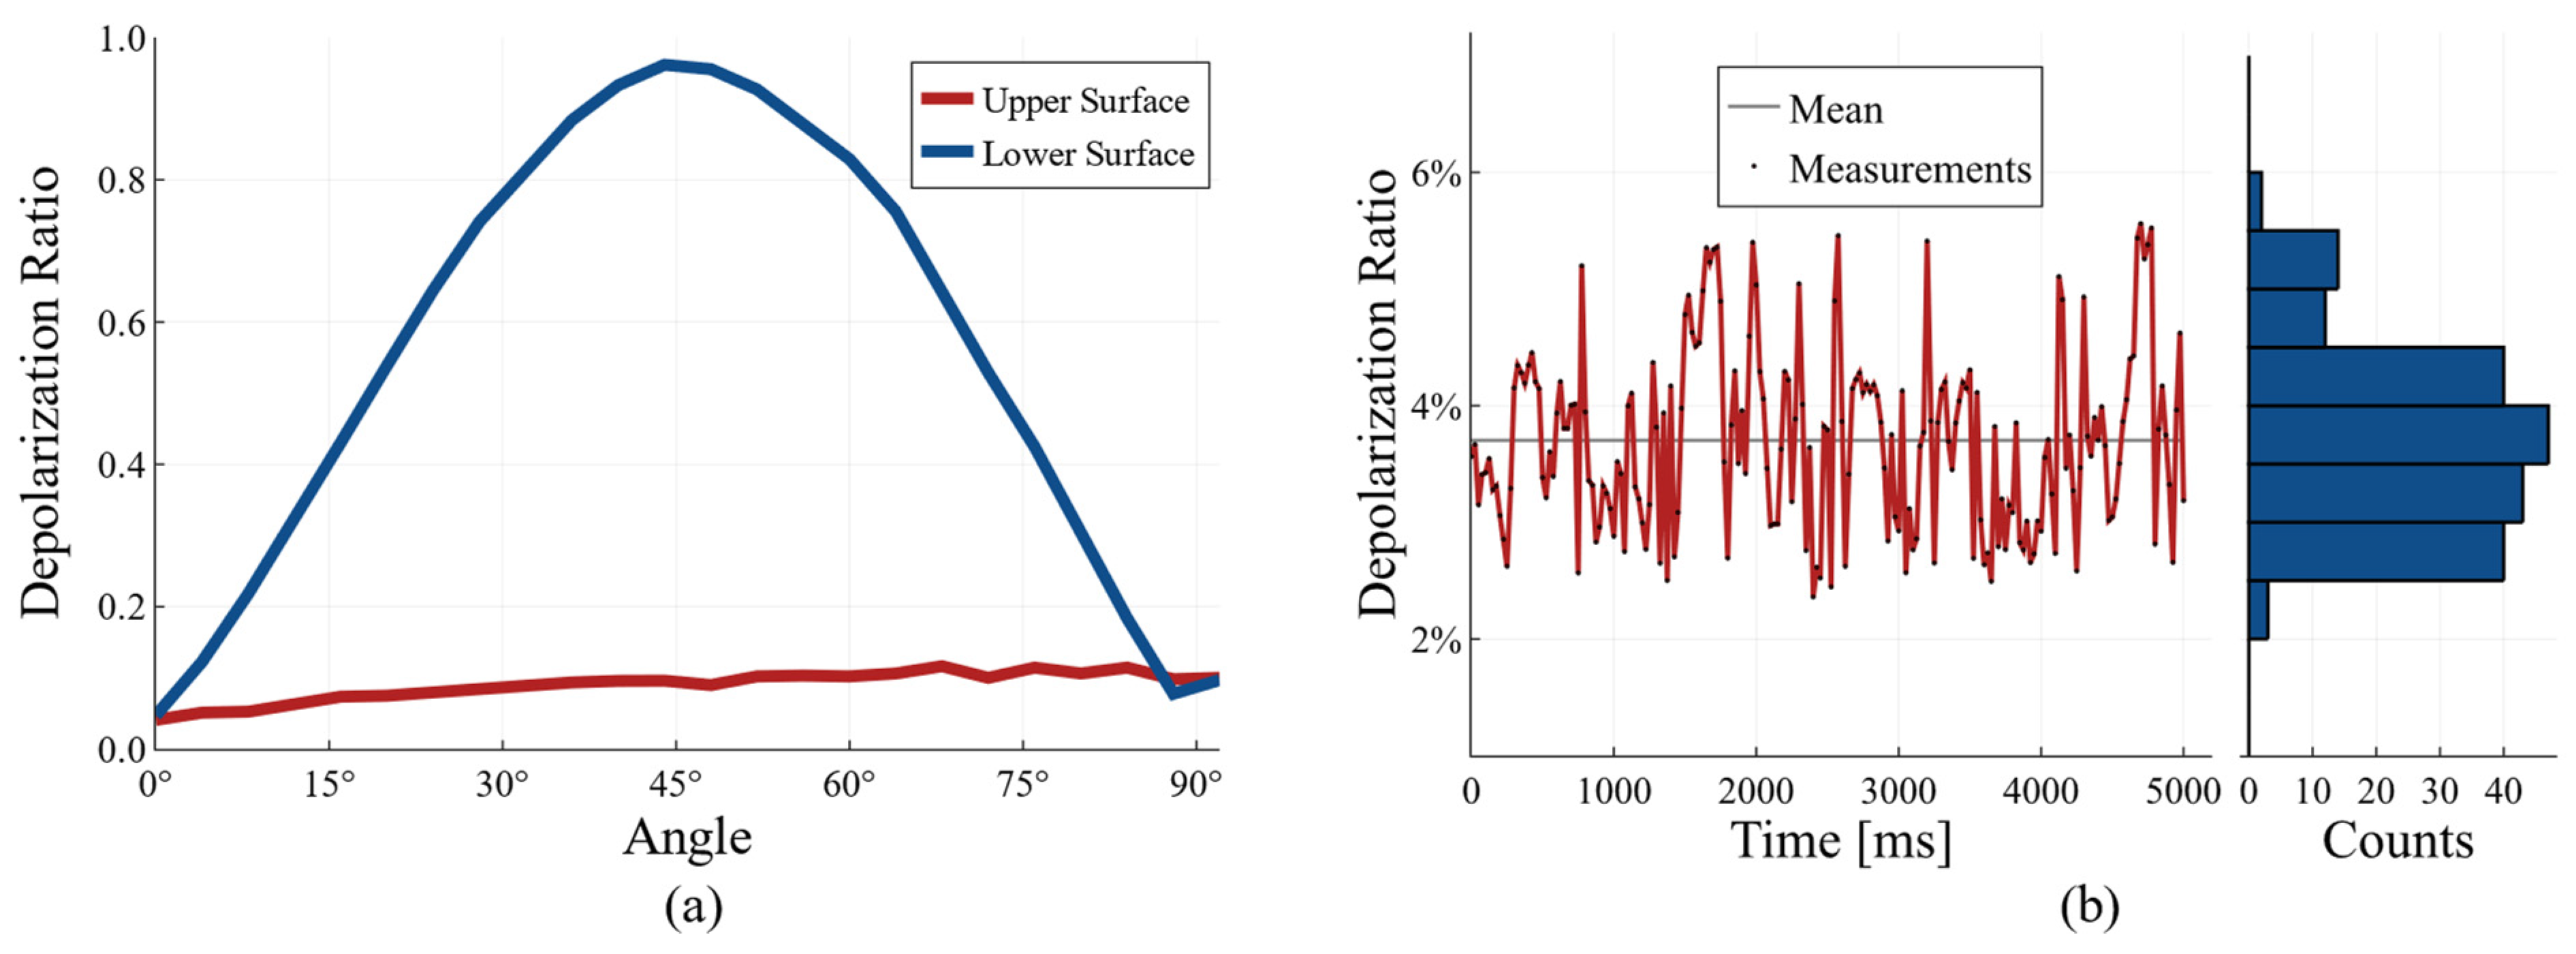
To test the performance of the system, we used a quarter-wave plate (SAQWP05M-1700, Thorlabs, Newton, NJ, USA) as a sample. The light reflected from the top surface of the quarter-wave plate is expected to experience no change in polarization, whereas the light which travels through the QWP and reflects from the back surface will experience polarization changes depending on the angle between the optic axes of the QWP used as the sample and the QWP in the reference beam. These results are presented in
Figure 2.
It can be seen from
Figure 2a that the depolarization ratio of the signal from the top surface of the QWP is approximately constant, whereas it changes with the rotational angle for the light reflected from the lower surface of the QWP.
To test if the system is robust to fiber movements, we measured the stability of the depolarization ratio for a mirror as a sample. For this, we placed a polarization controller over the input fiber and measured the fluctuations in the depolarization ratio while the paddle on the polarization controller was rotated. The measured fluctuations are presented in
Figure 2b. It can be seen from
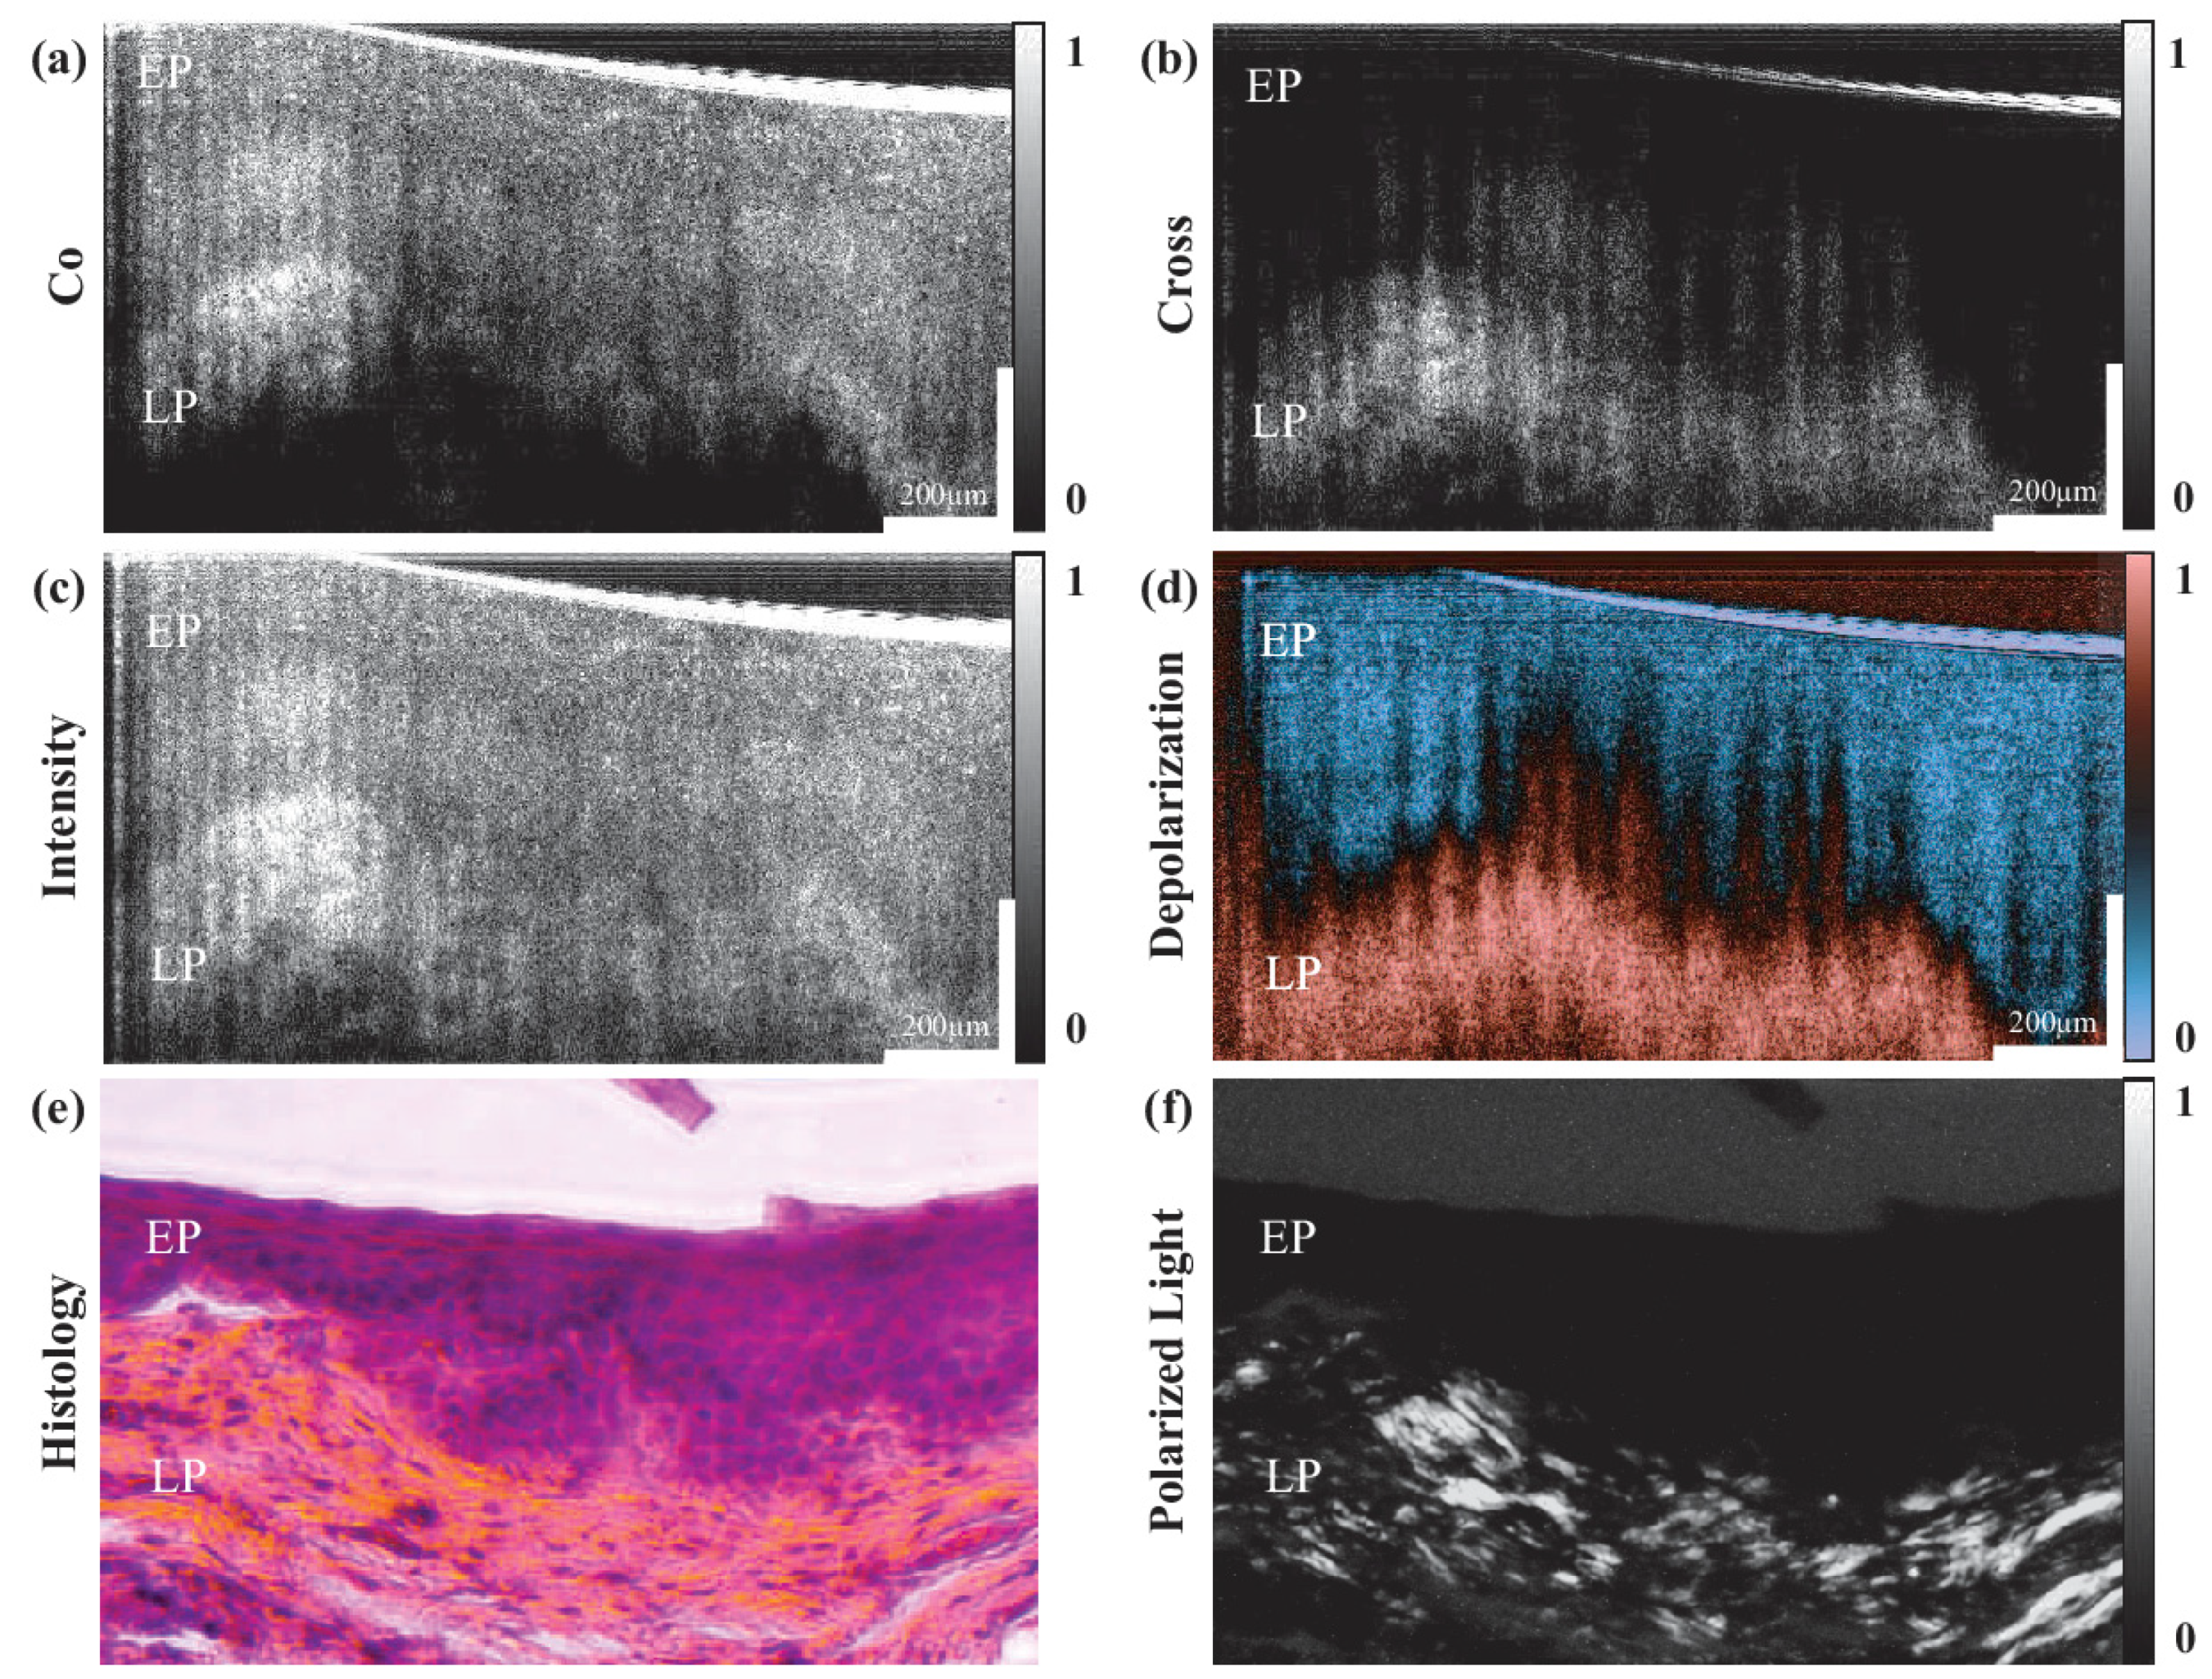
Figure 2b that the fluctuation using our current approach is, at most, 2 percent. The signal is offset by 4 percent, which could be due to the wavelength-dependent birefringence of the QWPs used. In order to demonstrate the application of our system to perform high-contrast imaging of biological samples, we imaged a swine esophagus ex vivo. The measured optical power on the sample was approximately 15 mW. We obtained the esophagus from a local butcher shop and acquired co-polarized and cross-polarized images with our system. From these images, we calculated the intensity
and the depolarization ratio
For visualization, a threshold is applied, and the images are renormalized between 0 and 1. The depolarization ratio lies intrinsically between 0 and 1. The resulting images are presented in
Figure 3.
It can be seen from
Figure 3 that the depolarization ratio of the epithelial layer (EP) is very low as compared to the lamina propria (LP). Similar results were obtained when the histology slide of the esophagus was placed under a polarized light microscope. The polarized light microscope was configured in a way that only the light with polarization orthogonal to the illumination polarization passed through. It can be seen from the image in
Figure 3f that the maximum polarization change is observed for the lamina propria layer, whereas the epithelial layer barely changes the polarization of the light passing through it. Similar to previous studies [
20], the images acquired with our system confirm the depolarization properties of the lamina propria, which arises primarily from the presence of collagen. We can therefore use the depolarization ratio to effectively increase the contrast between the epithelial layer and lamina propria of the esophagus.
In a carefully designed study, our technique may potentially be used to study the organization (orientation and density) of the collagen, which has been shown to be correlated to the progression of cancer [
21,
22].


