G-Net Light: A Lightweight Modified Google Net for Retinal Vessel Segmentation


Abstract
1. Introduction
2. Related Work
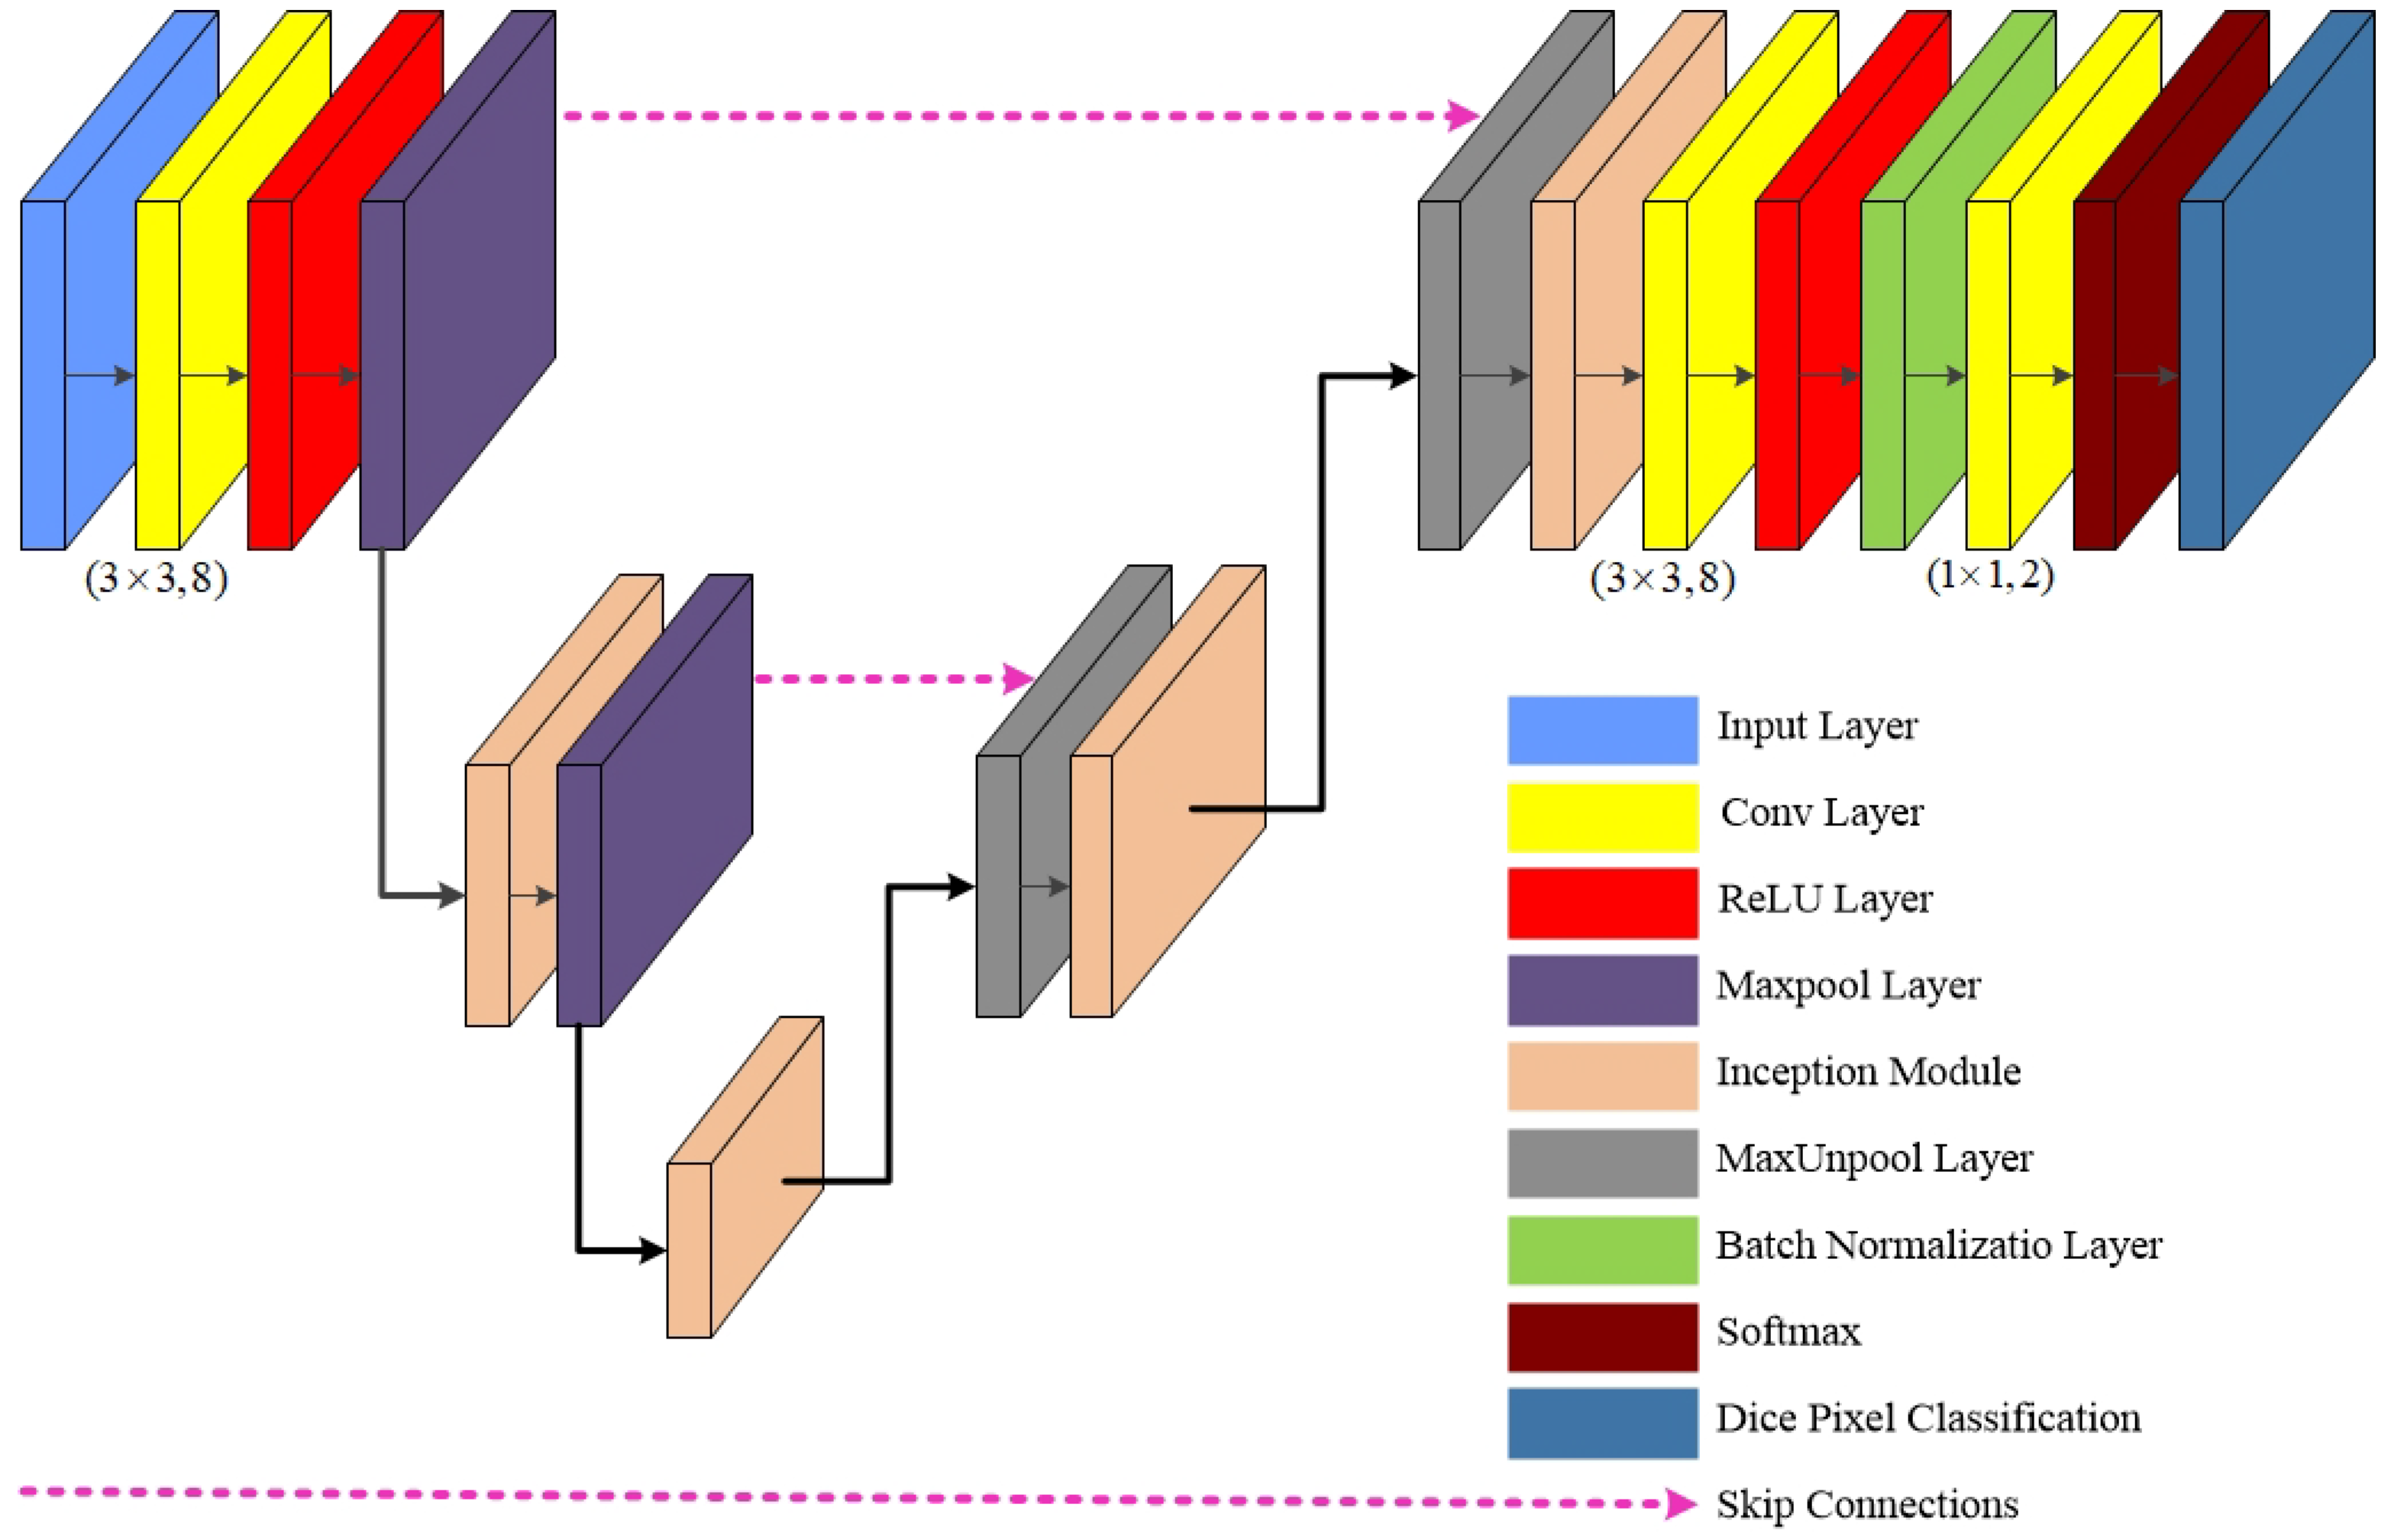
3. G-Net Light
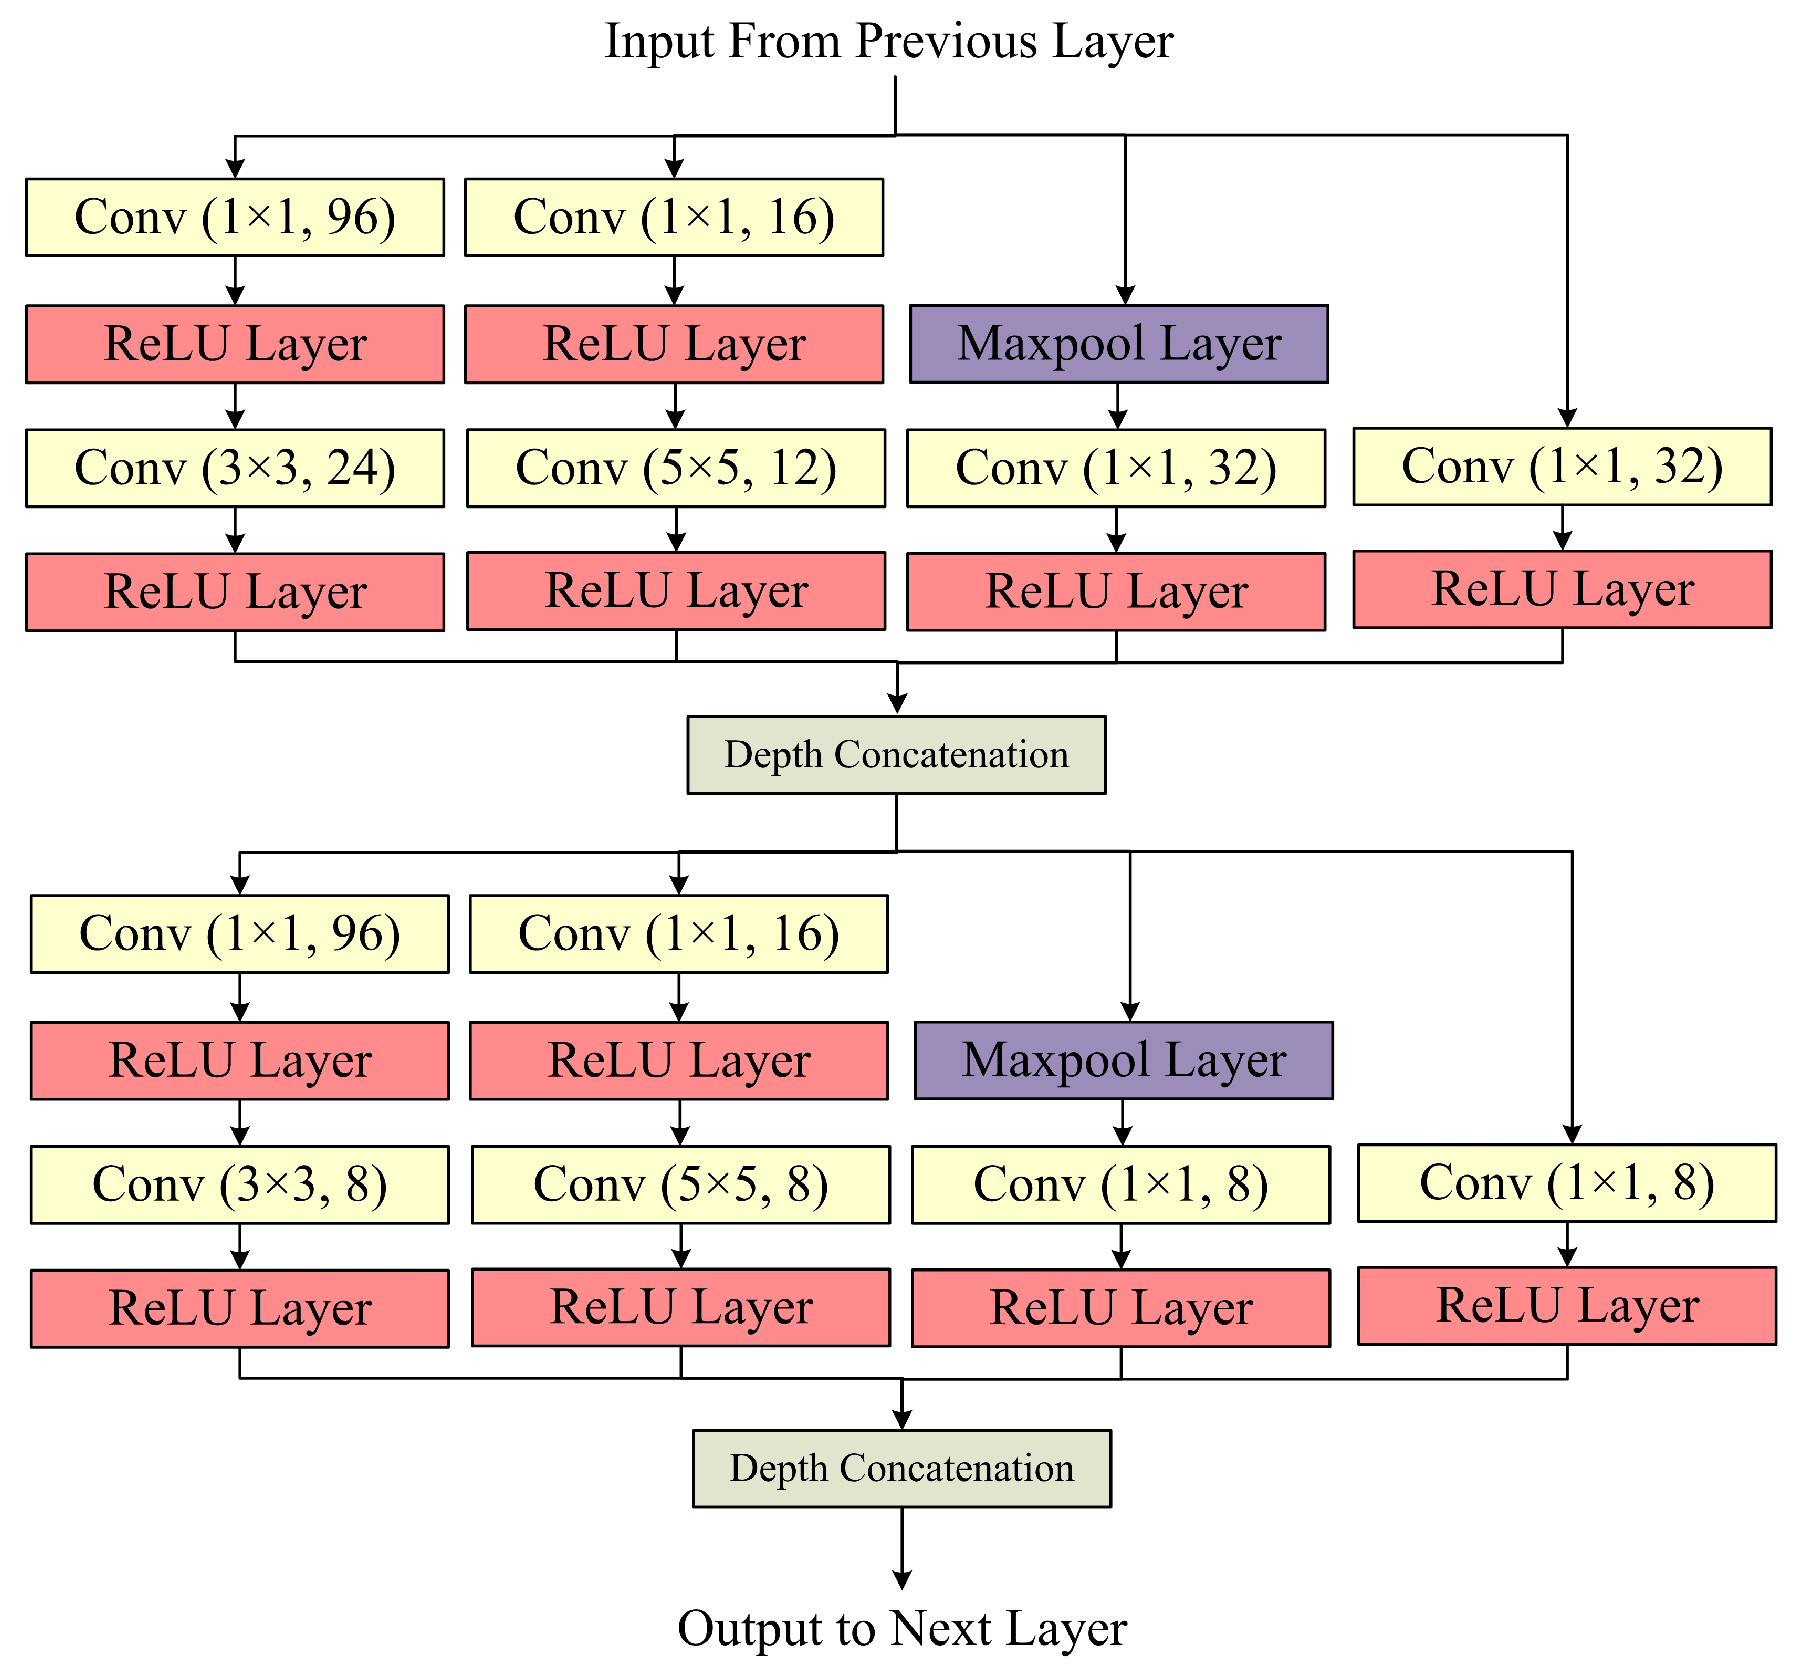
The Inception Block
4. Experimental Setup
4.1. Datasets
4.2. Implementation and Training
4.3. Evaluation Criteria
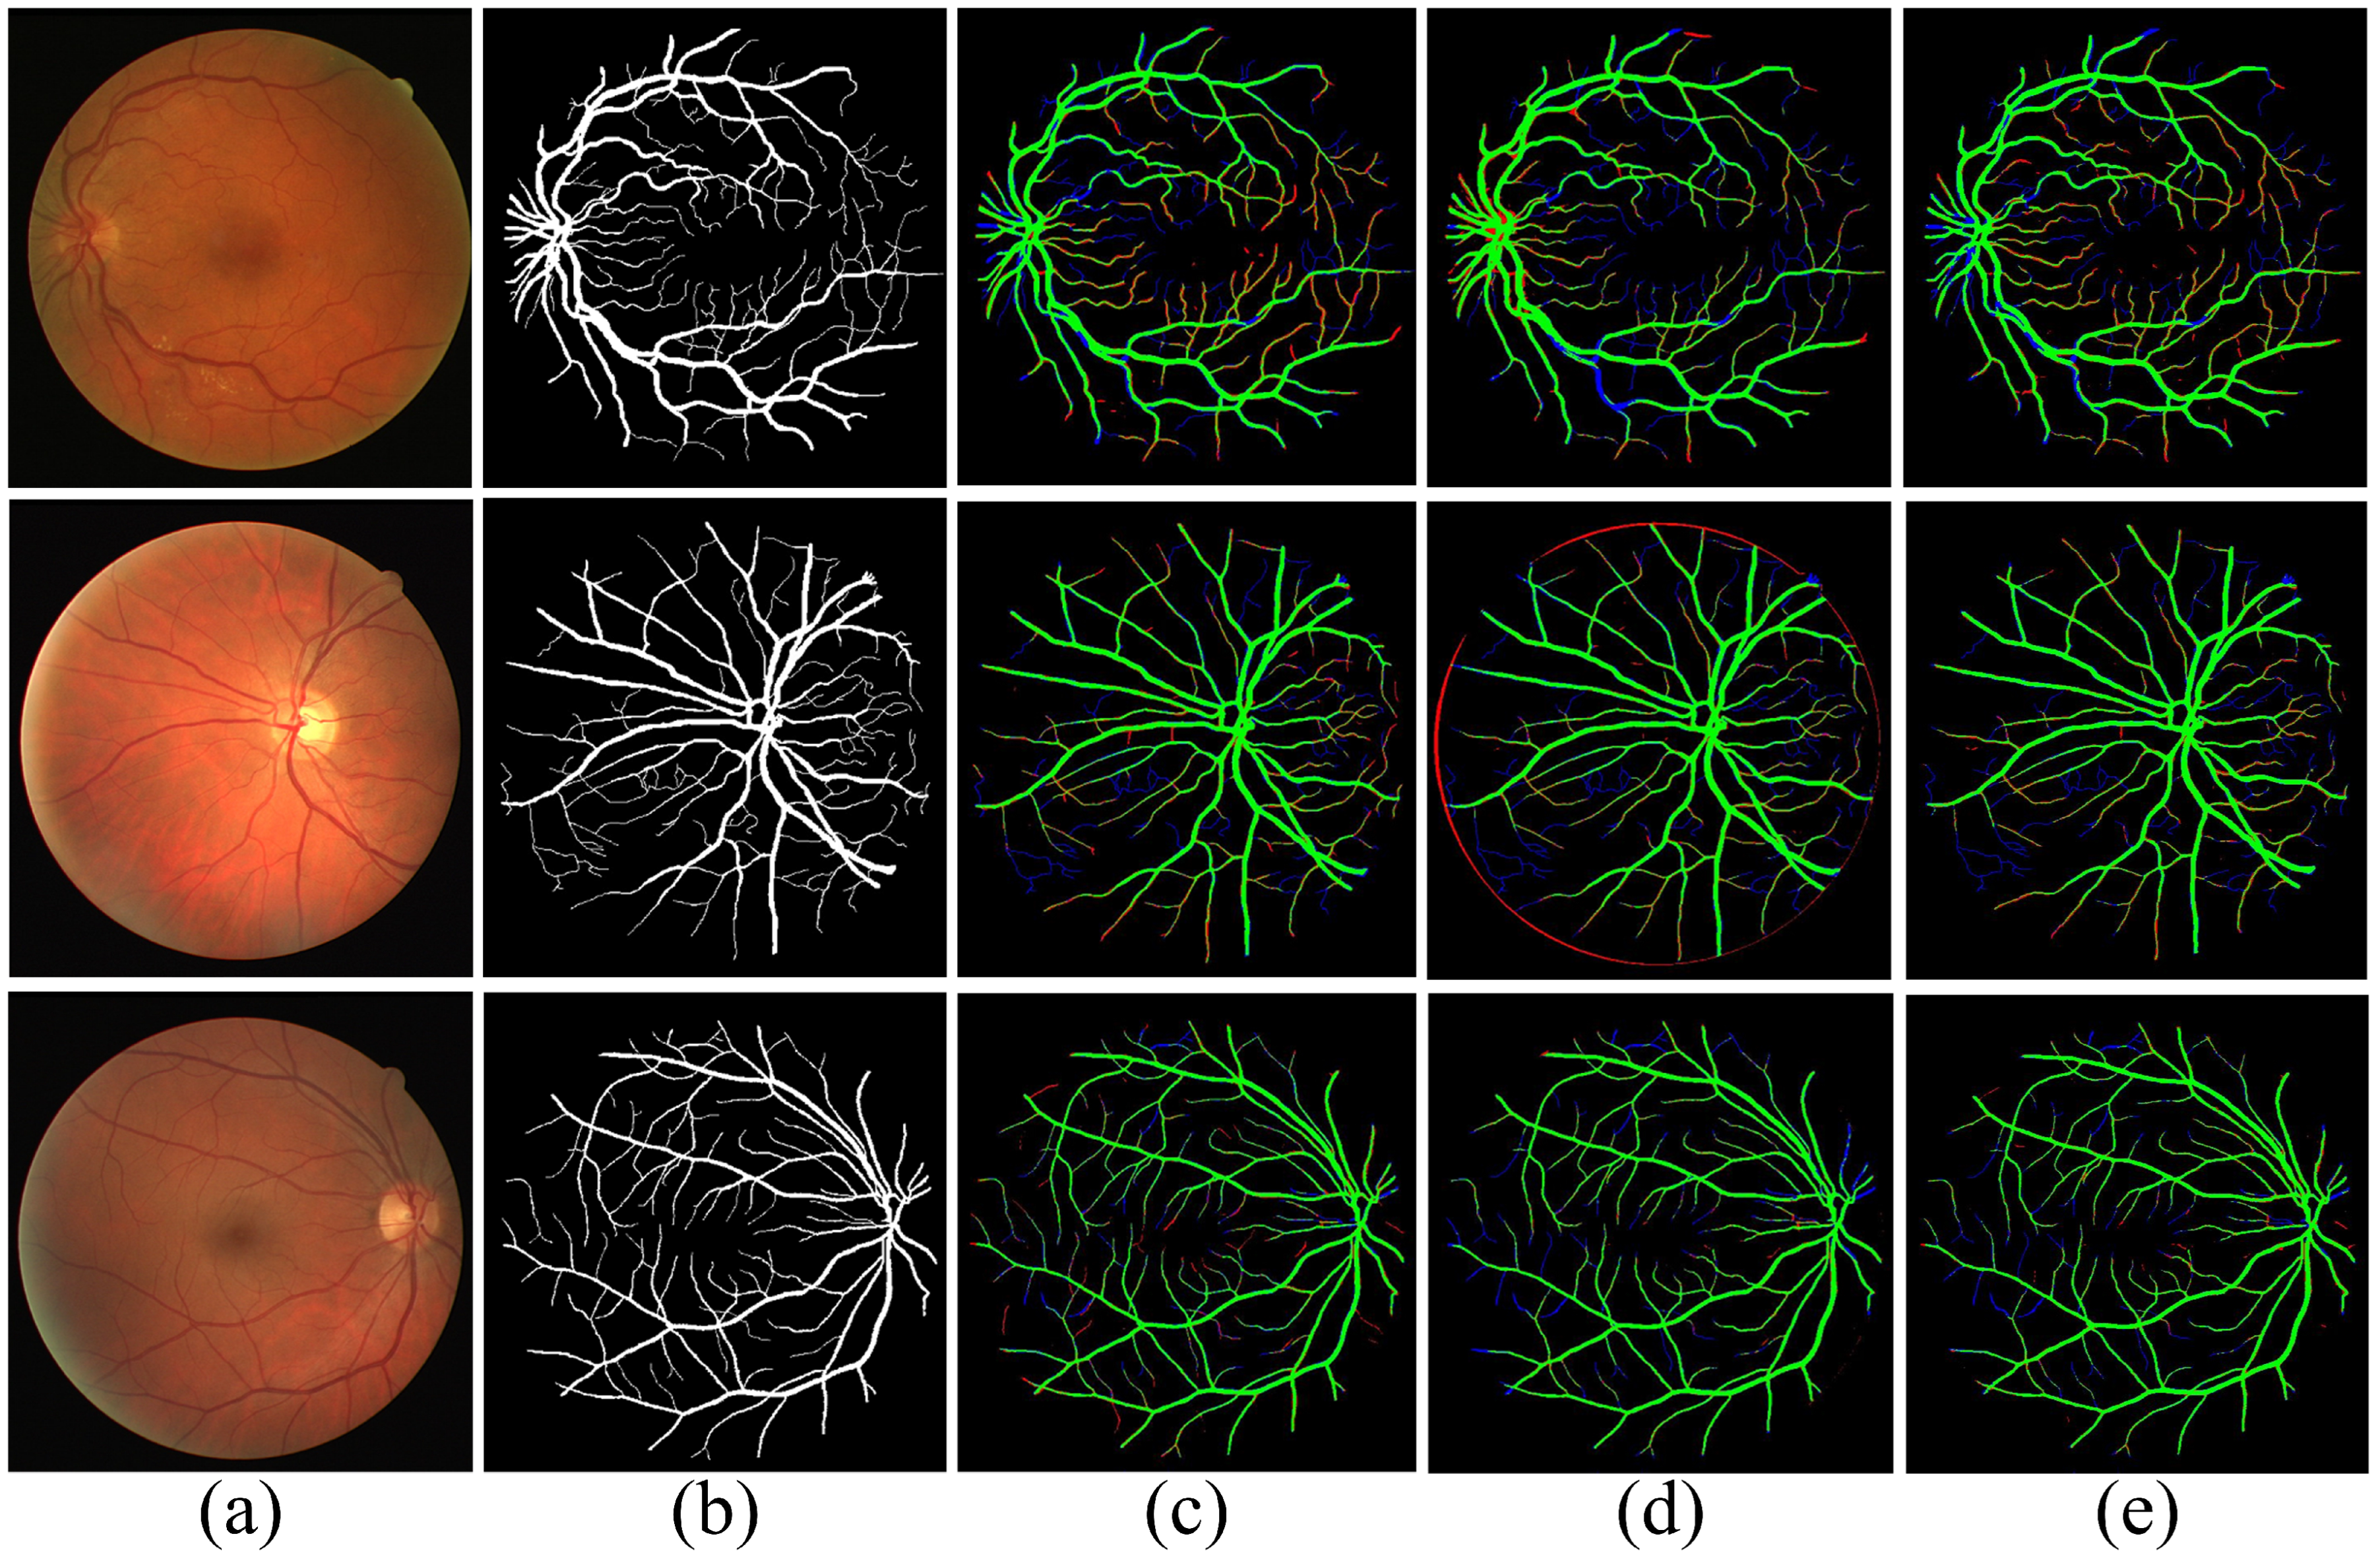
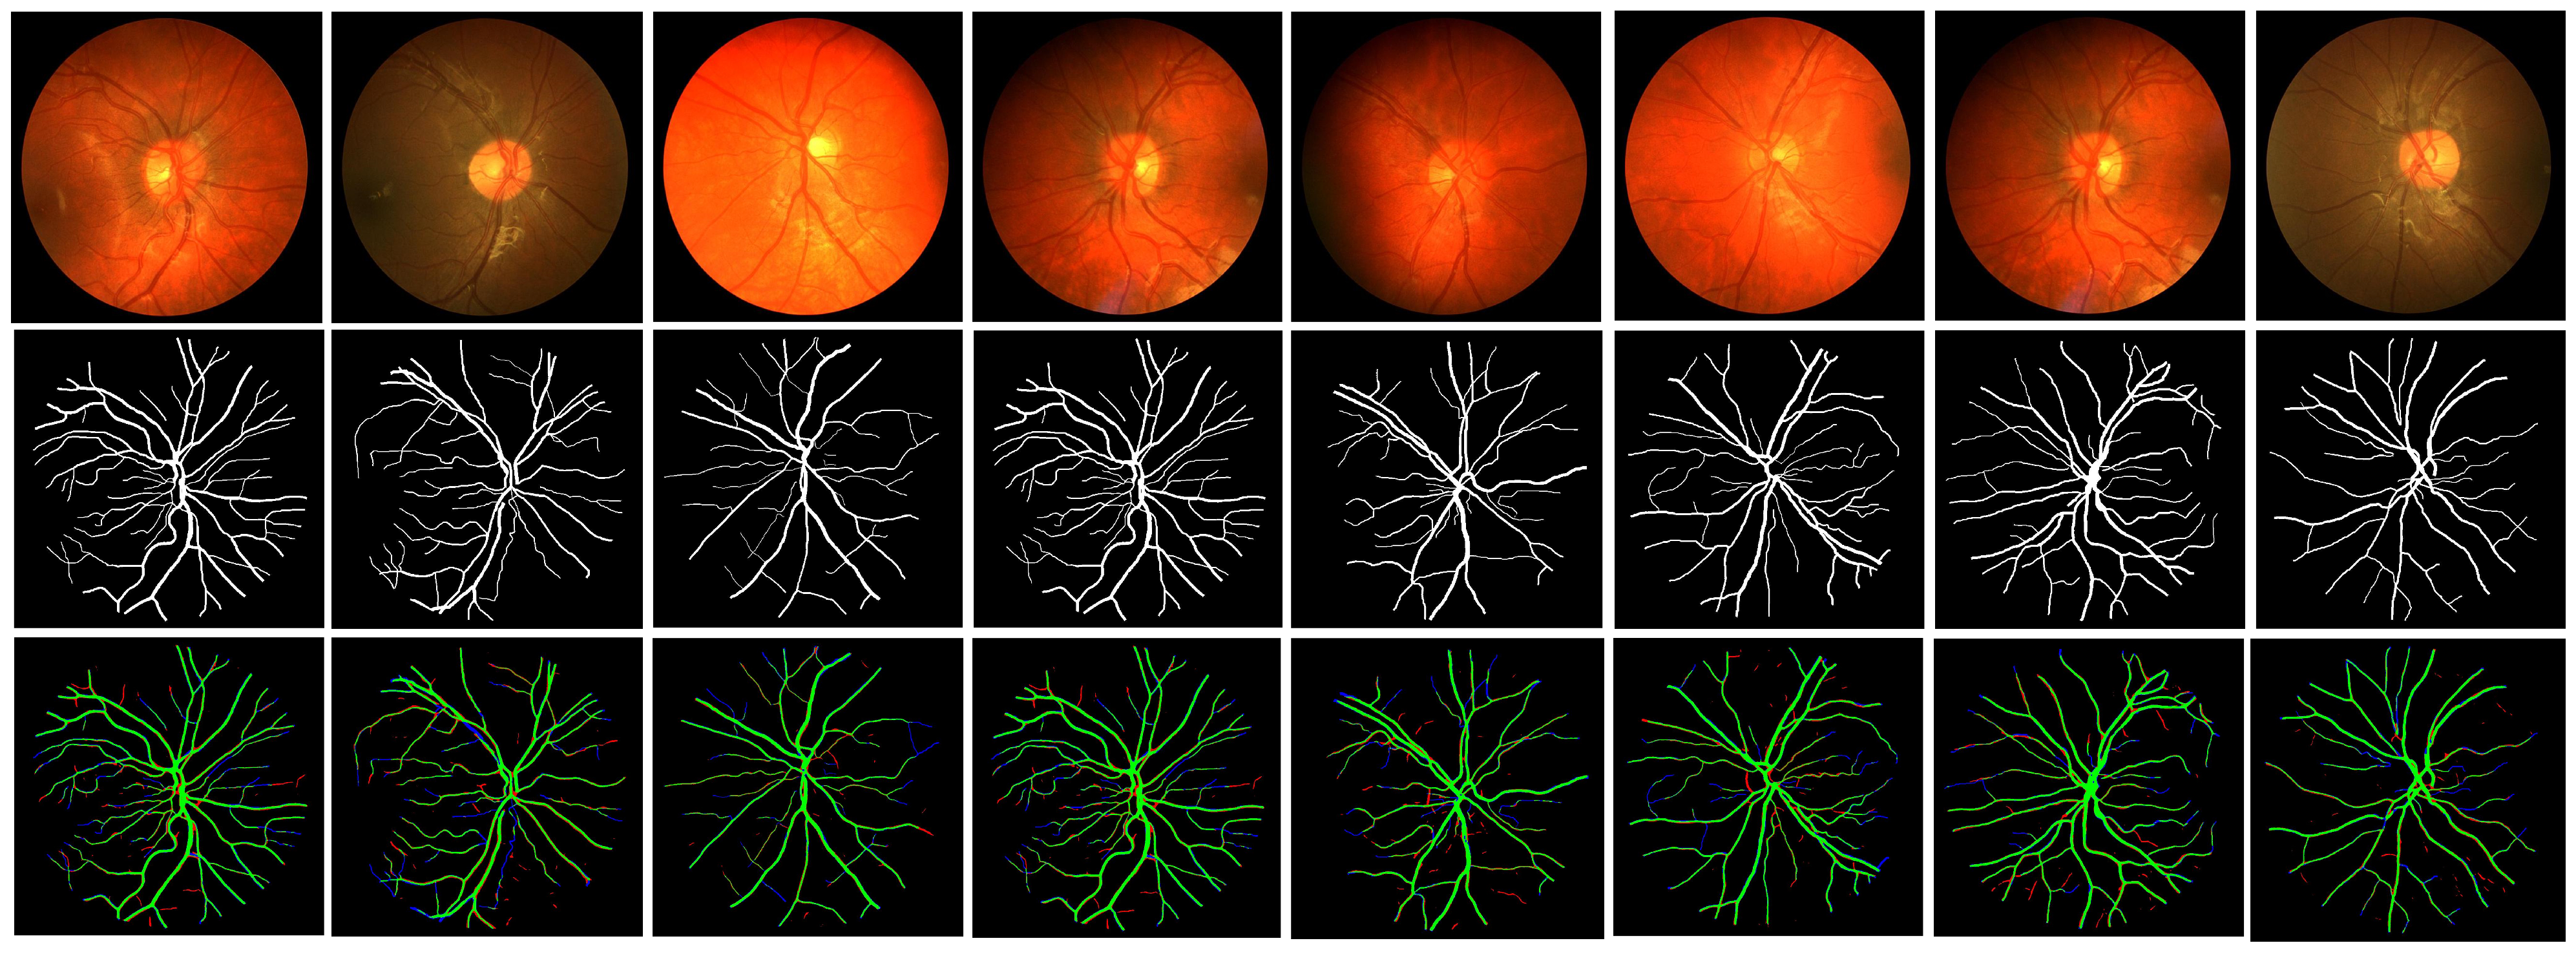
5. Analysis of the Results and Comparisons
6. Discussion
7. Conclusions
Author Contributions
Funding
Institutional Review Board Statement
Informed Consent Statement
Data Availability Statement
Conflicts of Interest
References
- Khawaja, A.; Khan, T.M.; Naveed, K.; Naqvi, S.S.; Rehman, N.U.; Junaid Nawaz, S. An Improved Retinal Vessel Segmentation Framework Using Frangi Filter Coupled With the Probabilistic Patch Based Denoiser. IEEE Access 2019, 7, 164344–164361. [Google Scholar] [CrossRef]
- Manan, M.A.; Khan, T.M.; Saadat, A.; Arsalan, M.; Naqvi, S.S. A Residual Encoder-Decoder Network for Segmentation of Retinal Image-Based Exudates in Diabetic Retinopathy Screening. arXiv 2022, arXiv:2201.05963. [Google Scholar]
- Khan, T.M.; Robles-Kelly, A.; Naqvi, S.S.; Muhammad, A. Residual Multiscale Full Convolutional Network (RM-FCN) for High Resolution Semantic Segmentation of Retinal Vasculature. In Proceedings of the Structural, Syntactic, and Statistical Pattern Recognition: Joint IAPR International Workshops, S+ SSPR 2020, Padua, Italy, 21–22 January 2021; Springer Nature: Berlin/Heidelberg, Germany, 2021; p. 324. [Google Scholar]
- Khan, T.M.; Khan, M.A.; Rehman, N.U.; Naveed, K.; Afridi, I.U.; Naqvi, S.S.; Raazak, I. Width-wise vessel bifurcation for improved retinal vessel segmentation. Biomed. Signal Process. Control 2022, 71, 103169. [Google Scholar] [CrossRef]
- Soomro, T.A.; Khan, T.M.; Khan, M.A.U.; Gao, J.; Paul, M.; Zheng, L. Impact of ICA-Based Image Enhancement Technique on Retinal Blood Vessels Segmentation. IEEE Access 2018, 6, 3524–3538. [Google Scholar] [CrossRef]
- Abdullah, F.; Imtiaz, R.; Madni, H.A.; Khan, H.A.; Khan, T.M.; Khan, M.A.U.; Naqvi, S.S. A Review on Glaucoma Disease Detection Using Computerized Techniques. IEEE Access 2021, 9, 37311–37333. [Google Scholar] [CrossRef]
- Iqbal, S.; Khan, T.M.; Naveed, K.; Naqvi, S.S.; Nawaz, S.J. Recent trends and advances in fundus image analysis: A review. Comput. Biol. Med. 2022, 151, 106277. [Google Scholar] [CrossRef] [PubMed]
- Naveed, K.; Abdullah, F.; Madni, H.A.; Khan, M.A.; Khan, T.M.; Naqvi, S.S. Towards Automated Eye Diagnosis: An Improved Retinal Vessel Segmentation Framework Using Ensemble Block Matching 3D Filter. Diagnostics 2021, 11, 114. [Google Scholar] [CrossRef]
- Imtiaz, R.; Khan, T.M.; Naqvi, S.S.; Arsalan, M.; Nawaz, S.J. Screening of Glaucoma disease from retinal vessel images using semantic segmentation. Comput. Electr. Eng. 2021, 91, 107036. [Google Scholar] [CrossRef]
- Khan, M.A.; Khan, T.M.; Aziz, K.I.; Ahmad, S.S.; Mir, N.; Elbakush, E. The use of fourier phase symmetry for thin vessel detection in retinal fundus images. In Proceedings of the 2019 IEEE International Symposium on Signal Processing and Information Technology (ISSPIT), Ajman, United Arab Emirates, 10–12 December 2019; pp. 1–6. [Google Scholar]
- Khan, T.M.; Robles-Kelly, A.; Naqvi, S.S. A Semantically Flexible Feature Fusion Network for Retinal Vessel Segmentation. In Proceedings of the Neural Information Processing; Yang, H., Pasupa, K., Leung, A.C.S., Kwok, J.T., Chan, J.H., King, I., Eds.; Springer International Publishing: Cham, Switzerland, 2020; pp. 159–167. [Google Scholar]
- Muraoka, Y.; Tsujikawa, A.; Murakami, T.; Ogino, K.; Kumagai, K.; Miyamoto, K.; Uji, A.; Yoshimura, N. Morphologic and Functional Changes in Retinal Vessels Associated with Branch Retinal Vein Occlusion. Ophthalmology 2013, 120, 91–99. [Google Scholar] [CrossRef] [PubMed]
- Thakoor, K.A.; Li, X.; Tsamis, E.; Sajda, P.; Hood, D.C. Enhancing the Accuracy of Glaucoma Detection from OCT Probability Maps using Convolutional Neural Networks. In Proceedings of the 2019 41st Annual International Conference of the IEEE Engineering in Medicine and Biology Society (EMBC), Berlin, Germany, 23–27 July 2019; pp. 2036–2040. [Google Scholar]
- Cicinelli, M.V.; Rabiolo, A.; Sacconi, R.; Carnevali, A.; Querques, L.; Bandello, F.; Querques, G. Optical coherence tomography angiography in dry age-related macular degeneration. Surv. Ophthalmol. 2018, 63, 236–244. [Google Scholar] [CrossRef]
- Zeng, X.; Chen, H.; Luo, Y.; Ye, W. Automated Diabetic Retinopathy Detection Based on Binocular Siamese-Like Convolutional Neural Network. IEEE Access 2019, 7, 30744–30753. [Google Scholar] [CrossRef]
- Traustason, S.; Jensen, A.S.; Arvidsson, H.S.; Munch, I.C.; Søndergaard, L.; Larsen, M. Retinal Oxygen Saturation in Patients with Systemic Hypoxemia. Investig. Ophthalmol. Vis. Sci. 2011, 52, 5064. [Google Scholar] [CrossRef] [PubMed]
- Kadry, S.; Rajinikanth, V.; Damaševičius, R.; Taniar, D. Retinal vessel segmentation with slime-Mould-optimization based multi-scale-matched-filter. In Proceedings of the 2021 Seventh International Conference on Bio Signals, Images, and Instrumentation (ICBSII), Chennai, India, 25–27 March 2021; pp. 1–5. [Google Scholar]
- Jiang, Y.; Zhang, H.; Tan, N.; Chen, L. Automatic Retinal Blood Vessel Segmentation Based on Fully Convolutional Neural Networks. Symmetry 2019, 11, 1112. [Google Scholar] [CrossRef]
- Khan, T.M.; Naqvi, S.S.; Arsalan, M.; Khan, M.A.; Khan, H.A.; Haider, A. Exploiting residual edge information in deep fully convolutional neural networks for retinal vessel segmentation. In Proceedings of the 2020 International Joint Conference on Neural Networks (IJCNN), Glasgow, UK, 19–24 July 2020; pp. 1–8. [Google Scholar]
- Khan, T.M.; Abdullah, F.; Naqvi, S.S.; Arsalan, M.; Khan, M.A. Shallow Vessel Segmentation Network for Automatic Retinal Vessel Segmentation. In Proceedings of the 2020 International Joint Conference on Neural Networks, Glasgow, UK, 19–24 July 2020; pp. 1–7. [Google Scholar] [CrossRef]
- Khan, T.M.; Robles-Kelly, A. Machine learning: Quantum vs classical. IEEE Access 2020, 8, 219275–219294. [Google Scholar] [CrossRef]
- Khan, T.M.; Robles-Kelly, A. A derivative-free method for quantum perceptron training in multi-layered neural networks. In Proceedings of the International Conference on Neural Information Processing, Bangkok, Thailand, 18–22 November 2020; Springer: Cham, Switzerland, 2020; pp. 241–250. [Google Scholar]
- Chen, W.; Liu, Y.; Kira, Z.; Wang, Y.; Huang, J. A Closer Look at Few-shot Classification. In Proceedings of the International Conference on Learning Representations, New Orleans, LA, USA, 6–9 May 2019. [Google Scholar]
- Kevin, M.; Serge, B.; Ser-Nam, L. A Metric Learning Reality Check. In Proceedings of the European Conference on Computer Vision, Glasgow, UK, 23–28 August 2020. [Google Scholar]
- Khan, T.M.; Naqvi, S.S.; Robles-Kelly, A.; Meijering, E. Neural Network Compression by Joint Sparsity Promotion and Redundancy Reduction. arXiv 2022, arXiv:2210.07451. [Google Scholar]
- Arsalan, M.; Khan, T.M.; Naqvi, S.S.; Nawaz, M.; Razzak, I. Prompt Deep Light-weight Vessel Segmentation Network (PLVS-Net). IEEE/ACM Trans. Comput. Biol. Bioinform. 2022. [Google Scholar] [CrossRef]
- Howard, A.; Sandler, M.; Chu, G.; Chen, L.C.; Chen, B.; Tan, M.; Wang, W.; Zhu, Y.; Pang, R.; Vasudevan, V.; et al. Searching for MobileNetV3. In Proceedings of the IEEE/CVF International Conference on Computer Vision (ICCV), Seoul, Korea, 27 October–2 November 2019. [Google Scholar]
- Ma, N.; Zhang, X.; Zheng, H.T.; Sun, J. ShuffleNet V2: Practical Guidelines for Efficient CNN Architecture Design. In Proceedings of the European Conference on Computer Vision (ECCV), Munich, Germany, 8–14 September 2018. [Google Scholar]
- Khan, T.M.; Robles-Kelly, A.; Naqvi, S.S. T-Net: A resource-constrained tiny convolutional neural network for medical image segmentation. In Proceedings of the IEEE/CVF Winter Conference on Applications of Computer Vision, Waikoloa, HI, USA, 4–8 January 2022; pp. 644–653. [Google Scholar]
- Khan, T.M.; Naqvi, S.S.; Meijering, E. Leveraging Image Complexity in Macro-Level Neural Network Design for Medical Image Segmentation. arXiv 2021, arXiv:2112.11065. [Google Scholar]
- Khan, T.M.; Robles-Kelly, A.; Naqvi, S.S. RC-Net: A Convolutional Neural Network for Retinal Vessel Segmentation. In Proceedings of the 2021 Digital Image Computing: Techniques and Applications (DICTA), Gold Coast, Australia, 29 November–1 December 2021; pp. 1–7. [Google Scholar]
- Khan, T.M.; Arsalan, M.; Robles-Kelly, A.; Meijering, E. MKIS-Net: A Light-Weight Multi-Kernel Network for Medical Image Segmentation. arXiv 2022, arXiv:2210.08168. [Google Scholar]
- Szegedy, C.; Liu, W.; Jia, Y.; Sermanet, P.; Reed, S.; Anguelov, D.; Erhan, D.; Vanhoucke, V.; Rabinovich, A. Going deeper with convolutions. In Proceedings of the IEEE Conference on Computer Vision and Pattern Recognition, Boston, MA, USA, 7–12 June 2015; pp. 1–9. [Google Scholar]
- Milletari, F.; Navab, N.; Ahmadi, S.A. V-net: Fully convolutional neural networks for volumetric medical image segmentation. In Proceedings of the 2016 Fourth International Conference on 3D Vision (3DV), Stanford, CA, USA, 25–28 October 2016; pp. 565–571. [Google Scholar]
- Xia, X.; Kulis, B. W-net: A deep model for fully unsupervised image segmentation. arXiv 2017, arXiv:1711.08506. [Google Scholar]
- Mehta, R.; Sivaswamy, J. M-net: A convolutional neural network for deep brain structure segmentation. In Proceedings of the 2017 IEEE 14th International Symposium on Biomedical Imaging (ISBI 2017), Melbourne, VIC, Australia, 18–21 April 2017; pp. 437–440. [Google Scholar]
- Zhou, Z.; Siddiquee, M.M.R.; Tajbakhsh, N.; Liang, J. Unet++: Redesigning skip connections to exploit multiscale features in image segmentation. IEEE Trans. Med. Imaging 2019, 39, 1856–1867. [Google Scholar] [CrossRef]
- Oktay, O.; Schlemper, J.; Folgoc, L.L.; Lee, M.; Heinrich, M.; Misawa, K.; Mori, K.; McDonagh, S.; Hammerla, N.Y.; Kainz, B.; et al. Attention u-net: Learning where to look for the pancreas. arXiv 2018, arXiv:1804.03999. [Google Scholar]
- Guo, Q.; Yu, Z.; Wu, Y.; Liang, D.; Qin, H.; Yan, J. Dynamic recursive neural network. In Proceedings of the IEEE/CVF Conference on Computer Vision and Pattern Recognition, Long Beach, CA, USA, 16–20 June 2019; pp. 5147–5156. [Google Scholar]
- Han, W.; Chang, S.; Liu, D.; Yu, M.; Witbrock, M.; Huang, T.S. Image super-resolution via dual-state recurrent networks. In Proceedings of the IEEE Conference on Computer Vision and Pattern Recognition, Salt Lake City, UT, USA, 18–23 June 2018; pp. 1654–1663. [Google Scholar]
- Alom, M.Z.; Yakopcic, C.; Taha, T.M.; Asari, V.K. Nuclei segmentation with recurrent residual convolutional neural networks based U-Net (R2U-Net). In Proceedings of the NAECON 2018-IEEE National Aerospace and Electronics Conference, Dayton, OH, USA, 23–26 July 2018; pp. 228–233. [Google Scholar]
- Wang, W.; Yu, K.; Hugonot, J.; Fua, P.; Salzmann, M. Recurrent U-Net for resource-constrained segmentation. In Proceedings of the IEEE/CVF International Conference on Computer Vision, Seoul, Republic of Korea, 27 October–2 November 2019; pp. 2142–2151. [Google Scholar]
- Staal, J.; Abramoff, M.D.; Niemeijer, M.; Viergever, M.A.; van Ginneken, B. Ridge-based vessel segmentation in color images of the retina. IEEE Trans. Med. Imaging 2004, 23, 501–509. [Google Scholar] [CrossRef]
- The Child Heart and Health Study in England (CHASE). Available online: https://blogs.kingston.ac.uk/retinal/chasedb1/ (accessed on 14 June 2020).
- Hoover, A.D.; Kouznetsova, V.; Goldbaum, M. Locating blood vessels in retinal images by piecewise threshold probing of a matched filter response. IEEE Trans. Med. Imaging 2000, 19, 203–210. [Google Scholar] [CrossRef] [PubMed]
- Badrinarayanan, V.; Kendall, A.; Cipolla, R. SegNet: A Deep Convolutional Encoder-Decoder Architecture for Image Segmentation. IEEE Trans. Pattern Anal. Mach. Intell. 2017, 39, 2481–2495. [Google Scholar] [CrossRef]
- Soares, J.V.B.; Leandro, J.J.G.; Cesar, R.M.; Jelinek, H.F.; Cree, M.J. Retinal vessel segmentation using the 2D Gabor wavelet and supervised classification. IEEE Trans. Med. Imaging 2006, 25, 1214–1222. [Google Scholar] [CrossRef] [PubMed]
- Tariq, M.K.; Musaed, A.; Khursheed, A.; Muhammad, A.; Syed, S.N.; Junaid, N.S. Residual Connection Based Encoder Decoder Network (RCED-Net) For Retinal Vessel Segmentation. IEEE Access 2020, 8, 131257–131272. [Google Scholar] [CrossRef]
- Song, G. DPN: Detail-Preserving Network with High Resolution Representation for Efficient Segmentation of Retinal Vessels. J. Ambient. Intell. Humaniz. Comput. 2020, 1–14. [Google Scholar] [CrossRef]
- Wu, Y.; Xia, Y.; Song, Y.; Zhang, Y.; Cai, W. Multiscale Network Followed Network Model for Retinal Vessel Segmentation. In Proceedings of the Medical Image Computing and Computer Assisted Intervention, Granada, Spain, 16–20 September 2018; pp. 119–126. [Google Scholar]
- Oliveira, A.; Pereira, S.; Silva, C.A. Retinal vessel segmentation based on fully convolutional neural networks. Expert Syst. Appl. 2018, 112, 229–242. [Google Scholar] [CrossRef]
- Song, G.; Kai, W.; Hong, K.; Yujun, Z.; Yingqi, G.; Tao, L. BTS-DSN: Deeply supervised neural network with short connections for retinal vessel segmentation. Int. J. Med. Inform. 2019, 126, 105–113. [Google Scholar]
- Yan, Z.; Yang, X.; Cheng, K. A Three-Stage Deep Learning Model for Accurate Retinal Vessel Segmentation. IEEE J. Biomed. Health Inform. 2019, 23, 1427–1436. [Google Scholar] [CrossRef]
- Wang, B.; Qiu, S.; He, H. Dual Encoding U-Net for Retinal Vessel Segmentation. In Proceedings of the Medical Image Computing and Computer Assisted Intervention, Long Beach, CA, USA, 10–15 June 2019; pp. 84–92. [Google Scholar]
- Ribeiro, A.; Lopes, A.P.; Silva, C.A. Ensemble learning approaches for retinal vessel segmentation. In Proceedings of the Portuguese Meeting on Bioengineering, Lisbon, Portugal, 22–23 February 2019; pp. 1–4. [Google Scholar]
- Khan, M.A.; Khan, T.M.; Naqvi, S.S.; Aurangzeb Khan, M. GGM classifier with multi-scale line detectors for retinal vessel segmentation. Signal Image Video Process. 2019, 13, 1667–1675. [Google Scholar] [CrossRef]
- Muhammad, A.; Muhamamd, O.; Tahir, M.; Se Woon, C.; Kang Ryoung, P. Aiding the Diagnosis of Diabetic and Hypertensive Retinopathy Using Artificial Intelligence-Based Semantic Segmentation. J. Clin. Med. 2019, 8, 1446. [Google Scholar] [CrossRef]
- Wu, Y.; Xia, Y.; Song, Y.; Zhang, D.; Liu, D.; Zhang, C.; Cai, W. Vessel-Net: Retinal Vessel Segmentation Under Multi-path Supervision. In Proceedings of the Medical Image Computing and Computer Assisted Intervention, Long Beach, CA, USA, 10–15 June 2019; pp. 264–272. [Google Scholar]
- Feng, S.; Zhuo, Z.; Pan, D.; Tian, Q. CcNet: A cross-connected convolutional network for segmenting retinal vessels using multi-scale features. Neurocomputing 2020, 392, 268–276. [Google Scholar] [CrossRef]
- Mahapatra, S.; Agrawal, S.; Mishro, P.K.; Pachori, R.B. A novel framework for retinal vessel segmentation using optimal improved frangi filter and adaptive weighted spatial FCM. Comput. Biol. Med. 2022, 147, 105770. [Google Scholar] [CrossRef]
- Ronneberger, O.; Fischer, P.; Brox, T. U-Net: Convolutional Networks for Biomedical Image Segmentation. In Proceedings of the Medical Image Computing and Computer-Assisted Intervention, Munich, Germany, 5–9 October 2015; pp. 234–241. [Google Scholar]
- Alom, M.Z.; Hasan, M.; Yakopcic, C.; Taha, T.M.; Asari, V.K. Recurrent residual convolutional neural network based on U-net (R2U-net) for medical image segmentation. arXiv 2018, arXiv:1802.06955. [Google Scholar]
- Zhuang, J. LadderNet: Multi-path networks based on U-Net for medical image segmentation. arXiv 2018, arXiv:1810.07810. [Google Scholar]
- Gu, Z.; Cheng, J.; Fu, H.; Zhou, K.; Hao, H.; Zhao, Y.; Zhang, T.; Gao, S.; Liu, J. Ce-net: Context encoder network for 2d medical image segmentation. IEEE Trans. Med. Imaging 2019, 38, 2281–2292. [Google Scholar] [CrossRef] [PubMed]
- Li, L.; Verma, M.; Nakashima, Y.; Nagahara, H.; Kawasaki, R. Iternet: Retinal image segmentation utilizing structural redundancy in vessel networks. In Proceedings of the IEEE/CVF Winter Conference on Applications of Computer Vision, Snowmass Village, CO, USA, 1–5 March 2020; pp. 3656–3665. [Google Scholar]
- Zhang, Q.L.; Yang, Y.B. Sa-net: Shuffle attention for deep convolutional neural networks. In Proceedings of the ICASSP 2021–2021 IEEE International Conference on Acoustics, Speech and Signal Processing (ICASSP), Toronto, ON, Canada, 6–11 June 2021; pp. 2235–2239. [Google Scholar]
- Yuan, Y.; Zhang, L.; Wang, L.; Huang, H. Multi-level attention network for retinal vessel segmentation. IEEE J. Biomed. Health Inform. 2021, 26, 312–323. [Google Scholar] [CrossRef]
- Zhang, T.; Li, J.; Zhao, Y.; Chen, N.; Zhou, H.; Xu, H.; Guan, Z.; Yang, C.; Xue, L.; Chen, R.; et al. MC-UNet Multi-module Concatenation based on U-shape Network for Retinal Blood Vessels Segmentation. arXiv 2022, arXiv:2204.03213. [Google Scholar]
- Romera, E.; Álvarez, J.M.; Bergasa, L.M.; Arroyo, R. ERFNet: Efficient Residual Factorized ConvNet for Real-Time Semantic Segmentation. IEEE Trans. Intell. Transp. Syst. 2018, 19, 263–272. [Google Scholar] [CrossRef]
- Atli, I.; Gedik, O.S. Sine-Net: A fully convolutional deep learning architecture for retinal blood vessel segmentation. Eng. Sci. Technol. Int. J. 2021, 24, 271–283. [Google Scholar] [CrossRef]
- Laibacher, T.; Weyde, T.; Jalali, S. M2U-Net: Effective and Efficient Retinal Vessel Segmentation for Real-World Applications. In Proceedings of the IEEE Conference on Computer Vision and Pattern Recognition Workshops, CVPR Workshops 2019, Long Beach, CA, USA, 16–20 June 2019; pp. 115–124. [Google Scholar]


| Dataset | Ground-Truth | Performance | |||
|---|---|---|---|---|---|
| - | |||||
| DRIVE | 1st Manual | 0.8192 | 0.9829 | 0.9686 | 0.8202 |
| 2nd Manual | 0.8714 | 0.9734 | 0.9807 | 0.8724 | |
| Average | 0.8453 | 0.9782 | 0.9747 | 0.8463 | |
| CHASE | 1st Observer | 0.8210 | 0.9838 | 0.9726 | 0.8048 |
| 2nd Observer | 0.8932 | 0.9823 | 0.9847 | 0.8770 | |
| Average | 0.8571 | 0.9831 | 0.9787 | 0.8409 | |
| STARE | Dr. Adam Hoover | 0.8170 | 0.9853 | 0.9730 | 0.8178 |
| Dr. Valentina Kouznetsova | 0.8892 | 0.9838 | 0.9851 | 0.8900 | |
| Average | 0.8531 | 0.9846 | 0.9791 | 0.8539 | |
| Method | Year | - | |||
|---|---|---|---|---|---|
| SegNet [46] | 2017 | 0.7949 | 0.9738 | 0.9579 | 0.8180 |
| MS-NFN [50] | 2018 | 0.7844 | 0.9819 | 0.9567 | N.A |
| FCN [51] | 2018 | 0.8039 | 0.9804 | 0.9576 | N.A |
| BTS-DSN [52] | 2019 | 0.7891 | 0.9804 | N.A | N.A |
| Three-stage CNN [53] | 2019 | 0.7631 | 0.9820 | 0.9538 | N.A |
| DE U-Net [54] | 2019 | 0.7986 | 0.9736 | 0.9511 | N.A |
| EL Approach [55] | 2019 | 0.7880 | 0.9819 | 0.9569 | N.A |
| GGM [56] | 2019 | 0.7820 | 0.9860 | 0.9600 | N.A |
| VessNet [57] | 2019 | 0.8022 | 0.9810 | 0.9655 | N.A |
| Vessel-Net [58] | 2019 | 0.8038 | 0.9802 | 0.9578 | N.A |
| CcNet [59] | 2020 | 0.7625 | 0.9809 | 0.9528 | N.A |
| AWS FCM [60] | 2022 | 0.7020 | 0.9844 | 0.9605 | 0.7531 |
| Proposed Method | 2022 | 0.8192 | 0.9829 | 0.9686 | 0.8202 |
| Method | Year | - | |||
|---|---|---|---|---|---|
| U-Net [61] | 2016 | 0.7764 | 0.9865 | 0.9643 | N.A |
| R2u-net [62] | 2018 | 0.7756 | 0.9820 | 0.9634 | N.A |
| Laddernet [63] | 2018 | 0.7978 | 0.9818 | 0.9656 | 0.8031 |
| Ce-net [64] | 2019 | 0.8008 | 0.9723 | 0.9633 | N.A |
| Iternet [65] | 2020 | 0.7969 | 0.9820 | 0.9702 | 0.8073 |
| SA-Unet [66] | 2021 | 0.8151 | 0.9809 | 0.9708 | 0.7736 |
| AACA-MLA-D-Unet [67] | 2021 | 0.8302 | 0.9810 | 0.9673 | 0.8248 |
| MC-UNet [68] | 2022 | 0.8366 | 0.9829 | 0.9714 | 0.7741 |
| Proposed Method | 2022 | 0.8210 | 0.9838 | 0.9726 | 0.8048 |
| Method | Year | - | |||
|---|---|---|---|---|---|
| U-Net [61] | 2016 | 0.7764 | 0.9865 | 0.9643 | N.A |
| R2u-net [62] | 2018 | 0.7756 | 0.9820 | 0.9634 | N.A |
| Laddernet [63] | 2018 | 0.7822 | 0.9804 | 0.9613 | 0.7994 |
| BTS-DSN [52] | 2019 | 0.8212 | 0.9843 | N.A | N.A |
| Dual Encoding U-Net [54] | 2019 | 0.7914 | 0.9722 | 0.9538 | N.A |
| GGM [56] | 2019 | 0.7960 | 0.9830 | 0.9610 | N.A |
| Ce-net [64] | 2019 | 0.7909 | 0.9721 | 0.9732 | N.A |
| CcNet [59] | 2020 | 0.7709 | 0.9848 | 0.9633 | N.A |
| Iternet [65] | 2020 | 0.7969 | 0.9823 | 0.9760 | 0.8073 |
| SA-Unet [66] | 2021 | 0.7120 | 0.9930 | 0.9521 | 0.7736 |
| AACA-MLA-D-Unet [67] | 2021 | 0.7914 | 0.9870 | 0.9665 | 0.8276 |
| MC-UNet [68] | 2022 | 0.7360 | 0.9947 | 0.9572 | 0.7865 |
| Proposed Method | 2022 | 0.8170 | 0.9853 | 0.9730 | 0.8178 |
| Method | Parameters (M) | Size in (MB) | DRIVE | CHASE | STARE | |||
|---|---|---|---|---|---|---|---|---|
| - | - | - | ||||||
| Image BTS-DSN [52] | 7.80 | N.A | 0.9551 | 0.8201 | 0.9627 | 0.7983 | 0.9660 | N.A |
| MobileNet-V3-Small [27] | 2.50 | 11.00 | 0.9371 | 0.6575 | 0.9571 | 0.6837 | N.A | N.A |
| ERFNet [69] | 2.06 | 8.00 | 0.9598 | 0.7652 | 0.9716 | 0.7872 | N.A | N.A |
| Sine-Net [70] | 0.69 | N.A | 0.9685 | N.A | 0.9676 | N.A | 0.9711 | N.A |
| M2U-Net [71] | 0.55 | 2.20 | 0.9630 | 0.8091 | 0.9703 | 0.8006 | N.A | 0.7814 |
| Proposed G-Net Light | 0.39 | 1.52 | 0.9686 | 0.8202 | 0.9726 | 0.8048 | 0.9730 | 0.8178 |
Publisher’s Note: MDPI stays neutral with regard to jurisdictional claims in published maps and institutional affiliations. |
© 2022 by the authors. Licensee MDPI, Basel, Switzerland. This article is an open access article distributed under the terms and conditions of the Creative Commons Attribution (CC BY) license (https://creativecommons.org/licenses/by/4.0/).
Share and Cite
Iqbal, S.; Naqvi, S.S.; Khan, H.A.; Saadat, A.; Khan, T.M. G-Net Light: A Lightweight Modified Google Net for Retinal Vessel Segmentation. Photonics 2022, 9, 923. https://doi.org/10.3390/photonics9120923
Iqbal S, Naqvi SS, Khan HA, Saadat A, Khan TM. G-Net Light: A Lightweight Modified Google Net for Retinal Vessel Segmentation. Photonics. 2022; 9(12):923. https://doi.org/10.3390/photonics9120923
Chicago/Turabian StyleIqbal, Shahzaib, Syed S. Naqvi, Haroon A. Khan, Ahsan Saadat, and Tariq M. Khan. 2022. "G-Net Light: A Lightweight Modified Google Net for Retinal Vessel Segmentation" Photonics 9, no. 12: 923. https://doi.org/10.3390/photonics9120923
APA StyleIqbal, S., Naqvi, S. S., Khan, H. A., Saadat, A., & Khan, T. M. (2022). G-Net Light: A Lightweight Modified Google Net for Retinal Vessel Segmentation. Photonics, 9(12), 923. https://doi.org/10.3390/photonics9120923