Abstract
A frequency division multiplexing (FDM) WMS system for multi-gas detection is reported in this paper. The distributed feedback lasers with different wavelengths adopt different modulation frequencies to achieve multi-components gas detection by the FDM technology. Combining optical path extension, normalized harmonic detection and wavelength modulation spectroscopy technology, the highly self-made system realized high sensitivity, high precision and short response time. The performance of this system was evaluated through the mixed gas of methane and hydrogen chloride. Experimental results show great linear response between gas concentration and normalized second harmonic (2f/1f) signal, the minimum detection limit (MDL) of the system is calculated to be 30.16 ppb for CH4 and 31.6 ppb for HCl with the integration time of 15 s. The MDL could be further enhanced to 11 ppb for CH4 and 13.1 ppb for HCl with an extended integration time. The maximum relative error is 2.16% and 3.19% for CH4 and HCl respectively.
1. Introduction
Gas detection is a technology for qualitative and quantitative analysis of gas molecules, it has important applications in many fields, such as environmental monitoring, medical diagnosis and industrial processes [1,2]. Gas detection technology can be divided into non-optical and optical methods according to the operating principle. Non-optical methods have the disadvantages of low accuracy, slow response speed and weak anti-interference [3]. The optical methods based on absorption spectrum mainly include non-dispersive infrared (NDIR) [4,5], Fourier transform infrared spectroscopy(FTIR) [6,7], photoacoustic spectroscopy (PAS) [8,9] and tunable diode laser absorption spectroscopy (TDLAS) [10,11]. TDLAS was pioneered by Hinkley and Reid et al. since 1970s [12,13], and has been widely used and developed due to the superiority of high sensitivity, strong selectivity and short response time [14,15].
TDLAS can be divided into direct absorption spectrum(DAS) and wavelength modulation absorption spectrum(WMS) [16]. WMS method uses harmonics generated by modulating the laser wavelength to suppress noise and avoids baseline fitting required in the DAS method. Theoretical and experimental results confirm that the measurement accuracy and detection stability of WMS technology are superior to those of DAS, and it is more suitable for trace gas detection [17,18].
With the rapid development of industry technology, the demand of multi-gas detection is becoming more prominent, it is difficult to fulfil the request only by the existing sensors. In recent years, researchers have poured an extraordinary amount of dedication into multi-gas sensors. Fried et al. described a tunable diode laser system for measurements of carbonyl sulfide(OCS). By using the jumping scanning technique, the system has achieved measurement of two species with the precision in the range from ±0.3% to ±1% simultaneously [19]. Wei et al. Introduced a fiber optical TDLAS detection system for multi-gas analysis, and continuous detection of CH4, C2H2, CO, CO2, and C2H4 are implemented [20]. Chen et al. reported a photoacoustic multi-gas analyzer for measuring the concentration of C2H2, CO, CO2, CH4, C2H6 and C2H4 by using a mid-infrared broadband source and a band-pass filter, which achieved the minimum detection limits of 27 ppb,10 ppb,94 ppb,24 ppb,20 ppb and 37 ppb [21]. Cao et al. developed a photoacoustic spectrometer(PAS) device which consists of three acoustic resonators with different frequencies and three laser diodes. such PAS device achieved the measurement of aerosol absorption at three wavelengths. Owing to each wavelength operation at resonant mode, high time resolution was achieved while ensuring high sensitivity. [22]. Wang et al. demonstrated a TDLAS sensor using a different frequency generation (DFG) laser for the investigation of the hydrocarbon gases. This sensor realized time-sharing measurement of nine different hydrocarbon molecules and the R2 values close to 1 indicate the preferable accuracy of the sensor [23].
Absorption spectral profiles for the target substances centered at different wavelengths should be scanned if real-time monitoring of multi-component gases is required. Using monolithic integrated DFB laser array as light source has the drawbacks of slow tuning rate and high cost. Typical WMS method adopted the time division multiplexing(TDM) scheme, and scanned each complete absorption spectrum of the target species in a cascade manner. TDM measurements require longer scanning period due to the duty cycle of each laser is reduced by multiplexing. In addition, there is the potential for loss of absorption peak locking because each laser is not working constantly. However, in the scheme of FDM, the scanning frame rate of the sensor is greatly reduced, only more calculations are needed in the process of signal processing. The FDM method guarantees a high frame rate for multi-gas detection.
In our previous work, a WMS detection system based on entire absorption spectrum scanning with tunable inter-band cascade laser(ICL) was proposed and implemented on the hardware, and the detection model which contains three target wavelengths were preliminarily established [24]. Based on the traditional harmonic method, this article combines the FDM technology, which can be used to monitor the concentration of the multiple gases synchronously. Wavelength division scanning is adopted in frequency division multiplexing to make further improvement on the scanning rate. Compared with the integrated laser with wide tuning range, the beam coupling mode of independent narrow linewidth laser can greatly improve the tuning rate because it does not need to scan the whole absorption spectrum. The designed system is highly self-made, and its performance was evaluated at different CH4 and HCl concentration levels. The detection system shows perfect MDL (CH4:23 ppb; HCl:25 ppb) and linear response between the 2f/1f signal and gas concentration (CH4: R2 = 0.9982; HCl: R2 = 0.9996). This scheme has potential application in scenarios where the simultaneous detection of multiple trace gases is required in complicated environment.
2. Basic Theory (Principle) of Multi-Gas Detection
2.1. Gas Absorption Line Selection
The crux of selecting the absorption peak of the measured gases in the mixed gas is to avoid the interference of other gas molecules, and the intensity of the selected absorption line is strong enough to ensure a high SNR. Figure 1 shows the near infrared absorption spectra of methane and hydrogen chloride based on HITRAN database [25], the HCl absorption line located at 5723.27 cm−1 (1747.26 nm) and the CH4 absorption line located at 6046.96 cm−1(1653.72 nm) meet the measurement requirements, where the intensities of two absorption lines are 1.27 × 10⁻²⁰ cm−1/(molecule−1·cm−2) and 1.42 × 10⁻²¹ cm−1/(molecule−1·cm−2) respectively. The absorption coefficient (@ 296 K, 1 atm) is 0.3669 cm−1 for CH4 (6046.96 cm−1) and 1.081 cm−1 for HCl (6046.96 cm−1).
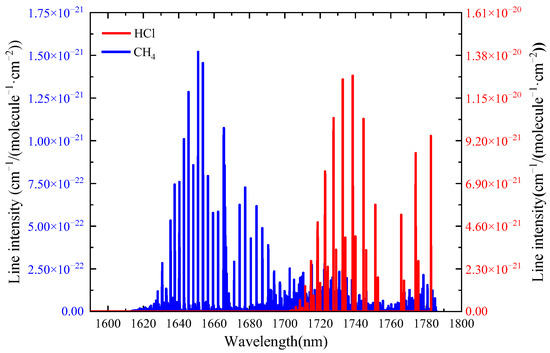
Figure 1.
Absorption spectrum of HCl and CH4 in the near infrared region retrieved from the HITRAN database.
2.2. Normalized Harmonic Detection WMS Method
After absorption in the uniform medium, the relationship between the incident intensity and transmitted and intensity of the light beam can be described by the Beer-Lambert relation [26]:
where and are the intensities of transmitted and incident laser light respectively, is the concentration of tested gas. Moreover, the absorption coefficient is represented by the total gas pressure , the strength of the gas absorption line and the linear function of absorption line .
When the absorption is weak, , can be expressed as:
For WMS measurement, the laser is modulated periodically. Herein, fast sinusoidal modulation in the kHz-range is overlapped on the slower modulation with a linear slope. The sinusoidal modulation can be expressed as:
where is the average laser intensity, is the modulation coefficient of the sinusoidal modulation with a phase shift , is the sinusoidal modulation frequency corresponding to different lasers. Because of the minor modulation depth and frequency, the nonlinear modulation could be ignored. Expanding the formula with Fourier series after substituting Equation (3) into Equation (2):
The H term in Equation (4) can be expressed as:
At the central frequency of the absorption line, when is odd, the term is 0, when is even, the term has a maximum value. In addition, the value of term decays rapidly with the increase of value.
After the procedure of lock-in amplification and low-pass filtering, the quadrature components of the first and second harmonic signals at the center of the absorption spectrum can be represented as:
where characterize the optoelectronic gain of the detection system, It does not need to be measured as the term will be eliminated during the process of normalization. In addition, the phase shift between the detection signal and reference signal can be compensated by the designed program automatically in the process of harmonic detection. Therefore, the magnitude of the harmonic signal can be expressed by the following equation:
WMS utilized a more complex laser modulation to generate higher harmonics of the absorption signal, thereby shifting the measured signals to higher frequencies to reduce intensity noise via phase sensitive detection.
Under the condition of weak absorption, the harmonic signal at the central frequency of the absorption line can be expressed as:
The normalized second harmonic is represented by the following:
It illustrated that using signal to normalize signal can eliminate the dependence of signal on laser power intensity and the gain of photodetector.
Owning to the term carries the information of modulation frequency, it can be seen from Equations (11) and (12) that the corresponding harmonic signal information can be obtained according to different sinusoidal modulation frequencies. This provides a theoretical basis for applying frequency division multiplexing technology to WMS measurement.
2.3. FDM Detection Principle
The kernel of frequency division multiplexing applied to multi-gas WMS detection system is to detect gases of different components by changing the modulation signal frequency generated from MCU and the reference signal frequency of phase-locked amplification model. In our specific experimental process, sinusoidal modulation signals with frequencies of 9 kHz and 10 kHz were simultaneously applied to the two DFB lasers on the basis of applying 10 Hz sawtooth modulation signal. Therefore, when the reference signal frequencies are 9 kHz, 18 kHz, 10 kHz and 20 kHz, the corresponding concentration information of two gases could be demodulated at the same instant. The frequency selection of modulated signal is mainly affected by the DAC output frequency limitation and the frequency response characteristics of bandpass filter.
When FDM-WMS system needs to detect different kinds of gases, it only needs to replace DFB lasers with different wavelengths; if there is a need to expand the type of measured gas, the frequency of the modulated and reference signals needs to be changed. Hence, the FDM system can be widely used in a variety of detection scenarios.
3. Experimental Setup and Results
Figure 2a depicts the schematic diagram of the multi-gas measurement system, which includes the optical and electrical construction.
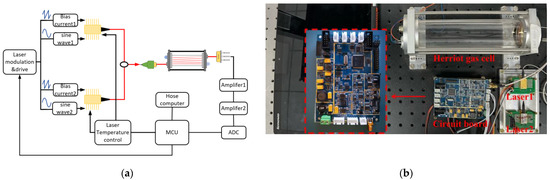
Figure 2.
The structure of the designed multi-gas sensor: (a) Schematic structure of the FDM-WMS multi-gas detection system.; (b) Photo of the detection platform and the homemade circuit board.
In the optical composition, two fiber coupled distributed feedback diode (DFB) laser are utilized as excitation sources. Two laser beams coupled into one beam of light through the 2 × 1 coupler (Thorlab, TW1650R5A1, Newton, NJ, USA), then a space laser beam is formed by using a collimator (Thorlab, SMPF0115-APC, Newton, NJ, USA) and incident into the gas chamber. An optical simulation is carried out to determine the structural parameters of the Herriot gas chamber. In order to increase the optical path length, the distance between two reflectors is set to 227 mm, and the angle shift of off-axis hole is set to 45°, which achieve an optical length of 12.5 m. A Gaussian light source is set as the incident light in the simulation, in which the incidence angle is set to 3.195° (x direction) and 5.815° (y direction). The self-made Herriot gas chamber is composed of two protected gold-coated concave mirror with off-axis hole (Thorlabs, CM508-200EH4-M02, Newton, NJ, USA) and a hollow cylindrical quartz shell, which furnish 12.5 m absorption optical path length brought by 28 reflection between two mirrors. The light spot distribution on the mirror is shown in Figure 3. Meanwhile, two CaF2 cuneate windows has been installed at the imports of laser beam to avoid etalon effect. In order to simplify the optical alignment process of the sensing system, a red visible laser source has been coupled with the DFB laser beam to track the DFB beam. After interacting with the target gas, the transmission light output from the gas chamber irradiates on the InGaAs photodetector (Lightsensing Technologies, model LSIPD21-1, Beijing, China).
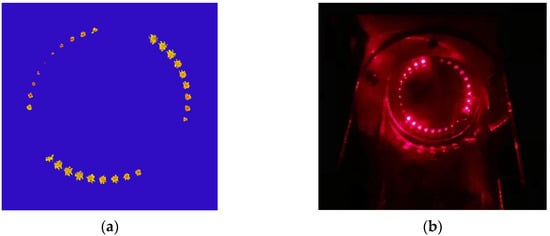
Figure 3.
Light spot distribution on the concave mirror (a) Optical simulation result.; (b) Picture of the gas chamber.
The elements of the electrical part are integrated on the self-made circuit, as shown in Figure 2b. The temperature of the DFB laser is controlled by the thermistor and thermo electric cooler (TEC) in the DFB laser package and the homemade circuit based on a MAX1978. The current of laser is controlled by a signal generator and a DC current source. The signal generator is used to engender sawtooth wave signals(10 Hz) and sine wave modulation signals with different frequencies, which are 9 kHz and 10 kHz. The amplifier circuit which uses AD8652 as the core chip realizes the signal amplification and current voltage conversion of the outlet signal from the photodetector. The signal is filtered by the band-pass filter circuit based on a MAX7491 and collected by an analog digital conversion(AD7366). In order to eliminate the affect of noise, especially 1/f noise, the phase-locked amplification algorithm is used to demodulate the harmonic signals. Finally, the normalization algorithm is used to process the harmonic signals. Some key parameters can be debugged by the microcontroller unit(MCU) integrated in the circuit.
The DFB lasers used in the experiment are self-packaged by our laboratory, which adopt 14 pin butterfly package with built-in TEC, thermistor and backlight detector to ensure the stability of output lasers. The central wavelengths of the two DFB lasers are 1652.29 nm and 1745.73 nm(25 °C, 60 mA) respectively. The temperature-current-wavelength tuning relationship of the two lasers is shown in Figure 4. The temperature tuning coefficient of the two lasers are 0.098 nm/°C and 0.118 nm/°C, and the current tuning coefficient of each laser are 0.021 nm/mA and 0.012 nm/mA. In the experimental process, the wavelength of the lasers is adjusted near the molecular absorption peak by temperature tuning firstly, and then accurately modulated by current tuning. A wavelength drift correction algorithm based on closed-loop negative feedback structure is introduced into the designed system, in order to decrease the impact of wavelength drift on the detection results. Furthermore, the power-current(P-I) curves are shown in Figure 5, which reflect great linearity.
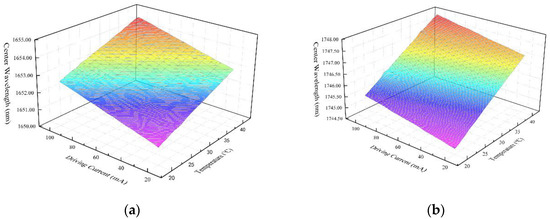
Figure 4.
The temperature-current-wavelength tuning relationship of the two lasers: (a) wavelength tuning characteristics of the laser for CH4 detection.; (b) wavelength tuning characteristics of the laser for HCl detection.
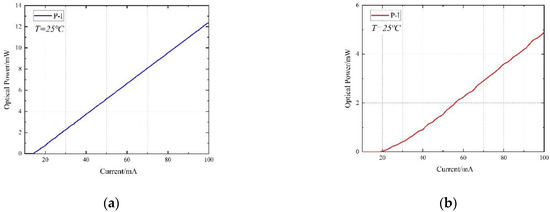
Figure 5.
Variation of the DFB laser output power with driving current: (a) The P-I (power-current) curves of the laser for CH4 detection.; (b) The P-I curves of the laser for HCl detection.
In order to improve the performance of the detection system, the modulation depth needs to be optimized to ensure a high SNR. The optimum modulation amplitude is 2.2 times of half width at half maximum (HWHM) [27]. According to the data from HITRAN, current tuning coefficient and modulation current/voltage relationship, the optimal modulation voltage can be calculated as 0.57 V for CH4 and 0.52 V for HCl. Therefore, 0.55 V is selected as the modulation voltage amplitude of DFB laser. The influence of modulation amplitude is demonstrated in Figure 6.
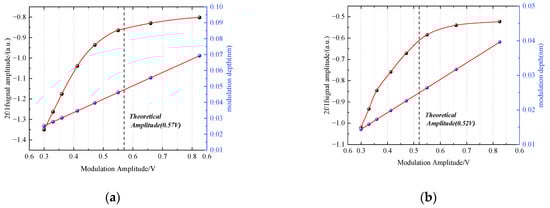
Figure 6.
Relationship between modulation amplitude, modulation depth and 2f/1f (a) Influence on CH4 detection.; (b) Influence on HCl detection.
In the experiment, a gas dilution calibrator (Sabio, model 2010, Round Rock, TX, USA) was used to obtain the measured gases with different concentrations. The methane and hydrogen chloride gases of 0 ppm, 1 ppm, 1.5 ppm, 2 ppm, 2.5 ppm, 3 ppm, 3.5 ppm, 4 ppm, 4.5 ppm were detected respectively, and gases at each concentration was measured continuously for five minutes. Combining the measured harmonic signals at different concentrations, we obtained the results shown in Figure 7. The amplitudes of the second harmonic signals increase with the increase of gas concentration. The intensities of the first harmonic signals at central frequency are caused by other absorption spectral lines in the wavelength scanning range during the modulation process. The influence of laser power jitter, optical window contamination and scattering effect can be eliminated through calibration-free normalization detection algorithm. Figure 8 represents the linear fitting between normalized second harmonic signals and concentration. The coefficient of determination is 0.9982 for CH4 and 0.9996 for HCl, which indicate excellent linear response of the detecting system.
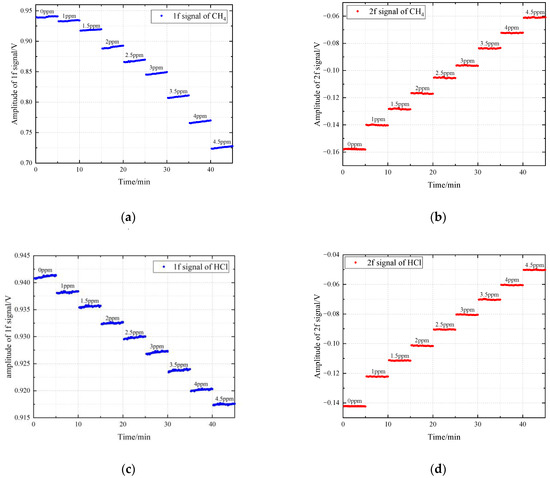
Figure 7.
Measured first and second harmonic signals of CH4 and HCl at different concentrations: (a) first harmonic signal of CH4.; (b) second harmonic signal of CH4.; (c) first harmonic signal of HCl.; (d) second harmonic signal of HCl.
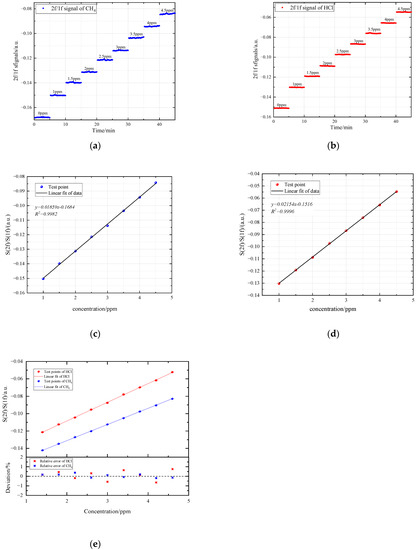
Figure 8.
Normalized second harmonic (2f/1f) signal: (a) normalized second harmonic signal of CH4.; (b) normalized second harmonic signal of HCl.; (c) fitting curve of CH4.; (d) fitting curve of HCl.; (e) Deviation analysis of random test points and fitting curves.
A series of test points have been used to test the accuracy of the fitting curves. Figure 8e shows the eight random test points and the error values calculated from the fitting curves Figure 8. The maximum absolute error is 0.48 ppb for CH4 and 0.5 ppb for HCl. Meanwhile, the maximum relative error is 0.37% and 0.65% for CH4 and HCl respectively. The deviation analysis shows slight fluctuation of test values, and illustrate great stability and high accuracy of the system.
An Allan-Werle deviation analysis was performed in the gas mixture of 5 ppm CH4 and 5 ppm HCl to evaluate the stability and MDL of FDM-WMS detection system [28], the results are shown in Figure 9a,b. The MDL of the system is calculated to be 30.16 ppb for CH4 and 31.6 ppb for HCl for the integration time of 15 s. By increasing the integration time, the corresponding MDL can be further improved to 11 ppb for CH4 and 13.1 ppb for HCl. Furthermore, a long-term detection of CH4 and HCl standard gas mixture was carried out to test the measurement precision of the FDM-WMS system, as shown in Figure 8c. It shows that the maximum relative error is 2.61% for CH4 and 3.19% for HCl.
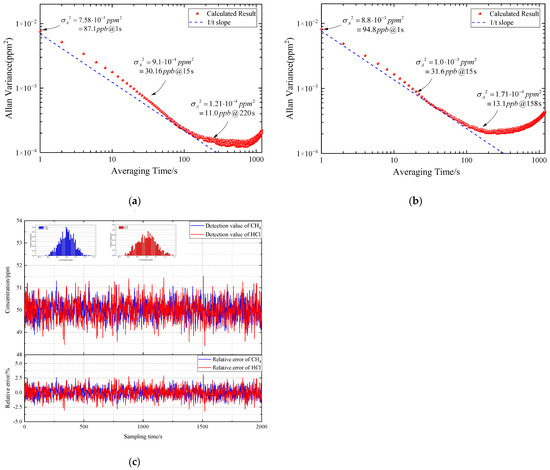
Figure 9.
Performance evaluation of the FDM-WMS detection system: (a) Allan variance analysis of CH4.; (b) Allan variance analysis of HCl.; (c) measurement precision analysis of the FDM-WMS system.
A control experiment was performed in the gas mixture of CH4 and HCl with different concentration to explore the influence of measured WMS-2f/1f signals with and without the FDM technique. During the experiment, first keep both DFB lasers working, and then turn off one laser respectively. The results are shown in Figure 10. The results indicate that the influence on the 2f/1f signal from the FDM method is slight.
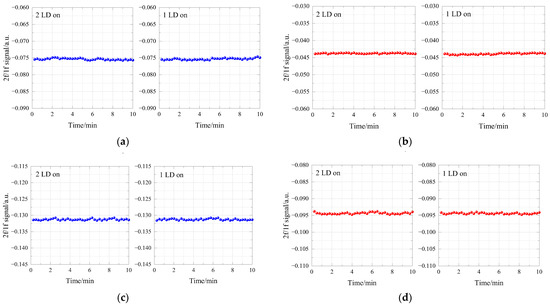
Figure 10.
Detection results with and without FDM technique: (a) 2f/1f signal for CH4 detection (5 ppm CH4/5 ppm HCl gas mixture).; (b) 2f/1f signal for HCl detection (5 ppm CH4/5 ppm HCl gas mixture).; (c) 2f/1f signal for CH4 detection (2 ppm CH4/4 ppm HCl gas mixture).; (d) 2f/1f signal for CH4 detection (2 ppm CH4/4 ppm HCl gas mixture).
4. Discussion
From the results for each measured species, clear linearity between concentration and normalized second harmonic signal can be seen from the fitting curve. The overall coefficient of determination is bigger than 0.9982, which indicate great linear fitting results with small variance. Furthermore, the MDL analysis results show that the FDM-WMS system has a strong ability to detect low-concentration gas. The high coefficient of determination and low maximum relative error illustrate that the FDM-WMS system is reliable in multi-gas concentration detection.
Compared with the sensors with wide spectrum source, the tuning range has been greatly shortened, and the optical structure of the system has been simplified [2]. The achieved MDL of FDM-WMS is even better than those PAS sensors using mid infrared light source [11,29,30]. Compared with the TDM-TDLAS sensors, our work also represents better performance, such as the tuning characteristics and MDL [31,32]. To our knowledge, the performance of our designed system is superior to other TDLS sensors so far. Nonetheless, there are also some obvious defect of the designed system, such as large size of Herriot gas chamber and interference of background signal, which limit its application in some scenarios. To sum up, with benefits of the FDM WMS scheme, such as high frame rate and great accuracy, the demonstrated sensor shows potentials in the in-situ sensing for accurate multi-gas detection.
5. Conclusions
In this paper, we report the design and performance of a single multi-gas detection system based on WMS, which combines frequency division multiplexing with 2f/1f WMS technology. The main difference between FDM-WMS and traditional WMS methods is that the electrical module applies modulation signals of different frequencies to each DFB laser simultaneously, and demodulates at different frequencies concurrently. It provides an optimized scheme for real-time measurement of various gases. In order to improve the signal-to-noise ratio, a long optical path gas chamber with an optical length of 12.5 m is designed, and the calibration free normalization detection method is adopted. The mixed gas of hydrogen chloride and methane was selected as experimental gas to verify the system performance. The detection system has great linear response and accuracy, the MDL of the system is 30.16 ppb for CH4 and 31.6 ppb for HCl with a 15 s integration time. The obtained performance indicate that the system has short response time while ensuring high detection accuracy, and is suitable for industrial production, medical diagnosis and other application fields.
Author Contributions
Conceptualization, L.X. and P.G.; methodology, J.Y.; validation, J.Y. and W.Y.; formal analysis, J.Y. and W.Y; investigation, J.Y.; resources, L.X and P.G.; data curation, J.Y.; writing—original draft preparation, J.Y.; writing—review and editing, J.Y.; project administration, L.X.; All authors have read and agreed to the published version of the manuscript.
Funding
This research was funded by the National Natural Science Foundation of China, grant number U1930205.
Institutional Review Board Statement
Not applicable.
Informed Consent Statement
Not applicable.
Data Availability Statement
Not applicable.
Conflicts of Interest
The authors declare no conflict of interest.
References
- Wang, Z.; Liu, X.; Mu, Y.; Yang, X.; Yang, L.; Jiang, Z. The exhaust emission online detection on the diesel engine. Optik 2018, 164, 126–131. [Google Scholar] [CrossRef]
- Zheng, F.; Qiu, X.; Shao, L.; Feng, S.; Cheng, T.; He, X.; He, Q.; Li, C.; Kan, R.; Fittschen, C. Measurement of nitric oxide from cigarette burning using TDLAS based on quantum cascade laser. Opt. Laser Technol. 2020, 124, 105963. [Google Scholar] [CrossRef]
- Xiong, L.; Compton, R.G. Amperometric Gas detection: A Review. Int. J. Electrochem. Sci. 2014, 9, 7152–7181. [Google Scholar]
- Tipparaju, V.V.; Mora, S.J.; Yu, J.; Tsow, F.; Xian, X. Wearable Transcutaneous CO2 Monitor Based on Miniaturized Nondispersive Infrared Sensor. IEEE Sens. J. 2021, 21, 17327–17334. [Google Scholar] [CrossRef] [PubMed]
- Gibson, D.; Macgregor, C. A Novel Solid State Non-Dispersive Infrared CO2 Gas Sensor Compatible with Wireless and Portable Deployment. Sensors 2013, 13, 7079–7103. [Google Scholar] [CrossRef]
- Sauer, C.; Lorén, A.; Schaefer, A.; Carlsson, P.A. On-Line Composition Analysis of Complex Hydrocarbon Streams by Time-Resolved Fourier Transform Infrared Spectroscopy and Ion–Molecule Reaction Mass Spectrometry. Anal. Chem. 2021, 93, 13187–13195. [Google Scholar] [CrossRef] [PubMed]
- Zheng, W.; Li, C.; Qin, J.; Li, J. On-line Monitoring of GIS Using Fourier Transform Infrared Spectroscopy. J. Phys. Conf. Ser. 2020, 1576, 012051. [Google Scholar] [CrossRef]
- Ma, Y. Review of Recent Advances in QEPAS-Based Trace Gas Sensing. Appl. Sci. 2018, 8, 1822. [Google Scholar] [CrossRef]
- Hayden, J.; Giglio, M.; Sampaolo, A.; Spagnolo, V.; Lendl, B. Mid-infrared intracavity quartz-enhanced photoacoustic spectroscopy with pptv—Level sensitivity using a T-shaped custom tuning fork. Photoacoustics 2022, 25, 100330. [Google Scholar] [CrossRef]
- Liang, W.; Wei, G.; He, A.; Shen, H. A novel wavelength modulation spectroscopy in TDLAS. Infrared Phys. Technol. 2021, 114, l103661. [Google Scholar] [CrossRef]
- Weng, W.; Aldén, M.; Li, Z. Simultaneous Quantitative Detection of HCN and C2H2 in Combustion Environment Using TDLAS. Processes 2021, 9, 2033. [Google Scholar] [CrossRef]
- Hinkley, E.D. high resolution infrared spectroscopy with a tunable diode laser. Appl. Phys. Lett. 1970, 16, 9. [Google Scholar] [CrossRef]
- Reid, J.; Shewchun, J.; Garside, K.; Ballik, E.A. High sensitivity pollution detection employing tunable diode lasers. Appl. Opt. 1978, 17, 300–307. [Google Scholar] [CrossRef] [PubMed]
- Sepman, A.; Ögren, Y.; Qu, Z.; Wiinikka, H.; Schmidt, M. Tunable Diode Laser Absorption Spectroscopy Diagnostics of Potassium, Carbon Monoxide, and Soot in Oxygen-Enriched Biomass Combustion Close to Stoichiometry. Energy Fuels 2019, 33, 11795–11803. [Google Scholar] [CrossRef]
- Thorin, E.; Schmidt, F.M. TDLAS-based photofragmentation spectroscopy for detection of K and KOH in flames under optically thick conditions. Opt. Lett. 2020, 45, 5230–5233. [Google Scholar] [CrossRef]
- Wu, X.; Wang, J.; Cai, C.; Wu, Y.; Zheng, C.; Zhang, Y.; Gao, X. Measurement techniques for sulfur trioxide concentration in coal-fired flue gas: A review. Environ. Sci. Pollut. Res. 2021, 28, 22278–22295. [Google Scholar] [CrossRef] [PubMed]
- Tao, B.; Lei, Q.; Ye, J.; Zhang, Z.; Hu, Z.; Fan, W. Measurements and analysis of diode laser modulation wavelength at high accuracy and response rate. Appl. Phys. B 2020, 126, 88. [Google Scholar] [CrossRef]
- Huang, A.; Cao, Z.; Zhao, W.; Zhang, H.; Xu, L. Frequency-Division Multiplexing and Main Peak Scanning WMS Method for TDLAS Tomography in Flame Monitoring. IEEE Trans. Instrum. Meas. 2020, 69, 9087–9096. [Google Scholar] [CrossRef]
- Fried, A.; Drummond, J.R.; Henry, B.; Fox, J. Versatile integrated tunable diode laser system for high precision: Application for ambient measurements of OCS. Appl. Opt. 1991, 30, 1916–1932. [Google Scholar] [CrossRef]
- Wei, Y.; Li, Y.; Shang, Y.; Zhang, T.; Song, Z.; Wang, C.; Liu, T. Fiber optic TDLAS-based multi-gas remote detection system for mine goaf fire. In Proceedings of the 5th International Symposium on Advanced Optical Manufacturing and Testing Technologies, Dalian, China, 12 October 2010. [Google Scholar]
- Chen, K.; Liu, S.; Zhang, B.; Gong, Z.; Chen, Y.; Zhang, M.; Deng, H.; Guo, M.; Ma, F.; Zhu, F.; et al. Highly sensitive photoacoustic multi-gas analyzer combined with mid-infrared broadband source and near-infrared laser. Opt. Lasers Eng. 2020, 124, 105844. [Google Scholar] [CrossRef]
- Cao, Y.; Liu, K.; Wang, R.; Chen, W.; Gao, X. Three-wavelength measurement of aerosol absorption using a multi-resonator coupled photoacoustic spectrometer. Opt. Express 2021, 29, 2258–2269. [Google Scholar] [CrossRef] [PubMed]
- Wang, Q.; Wang, Z.; Kamimoto, T.; Deguchi, Y.; Wen, D. Applications of TDLAS based multi-species hydrocarbon measurement using a wide scanning range DFG laser. Results Eng. 2021, 12, 100297. [Google Scholar] [CrossRef]
- Gao, H.; Wang, H.; Zhang, B.; Xie, L.; Gong, P.; Yuan, B.; Qi, B. Stand-off detection of ethanol vapor based on a tunable ICL. Opt. Express 2018, 26, 21433–21442. [Google Scholar] [CrossRef] [PubMed]
- The Hitran Molecular Spectroscopic Database. Available online: https://www.spectralcalc.com (accessed on 5 August 2021).
- Ilze, O.; Janis, S. Beer-Lambert law for optical tissue diagnostics: Current state of the art and the main limitations. J. Biomed. Opt. 2021, 26, 100901. [Google Scholar]
- Reid, J.; Labrie, D. Second-Harmonic Detection with Tunable Diode Lasers Comparison of Experiment and Theory. Appl. Phys. B 1981, 26, 203–210. [Google Scholar] [CrossRef]
- Werle, P.; Mücke, R.; Slemr, F. The limits of signal averaging in atmospheric trace-gas monitoring by tunable diode-laser absorption spectroscopy (TDLAS). Appl. Phys. B-Photo-Phys. Laser Chem. 1993, 2, 131–139. [Google Scholar] [CrossRef]
- Zheng, H.; Lou, M.; Dong, L.; Wu, H.; Ye, W.; Yin, X.; Kim, C.S.; Kim, M.; Bewley, W.W.; Merritt, C.D.; et al. Compact photoacoustic module for methane detection incorporating interband cascade light emitting device. Opt. Express 2017, 14, 16761–16770. [Google Scholar] [CrossRef]
- Wu, H.; Dong, L.; Yin, X.; Sampaolo, A.; Patimisco, P.; Ma, W.; Zhang, L.; Yin, W.; Xiao, L.; Spagnolo, V.; et al. Atmospheric CH4 measurement near a landfill using an ICL-based QEPAS sensor with V-T relaxation self-calibration. Sens. Actuators B Chem. 2019, 297, 126753. [Google Scholar] [CrossRef]
- Klein, A.; Witzel, O.; Ebert, V. Rapid, time-division multiplexed, direct absorption- and wavelength modulation-spectroscopy. Sensors 2014, 11, 21497–21513. [Google Scholar] [CrossRef]
- Cui, R.; Dong, L.; Wu, H.; Ma, W.; Xiao, L.; Jia, S.; Chen, W.; Tittel, F.K. Three-Dimensional Printed Miniature Fiber-Coupled Multipass Cells with Dense Spot Patterns for ppb-Level Methane Detection Using a Near-IR Diode Laser. Anal. Chem. 2020, 19, 13034–13041. [Google Scholar] [CrossRef]
Publisher’s Note: MDPI stays neutral with regard to jurisdictional claims in published maps and institutional affiliations. |
© 2022 by the authors. Licensee MDPI, Basel, Switzerland. This article is an open access article distributed under the terms and conditions of the Creative Commons Attribution (CC BY) license (https://creativecommons.org/licenses/by/4.0/).