Article

Process Optimization Based on Analysis of Dynamic and Static Performance Requirements of Ion Beam Figuring Machine Tools for Sub-Nanometer Figuring

1
College of Intelligence Science and Technology, National University of Defense Technology, Changsha 410073, China
2
Laboratory of Science and Technology on Integrated Logistics Support, National University of Defense Technology, Changsha 410073, China
3
Hunan Key Laboratory of Ultra-Precision Machining Technology, Changsha 410073, China
4
State Key Laboratory of High Performance Complex Manufacturing, Central South University, Changsha 410073, China
*
Author to whom correspondence should be addressed.
Photonics 2022, 9(11), 839; https://doi.org/10.3390/photonics9110839
Submission received: 27 August 2022 / Revised: 24 October 2022 / Accepted: 31 October 2022 / Published: 8 November 2022

Abstract

:
Extreme ultraviolet lithography objective lenses require surface figure accuracy of approximately sub-nanometer root mean square (RMS). As the key equipment for sub-nanometer accuracy figuring, the dynamic and static performance of ion beam figuring (IBF) machine tools are critical. However, the related research is not sufficient and comprehensive. To this end, a general model of dynamic and static performance requirements on three-axis IBF machine tools was established. The requirements on dynamic and static performance under different figuring process for different surface shape were comprehensively analyzed. Analysis results revealed that the three-axis IBF machine tools require typical motion accuracy better than 100 μm and certain dynamic performance for achieving sub-nanometer accuracy. According to the theoretical and simulation results, a process optimization based on analysis of dynamic and static performance requirements of IBF machine tools for sub-nanometer figuring is proposed. To verify the proposed method, a Φ90 mm mirror with 2.594 nm RMS was figured to 0.251 nm RMS by optimizing the processing parameters to ensure that the IBF machine tool with measured performance (positioning error of 52.74 μm, 53.04 μm, 37.71 μm, and maximum acceleration of 1.0 m/s2, 1.3 m/s2, and 1.5 m/s2 for axes x, y, and z, respectively) meets the performance requirements. The proposed method can promote the application of three-axis IBF machine tools in sub-nanometer accuracy figuring.

1. Introduction

Optical surfaces with sub-nanometer accuracy are increasingly used in modern optical systems. For example, extreme ultraviolet (EUV) lithography objective lenses and fourth-generation synchrotron radiation sources require surfaces with accuracy better than 0.3 nm root mean square (RMS) [1]. As a noncontact, high-stability, and highly deterministic technique, ion beam figuring (IBF) uses an ion beam, which is generated by ionization of inert gas, before hitting the surface and realizing material removal based on a sputtering effect [2]. In Carl Zeiss’s process for fabricating lithography objectives and synchrotron radiation mirrors, a combination of computer-controlled polishing, magnetorheological finishing (MRF), and IBF is used to achieve sub-nanometer accuracy [3]. IBF is the final process. Zygo Corporation [4,5] and the Institute of Optoelectronics Technology (IOE) [6,7] adopted a similar process route with Carl Zeiss. IBF is widely used in sub-nanometer accuracy figuring and is a key technique for sub-nanometer accuracy figuring.
To realize high-accuracy figuring, many studies have been conducted on the IBF process. Leibniz-Institut für Oberflächenmodifizierung Institute (IOM) [8,9] and Changchun Institute of Optics and Mechanics (CIOM) [10,11,12,13] proposed an IBF process for curved optical elements. The variation of removal rate caused by different incident angles of the ion beam was troubleshot by compensating for the dwell time. The Brookhaven National Laboratory [14,15,16] and National University of Defense Technology (NUDT) [17] proposed a one-dimensional figuring method. The complexity of the IBF process can be reduced, and the figuring efficiency can be enhanced. NTGL [18] of Germany and REOSC [19] of France have studied the motion axis structure of IBF machine tools. The removal function changes when figuring curved surfaces can be avoided by using a five-axis IBF machine tool. IOM [20,21,22], Canon, Nikon, and Tokyo Institute of Technology [23,24,25] studied the structure of ion source. By changing the grid design of the ion source, a smaller size ion source can be obtained to improve the figuring capability on mid- and high-frequency surface figure error. Deng et al. [26] from CIOM designed a hybrid IBF machine tools considering both the response speed and the system stiffness. These studies realized process optimization by studying the figuring effects (figuring results and figuring phenomena) of process parameters without measuring the performance of the IBF machine tools and explicitly clarifying the performance requirements on the IBF machine tools for a given surface.
The static and dynamic performances of IBF machine tools are not the dominant factors that influence the accuracy when figuring surfaces with accuracy of about tens of nanometers. However, for figuring surfaces with sub-nanometer accuracy, the high dynamic performance and the accurate positioning ability of the IBF machine tools are critical. Shi [27] et al. from our research team (NUDT) studied the influence of the positioning errors of IBF machine tools on the figuring accuracy. It was found that the tangential position error is the main motion error that influences the machining precision for flat surfaces. Moreover, it was concluded that the residual error is proportional to the relative position error. Shi et al. conducted pioneering work. However, the analysis was not comprehensive. The normal and angle positioning errors can be ignored when polishing surfaces with accuracy about tens of nanometers. However, for sub-nanometer precision figuring, especially for curve surfaces, the normal and angle positioning errors cannot be ignored. Xu and Yang et al. [28,29] from our research team (NUDT) studied the requirements on the maximum acceleration of the machine tool scanning axis for figuring flat surfaces with surface figure error consisted of various frequency components. However, the analysis of the dynamic performance of IBF machine tools on figuring accuracy was only focused on a single axis. Therefore, the universality of the dynamic performance model is limited, and it cannot be applied to multi-axis IBF machine tools. Moreover, the physical meaning of the current dynamic performance model is not clear for researchers who design or use IBF machines tools.
Clear dynamic and static performance requirements on IBF machine tools can offer a good guide for engineers who design IBF machine tools that can achieve sub-nanometer accuracy. Furthermore, if the static and dynamic performance requirements on IBF machine tools under different process parameters are clear and the static and dynamic performance of the IBF machine tools can be measured, process parameters can be optimized by reducing the performance requirements to meet the practical performance of the IBF machine tools. This will be a new way to conduct the process optimization compared with the traditional process optimization method that requires studying the figuring effects of every process parameter. However, this has not been reported to the best of our knowledge. This restricts the application of the IBF method to figuring surfaces with sub-nanometer accuracy.
In this study, a comprehensive and systematic study was performed to obtain clear requirements of the dynamic and static performance of the three-axis IBF machine tools for achieving sub-nanometer accuracy. According to IBF figuring theory, a general theoretical model of the dynamic performance of the three-axis IBF machine tools with clear physical significance was established. The requirements for dynamic and static performance of the three-axis IBF machine tools under the condition of different surface shape characteristics and different process parameters were analyzed using a comprehensive simulation. On the basis of the theoretical and simulation results, it is reported that the three-axis IBF machine tools require motion accuracy higher than 100 μm and a certain dynamic performance to achieve figuring accuracy better than 0.3 nm RMS. Then, a process parameter optimization method according to the analysis results to reduce the dynamic and static performance requirements of a given IBF machine tool was proposed. According to the analysis result, an IBF machine tool was developed, and its dynamic performance and motion accuracy were tested. A Φ90 mm glass–ceramic mirror with an initial surface figure error of 2.594 nm RMS was figured to 0.251 nm RMS using this IBF machine tool and the proposed process optimization method. The results of this study can serve as a guide for machine tools designers to design three-axis IBF machine tools that meet sub-nanometer precision figuring. Furthermore, it can also help researchers or craftsmen who design processes using certain IBF machine tools to manufacture sub-nanometer precision surfaces applied in synchrotron radiation or EUV objective lenses.
The remainder of this paper is organized as follows: Section 2.1 and Section 2.2 analyze the requirements of dynamic and static performance on the three-axis IBF machine tools for sub-nanometer accuracy figuring based on theoretical analysis and simulations, respectively. Section 3 describes the experimental validation, and the discussion is presented in Section 4. Lastly, the paper is concluded in Section 5.

2. Materials and Methods

Three-axis IBF machine tools are commonly used for figuring flat and curved surfaces. Dynamic performance and motion error influence the figuring accuracy of the three-axis IBF machine tools. Dynamic performance means the acceleration performance of the machine tool, which is usually measured by the maximum acceleration. Due to the acceleration process, the practical dwell time and the theoretical dwell time are different, which will affect the figuring accuracy. Motion error indicates the deviation between the practical and theoretical dwell positions of the removal function. It affects the accurate removal of the error point. The requirements of dynamic performance and motion error on figuring flat surfaces and curved surfaces are different. Therefore, analysis for both the flat and the curved surfaces is conducted as described below.

2.1. Dynamic Performance Requirements Analysis

The kinematic scheme of the three-axis IBF machine tools is shown in Figure 1. For IBF figuring, a grating scanning path is typically adopted to deterministically remove the material of high error points (Figure 2). The x-, y-, and z-axes are typically termed as the feeding axis, scanning axis, and the target distance control axis, respectively. Commonly, the feeding axis does not influence the figuring accuracy. For figuring flat surfaces, only the dynamic performance of the scanning axis affects the figuring accuracy. For figuring curved surfaces, both the scanning axis and the target distance control axis affect the figuring. Therefore, the scanning axis (for figuring both flat and curved surfaces) and the target distance axis (only for figuring curved surfaces) are analyzed below.

2.1.1. The Scanning Axis

IBF adopts a stable removal function, and the removal amount of material per unit time is stable. By precisely controlling the dwell time at each error point (dwell point), deterministic figuring can be achieved. To avoid the frequent start and stop of the IBF machine tools, the speed dwell mode is usually used to control the dwell time. As shown in Figure 3, speed control points are set on both sides of the dwell point. The speed dwell mode allows controlling the dwell time by controlling the speed variation between the two speed control points.
The two speed control points on both sides of a dwell point P k are denoted as P n and P n + 1 , and their velocities are denoted as v n and v n + 1 , respectively. The acceleration of the scanning axis is a, the time of uniform acceleration and the uniform motion between the two velocity control points are t k 1 and t k 2 , respectively, and their strokes are s k 1 and s k 2 , respectively, as displayed in Figure 2. The distance between adjacent speed control points is s = s k 1 + s k 2 . The theoretical dwell time t can be expressed as
t = s v n + 1 .
After approximating the motion process of variable acceleration by uniform acceleration, the actual dwell time tk can be expressed as
t k = t k 1 + t k 2 = v n + 1 v n a + s k 2 v n + 1 ,
where
s k 2 = s k s k 1 = s k v n + 1 2 v n 2 2 a .
Substitution of Equation (3) into Equation (2) yields
t k = t k 1 + t k 2 = v n + 1 v n a + s k 2 v n + 1 = v n + 1 v n a + s v n + 1 2 v n 2 / 2 a v n + 1 .
Therefore, the dwell time error Δt related to the dynamic performance of the scanning axis can be expressed as
Δ t = t k t = v n + 1 v n a + s v n + 1 2 v n 2 / 2 a v n + 1 s v n + 1 = v n + 1 v n a v n + 1 2 v n 2 / 2 a v n + 1 = v n + 1 v n 2 2 a v n + 1 .
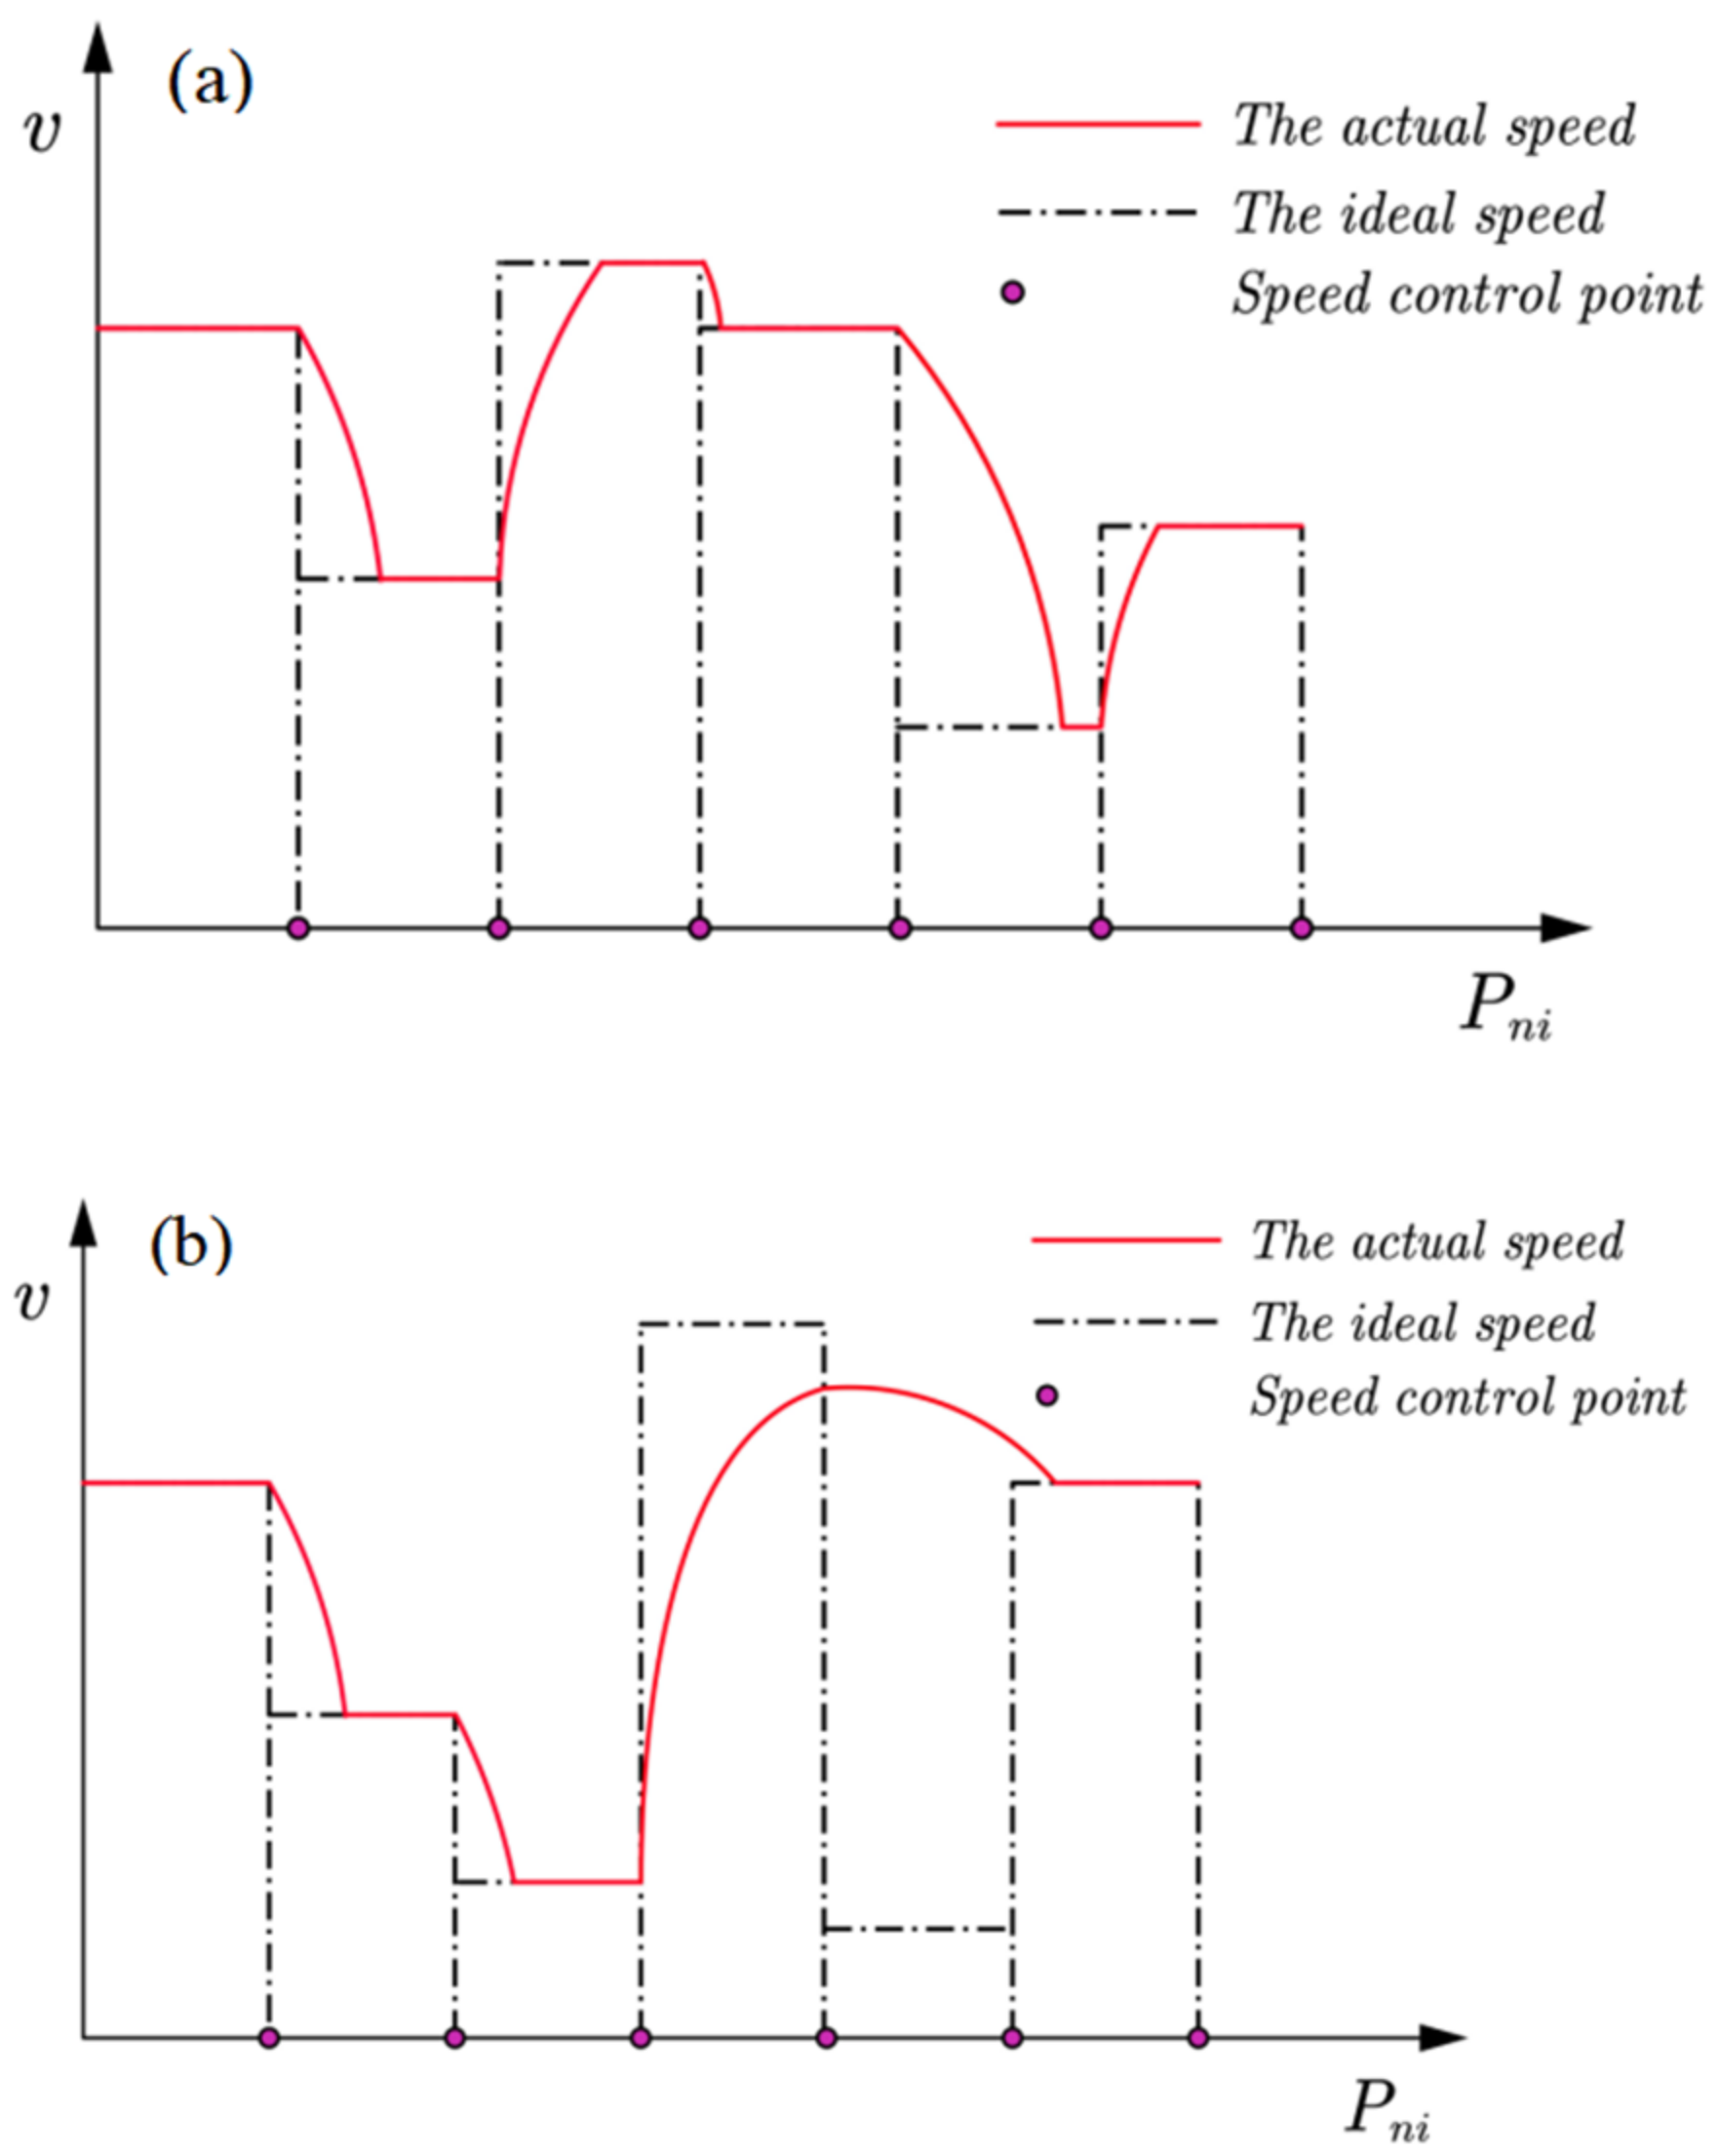
Equations (1), (4) and (5) reveal that there exists a certain dwell time error Δt between the actual dwell time tk and the theoretical dwell time t. As shown in Figure 4, when a deceleration section occurs in the movement process, the actual dwell time is less than the theoretical residence time. During an acceleration period, the actual residence time is longer than the theoretical residence time. Equation (5) shows that, for a machine tool with a constant dynamic performance a, the larger the difference between vn and vn+1 is, the larger dwell time error Δt is. Figure 5a,b show two different results when the difference between vn and vn+1 is small and large, respectively. It can be seen from Figure 5b that, when the speed between adjacent speed control points fluctuates largely, some speed control points may fail to reach the expected speed because of the limitation of the dynamic performance of the machine tool. This would result in a large dwell time error.
For a surface figure error of single frequency H ( y ) = A sin ( 2 π f y ) , the scanning speed of the IBF at each dwell point can be expressed as follows [22]:
v ( y ) = A B e 2 ( π σ f ) 2 sin ( 2 π f y ) + 1 + E a B 1 .
The acceleration (absolute value) distribution of each dwell point can be expressed as follows [22]:
a ( y ) = 2 π f A B 2 e 2 ( π σ f ) 2 cos ( 2 π f y ) A e 2 ( π σ f ) 2 sin ( 2 π f y ) + 1 + E a 3 ,
where 6σ is the beam diameter, f is the surface shape error frequency, B is the volume removal rate, A is the surface shape error amplitude, and Ea is the extra removal layer.
However, Equation (7) can only represent the acceleration distribution along with the sinusoidal surface figure error. The required max acceleration amax along the sinusoidal surface figure error has not been deduced. The authors of [30] obtained the required max acceleration amax using simulations, which is tedious and cannot explicitly express the relation between the required max acceleration amax with the characteristics of surface figure and process parameters. To solve this issue, the below calculations are conducted.
Dividing the two sides of Equation (7) by B3 yields
a ( y ) = 2 π f A B e 2 ( π σ f ) 2 cos ( 2 π f y ) A B e 2 ( π σ f ) 2 sin ( 2 π f y ) + 1 + E a B 3 .
For specific values of A, B, σ, and f, A B e 2 ( π σ f ) 2 is a constant. A B e 2 ( π σ f ) 2 can be denoted by C, i.e.,
C = A B e 2 ( π σ f ) 2 .
Considering a moderate thickness value of the extra removed layer,
E a = A 10 .
Substitution of Equations (9) and (10) into Equation (8) yields
a ( y ) = 2 π f C cos ( 2 π f y ) C sin ( 2 π f y ) + 1 + D 3 .
Taking the derivative of Equation (11) yields
a ( y ) = 2 π f 2 C sin ( 2 π f y ) C sin ( 2 π f y ) + 1 + D 3 3 × 2 π f 2 C 2 cos 2 ( 2 π f y ) C sin ( 2 π f y ) + 1 + D 4 ,
where D = 1 10 e 2 ( π σ f ) 2 .
By solving a ( y ) = 0 , the extreme point of a ( y ) can be obtained. After substituting the extreme point into Equation (11), the required max acceleration amax along the sinusoidal surface figure error can be obtained as
a y max = K 2 π f 1 C 2 = K 2 π f B A e 2 ( π f σ ) 2 2 ,
where K is related with D = 1 10 e 2 ( π σ f ) 2 . However, using D to represent K is too complex. To express K more explicitly, the expression of K is obtained using the numerical simulation method.
The surface figure data along the sinusoidal surface figure error is substituted into Equation (11) to find the corresponding value of a(y)max. Then, the value of K can be obtained using Equation (13). To obtain the relation of K with σf, the values of K are calculated when 0 < σf < σfc. The figuring cutoff frequency, fc, is related with the beam diameter 6σ when the material removal efficiency is equal to 0.1 [30], i.e.,
f c = 3 2 ln 10 6 σ π .
According to Equation (14), it can be calculated that σfc is about 0.35. The K values with σf are presented in Figure 6. After fitting the discrete points, the curve function can be obtained as
K = 145 1.075 / σ f e 25.54 σ f 0.07713 / σ f e 35.17 σ f 0 < σ f 0.1 0.1 < σ f 0.25 0.25 < σ f < 0.35 .
Substitution of Equation (15) and B = 2 π σ V M (VM is the peak removal rate) into Equation (13) yields
a y max 1.611 × 10 5 × V M 2 π 2 σ 2 f A 2 e 4 ( π f σ ) 4                   0 < σ f 0.1 1.194 × 10 6 × V M 2 π 2 σ A 2 e 4 ( π f σ ) 4 25.54 σ f     0.1 < σ f 0.25 8.570 × 10 8 × V M 2 π 2 σ A 2 e 4 ( π f σ ) 4 35.17 σ f 0.25 < σ f < 0.35 .
Equation (16) explicitly presents the relation between the maximum acceleration a(y)max with the surface figure and process characteristics. As for the surface figure characteristics, the higher the surface figure error frequency f or the smaller the surface figure error amplitude A is, the higher the requirement on the dynamic performance of the scanning axis is. In terms of the process characteristics, the higher the peak removal rate VM or the larger the beam diameter 6σ is, the higher the requirement on the dynamic performance of the scanning axis is.
To further verify the deduced Equation (16), simulations were conducted to visualize Equation (16). By comparing the visualization with that of the published reference, the theoretical analysis of Equation (16) could be verified. The parameters for the simulation to visualize Equation (16) were set based on the practical surface figure and process characteristics. According to previous experience for sub-nanometer precision figuring, an IBF with a beam diameter of d = 6σ = 10 mm can be used in the final figuring. Substitution of 6σ = 10 mm into Equation (14) yields fc = 0.2 mm−1. Therefore, the max value of df is 2. One typical surface figure that can be figured to sub-nanometer precision is presented in Figure 7a. Figure 7b is the filtered surface figure component with fc = 0.2 mm−1. Therefore, the surface figure error amplitude A = 7 nm (half of the PV value of Figure 5b) can be used in the simulation. The range of the peak removal efficiency VM was 50–200 nm/min, which is the common process parameter value.
Figure 8a shows the maximum acceleration amax with the peak removal efficiency VM for different df values within the cutoff frequency. Figure 8b shows the maximum acceleration amax with the surface figure error amplitude A at the cutoff frequency df = 2. The curve trend and values in these visualizations are similar to those shown in [30], which verifies the theoretical analysis of Equation (16).
The theoretical model of the dynamic performance with the surface figure and process characteristics shown in Equation (16) can help machine tools designers to design the scanning axis of IBF machine tools that meets sub-nanometer precision figuring. Through substitution of the moderate parameters for sub-nanometer precision figuring into Equation (16), the requirement of maximum acceleration amax can be obtained as 0.1g (g = 9.8 m/s2). This can be a reference when designing IBF machine tools. On the other hand, Equation (16) can help researchers or craftsmen who design processes using certain IBF machine tools to make sub-nanometer precision surfaces applied in synchrotron radiation or EUV. For example, optimization of the initial surface figure and process parameters can be conducted to realize sub-nanometer precision figuring when the dynamic performance amax is smaller than 0.1g.

2.1.2. The Target Distance Control Axis

The motion along the target distance control axis is not required for figuring flat surfaces. However, this is not the case for figuring curved surfaces. During the scanning motion driven by y-axis, the dwell time is realized by controlling the speed of y-axis. The target distance driven by the z-axis should be simultaneously controlled. That is to say, the z-axis should move to a specific position when y-axis moves to a certain position for guaranteeing that the practical removal amount is the same as that of the theoretical calculation. However, due to the dynamic performance of the target distance control axis, target distance error exists, which would result in figuring error.
Consider a parabolic equation expressed as
z = 1 2 R x 2 + y 2 ,
where R is the curvature at the vertex, and r x r , r y r ; r is the semi aperture of the parabolic surface.
Considering a scanning path through the vertex of the parabolic surface,
z = y 2 2 R .
The z-axis should move Δz if the y-axis translates dL mm, and Δz can be expressed as
Δ z = z 1 z = ( y + d L ) 2 2 R + ( y ) 2 2 R = 2 d L y + d L 2 2 R .
For a surface figure with one single frequency error H ( y ) = A sin ( 2 π f y ) , the dwell time can be expressed as follows [30]:
T = A B e 2 ( π σ f ) 2 sin ( 2 π f y ) + 1 + E a B .
The velocity along the z-axis can be expressed as
v z = Δ z T = 2 d L y + d L 2 2 R A B e 2 ( π σ f ) 2 sin ( 2 π f y ) + 1 + E a B = B 2 R A e 2 ( π σ f ) 2 2 d L y + d L 2 sin ( 2 π f y ) + D 0 ,
where D 0 = 1 10 e 2 ( π σ f ) 2 + 1 .
Therefore
d v z d y = B 2 R A e 2 ( π σ f ) 2 2 sin ( 2 π f y ) + D 0 + 2 d L y + d L 2 2 π f cos ( 2 π f y ) sin ( 2 π f y ) + D 0 2 .
The acceleration a(z) of the target distance control axis can be expressed as
a z = d v z d t = d v z d y d y d t = v z d v z d y                 = B 2 R A e 2 ( π σ f ) 2 2 2 d L y + d L 2 2 sin ( 2 π f y ) + D 0 2 + 2 d L y + d L 2 2 π f cos ( 2 π f y ) sin ( 2 π f y ) + D 0 3
where is the beam diameter, f is the surface shape error frequency, B = 2 π σ V M (VM is the peak removal rate), A is amplitude of the surface shape error, and r is the semi aperture of the surface.
By simplification and approximation, the required max acceleration a(z)max along the surface can be obtained as
a z max π σ 2 V M 2 e 2 ( π σ f ) 2 3600 R 2 A 2 2 d L r + d L 2 100 + 10 e 2 ( π σ f ) 2 + 2 d L r + d L 2 π f .
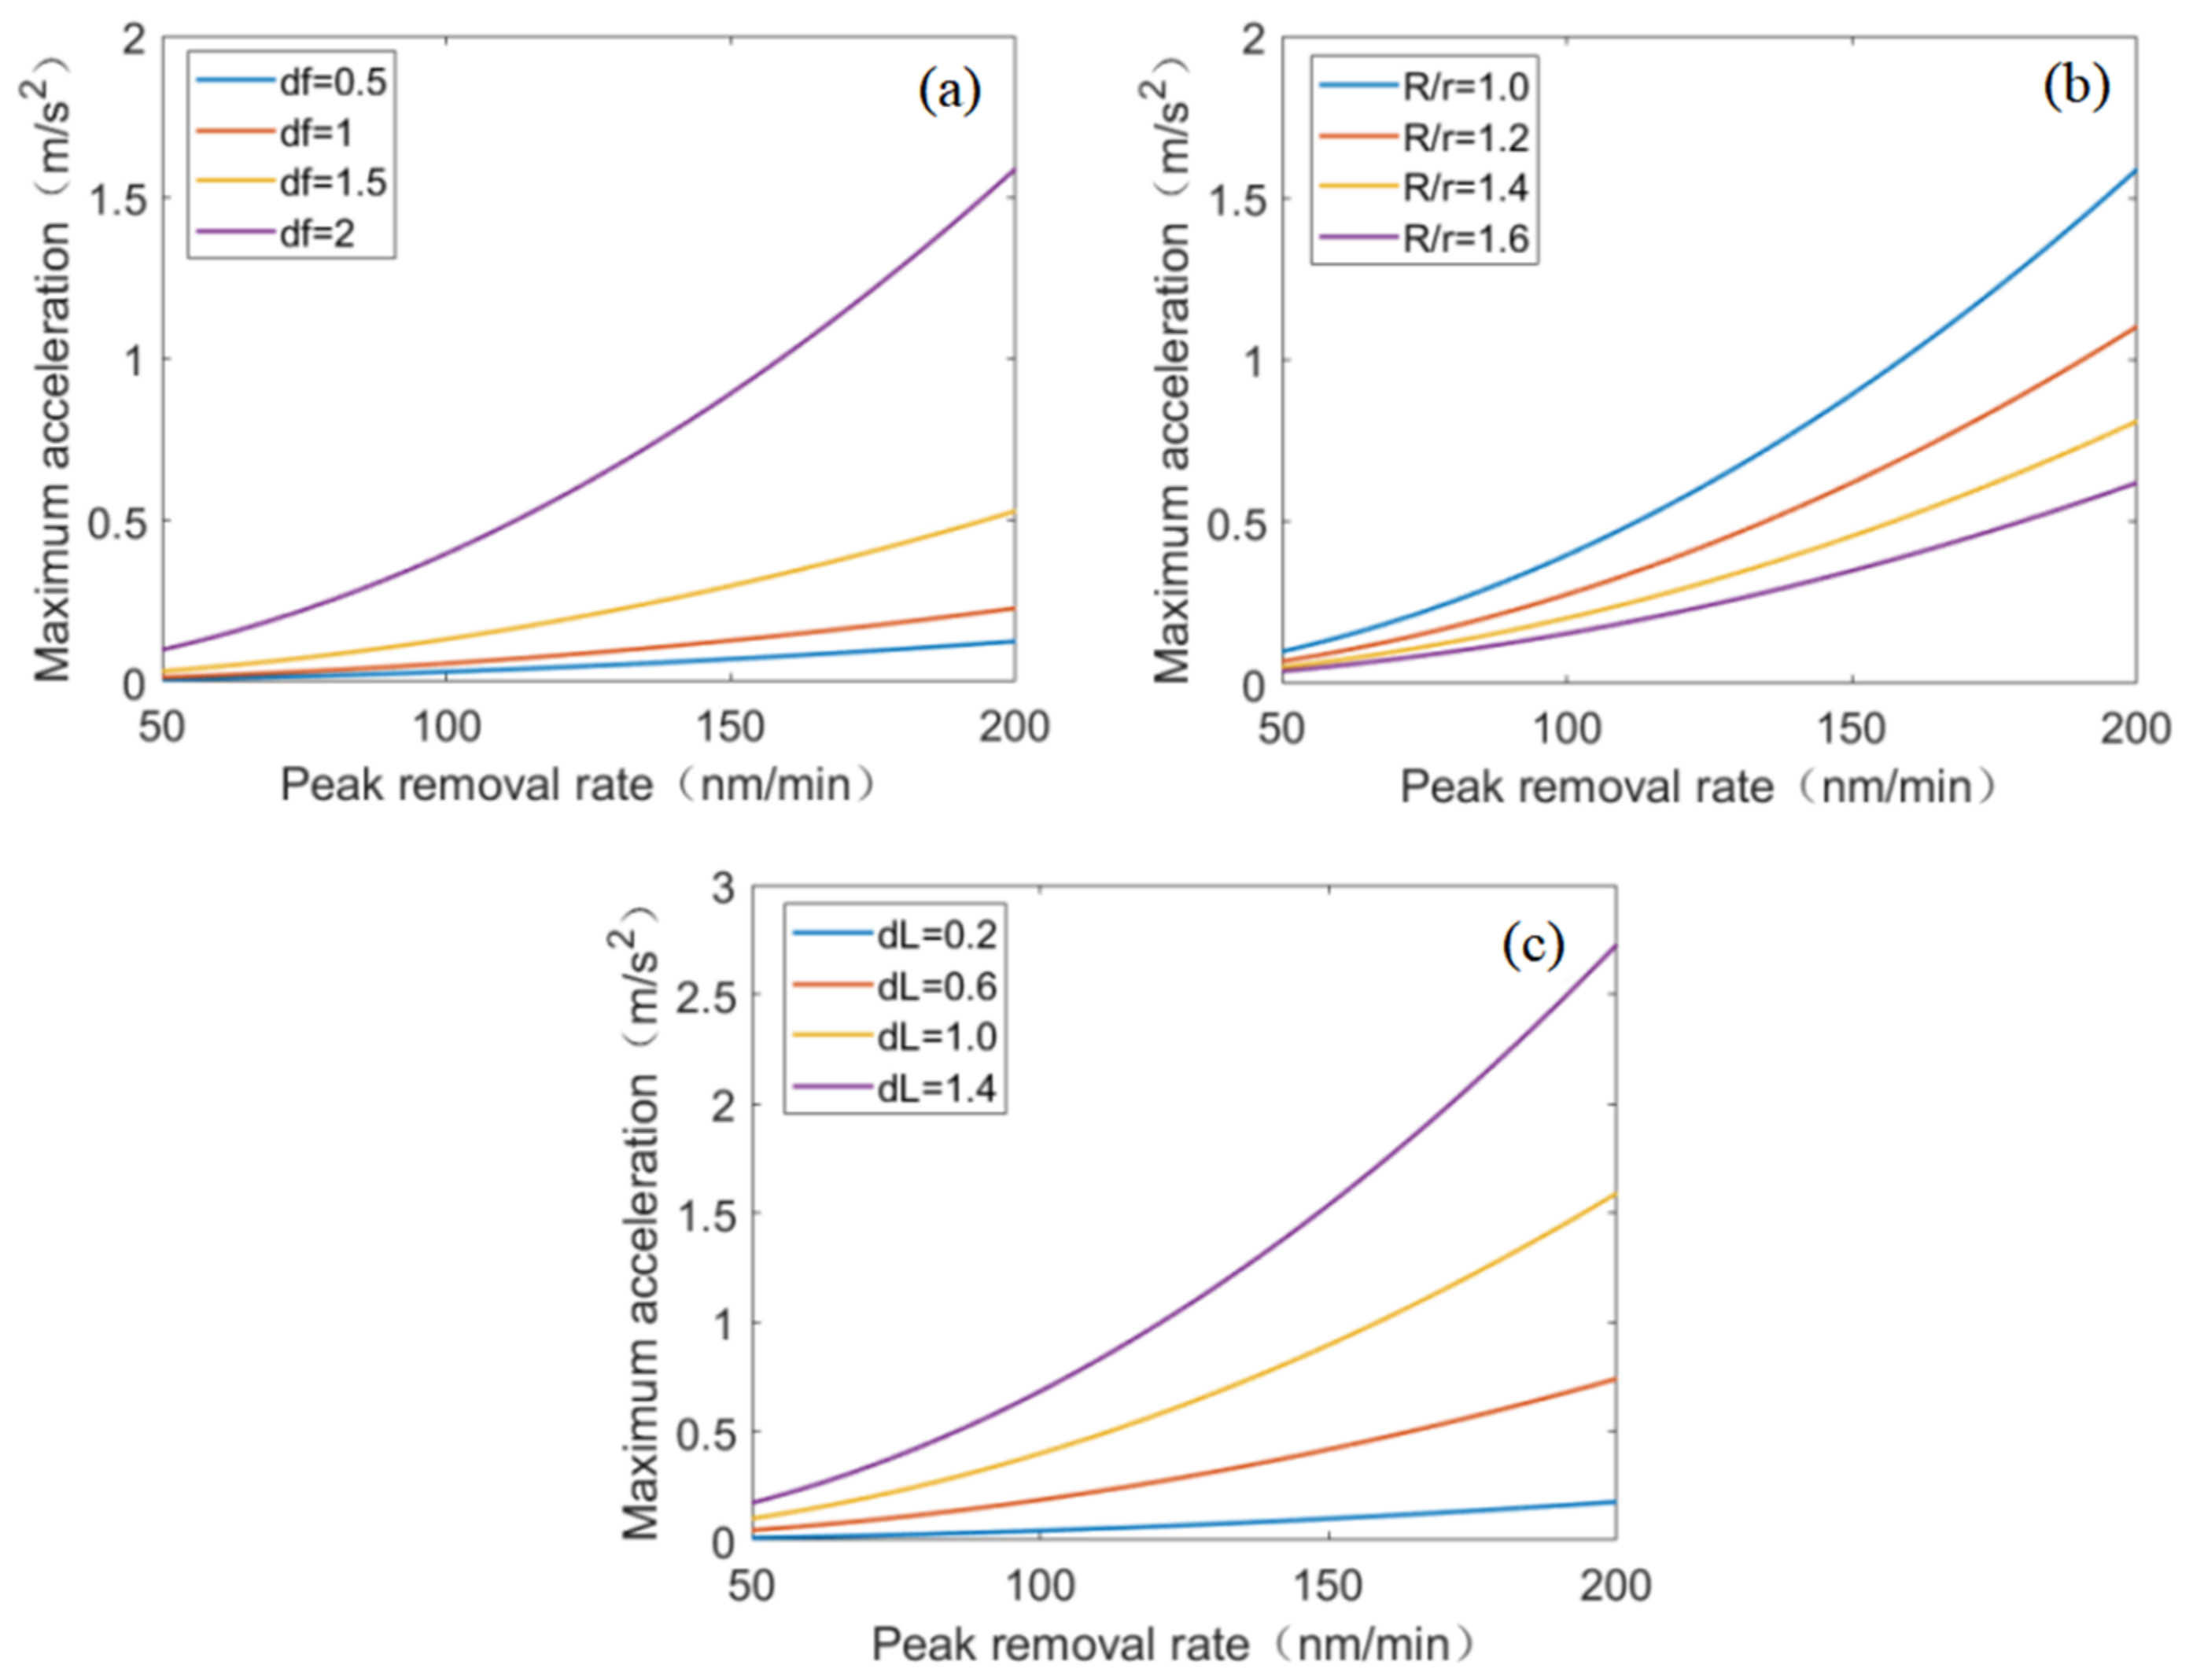
To visualize the relation of a(z)max with the surface characteristics and process parameters, figures are plotted. Figure 9a–c show that the acceleration requirement of the target distance control axis is positively correlated with the beam diameter 6σ, the peak removal rate VM, surface error frequency f, surface steepness, and scanning spacing dL. Usually, scan spacing is the easiest process parameter to control, and it has a great influence. Thus, the acceleration requirement of target distance control axis can be reduced by reducing the scanning spacing in actual figuring.

2.2. Static Performance Requirements Analysis

Tangential positioning error means the translational positioning error along both the feeding axis (x-axis) and the scanning axis (y-axis). This influences the surface figuring accuracy of both the flat and the curved surfaces. In terms of the angle accuracy, i.e., rotation around x- and y- axes, it does not cause much figuring error for flat surfaces. However, the brief analysis below shows that the angle error cannot be ignored when figuring curved surfaces, especially for achieving sub-nanometer accuracy.
The theoretical model of using IBF to figure curved surfaces can be expressed as follows
R ( X , Y , Z ) = V m exp X X 0 2 + Y Y 0 2 2 σ 2 ,
where
V m = J 0 Λ ε cos θ exp ρ 2 cos 2 θ 2 ( α 2 cos 2 θ + β 2 sin 2 θ ) 2 π σ 2 2 π ( α 2 cos 2 θ + β 2 sin 2 θ ) ,
where J0 is the beam current, Λ is a constant of proportionality related to the erosion rate and the deposited energy, ε is the total energy deposited, ρ is the average depth of ion incidence, α, β are the Gaussian distribution parameters parallel and perpendicular to the beam direction, respectively, VM is the peak removal rate, θ is the incident angle, and 6σ is the beam diameter.
With the angle error, the removal function can be modified as
R ( X , Y , Z ) = V m exp X X 0 2 + Y Y 0 2 2 σ tan r 3 z 2 ,
where
V m = J 0 Λ ε cos θ + θ exp ρ 2 cos 2 θ + θ 2 ( α 2 cos 2 θ + θ + β 2 sin 2 θ + θ ) 2 π σ tan r 3 z 2 2 π ( α 2 cos 2 θ + θ + β 2 sin 2 θ + θ ) ,
where z′ is the small change of target distance direction caused by angle error.
Considering a spherical surface with a curvature radius of R. The incident angle θ of any dwell point on the surface can be expressed as
θ = arccos z x 2 + y 2 + z 2 = arccos z R .
By first-order approximation, the spherical surface can be approximately expressed as
z = 1 2 R X 2 + Y 2 .
Substitution of Equation (30) into Equation (29) yields
θ = arccos X 2 + Y 2 2 R 2 .
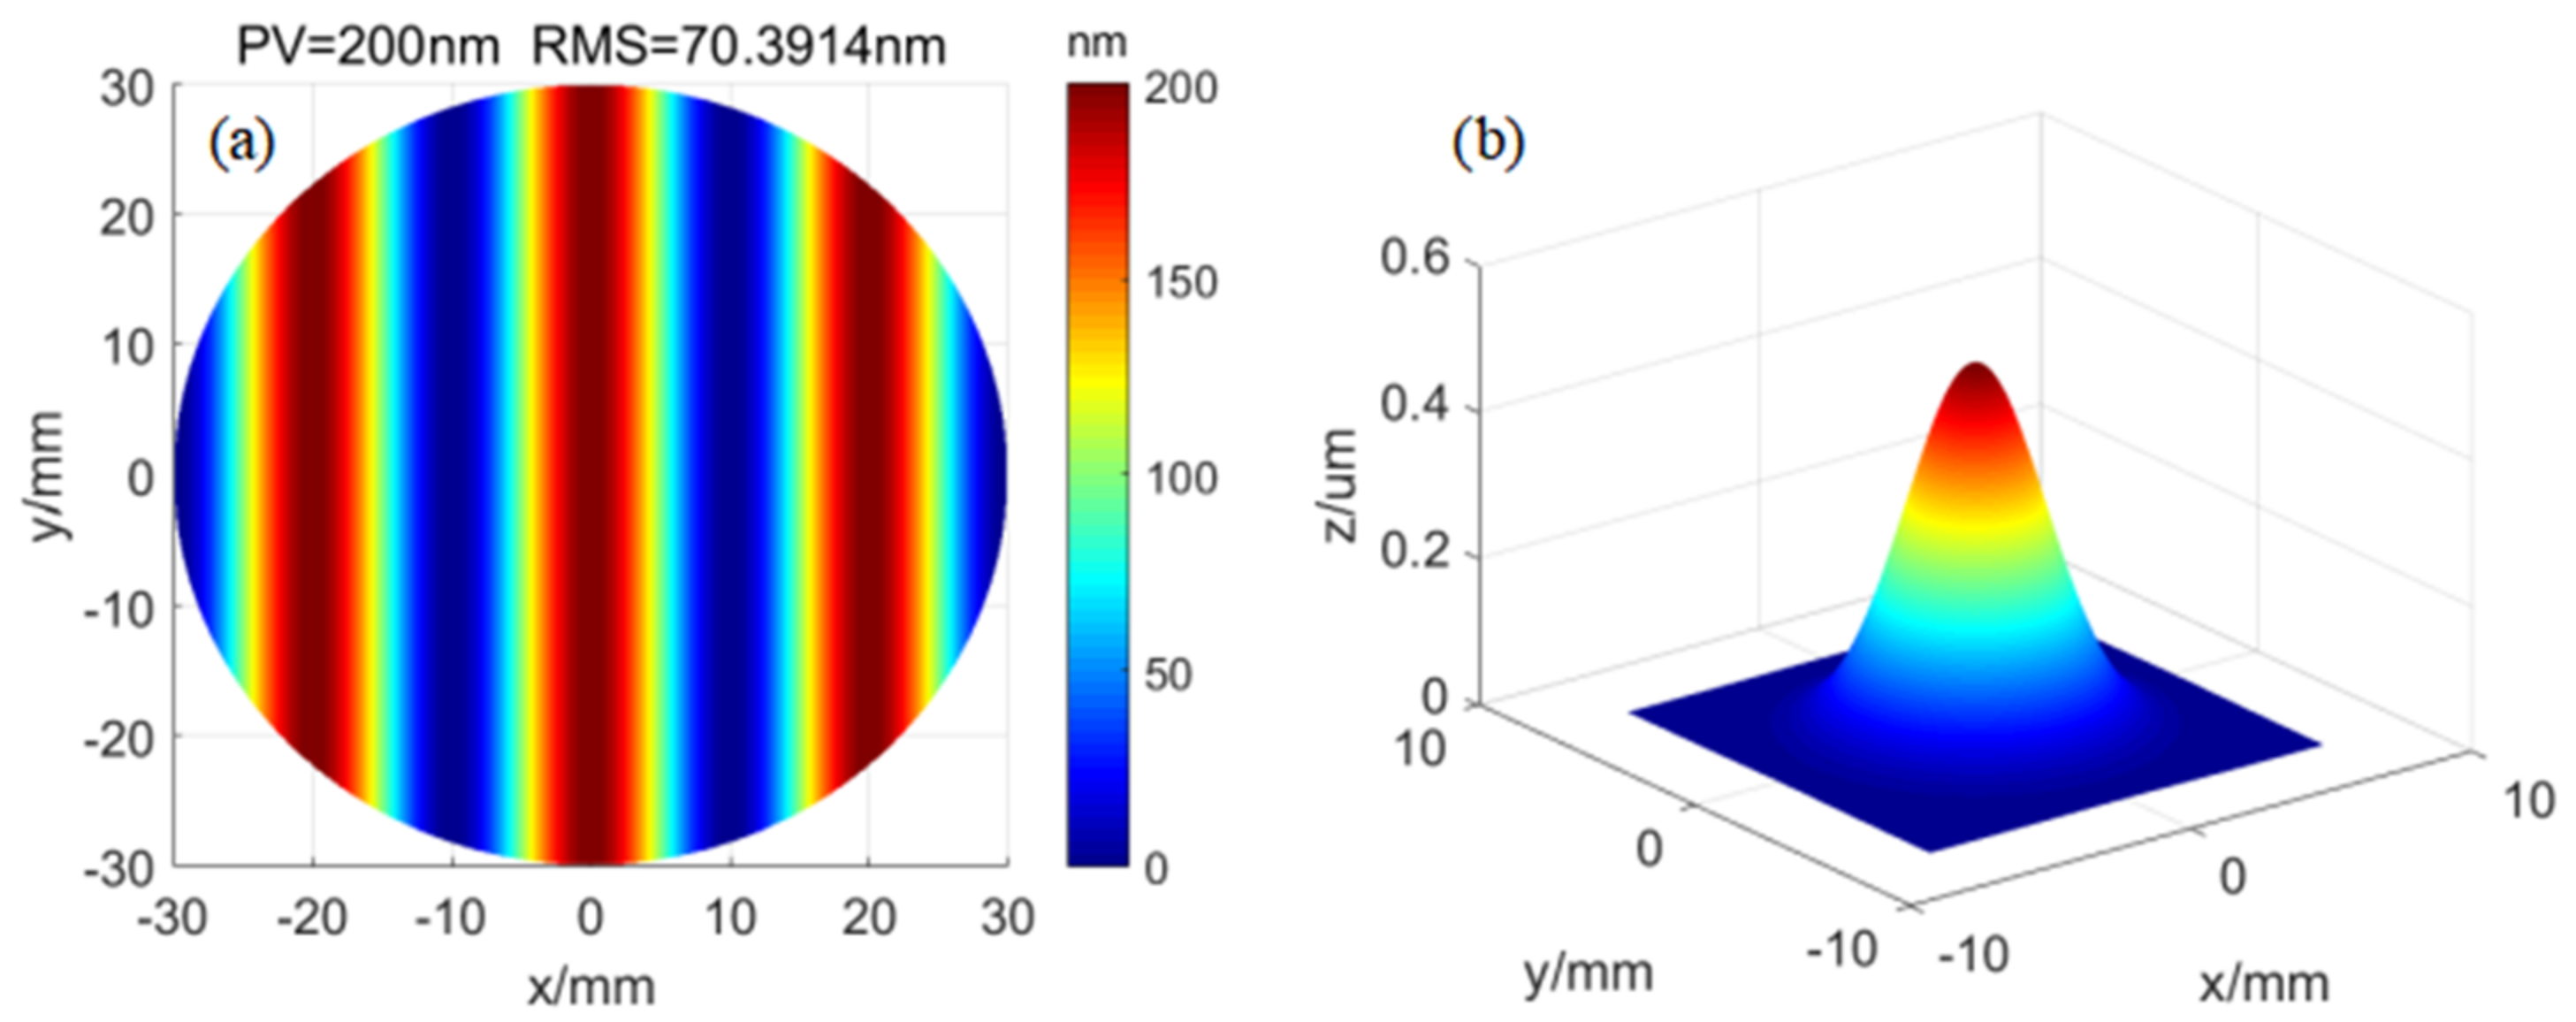
The parameters of the simulations were set as described below. Without generality, R was set as 30 mm. The aperture of the surface was 60 mm. The surface figure error was a sinusoidal error with an amplitude of 100 mm, and the period was 20 mm. The shape of the removal function at the origin point was the standard Gaussian shape. The beam diameter was 12 mm, and the peak removal rate was 0.5 μm/min. The surface figure error and the removal function are shown in Figure 10a,b, respectively.
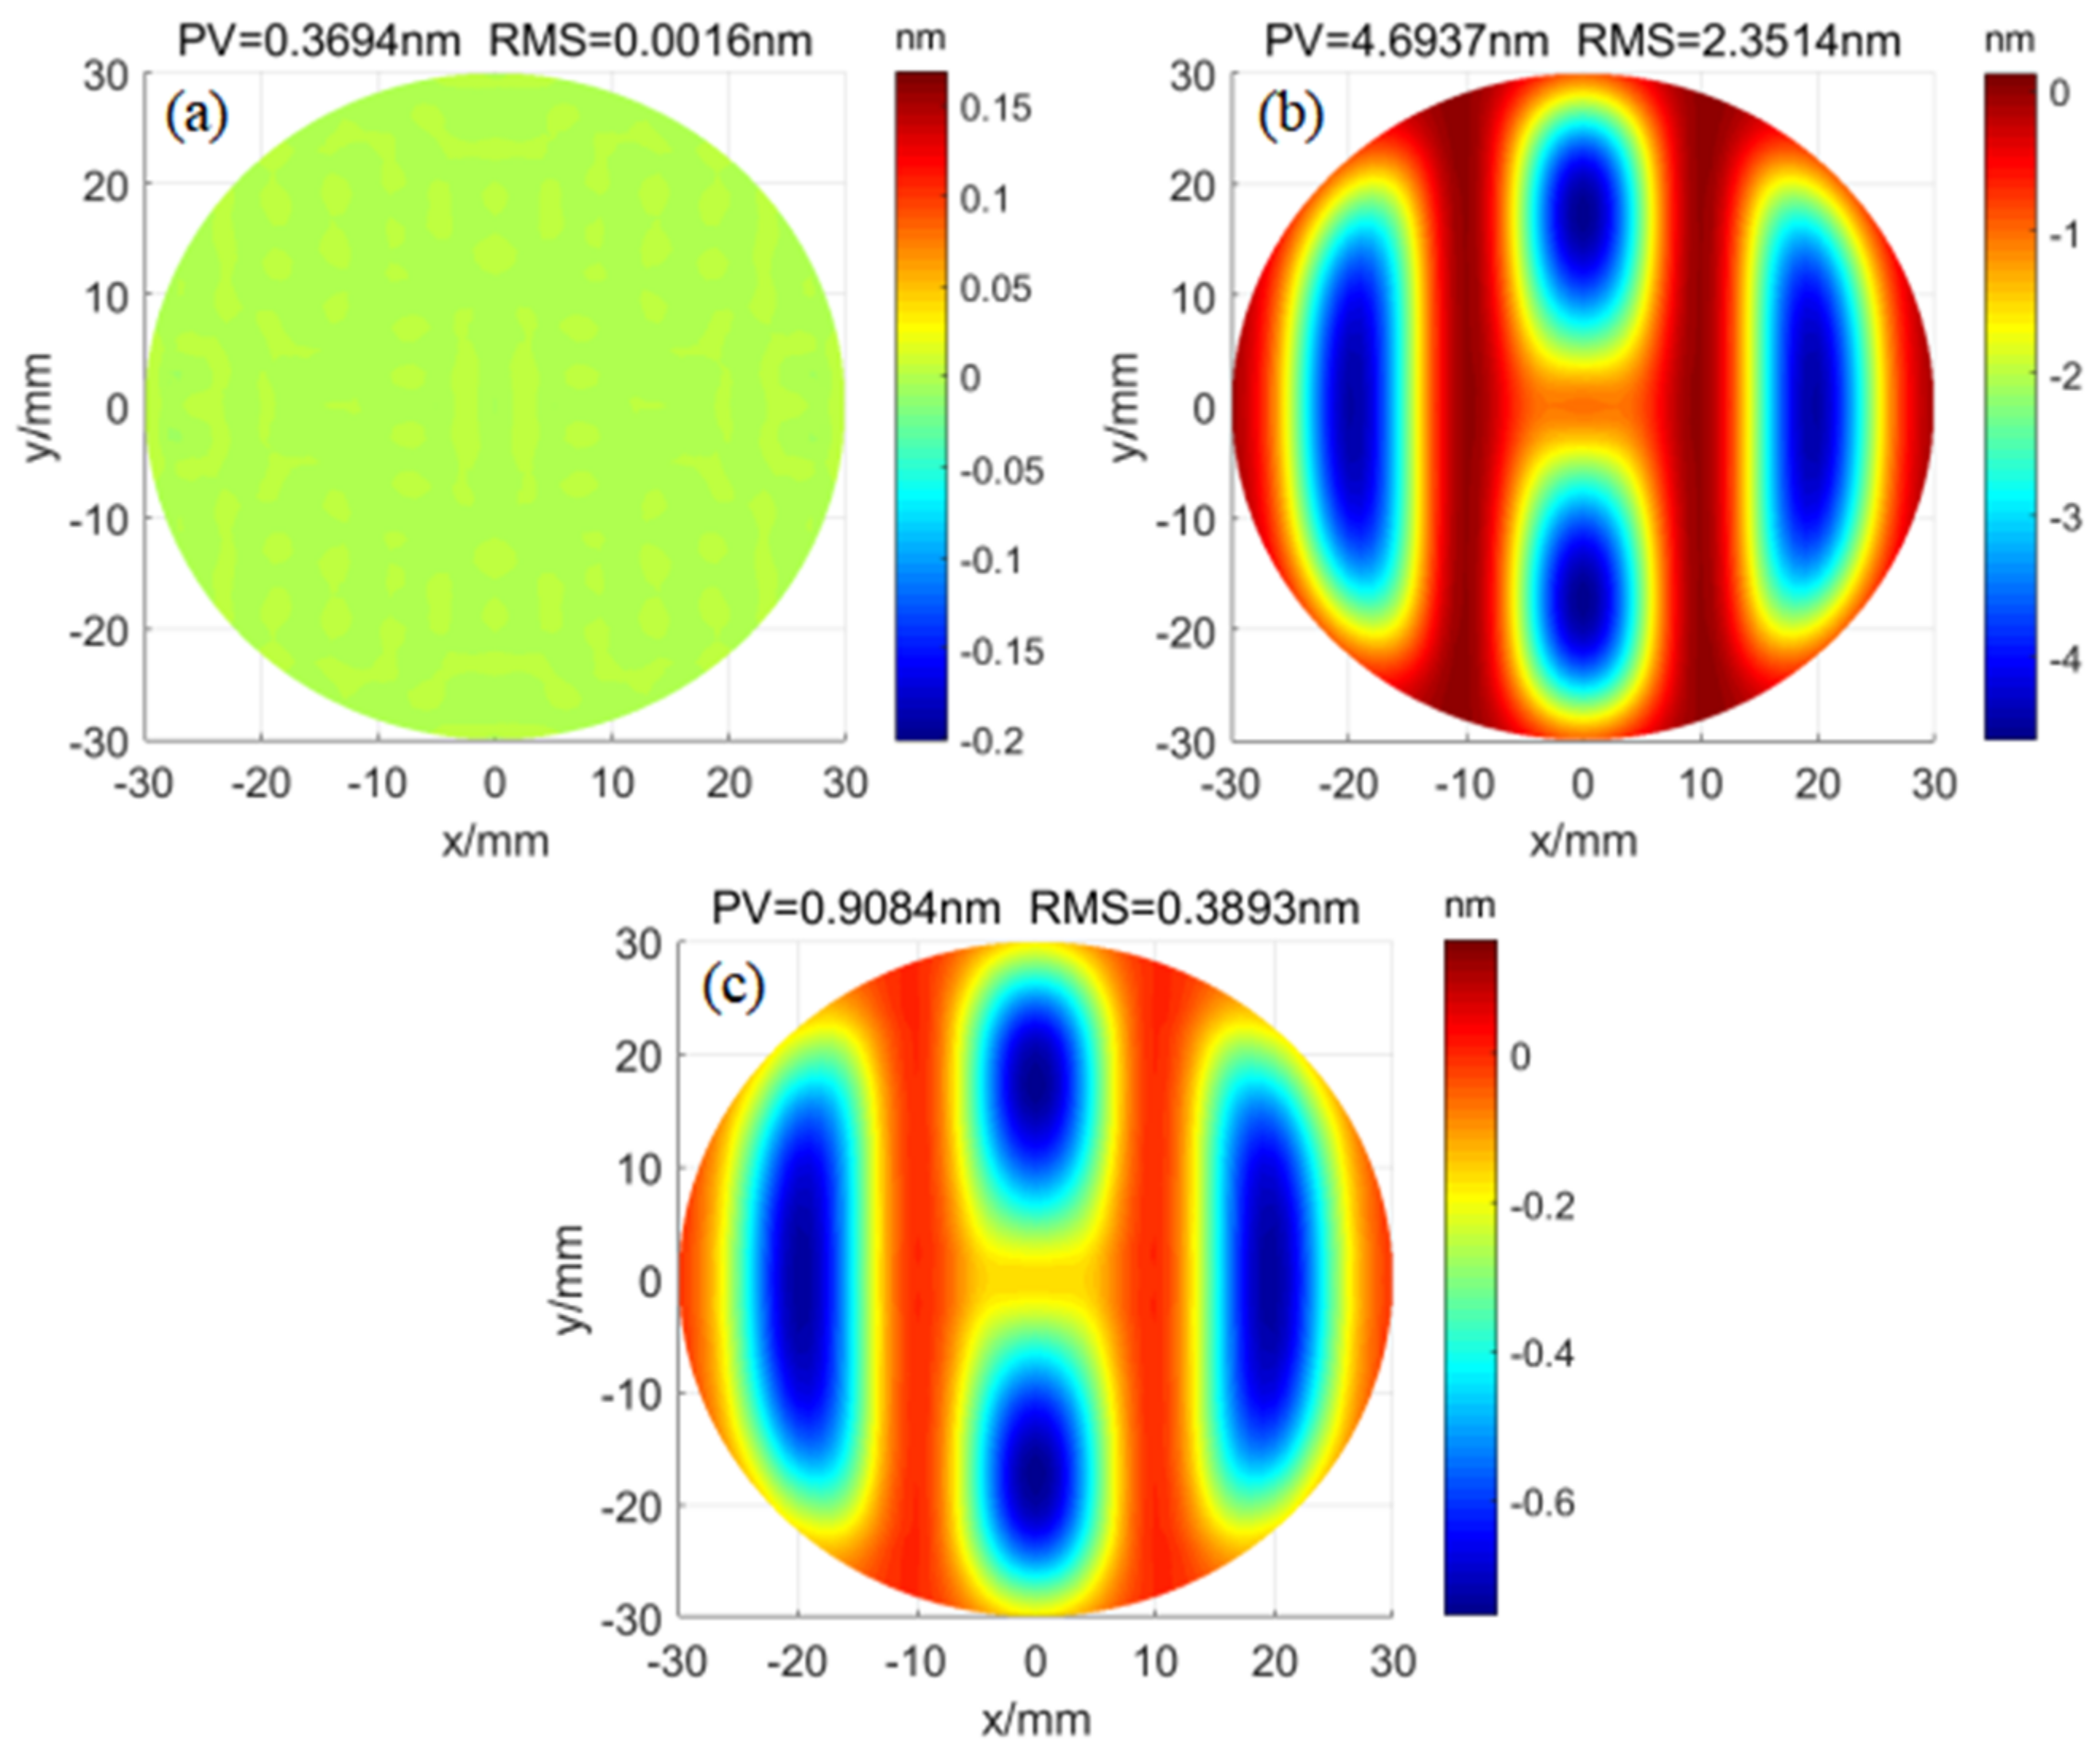
In the simulation, the dwell time was solved using the generalized minimum residual (GMRES) method with 100% surface figure error removal amount and compensation of the removal function according to the curvature of the surface. Then, the convolution of the curvature compensated for removal function with the dwell time, the convolution of removal function with 10′ angle error with the dwell time, and the convolution of removal function with 1° angle error with the dwell time were calculated and subtracted from the initial surface figure error, respectively. The simulated residual errors of these three cases are shown in Figure 11a–c, respectively. The RMS values of the residual error of Figure 11a–c were 0.0016 nm, 2.3514 nm, and 0.3893 nm, respectively. Therefore, the angle error cannot be ignored in figuring curved surfaces for achieving sub-nanometer accuracy.

2.2.1. Tangential Positioning Accuracy

The tangential positioning accuracy requirement on figuring flat surfaces was analyzed first. The tangential positioning error would result in the deviation of the dwell position from the theoretical position. The translational positioning error requirements along the feeding axis (x-axis) and the scanning axis (y-axis) were the same. Hence, the feeding axis was analyzed without generality. A surface figure error was considered with a single frequency component, i.e., H x , y = A s i n ( 2 π x / λ ) , where λ is the spatial period.
The removal amount of materials E0(x,y) of IBF figuring can be expressed as
E 0 ( x , y ) = R ( x , y ) T ( x , y ) ,
where R(x,y) is the removal function, T(x,y) is the dwell time, and denotes the convolution operation.
The ideal case for figuring is that the removal amount of material is equal to the initial surface figure error, i.e.,
E 0 ( x , y ) = R ( x , y ) T ( x , y ) = H ( x , y ) = A sin ( 2 π x / λ ) .
The dwell point os changed if there exists positioning error Δx along x-axis. The practical removal amount can be expressed as
E ( x , y ) = R ( x Δ x , y ) T ( x , y ) = A sin 2 π ( x Δ x ) / λ .
Subtracting Equation (33) from Equation (34) yields the residual error e(x,y) caused by position error, i.e.,
e ( x , y ) = A sin ( 2 π x / λ ) A sin 2 π x Δ x / λ                       = 2 A sin ( π Δ x / λ ) cos 2 π x + Δ x / 2 / λ .
The RMS value of the residual error e(x,y) can be expressed as
σ r = 1 T 0 T e 2 x , y d x = 1 T 0 T 2 A sin ( π Δ x / λ ) cos 2 π x + Δ x / 2 / λ 2 d x         2 A sin ( π Δ x / λ ) .
Equation (36) explicitly presents the relation between the positioning error and the surface figure characteristics. The smaller the spatial period λ is, the higher the requirement on the tangential positioning accuracy is. In terms of the amplitude of the surface figure error, the larger the amplitude of the surface figure error A is, the higher the requirement on the tangential positioning accuracy is.
The RMS values of the residual error, with positioning error Δx varied between 0 and 100 μm with an interval of 5 μm for a spatial period λ equaling 5 mm, 10 mm, 15 mm, and 20 mm, were calculated. The results are shown in Figure 12.
A further calculation was conducted to obtain the tangential positioning accuracy required by typical mirrors with sub-nanometer accuracy. The RMS value of the initial surface figure error can be expressed as
σ s = 1 T 0 T H 2 x , y d x = 1 T 0 T A sin ( 2 π x / λ ) 2 d x = 2 A / 2 .
The rate of residual error Rr is denoted as the ratio of the RMS value of the residual error with that of the initial surface figure error. Rr can be calculated using Equations (5) and (6) as
R r = σ r σ s = 2 sin ( π Δ x / λ ) .
According to our experience on sub-nanometer accuracy figuring, the surface figure is hard to converge if Rr > 60%. Substitution of Rr = 60% and the typical shortest spatial period value λ = 1 mm of a synchrotron radiation focusing mirror (the typical mirrors that require sub-nanometer accuracy) into Equation (7) yields Δx = 100 μm. This can be a reference when designing the translational axes of IBF machine tools for meeting sub-nanometer accuracy figuring.
On the other hand, Equation (5) can help researchers or craftsmen who design processes using certain IBF machine tools to make sub-nanometer precision surfaces. For example, optimization of the initial surface figure (reducing the error amplitude or the error frequency) or reducing the removal amount for every single process can be conducted to realize sub-nanometer precision figuring when the tangential positioning error is larger than 100 μm.
Furthermore, for figuring curved surfaces, the tangential positioning error will introduce the deviation of incident angle and the target distance except for the deviation of the dwell position from the theoretical position. When tangential positioning errors in x- and y-directions are considered, the removal function can be modified from Equations (25) and (26) as
R ( X , Y , Z ) = V m exp X + Δ x X 0 2 + Y + Δ y Y 0 2 2 σ 2 ,
V m = J 0 Λ ε cos θ × exp ρ 2 cos 2 θ 2 ( α 2 cos 2 θ + β 2 sin 2 θ ) 2 π σ tan r 3 z 2 2 π ( α 2 cos 2 θ + β 2 sin 2 θ ) .
Equations (39) and (40) establish the model of the influence of tangential positioning errors on the removal function. Then, simulations were conducted to visualize the extent of the influence. Without generality, the spherical surface with R = 30 mm and aperture of 60 mm (the same as that of Section 2.2) were used in the simulation. The surface figure characteristic and the process parameters were also the same as in Section 2.2. The surface figure error was a sinusoidal error with an amplitude of 100 mm, and the period was 20 mm. The shape of the removal function at the origin point was the standard Gaussian shape. The beam diameter was 12 mm, and the peak removal rate was 0.5 μm/min. Therefore,
θ = arccos X + Δ x 2 + Y + Δ y 2 2 R 2 .
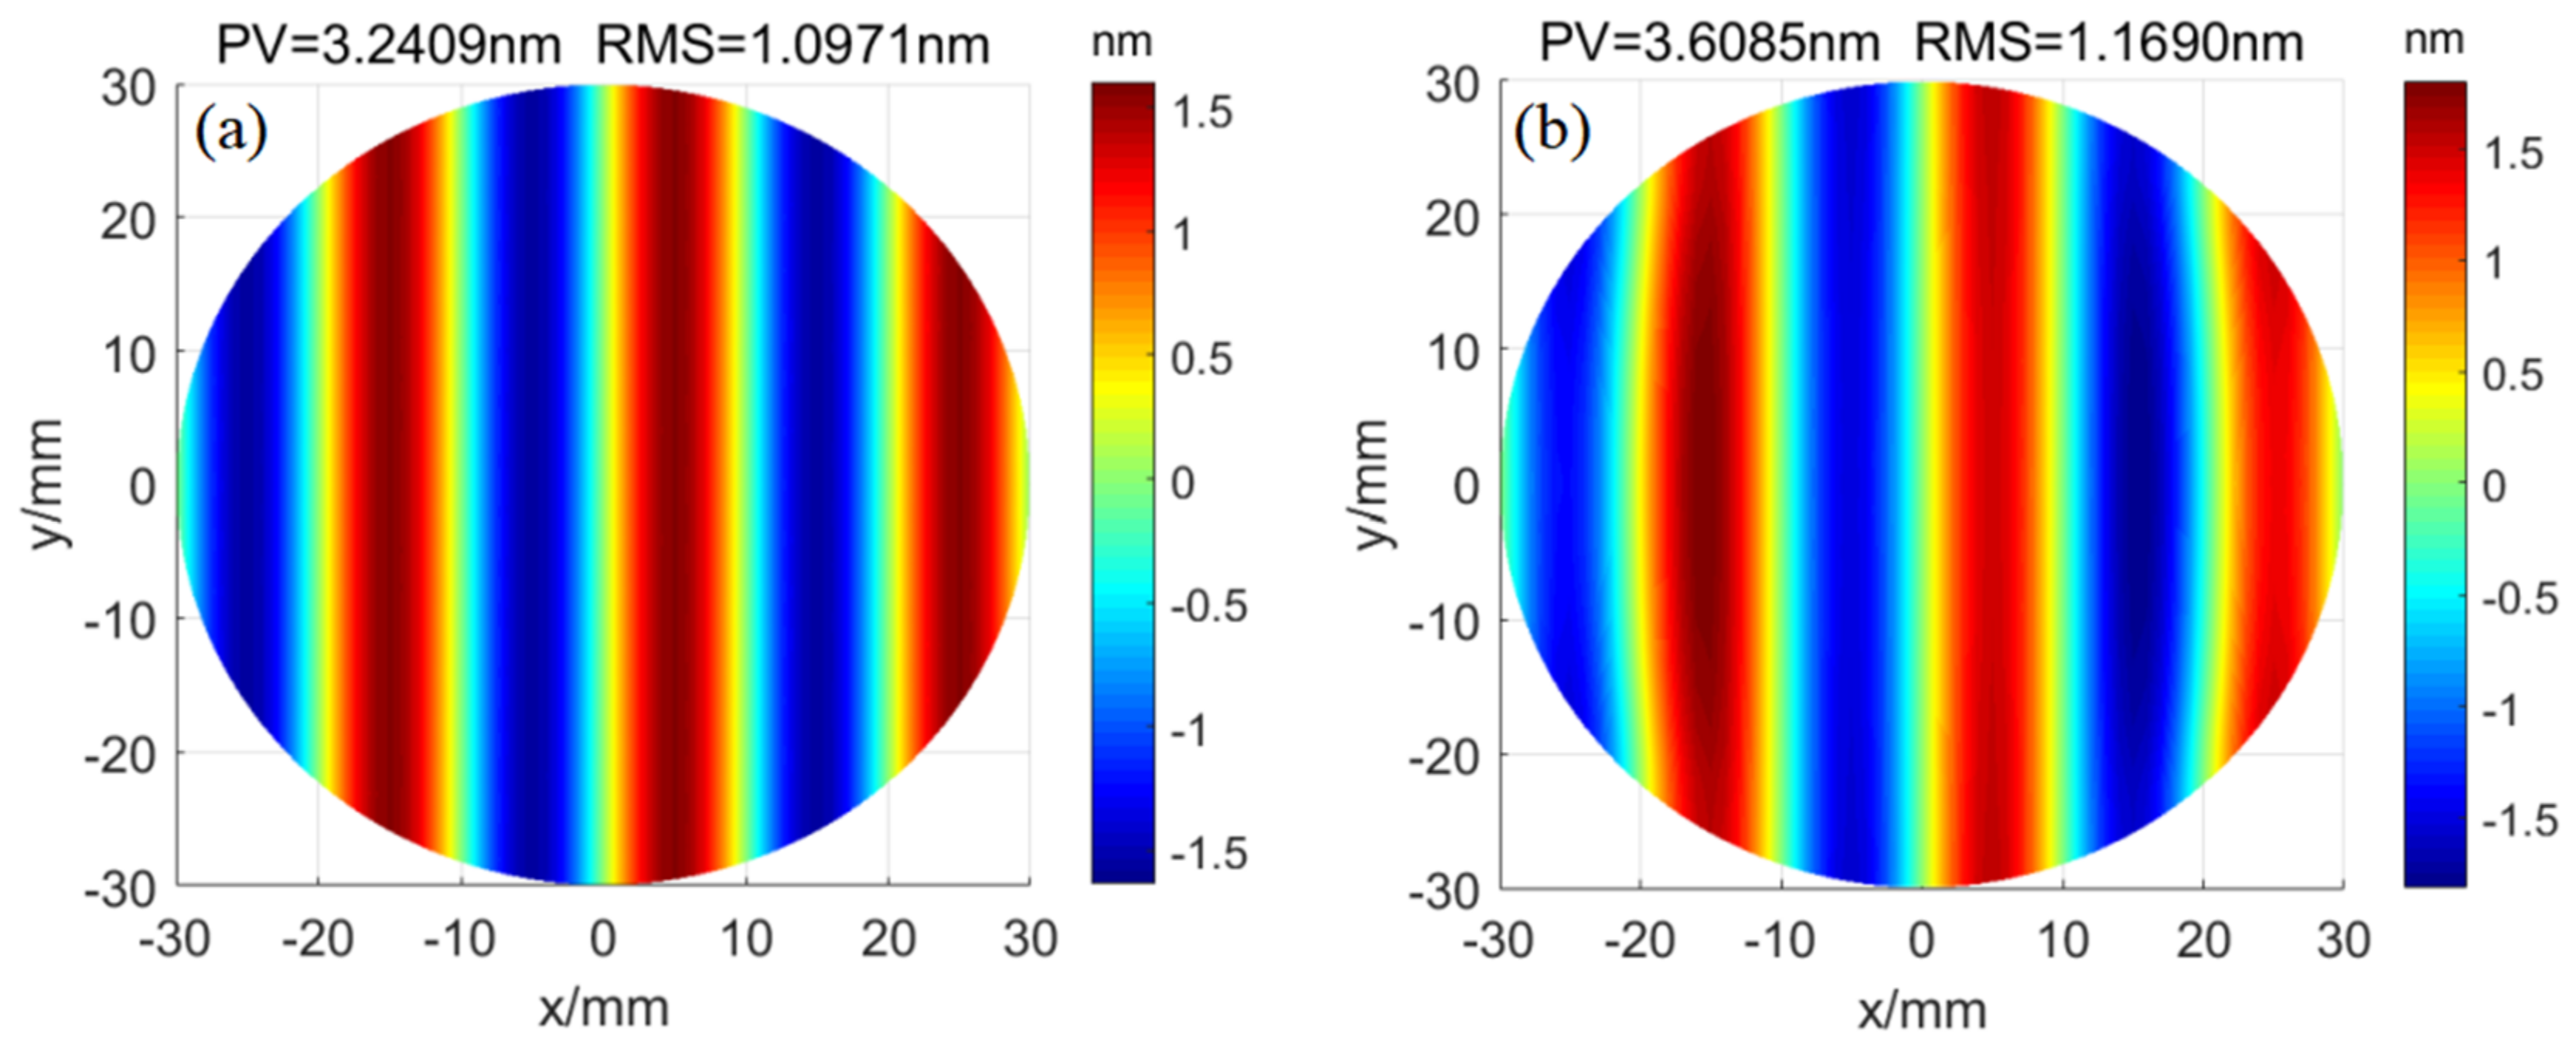
During the simulation, the tangential positioning error was set as 50 μm which is a moderate value for common IBF machine tools. The simulated residual figuring error ignoring and considering the angle and target distance deviation caused by positioning error are shown in Figure 13a,b with 1.0971 nm RMS and 1.1690 nm RMS, respectively. Therefore, the positioning error would introduce larger error in figuring curved surface. To control the residual error, the amplitude and period of the initial surface figure error need to be controlled stricter in curved surfaces figuring than that in flat surface figuring.

2.2.2. Requirement Analysis of Angle Positioning Accuracy

Considering a parabolic surface,
z = 1 2 R x 2 + y 2 ,
where R is the curvature at the vertex, r x r , r y r .
The normal vector of any point on the paraboloid is α = x , y , R . Consider the unit vector β = 0 , 0 , 1 , which is perpendicular to the xy-plane; the angle of incidence at that point is θ = arccos α β | α | | β | . Using the method of solving the dwell time by linear equations, the processing residual error caused by angle error Δ θ for surface shapes with various steepness and the initial surface shape errors with different amplitudes and frequencies are shown in Figure 14. As shown in Figure 14, the larger the amplitude, frequency, and surface steepness of the initial surface error are, the higher the requirement for the positioning accuracy of the machine tool in the figuring process is.

2.3. Summary

(1) Simulation and theoretical calculations revealed that the three-axis IBF machine tools should typically have a positioning accuracy of at least 100 microns and exhibit a certain dynamic performance for achieving sub-nanometer accuracy.
(2) The static and dynamic performance requirements on three-axis IBF machine tools are different under different process parameters for a given surface. For a given IBF machine tool with measurable static and dynamic performances that basically and partly meet the static and dynamic performance requirements, sub-nanometer accuracy for a given surface can be achieved stably by adjusting the process parameters such as controlling the single removal amount and optimizing the parameters of the removal function.
(3) By summarizing the analysis in Section 2.1 and Section 2.2, it can be shown that the main factors affecting the static performance requirements for sub-nanometer figuring are the amplitude and frequency of the surface error.
(4) More factors including the amplitude and frequency of the surface, the beam diameter of the removal function, and the peak removal rate will affect the dynamic performance requirements for sub-nanometer figuring. Therefore, there exist more parameters that can be adjusted to meet the requirements of dynamic performance than that of the static performance for obtaining sub-nanometer surfaces.
(5) Due to the static and dynamic performance requirements on the IBF equipment being different under different process conditions, we can achieve stable convergence of sub-nanometer accuracy by adjusting the process parameters for a given IBF equipment with measurable static and dynamic performances that basically and partly meet the static and dynamic performance

3. Results

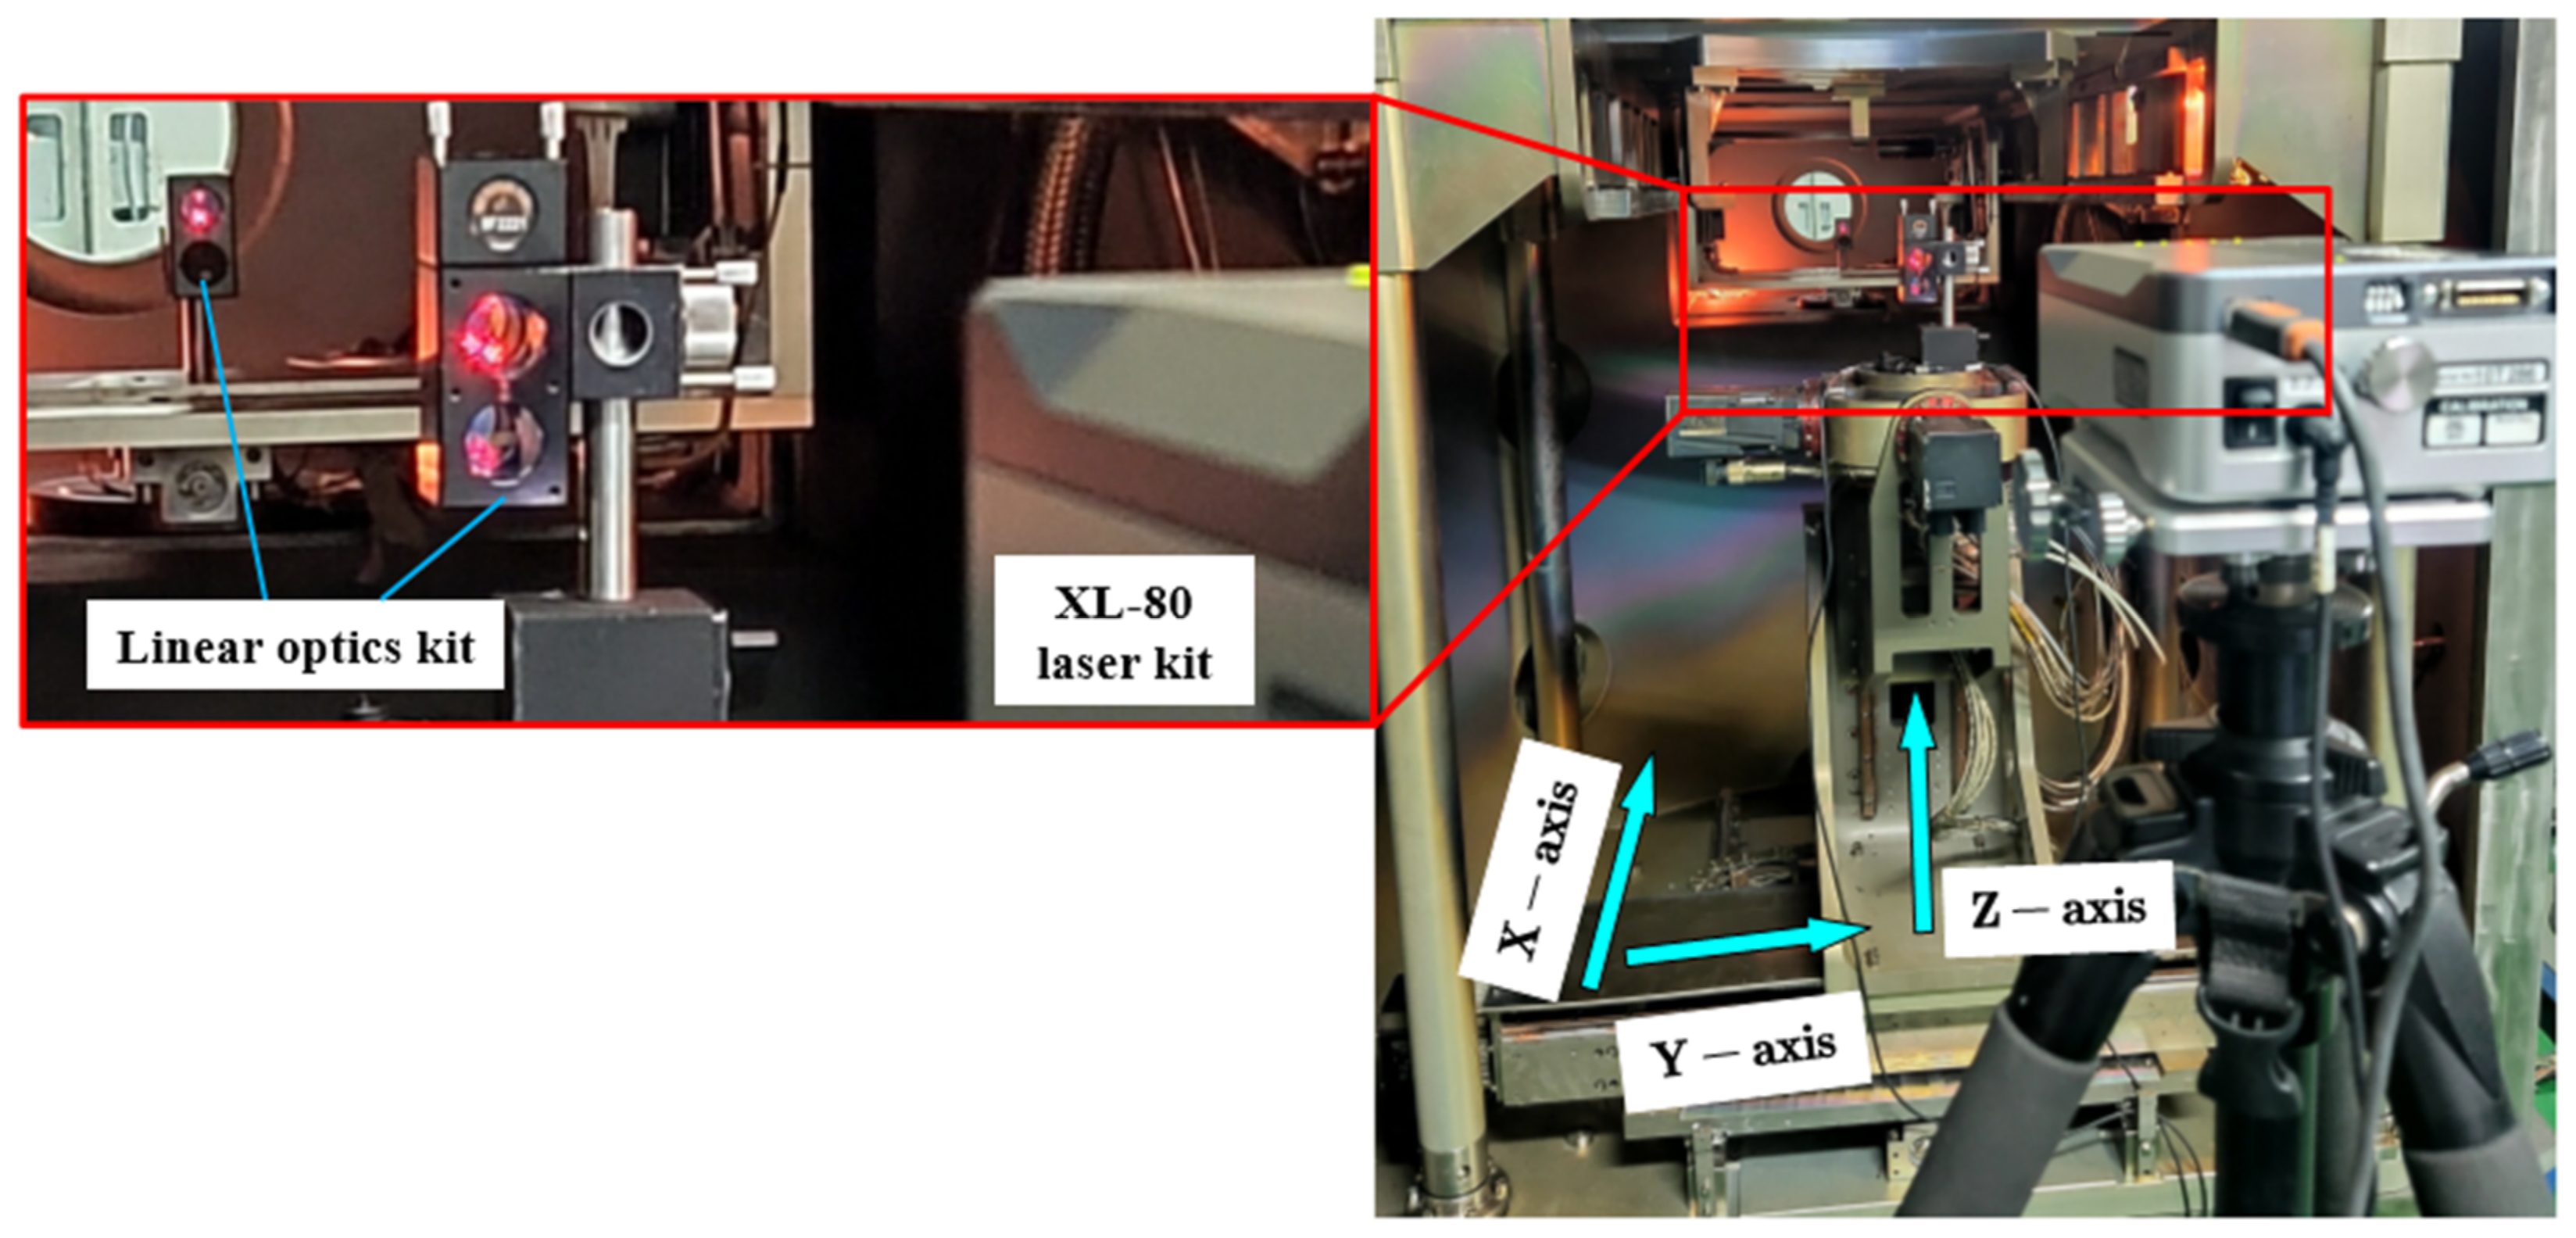
Experiments were conducted to verify that the above analysis can help optimize the process parameters for obtaining sub-nanometer accuracy using a given IBF machine tool for figuring a given surface. The given IBF machine tool is a self-developed three-axis IBF equipment-IBF700. It has three translation axes where x-axis is the feeding axis, y-axis is the scanning axis, and z-axis is the target distance control axis. The designed strokes of the x- y-, and z-axes of IBF700 are 700 mm, 700 mm, and 130 mm, respectively. The dynamic and static performances of IBF700 were measured using the PCB PIEZOTRONICS acceleration sensor and RENISHAW XL80 dual-frequency laser interferometer, respectively. The measurement results of dynamic and static performance are listed in Table 1. The experiment setup for measuring the static performance is shown in Figure 15.
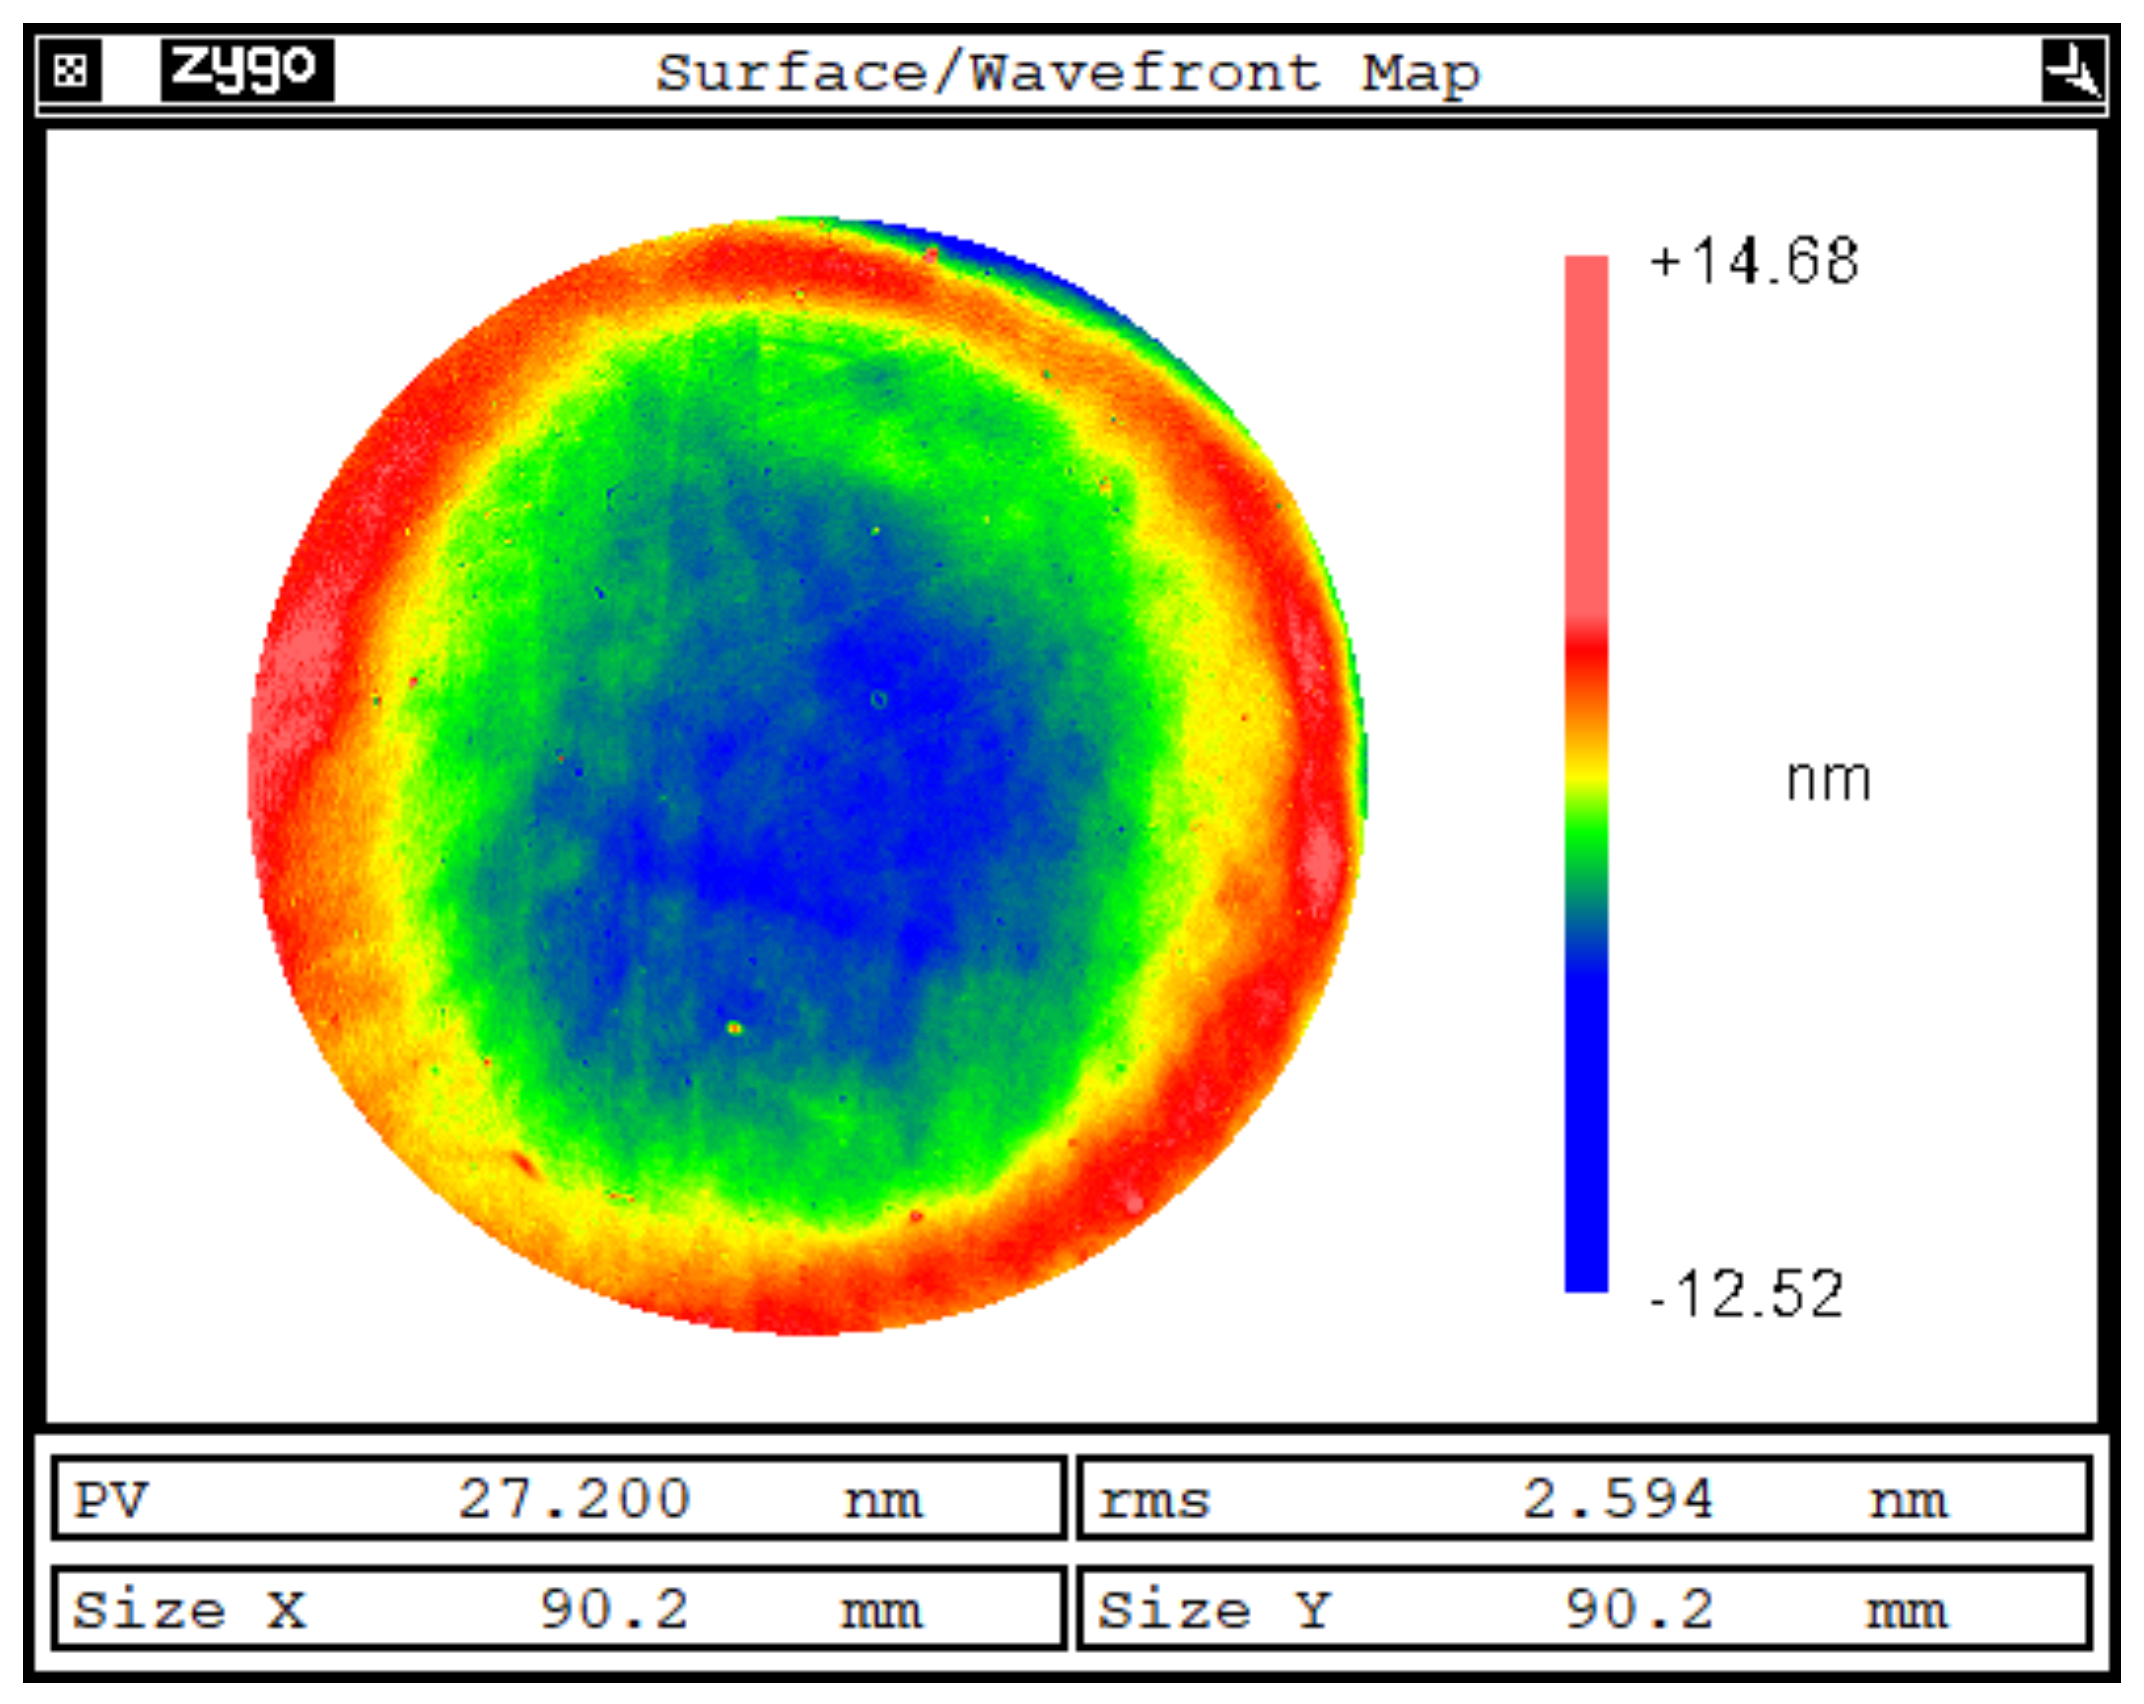
The surface to be figured to sub-nanometer accuracy is a Φ90 mm flat mirror with glass–ceramic material. The initial surface figure error is shown in Figure 16 with 27.2 nm PV and 2.594 nm RMS. The figuring goal is better than 0.3 nm RMS.
Then, simulations were conducted to explore how better the given surface can be figured using IBF700.
In general, the simulation of residual error included the following steps:
  • Measure and set the expected material removal distribution E(x,y) and removal function R(x,y);
  • Discretize E(x,y) and R(x,y);
  • Use the TSVD method to calculate the dwell time matrix. The dwell time is solved using the generalized minimum residual (GMRES) method;
  • Obtain simulated material removal distribution through discrete two-dimensional convolution;
The difference between simulated material removal distribution and expected material removal distribution is called residual error.
During the simulations, the beam diameter was 10 mm. The removal function is shown in Figure 17a. The positioning error of the x- and y-axes were both set as 100 μm considering both the positioning accuracy of the x- and y-axes (measurement result, about 50 μm) and the clamping process (about 50 μm). Figure 17b shows the simulation results within one round of figuring (the dwell time was solved with 100% surface figure error removal amount). As shown in Figure 17b, the residual error was 0.496 nm RMS. This indicates that the process parameters should be further optimized for the given surface and IBF machine tool.
According to the analysis result as shown in Section 2, there exist more parameters that can be adjusted to meet the requirements of dynamic performance than that of the static performance for obtaining sub-nanometer accuracy. Therefore, the single removal amount is first reduced (using three rounds of figuring instead of only one round of figuring) to reduce the requirement of static performance according to the analysis results shown in Section 2.2. That is to say, the static performance of IBF700 is set to meet the requirement for achieving 0.3 nm. However, reducing the single removal amount will put forward harder dynamic requirements on the IBF machine.
Figure 18a shows the required dynamic performance of y-axis along one transversal across the center of the surface to be figured. The maximum of the requirements on the dynamic performance of y-axis is about −4.5 m·s−2, which is higher than the dynamic performance of y-axis of IBF700 (about ±1.3 m·s−2, the line marked by red). Therefore, further optimization should be conducted. According to the analysis results shown in Section 2.1, a combination strategy of adding an extra removal layer (0.2 nm) and reducing the peak removal efficiency (from 198 nm/min to 167 nm/min) is used. The dynamic performance requirement on y-axis after this process optimization is shown in Figure 18b. It shows that IBF can meet the dynamic performance requirement after process parameters optimization.
Lastly, we simulated the figuring process during the three rounds of figuring using the optimized process parameters. The simulation results of the three iterations are shown in Figure 19a–c, respectively. It shows the surface can be figured to accuracy of 0.23 nm RMS, which is better than 0.3 nm RMS after optimizing the process parameters using the proposed method.
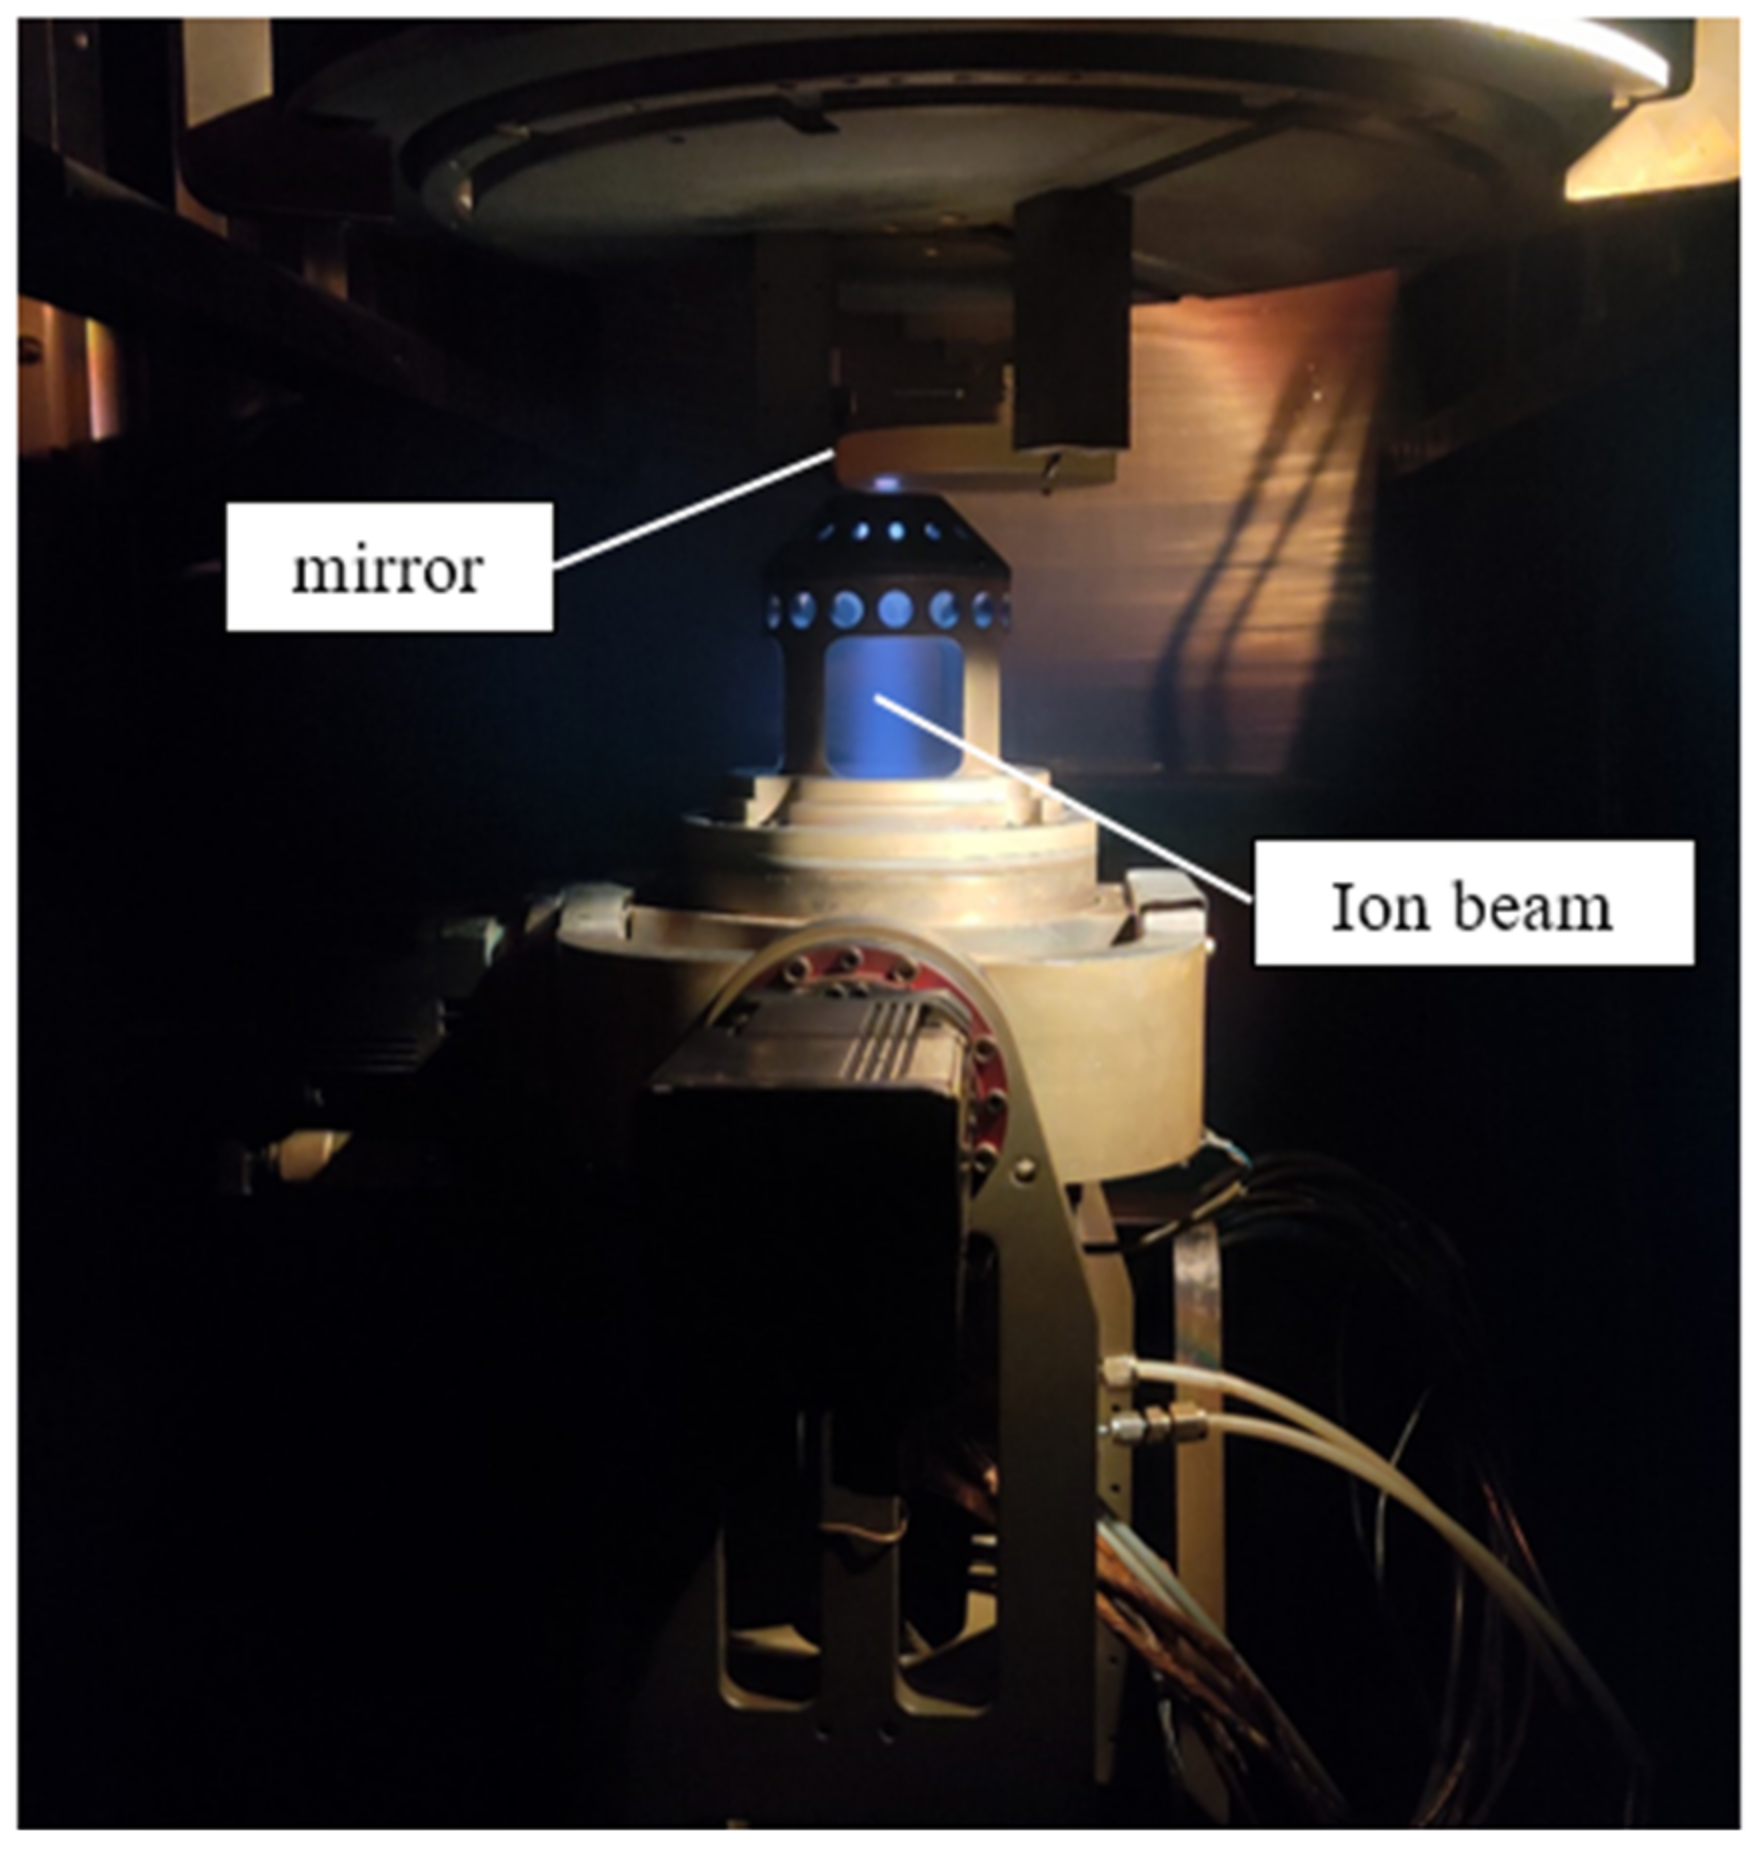
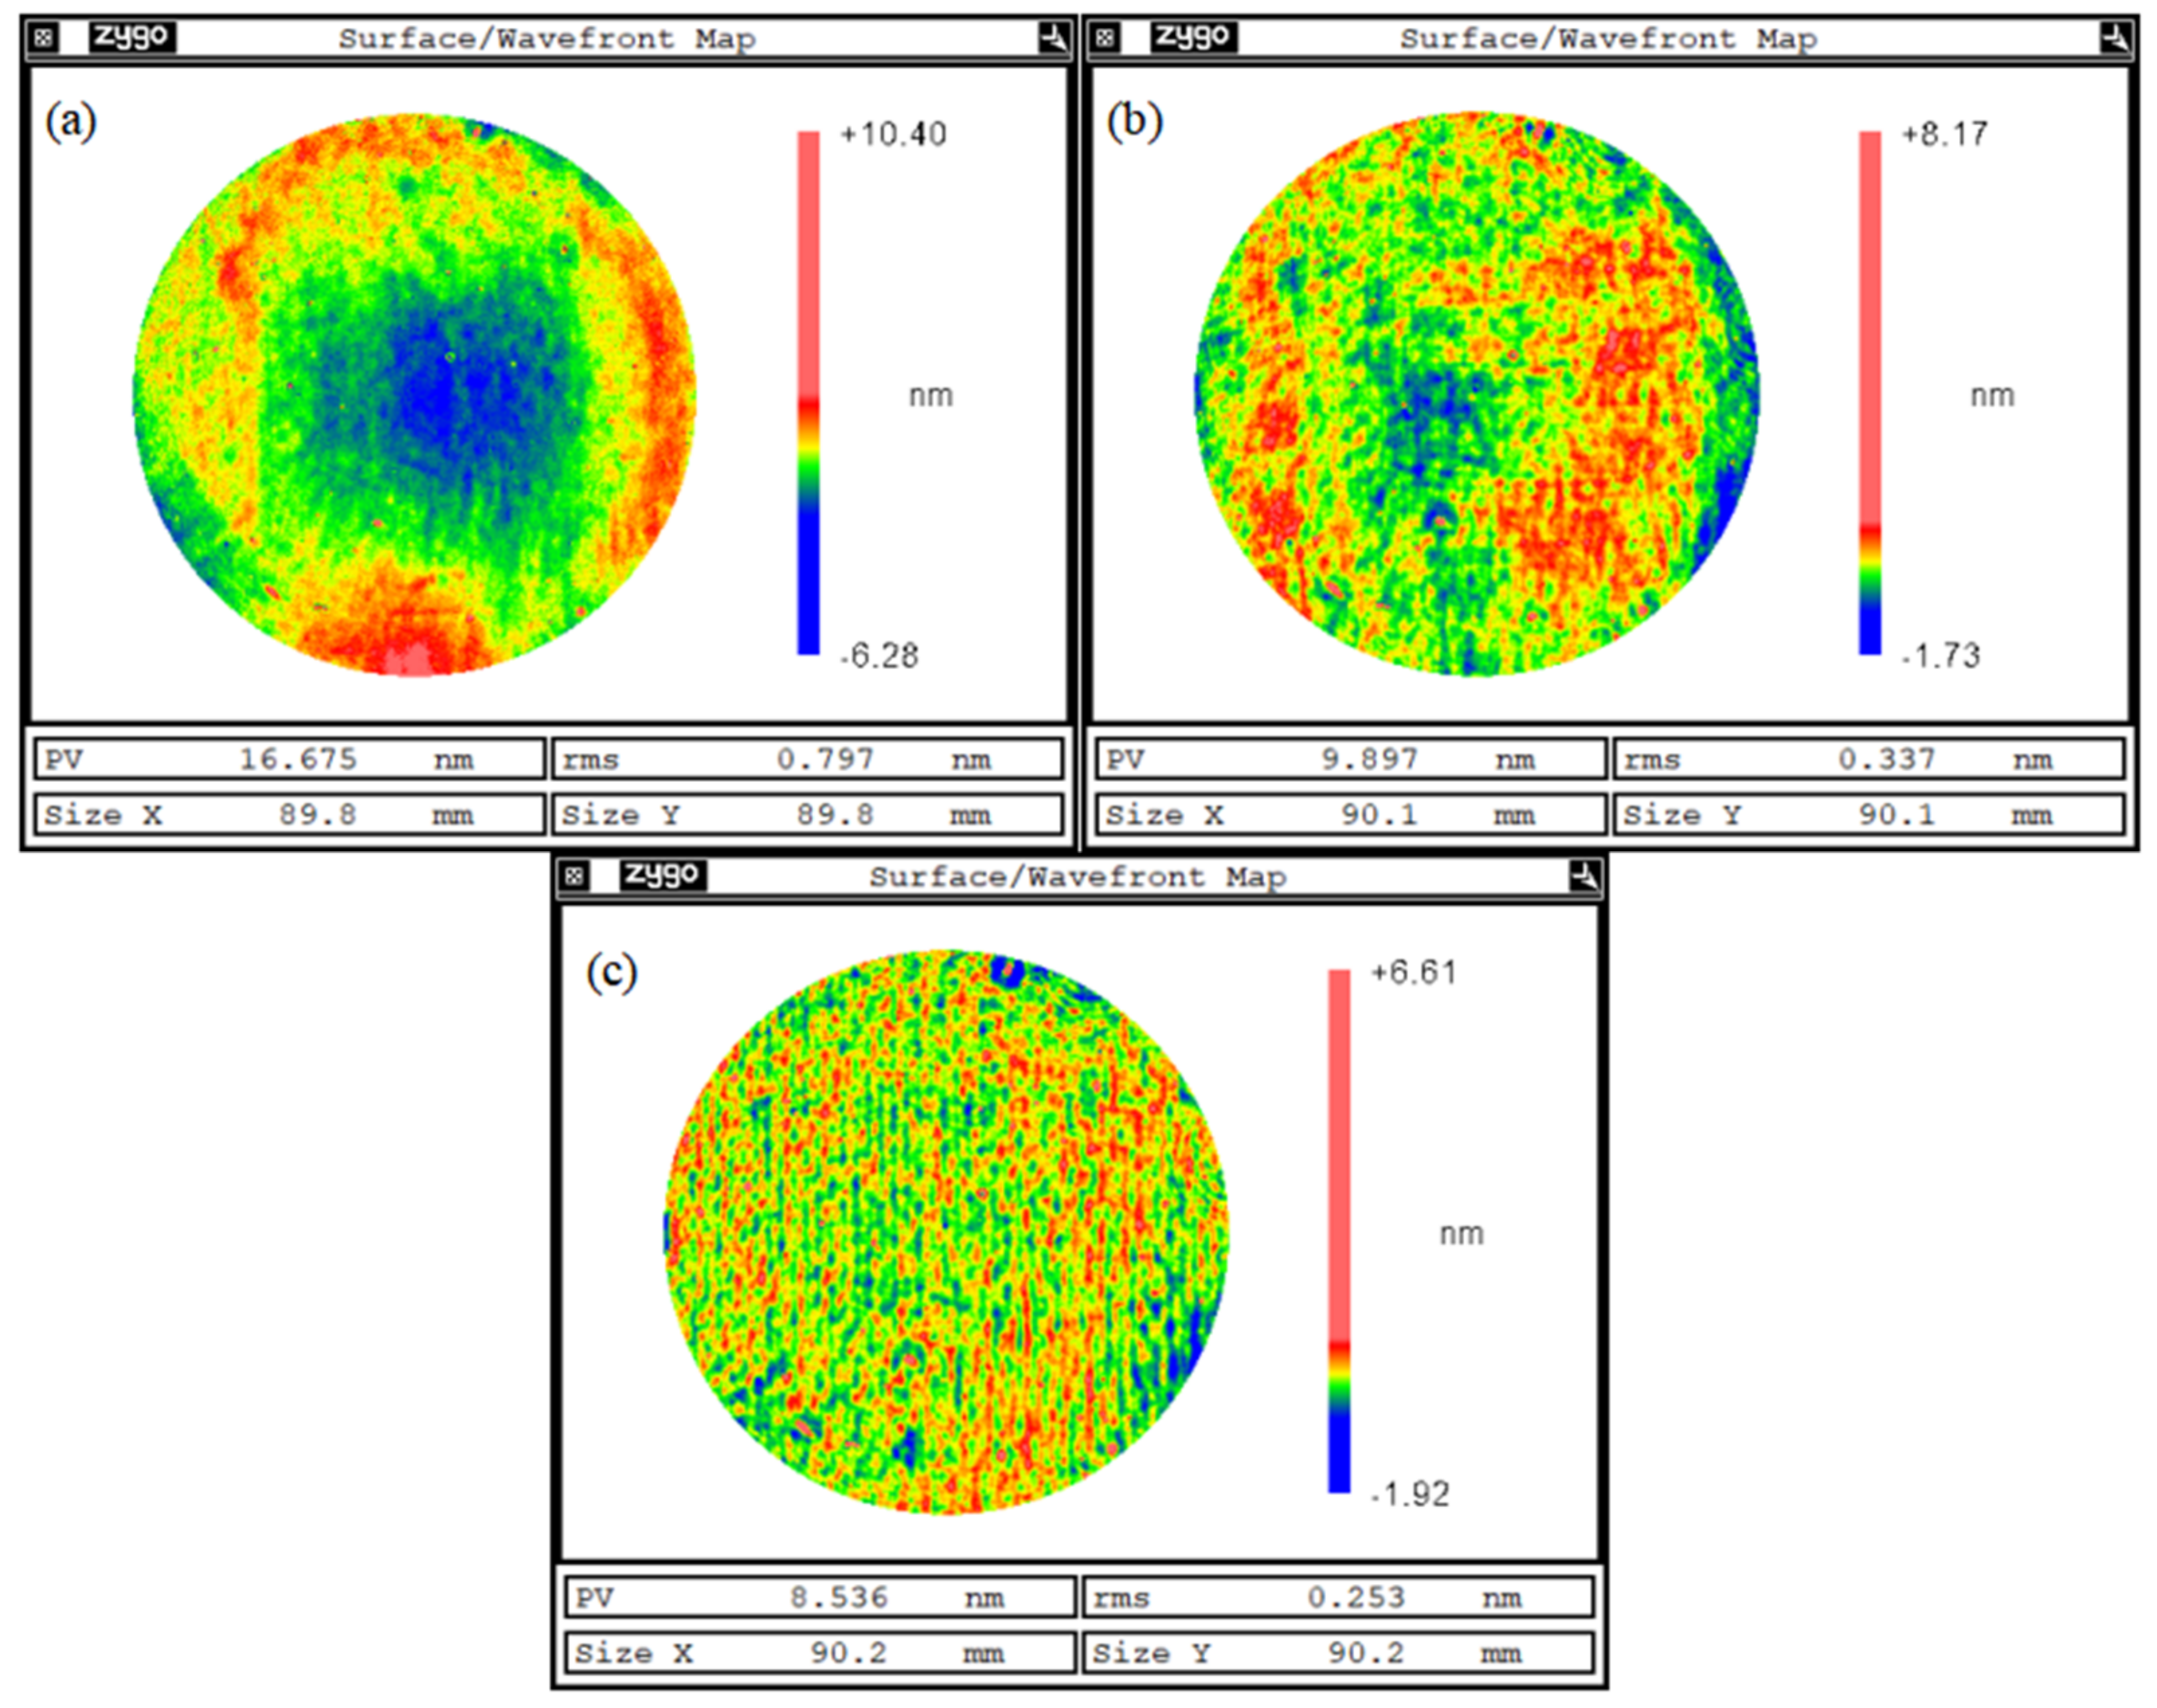
Practical figuring on the given surface using IBF700 was conducted using the optimized process parameters. The practical process was set up using the 10 mm diameter beam which shown in Figure 19. Figure 20 showed the actual processing site.The processing results after the three iterations are shown in Figure 21a–c, showing that the accuracy of the given surface converges to 0.253 nm RMS through three iterations.

4. Discussion

(1)
A comparison of our obtained findings with previous studies is discussed below.
The previous studies which focused on process of IBF were based on optimizing process parameters according to the figuring results and figuring phenomena, i.e., process optimization was realized by studying the figuring effects of every process parameter.
The process optimization was conducted without detecting the performance of the IBF machine tools and without clarifying the performance requirements on IBF machine tools. Compared with the previous studies, we aimed to propose a new process optimization method based on analysis of dynamic and static performance requirements of IBF machine tools for sub-nanometer figuring. The requirements on IBF machine tools are different for different process parameters and surface figure characteristics.
Therefore, process parameters for a given surface can be optimized according to the analysis results to reduce the performance requirements on a given IBF machine tool with measurable performance. This new process parameter optimization method may be more deterministic, efficient, and explicit. Furthermore, the performance requirements analysis results can help design three-axis IBF machine tools that have qualified dynamic and static performance to achieve sub-nanometer accuracy.
(2)
Some issues of the proposed method are discussed below.
This paper mainly studied the influence of performance of IBF machine tools on low-frequency error. The IBF machine tool performance requirements for different process parameters were obtained. Then, a process optimization method based on analysis of dynamic and static performance requirements of IBF machine tools for sub-nanometer figuring was proposed. However, the performance of IBF machine tools also influences mid- and high-frequency errors (i.e., roundness and waviness). Usually, ultra-precision optics requires high accuracy within full-band frequency. Therefore, the influence of performance of IBF machine tools on mid- and high- frequency errors should be further studied. We are working on a process optimization method for sub-nanometer accuracy within full-band frequency based on an analysis of the performance requirements of IBF machine tools, and we hope to report it soon.
X-ray mirrors in the fourth-generation synchrotron radiation source for nanometer focusing can require surface figure up to a 0.1 mm spatial period. The cutoff frequency of IBF needs to be as high as 10 mm−1. Reducing the diameter of the ion beam is the common method. The theoretical cutoff frequency can be calculated using the diameter of the ion beam. However, we found in experiments that effective figuring on the corresponding frequency error component cannot be realized by reducing the diameter of the ion beam when the diameter of the ion beam has been reduced to a certain small value. Therefore, we can infer that the practical cutoff frequency can be reduced relative to the theoretical cutoff frequency due to the influence on the performance of the IBF machine tools. The influence of performance of IBF machine tools on the cutoff frequency should be studied. Thus, the designed performance of IBF machine tools can be determined by the cutoff frequency required certain surfaces.
Only dynamic and static performances of the IBF machine tools that seriously influence the low-frequency error were analyzed. However, the influence of the electric current loop of the IBF machine tools should be considered when we manufacture EUV lithography objective lenses that require sub-nanometer accuracy within full-band frequency. We found in preliminary experiments that the electric current loop can vibrate the tool, resulting in mid- and high- frequency error. The electric current loop together with the dynamic and static performance will influence the accuracy in full-band frequency. Therefore, the influence of the electric current loop of the IBF machine tools should be studied in the future.
The verification was only conducted on flat surfaces. Whether the proposed method can be applied to curved surfaces remains to be verified in future work. Furthermore, a surface with a small circular aperture was used in the experiment. Whether the proposed method applies to surfaces with a large rectangle aperture (usually used in synchrotron radiation source facilities) remains to be verified.

5. Conclusions

In the study, the dynamic and static performance requirements of three-axis IBF machine tools for figuring optical surfaces up to sub-nanometer accuracy were analyzed comprehensively. Simulation and theoretical calculations revealed that the three-axis IBF machine tools should typically have a positioning accuracy of at least 100 microns and exhibit a certain dynamic performance for achieving sub-nanometer accuracy. The static and dynamic performance requirements on three-axis IBF machine tools were different under different process parameters for a given surface. For a given IBF machine tool with measurable static and dynamic performances that basically and partly meet the static and dynamic performance requirements, sub-nanometer accuracy for a given surface could be achieved stably by adjusting the process parameters such as controlling the single removal amount and optimizing the parameters of the removal function. The analysis results and proposed method can promote the development of using three-axis IBF machine tools to process optical surfaces with sub-nanometer accuracy both in designing the performance requirements of three-axis IBF machine tools and in optimizing the process parameters for sub-nanometer accuracy.

Author Contributions

Conceptualization, H.H.; funding acquisition, Y.D.; investigation, S.X.; methodology, H.H.; writing—original draft, Y.W. and S.X.; writing—review and editing, Z.L. All authors have read and agreed to the published version of the manuscript.

Funding

This research was funded by the National Natural Science Foundation of China, grant numbers 51991371, 51835013, and 52105567.

Informed Consent Statement

Informed consent was obtained from all subjects involved in the study.

Data Availability Statement

Data are available upon request.

Conflicts of Interest

The authors declare no conflict of interest.

References

  1. Poyneer, L.A.; McCarville, T.; Pardini, T.; Palmer, D.; Brooks, A.; Pivovaroff, M.J.; Macintosh, B. Sub-nanometer flattening of 45 cm long, 45 actuator x-ray deformable mirror. Appl. Opt. 2014, 53, 3404–3414. [Google Scholar] [CrossRef] [PubMed] [Green Version]
  2. Liao, W.; Dai, Y.; Xie, X. Influence of material removal programming on ion beam figuring of high-precision optical surfaces. Opt. Eng. 2014, 53, 095101. [Google Scholar] [CrossRef]
  3. Kurz, P.; Mann, H.-J.; Antoni, M.; Singer, W.; Muhlbeyer, M.; Melzer, F.; Dinger, U.; Weiser, M.; Stacklies, S.; Seitz, G.; et al. Optics for EUV lithography. In International Microprocesses & Nanotechnology; IEEE: Piscataway, NJ, USA, 2002. [Google Scholar]
  4. Glatzel, H.; Ashworth, D.; Bajuk, D.; Bjork, M.; Bremer, M.; Cordier, M.; Cummings, K.; Girard, L.; Goldstein, M.; Gullikson, E.; et al. Projection optics for EUVL micro-field exposure tools with 0.5 NA. Proc. SPIE 2014, 9048, 90481K. [Google Scholar] [CrossRef]
  5. Glatzel, H.; Ashworth, D.; Bremer, M.; Chin, R.; Cummings, K.; Girard, L.; Goldstein, M.; Gullikson, E.; Hudyma, R.; Kennon, J.; et al. Projection optics for extreme ultraviolet lithography (EUVL) micro-field exposure tools (METs) with a numerical aperture of 0.5. Proc. SPIE 2013, 8679, 867917. [Google Scholar] [CrossRef] [Green Version]
  6. Li, M.; Wu, J.; Wu, Y.; Xu, Y.; Zhang, D. A review on the fabrication technology of X-ray reflector. Opto-Electron. Eng. 2020, 47, 1–12. (In Chinese) [Google Scholar]
  7. Deng, W.H.; Jin, H.M.; Chen, X.H.; Zhong, B.; Hou, J.; Li, A.Q. Optimization of IBF parameters based on adaptive tool-path algorithm. Proc. SPIE 2018, 10710, 107102W. [Google Scholar] [CrossRef]
  8. Hänsel, T.; Nickel, A.; Schindler, A. Ion beam figuring of strongly curved surfaces with a (x, y, z) linear three-axes system. In Frontiers in Optics 2008/Laser Science XXIV/Plasmonics and Metamaterials/Optical Fabrication and Testing; OSA Technical Digest (CD); Optical Society of America: Washington, DC, USA, 2008; p. JWD6. [Google Scholar]
  9. Mühlig, C.; Bublitz, S.; Feldkamp, R.; Bernitzki, H. Effect of ion beam figuring and subsequent antireflective coating deposition on the surface absorption of CaF_2 at 193 nm. Appl. Opt. 2016, 56, C91. [Google Scholar] [CrossRef]
  10. Tang, W.; Deng, W.; Li, R.; Zheng, L.; Zhang, X. Correction of removal function of ion beam figuring highly steep off-axis asphere. Opt. Precision Eng. 2015, 23, 1572–1579. (In Chinese) [Google Scholar] [CrossRef]
  11. Hu, H.; Qi, E.; Luo, X.; Zhang, X.; Xue, D. Rapid fabrication strategy for Ø1.5m off-axis parabolic parts using com-puter-controlled optical surfacing. Appl. Opt. 2015, 57, F37–F43. [Google Scholar] [CrossRef]
  12. Wu, J.F.; Lu, Z.W.; Zhang, H.X.; Wang, T.S. Dwell time algorithm in ion beam figuring. Appl. Opt. 2009, 48, 3930–3937. [Google Scholar] [CrossRef]
  13. Yin, X.; Deng, W.; Tang, W.; Zhang, B.; Xue, D.; Zhang, F.; Zhang, X. Ion beam figuring approach for thermally sensitive space optics. Appl. Opt. 2016, 55, 8049–8055. [Google Scholar] [CrossRef]
  14. Wang, T.; Huang, L.; Vescovi, M.; Kuhne, D.; Tayabaly, K.; Bouet, N.; Idir, M. Study on an effective one-dimensional ion-beam figuring method. Opt. Express 2019, 27, 15368–15381. [Google Scholar] [CrossRef]
  15. Wang, T.; Huang, L.; Choi, H.; Vescovi, M.; Kuhne, D.; Zhu, Y.; Pullen, W.C.; Ke, X.; Kim, D.W.; Kemao, Q.; et al. RISE: Robust iterative surface extension for sub-nanometer X-ray mirror fabrication. Opt. Express 2021, 29, 15114–15132. [Google Scholar] [CrossRef]
  16. Wang, T.; Huang, L.; Vescovi, M.; Kuhne, D.; Zhu, Y.; Negi, V.S.; Zhang, Z.; Wang, C.; Ke, X.; Choi, H.; et al. Universal dwell time optimization for deterministic optics fabrication. Opt. Express 2021, 29, 38737. [Google Scholar] [CrossRef]
  17. Zhou, L.; Idir, M.; Bouet, N.; Kaznatcheev, K.; Huang, L.; Vescovi, M.; Dai, Y.; Li, S. One-dimensional ion-beam figuring for grazing-incidence reflective optics. J. Synchrotron Radiat. 2016, 23, 182–186. [Google Scholar] [CrossRef]
  18. Schindler, A.; Hänsel, T.; Frost, F.; Fechner, R.; Seidenkranz, G.; Nickel, A.; Thomas, H.; Neumann, H.; Hirsch, D.; Schwabe, R.; et al. Ion Beam Finishing Technology for High Precision Optics Production. In Optical Fabrication and Testing; Sawchuk, A., Ed.; OSA Trends in Optics and Photonics Series; Optical Society of America: Washington, DC, USA, 2002; Volume 76, p. OTuB5. [Google Scholar]
  19. Geyl, R.; Rolland, E.; Rinchet, A. Large optics ion figuring. Proc. SPIE 1999, 3739, 161–166. [Google Scholar] [CrossRef]
  20. Arnold, T.; Böhm, G.; Fechner, R.; Meister, J.; Nickel, A.; Frost, F.; Hänsel, T.; Schindler, A. Ultra-precision surface finishing by ion beam and plasma jet techniques—Status and outlook. Nucl. Instruments Methods Phys. Res. Sect. A Accel. Spectrometers Detect. Assoc. Equip. 2010, 616, 147–156. [Google Scholar] [CrossRef]
  21. Arnold, T.; Böhm, G.; Paetzelt, H.; Pietag, F. Ion beam and plasma jet based methods in ultra-precision optics manufac-turing. Proc. SPIE 2015, 9442, 944204. [Google Scholar]
  22. Li, Y.; Takino, H.; Frost, F. Ion beam planarization of diamond turned surfaces with various roughness profiles. Opt. Express 2017, 25, 7828–7838. [Google Scholar] [CrossRef]
  23. Uzawa, S.; Kubo, H.; Miwa, Y.; Tsuji, T.; Morishima, H. Path to the HVM in EUVL through the development and evaluation of the SFET. Proc. SPIE 2007, 6517, 651708. [Google Scholar] [CrossRef]
  24. Murakami, K.; Oshino, T.; Kondo, H.; Chiba, H.; Komatsuda, H.; Nomura, K.; Iwata, H. Development of optics for EUV lithography tools. Proc. SPIE 2007, 6517, 65170J. [Google Scholar] [CrossRef]
  25. Miura, T.; Murakami, K.; Suzuki, K.; Kohama, Y.; Ohkubo, Y.; Asami, T. Nikon EUVL development progress summary. Proc. SPIE 2006, 6151, 615105. [Google Scholar] [CrossRef]
  26. Deng, W.-J.; Yin, X.; Tang, W.; Xue, D.; Zhang, X. Research on ion beam figuring system with five-axis hybrid mechanism for complex optical surface. Proc. SPIE 2019, 10838, 108380L. [Google Scholar] [CrossRef]
  27. Shi, B.; Dai, Y.; Zhou, L. Analysis on Positioning Accuracy for Ion Beam Figuring. Aviat. Precis. Manuf. Technol. 2011, 47, 9–13. (In Chinese) [Google Scholar]
  28. Yang, B.; Xie, X.; Zhou, L.; Hu, H. Design of a large five-axis ultra-precision ion beam figuring machine: Structure opti-mization and dynamic performance analysis. Int. J. Adv. Des. Manuf. Technol. 2017, 92, 3413–3424. [Google Scholar] [CrossRef]
  29. Xu, M.; Dai, Y.; Xie, X.; Zhou, L.; Liao, W. Structure optimization and fabricating capability analysis of an ion-beam machine for a subnanometer optical surface. Appl. Opt. 2015, 54, 8055–8061. [Google Scholar] [CrossRef]
  30. Liao, W.; Dai, Y.; Xie, X.; Zhou, L.; Yuan, Z. Corrective capability analysis and machining error control in ion beam figuring of high-precision optical mirrors. Opt. Eng. 2012, 51, 033402. [Google Scholar] [CrossRef]
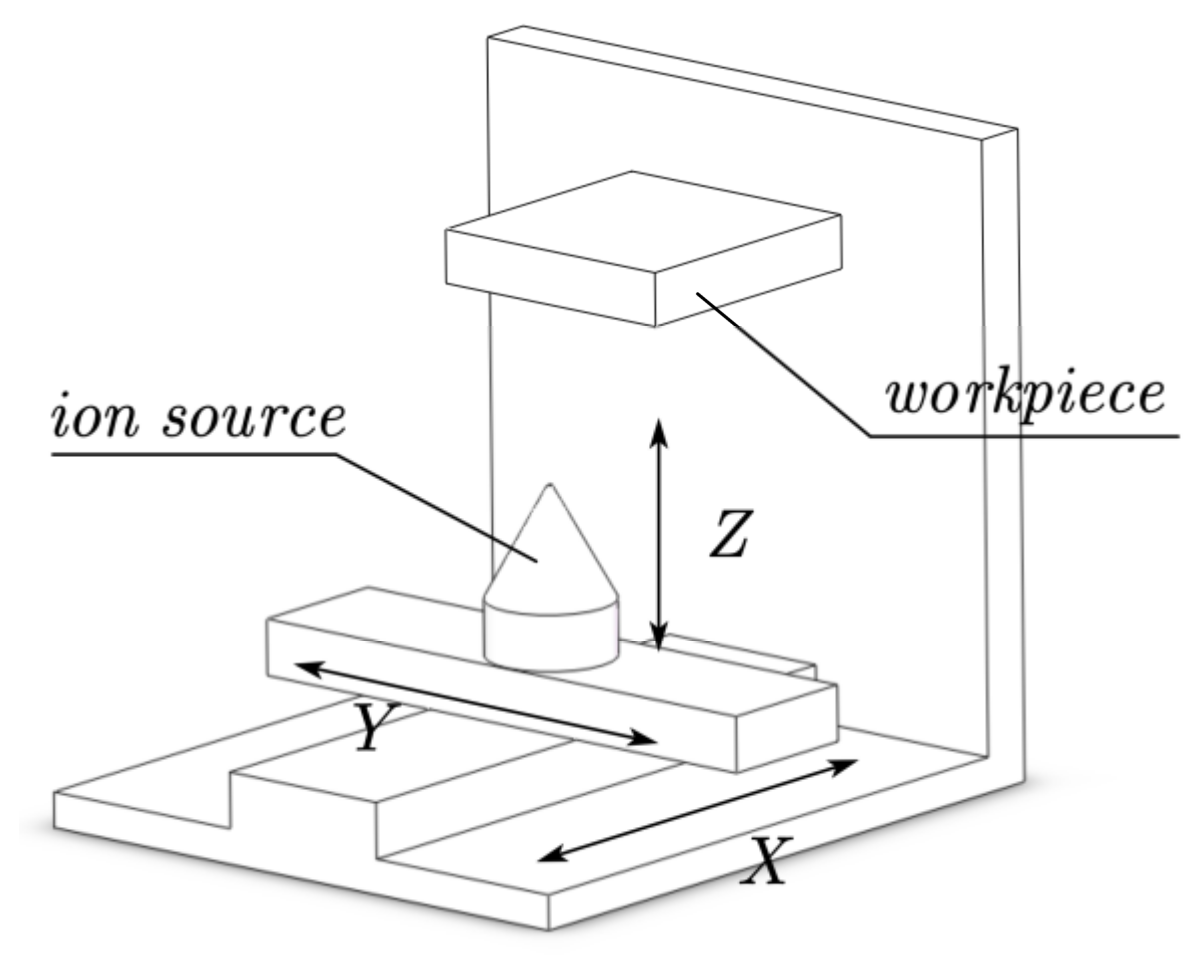
Figure 1. Three-axis IBF machine tools.
Photonics 09 00839 g001
Figure 2. The grating scanning path for IBF processing.
Photonics 09 00839 g002
Figure 3. The speed residence method to control residence time.
Photonics 09 00839 g003
Figure 4. Dwell time error during: (a) acceleration process; (b) deceleration process.
Photonics 09 00839 g004
Figure 5. The dwell time error when the speed fluctuation between adjacent speed control points is small (a), and large (b).
Photonics 09 00839 g005
Figure 6. The K values with σf and the fitting curve.
Photonics 09 00839 g006
Figure 7. A typical surface figure that can be figured to sub−nanometer precision: initial surface figure (a), and the filtered surface figure component with fc = 0.2 mm−1 (b).
Photonics 09 00839 g007
Figure 8. The dynamic performance requirement with the surface figure error frequency (a), and the surface figure error amplitude (b).
Photonics 09 00839 g008
Figure 9. Dynamic performance requirement with the surface figure error frequency (a), the steepness of the surface (b), and the scanning spacing (c).
Photonics 09 00839 g009
Figure 10. Parameters of the simulation: surface figure error (a), and the removal function (b).
Photonics 09 00839 g010
Figure 11. Simulation residual error of the case of no angular error (a), the case of 1° angle error (b), and the case of 10′ angle error (c).
Photonics 09 00839 g011
Figure 12. Positioning accuracy requirements for surface errors of various amplitudes and wavelengths.
Photonics 09 00839 g012
Figure 13. Simulated residual figuring error ignoring (a) and considering (b) the additional angle and target distance errors.
Photonics 09 00839 g013
Figure 14. Residual error caused by angle error.
Photonics 09 00839 g014
Figure 15. The measurement setup for measuring the positioning error of IBF700.
Photonics 09 00839 g015
Figure 16. The initial surface figure of the given surface.
Photonics 09 00839 g016
Figure 17. Conditions and results of the simulation: (a) the removal function of the beam with 10 mm diameter, and (b) the residual error.
Photonics 09 00839 g017
Figure 18. The dynamic performance requirements (a) before process parameter optimization, and (b) after process parameter optimization, where the red line represents the dynamic performance of the y-axis of IBF700.
Photonics 09 00839 g018
Figure 19. Simulated figuring results of (a) the first iteration, (b) the second iteration, and (c) the third iteration.
Photonics 09 00839 g019
Figure 20. The practical processing setup using the 10 mm diameter beam.
Photonics 09 00839 g020
Figure 21. Practical figuring results of (a) the first iteration, (b) the second iteration, and (c) the third iteration.
Photonics 09 00839 g021
Table 1. Dynamic and static performance measurement results of IBF700.
Axis of Motionx-Axisy-Axisz-Axis
Positioning error (μm)52.7453.0437.71
Maximum acceleration (m·s−2)1.01.31.5
Publisher’s Note: MDPI stays neutral with regard to jurisdictional claims in published maps and institutional affiliations.