Article

Optical Spectral Approach to Breast Tissue Oxygen Saturation Analysis for Mastectomy Perioperative Control

by
Daniil M. Kustov
1,*,
Anna A. Krivetskaya
1,2,
Tatiana A. Savelieva
1,2,
Andrey S. Gorbunov
3,
Elena P. Kashirina
3,
Sergey S. Kharnas
3,
Vladimir V. Levkin
3,
Vitaly I. Krasnovsky
3,
Ekaterina Yu. Anosova
3,
Daria V. Momatiuk
3,
Ramil S. Ibragimov
3 and
Victor B. Loschenov
1,2
1
Prokhorov General Physics Institute of the Russian Academy of Sciences, 119991 Moscow, Russia
2
Institute of Engineering Physics for Biomedicine, National Research Nuclear University MEPhI, 115409 Moscow, Russia
3
Department of Faculty Surgery No. 1, I.M. Sechenov First Moscow State Medical University, 119992 Moscow, Russia
*
Author to whom correspondence should be addressed.
Photonics 2022, 9(11), 821; https://doi.org/10.3390/photonics9110821
Submission received: 21 September 2022 / Revised: 19 October 2022 / Accepted: 31 October 2022 / Published: 2 November 2022

Abstract

:
The purpose of our research is to study the ability of the developed method of hemoglobin detection, based on the fiber-optic spectral analysis in visible region, to determine the level of blood supply to breast tissues before surgical treatment, intraoperatively and during observation of the patient in the postoperative period, when breast tissue is healing. The significant effect of subcutaneous adipose tissue on the shape of diffuse reflectance spectra due to scattering leads to a decrease in the accuracy of determining hemoglobin oxygen saturation and hemoglobin concentration from them. The variability of the subcutaneous adipose tissue layer is quite high, which also leads to a high variability of the spectra within a class of tissues that are in the same physiological state, which implies that the intraclass variability due to this factor should be assessed for a specific problem, not considering it random. For this purpose, in our work, we constructed optical phantoms simulating various thicknesses of the subcutaneous adipose tissue in order to determine the effect of its light scattering on the diffuse reflectance spectrum and to select the optimal configuration of optical fibers.

1. Introduction

The study of the state of tissue microcirculation is one of the most important problem in experimental and clinical medicine. When transplanting tissues or organs, it is necessary to control the blood flow in the transplant. A change in the blood supply to healthy breast tissues directly during and after surgery may be one of the signs of unsatisfactory results in surgical practice. One of the socially significant areas of such research is the control of tissue engraftment after mastectomy.
Breast cancer (BC) still remains an important problem, given the increase in the disease rate and the trend towards its detection at a younger age. Of all the cases of cancer in the world, it ranks second. In terms of mortality, breast cancer is about 6.6% of all cancer-related deaths and ranks first in incidence among women [1]. As we might expect, trends vary across countries of the world. Breast cancer is the most commonly diagnosed cancer in women in 154 out of 185 countries, and the leading cause of cancer death in more than 100 countries.
The main modern surgical treatment methods of breast cancer are resection or skin-sparing mastectomy, usually with simultaneous reconstruction with various implants or autografts. The use of neoadjuvant and adjuvant chemotherapy, radiation therapy almost always has a negative impact on the condition, including the tissues blood supply of the operated area of the mammary gland and complicates surgical interventions. Directly during surgical intervention, tissues and blood vessels are exposed to physical impact, so the risk of complications in case of inadequate control of intervention is high. Therefore, in some cases, postoperative complications are observed, such as wound infection (in 0.6–20.0% of cases), seroma formation (accumulation of tissue fluid in the subcutaneous tissue) (in 5.3–30.0%), tissue necrosis (in 4.3–25.4%), hematoma (in 3.2–9.7%), wound dehiscence (in 8.5–14.8%), capsular contracture (in 16.7%), lymphedema (in 6–30%) [2,3,4,5,6]. In general, complications of varying severity are observed in 26.5–39.0% of patients [3,4,5].
The need for timely detection of abnormalities in the state of tissues before surgery and during direct intervention is the key to successful treatment of the patient. The processes of regeneration of the operated area after surgery are accompanied by an acute or moderately acute inflammatory reaction. The study of the blood supply allows us to detect the development of inflammatory processes at an early stage and prevent unwanted complications.
The postoperative wound healing process can be divided into three phases. The first stage is inflammatory, during which there is an influx of leukocytes and epithelialization within 24–48 h. The second phase of healing is characterized by fibroblast proliferation. The rapid formation of collagen fibers begins from the fifth postoperative day and reaches its maximum volume by the seventeenth day. The third stage includes the process of strengthening the collagen network. It occurs with the replacement of previous fibers with stronger collagen and lasts for two years [7]. The complications described above are often observed during the first two phases of postoperative wound healing.
The generally accepted postoperative monitoring methods of patients undergoing breast surgery are ultrasound, magnetic resonance imaging (MRI) and mammography [8,9]. But the focus of these methods is, as a rule, to identify relapses and are carried out no earlier than the third stage of wound healing. However, the likelihood of recurrence is higher in patients who experienced postoperative complications during wound healing in the early postoperative period [10].
Ultrasound with the use of duplex mapping does not always allow a reliable assessment of the blood supply to the integumentary tissues during the preoperative examination and in the postoperative period. In some cases, it is possible to use intraoperative fluorescein angiography using the indocyanine green photosensitizer (ICG) [11] and the SPY imaging system [12] to assess the blood supply to the formed skin-fat flaps. Another promising approach is to use hyperspectral imaging to acquire spectral data across the entire field of view [13]. The Maastricht team is currently piloting the effectiveness of perioperative hyperspectral imaging to assess perfusion of the post-mastectomy skin flap and the deep inferior epigastric perforators (DIEP) flap in immediate autologous breast reconstruction [14].
As we can see, in medical practice exist the need for method that allows assessing the state of tissues at all stages of surgical treatment: from deciding on the method of execution to assessing the results of surgical intervention.
Tissue oxygen saturation (StO 2 ) is an important parameter influencing the possibility of postoperative complications [14,15]. In this paper, to assess the degree of oxygen saturation of hemoglobin and blood circulation, we propose to use a method based on the analysis of the diffuse reflectance signal when the object of study is exposed to light irradiation. Its advantages are the possibility of quantitative characteristics, minimally invasiveness, painlessness, in addition, this method of measurement is non-ionizing. Thus, by determining the level of saturation of the region of interest, it is possible to control all stages of the biological tissue healing.
A number of studies are currently being carried out in this direction. In the near infrared (NIR) range was shown the possibility of early detection of vascular disorders of the DIEP flap using non-invasive tissue oximetry [16,17]. The mentioned approaches based on hyperspectral imaging or near-IR saturation analysis have both obvious advantages and disadvantages. The hyperspectral image makes it possible to analyze the entire field of view simultaneously, but its spatial resolution is limited by the size of the light scattering spot in the examined tissues. NIR spectroscopy provides greater probing depth than visible spectroscopy by using a biological transparency window, but this dominance of scattering over absorption also limits spatial resolution.
The purpose of our research is to study the ability of the developed method of hemoglobin detection, based on the fiber-optic spectral analysis in visible region, to determine the level of blood supply to breast tissues before surgical treatment, intraoperatively and during observation of the patient in the postoperative period, when breast tissue is healing. The significant effect of subcutaneous adipose tissue on the shape of diffuse reflectance spectra due to scattering [18] leads to a decrease in the accuracy of determining hemoglobin oxygen saturation and hemoglobin concentration from them. The variability of the subcutaneous adipose tissue layer is quite high, which also leads to a high variability of the spectra within a class of tissues that are in the same physiological state [19], which implies that the intraclass variability due to this factor should be assessed for a specific problem, not considering it random. For this purpose, in our work, we constructed optical phantoms simulating the various subcutaneous adipose tissue thicknesses in order to determine the effect of its light scattering on the diffuse reflectance spectrum and to select the optimal configuration of optical fibers.

2. Materials and Methods

2.1. Spectroscopic Setup

The study of the blood flow nature of the mammary gland integumentary tissues was carried out by recording the spectra of back-scattered light. When light passes through biological tissue, light is absorbed by various chromophores (for example, bilirubin, collagen, melanin), including hemoglobin, which exists in two forms: oxygenated (oxyhemoglobin) and free form (reduced form of hemoglobin). Noteworthy, hemoglobin in the wavelength range of 500–600 nm exhibits a strong ability to absorb light. Due to its high content in tissues and vessels compared to other chromophores, hemoglobin acts as the main absorber of light in this range.
For various forms of hemoglobin in the wavelength range of 500–600 nm, the shape of the spectrum is different: oxyhemoglobin has two absorption peaks at wavelengths of 542 and 576 nm, reduced hemoglobin has an absorption maximum at a wavelength of 556 nm [20]. Thus, a change in tissue blood flow leads to a change in the concentration of one of the two forms of hemoglobin in the tissue at the time of measurement, and a change in the diffuse reflectance signal spectrum shape occurs. The developed method will allow recording the received signal before surgery, during surgery and in the postoperative period.
According to the diffusion approximation of radiative transfer theory, when photons enter an optically turbid medium, they diffusely propagate in the tissue in all directions, while some of them migrate from the emitting fiber to the receiving fiber. Interacting with inhomogeneities of the refractive index in the medium, due to the boundaries of tissues or cell structures, photons experience acts of absorption and scattering, and deviate by some angle from the previous direction of propagation. The most probable trajectory of photons migrating from the emitting fiber to the receiving one is a set of trajectories that form an arc-shaped area resembling a “banana” [21]. Photons migrating along the “banana” trajectory into the receiving fiber carry information about the tissue structure, including the concentration of oxyhemoglobin and reduced hemoglobin. The received signal allows to determine the nature of the blood supply in the tissue under study.
The study was carried out using a spectroscopic system (Figure 1) for measuring blood oxygenation in the visible range, which consisted of a broadband LED light source (Biospec) with sufficient uniformity in the range of 500–600 nm, a spectrometer (Biospec LESA-01, BioSpec Products, Inc., Bartlesville, OK, USA) with optical filters, an optical bundle for delivering light to the tissues under study, and a personal computer for processing and recording measurements. The PC was used to record backscattering spectra and process the obtained data.
A Y-shaped fiber bundle with diameter 1.8 mm including the shell was used, consisting of 7 fibers: one fiber for transmitting light to biological tissue and six fibers for receiving light. The diameter of each fiber was 250 µm. At the entrance to the spectrometer, the fibers were arranged in the form of a vertical line, forming a narrow aperture—the entrance slit of the spectrometer. At the distal end of the bundle used for contact with the object of study, the receiving fibers were located around the emitting. It needs to reduce the signal losses related with reflection on border of air-skin medium, when the end deviated from the perpendicular position when measuring saturation. When the optical fiber is in a perpendicular position and in full contact with the tissue (e.g., soft contact) no such optical signal losses are observed. The probe was placed with the biological tissue in soft contact to avoid the effect of compression of the upper layers of the tissue on the signal under study.
A detailed measurement algorithm is described in our previous article [22]. Experimentally, before measuring a biological object, the installation was calibrated. After calibration, the white light spectrum of the radiation source reflected from the reference sample was recorded. This spectrum will be compared with the spectrum of the received signal during the measurement process. BaSO 4 was used as a reference sample. Diffuse reflectance spectra were recorded relative to a reference sample with a reflectance coefficient close to n = 1 in the studied spectral range. During the measurement, the resulting spectrum is approximated by coefficients describing the scattering and absorption of the tissue. During post-processing, it is possible to change the degree of approximation to reduce the effect of distortion on the calculated values. The system was calibrated before each study day (patient).
To take control for adjusting the depth of tissue probing with light were used two optical fibers: a diagnostic fiber-optic probe and an end-emitting optical fiber with a diameter of 600 μ m. A fixed part was developed to provide a constant distance between the fibers and equal to 7 mm, which was chosen experimentally as the most suitable when examining from the surface of breast tissues.

2.2. Optical Phantoms

To determine the optimal parameters for registering a diffuse reflectance signal in vivo, taking into account the different thickness of subcutaneous fat, preliminary experiments were carried out to determine tissue oxygen saturation on optical phantoms of the mammary gland. Intralipid 10% diluted with distilled water to a concentration of 0.5% was used as a scattering medium for breast tissues. Whole blood of a volunteer mixed with heparin was used to simulate the absorbing medium. Silicone transparent tubes filled with blood were used to provide the structure of blood vessels.
The required concentration of intralipid 10% for an optical phantom in order to achieve similar optical properties with a biological object (subcutaneous fat) was determined experimentally. By increasing the concentration of intralipid (0.4%; 0.5%; 1%; 2.5%; 5%), the ratio of the intensity of the backscattered and transmitted laser radiation through the volume of the optical phantom and the sample was recorded. The wavelength of the laser radiation was 532 nm, which is in the saturation study range. This ratio was used to determine the concentration of intralipid, which would be sufficient to mimic the optical properties of subcutaneous fat.
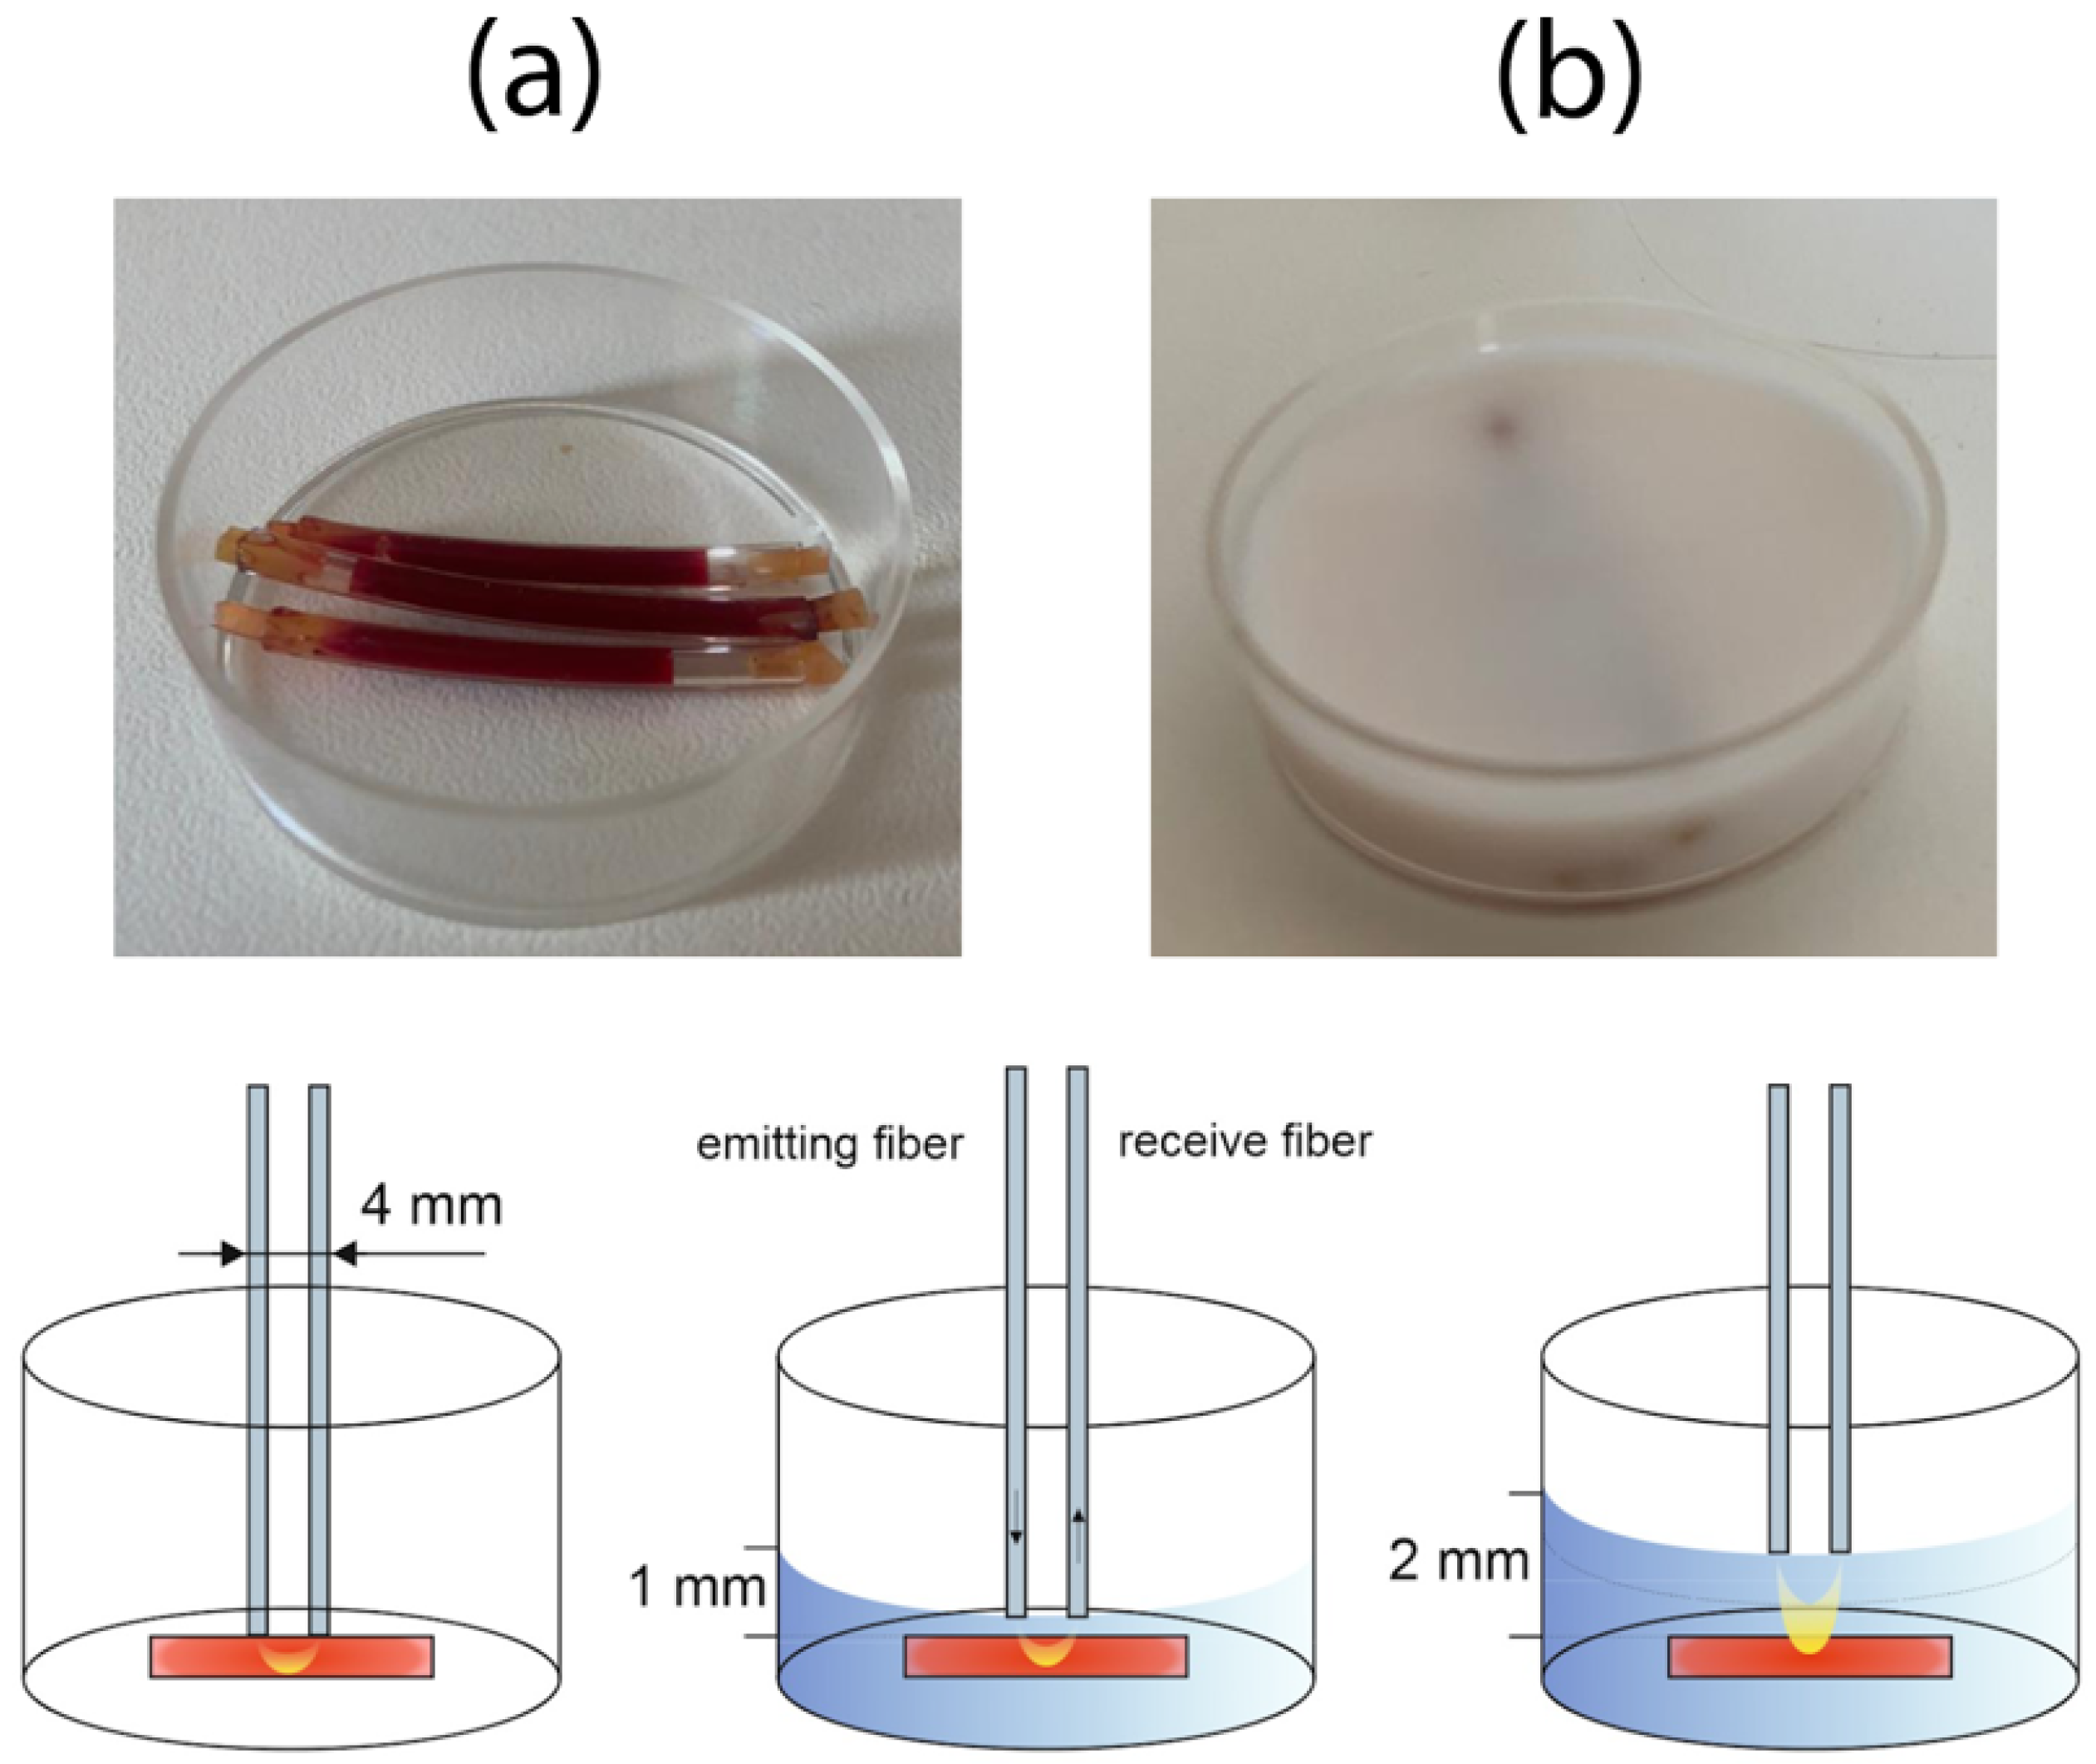
Figure 2 shows the scheme of experiment. To determine the available depth of penetration of light radiation, the order of the study was as follows: first, the saturation of the tube with blood was measured. Next, a container (Petri dish) was taken and tubes imitating vessels were placed on the bottom of the container with given geometric parameters of height 1.5 cm and diameter 9 cm. The tubes diameter was 2.5 mm, the wall thickness was 0.5 mm. Gradually, the volume of the container was filled with a scattering medium and the saturation was measured from the surface of the intralipid until the backscattered signal could be distinguished from the noise, and carried information about the absorption of the hemoglobin in the tubes. When the characteristic absorption peaks of the two forms of hemoglobin were no longer distinguishable, the measurements were stopped. To ensure a constant distance between the emitting and detecting fibers, a fixture was created that made it possible to maintain a distance of 0.4, 0.7, 0.9 cm between the centers of optical fibers.

2.3. Clinical Study

The study was carried out on the basis of the University Clinical Hospital No. 1, Clinic of Faculty Surgery No. 1 named after N.N. Burdenko of the First Moscow State Medical University named after I.M. Sechenov (Sechenov University). The study involved 14 patients who underwent skin-preserving surgical operations for breast cancer with preoperative, intraoperative and postoperative optical-spectral control of hemoglobin oxygen saturation. Patient’s age is from 28 to 81, all patients are women. Skin phenotype of the patients was chosen the same and corresponds to Fitzpatrick scale type II.
While maintaining the skin cover during the operation for simultaneous reconstruction, the existing subcutaneous blood supply to the skin-fat flaps and the area of the nipple-areolar complex (NAC) was assessed, since this blood flow is the only one when the gland tissue is removed. The thickness of the skin-fat layer obtained as a result of the operation was from 5 to 10 mm, and the NAC area was 2–3 mm. Thus, this method of assessing the blood supply allows to reliably assess the state of the tissues of the operated area.
The paper also presents data averaged over the sample. Since the light radiation during the measurement should not have a damaging effect on the object of study, we used the light with power density in the safe limit for living tissue, the value of which was 1–5 mW. When recording the spectra, the catheter was in soft contact with the surface of the mammary gland, the fibers were placed perpendicular to the surface of the skin. The key days for vascular monitoring during the study were the day before surgery, the day after surgery, day 3, day 5, and day 10. These days there is an active healing of breast tissue. If patients developed local hematomas after surgery, these points were assessed for changes in StO 2 in the postoperative period.
The thickness of the skin-fat flap was evaluated intraoperatively, while a change in the shape of the spectrum and the values of the intensity of the backscattered signal was observed depending on the layer thickness. Investigated biological tissues can be considered as a turbid medium, such as skin, blood vessels and blood, its optical properties are subject to description by the multiple scattering model. The difference in the morphological structure of adipose tissue affects the optical scattering parameters; the optical parameters of the biological tissue depend on the density of the location of fat cells in the tissue.

3. Results and Discussion

3.1. Determining the Depth of Probing the Studied Tissues with Light

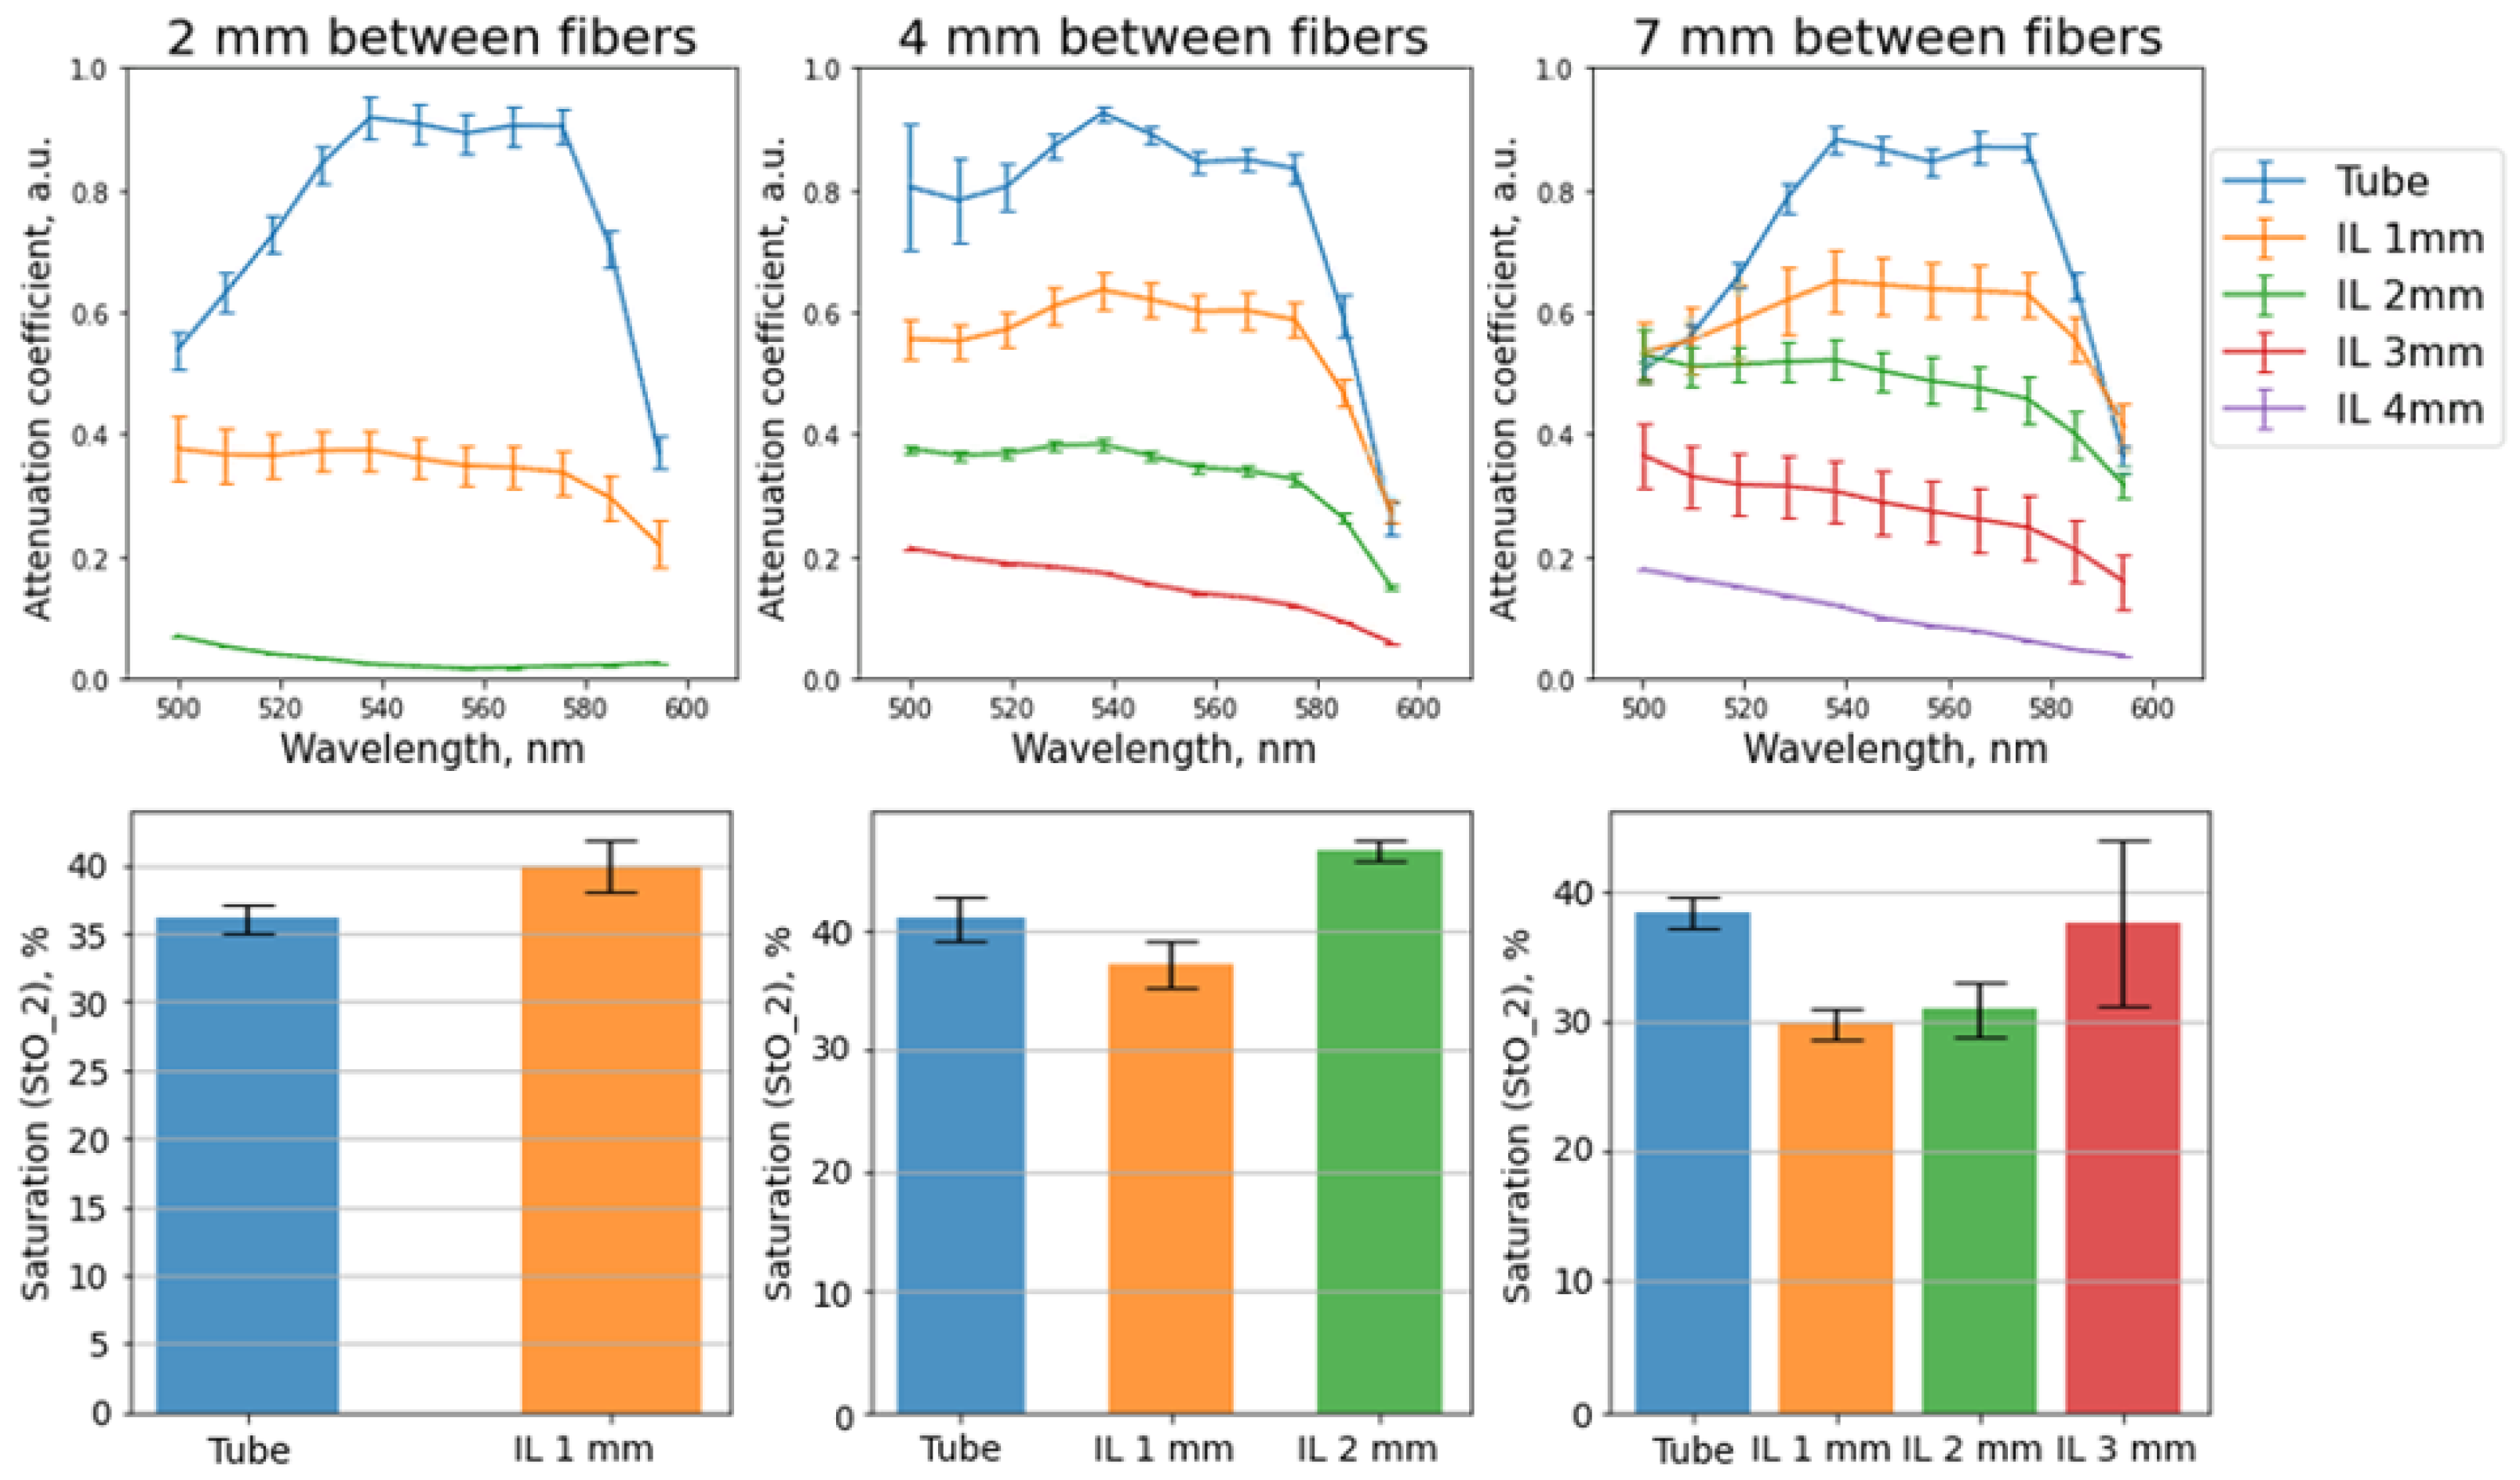
The spectra of the backscattered signal were recorded at a distance of 2, 4, 7 mm between the illumination and receiving fibers. The experiment was carried out on an optical phantom of the integumentary tissues of the mammary gland, which consisted of a Petri dish, at the bottom of which a silicone tube filled with blood was placed, imitating a blood vessel. The blood in the vessel was diluted by half with distilled water to avoid concentration absorption of the signal. At each stage of the experiment, a fat emulsion solution with a concentration of 0.4% was added to the container.
The measurements were carried out in turn for three values of the distance between the fibers. The spectra (Figure 3) were recorded first on the surface of the tube with blood, without fat emulsion, and then with the gradual addition of fat emulsion with a tube coverage step of 1 mm. The results of the measurements carried out are shown in the figure. The study was carried out until the moment when the backscattered signal was distinguishable against the background of the noise signal.
Most of the complications, such as the formation of a seroma or hematoma, are associated with damage to blood vessels. Breast tissue is covered by skin, which consists of three layers: epidermis, dermis and hypodermis (subcutaneous fatty tissue). Blood vessels are located in the dermis and hypodermis. The epidermis of human skin in the area under consideration has a thickness of 0.035–0.084 mm, the dermis is 1.97–3.00 mm, and the hypodermis is 0.40–1.10 mm. Based on the results of the experiment with phantoms, the maximum depth at which signal registration is possible is 3 mm [23,24]. Therefore, the depth of signal registration is comparable to the depth of complications formation.
The experiment with tubes was repeated 3 times. Average StO 2 values were used to plot the histogram, error bars indicate the difference between the minimum and maximum StO 2 values for each intralipid concentration.
We noted that in young and elderly women, tissue oxygen saturation of the mammary gland before surgery is different: in young women, StO 2 is higher than in the elderly. In the experiment, blood saturation was brought to the obtained tissue oxygen saturation of an elderly woman in a clinical study and corresponded to 30–40%.
Based on the data obtained, it is noticeable that with an increase in the distance between the fibers, the depth at which spectra can be recorded increases, and it depends on the thickness of the fat emulsion layer. According to the radiation transfer theory, the most probable propagation path of the detected light is in the region between the illuminating and receiving fibers, which narrows towards the ends of the fibers and expands in the central zone. With an increase in the distance between the fibers, the depth of the trajectory in the object under study increases, the photons passing along this trajectory carry information about the scattering and absorbing properties of the object.
It is also noticeable that with an increase in the layer of fat emulsion, the level of signal intensity decreases. This is due to an increase in the influence of scattering on the recorded signal by adding a scattering liquid (intralipid). The measurements were carried out at different exposure times for each distance between the illumination and receiving fibers. For 2, 4 and 7 mm it was equal to 100, 150 and 200 ms, respectively. Thus, with an increase in the distance between the fibers, the exposure time required for recording the spectra also increased. This can be explained by the fact that at a greater distance, the radiation must travel a longer path, in accordance with the Beer-Lambert law, more photons are absorbed and scattered. Therefore, higher exposition is required to accumulate the signal.

3.2. Changes in the Saturation of Breast Tissue

This study considers a group of 14 breast cancer patients who underwent various skin-saving breast resections with lymphadenectomy and a one-stage reconstructive component. In 11 patients, a skin-sparing mastectomy was performed with simultaneous reconstruction with an implant, while in 6 patients—with transposition of a de-epithelialized lateral skin flap into the axillary region, in 7 patients—with NAC transposition. Three patients underwent radical resection of the outer quadrants of the mammary gland and transposition of the de-epithelialized lateral skin flap into the axillary region.
The study of oxygenation was carried out at 4 symmetrical points on each side of the surgical incision according to the study protocol. For each point of each patient we did about 5 repetitions of measurements to 3 positions nearby in one point on skin. In 2 cases, patients underwent symmetrizing simultaneous operations on the contralateral mammary gland. Free NAC transplantation was performed in 4 cases using intraoperative preservation of the resected complex for 1 hour. When examining the NAC area, measurements were taken at 5 points on the inner edges of the areola and the nipple.
All patients in this study underwent preoperative, intraoperative and postoperative examinations, according to the protocol, on the next day after surgery, on days 3, 5 and 10 after surgery. Optical-spectral monitoring of hemoglobin oxygen saturation was used to assess the viability of the formed wound edges of the skin-fat flap at various skin incisions, the area of NAC and de-epithelialized flaps.
The study of tissues was carried out according to the study protocol at the corresponding points indicated in the Figure 4. The thickness of the investigated skin-fat flaps was 7–8 mm. The thickness of freely transplanted NAC tissues is 2–3 mm. At the same time, the tissues of the unoperated contralateral mammary gland were taken as the control area of measurement.
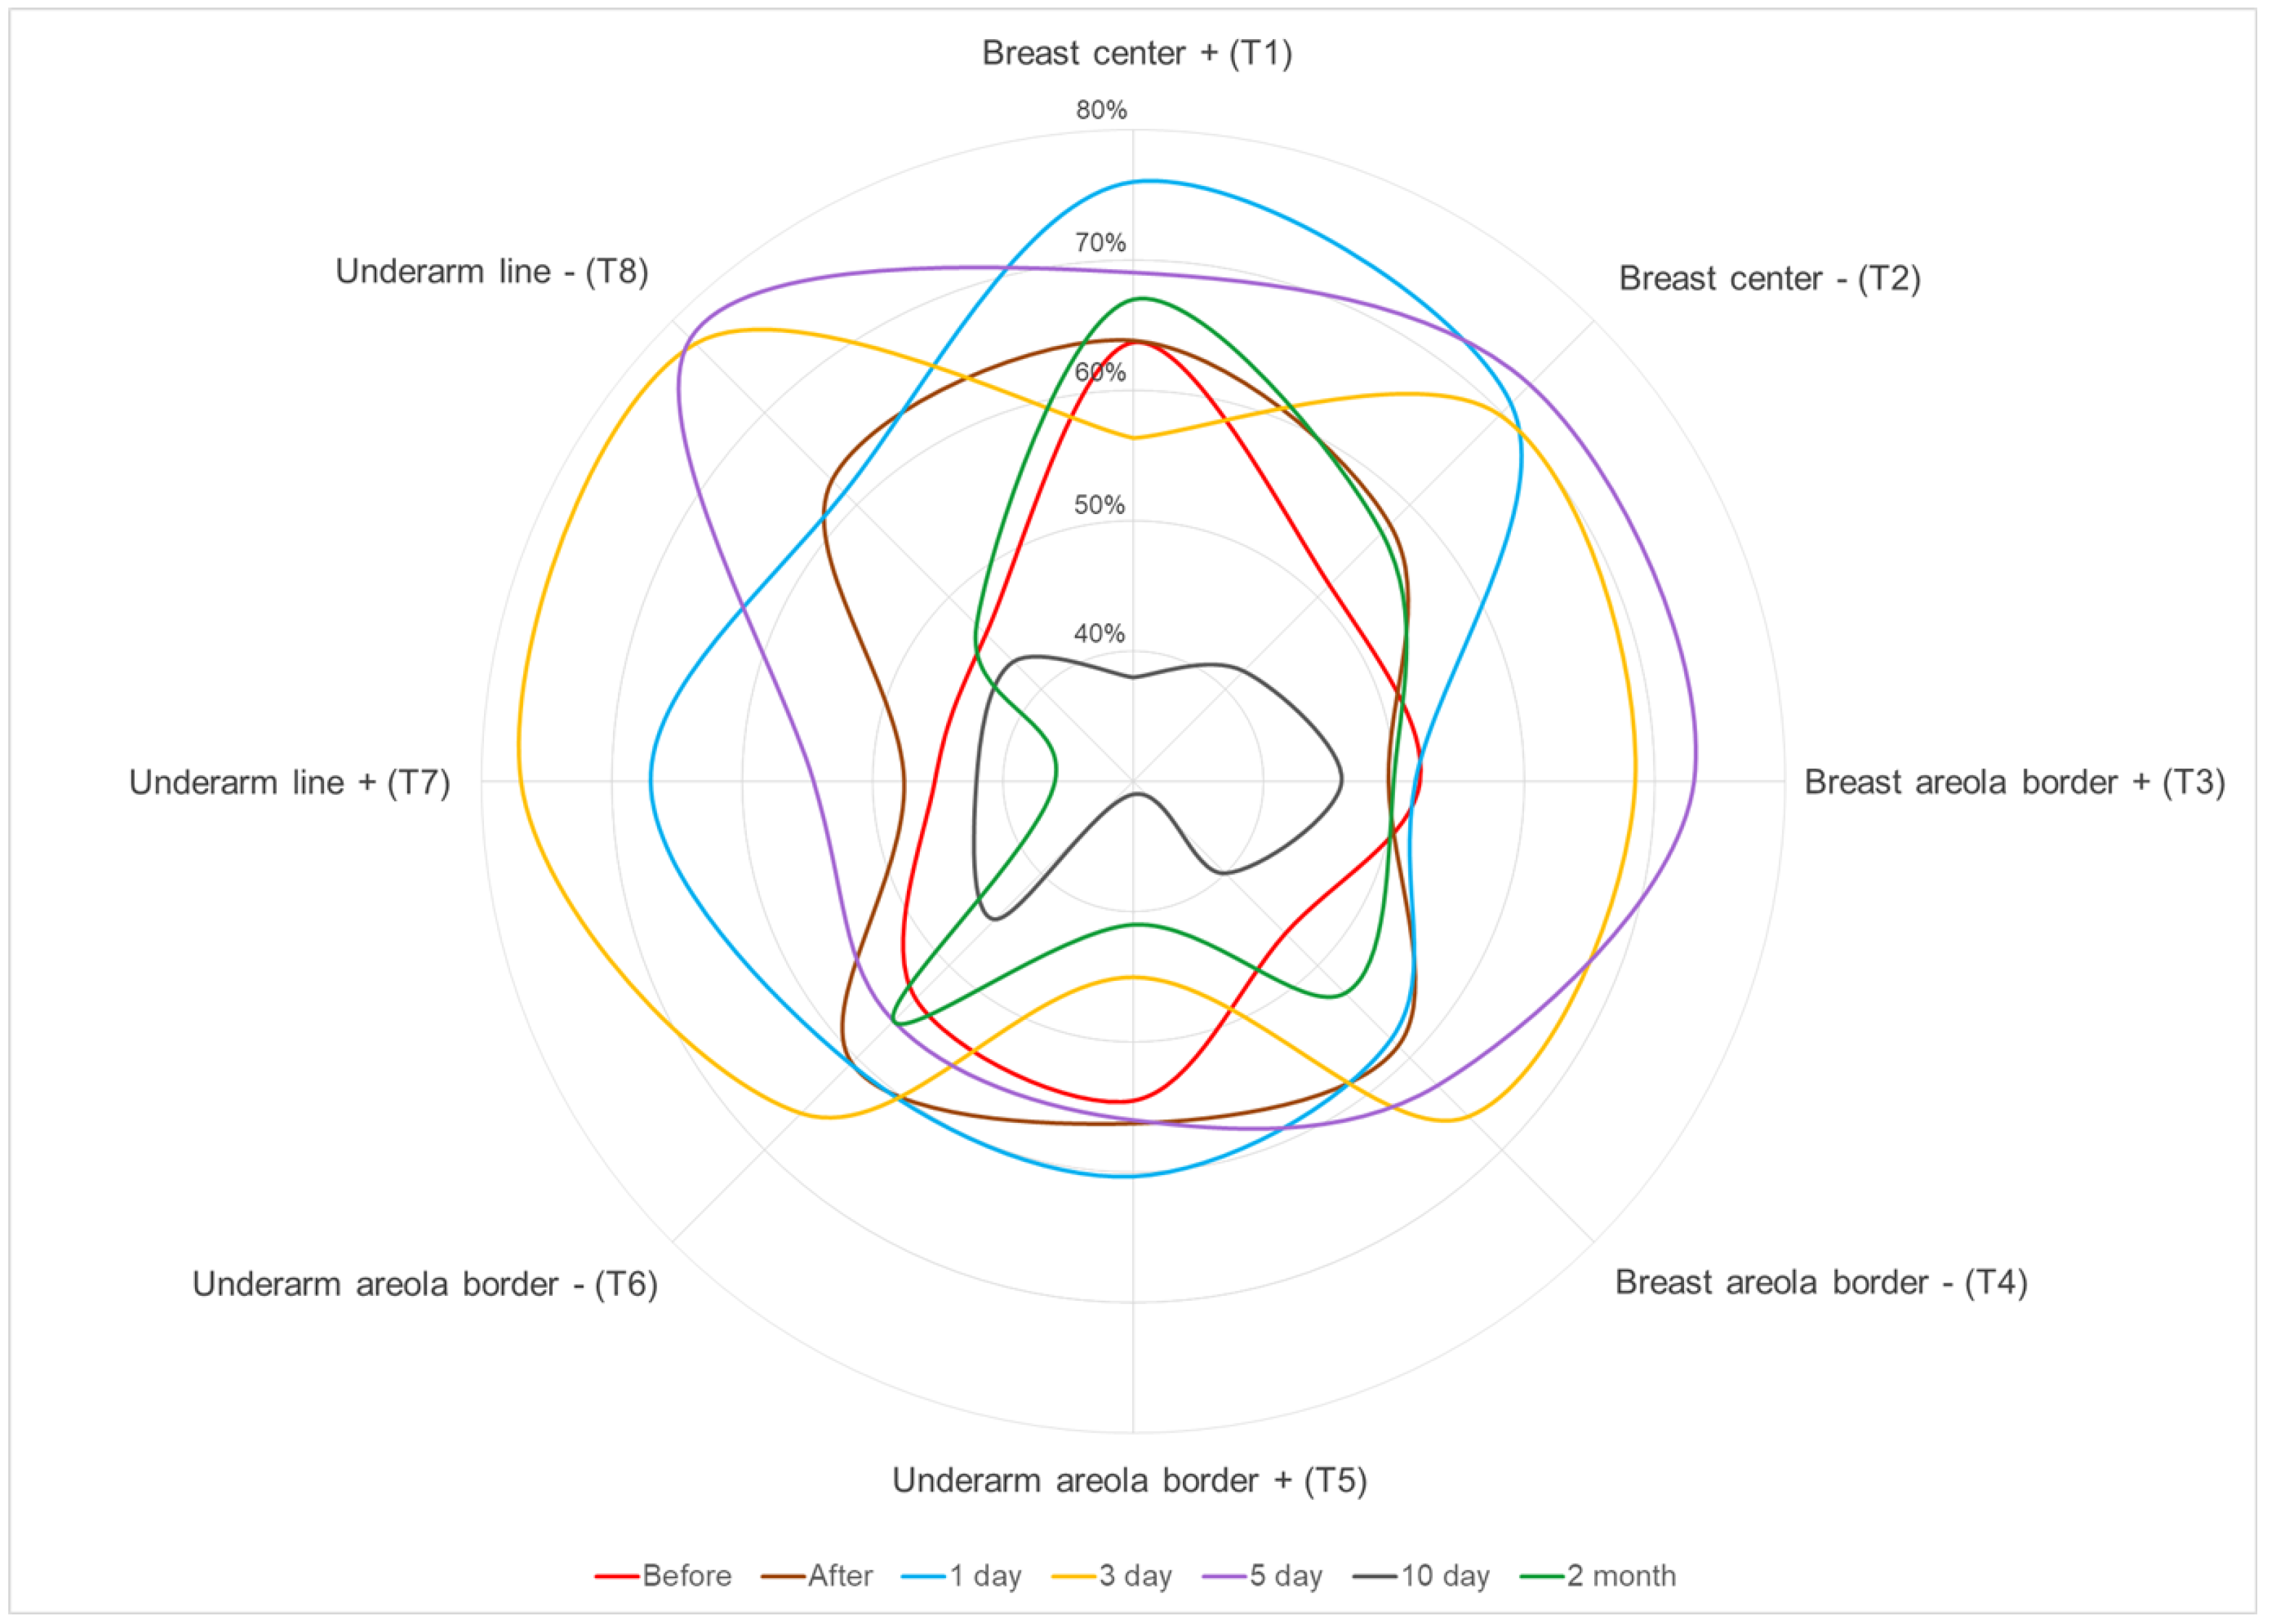
For the mammary gland, Figure 5 shows the dependence of the obtained StO 2 values for each test point in the polar coordinate system. It is noticeable that the blood supply for 3 days after surgery is the most intense. StO 2 values after 2 months after surgery correlate with values before surgery, which is a favorable factor for successful restoration of breast tissue as a result of the treatment.
In a dynamic study after surgery, the indicators of optical-spectral control of hemoglobin oxygen saturation were evaluated in comparison with preoperative values and values at symmetrical points in the region of the non-operated mammary gland (Figure 6). In the case of a significant decrease in indicators in combination with a visual assessment of the tissues under study, this method made it possible to determine the line of the necessary tissue resection directly during the operation. When the indicators of optical-spectral control changed in the postoperative period, a decision was made to prescribe additional local or systemic conservative therapy.
Measurement of tissue oxygen saturation of the de-epitalized flap was checked twice before the incision and after the formation of the de-epithelized flap. If the StO 2 value was close to the preoperative one, then we considered that the condition of good blood supply was met. The control was carried out from the incision to the border of the marking of the performed incision during de-epithelialization, and the backscattered signal spectra were recorded along the line of the flap cutting. In the case of the same and nearby saturation value, it was considered that the cut flap was viable and resection was not required.
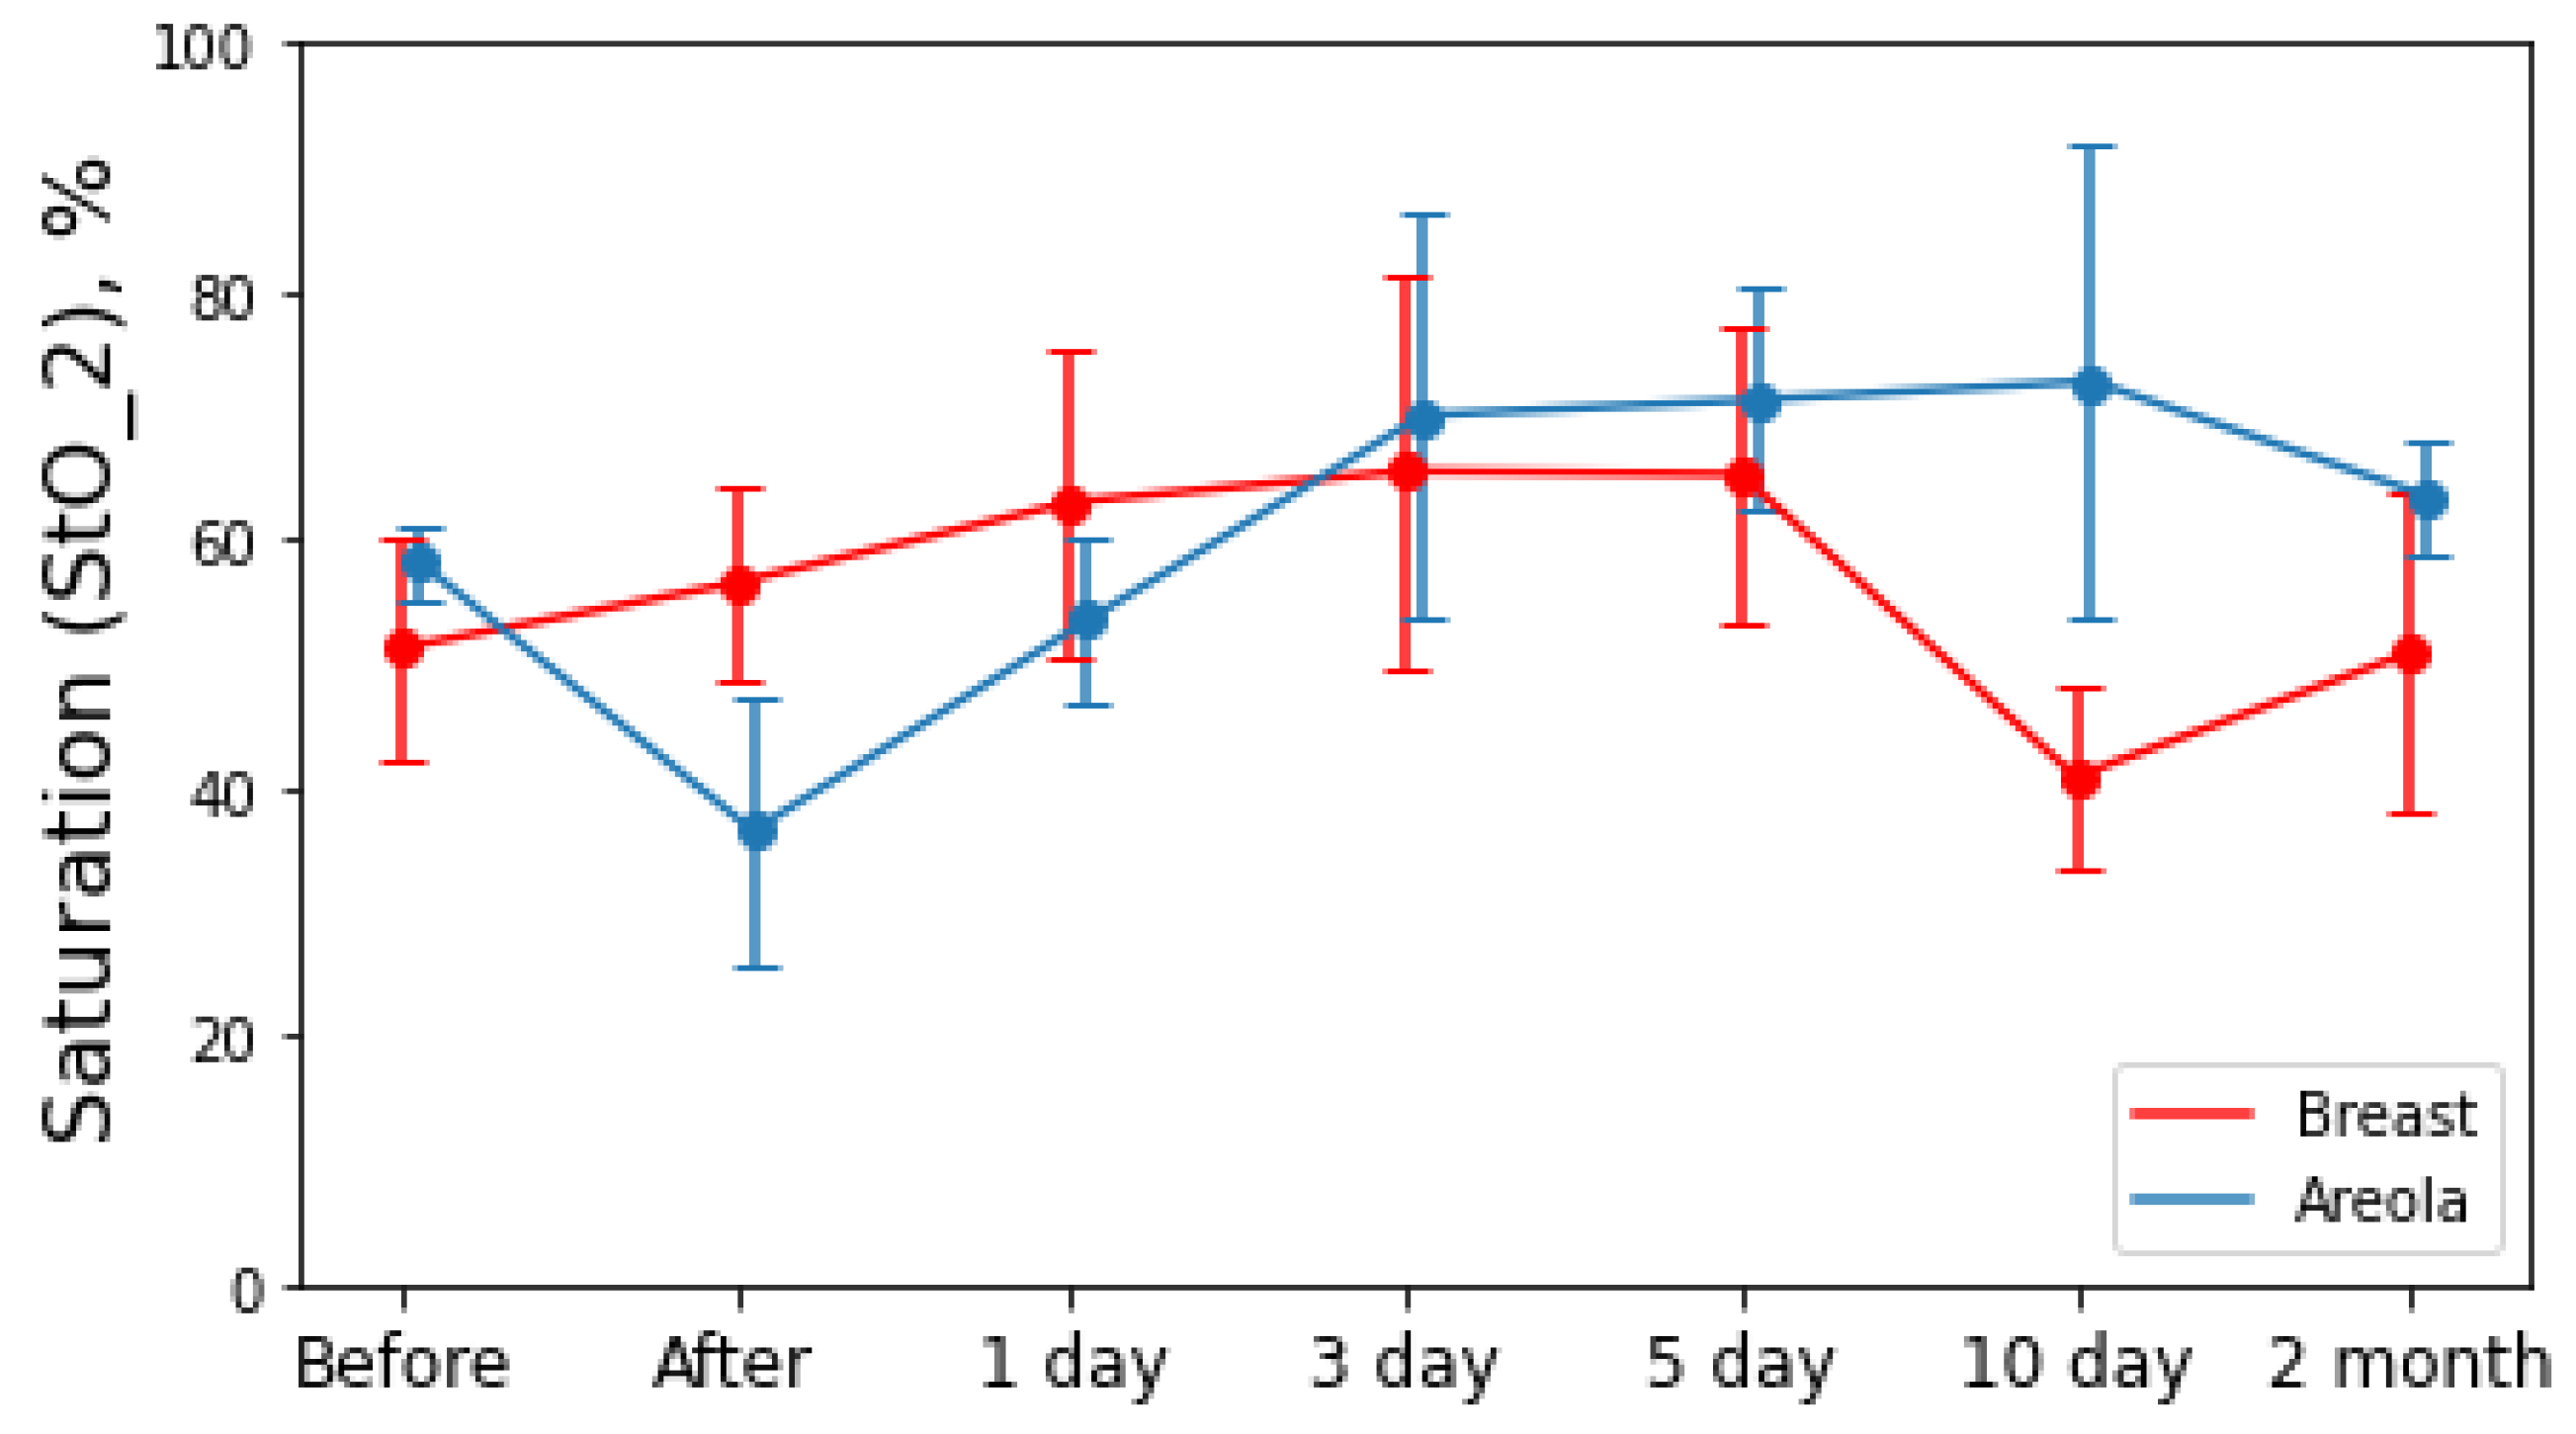
When examining the blood supply to the areola, it was noted that after the operation, a sharp decrease in blood supply was characteristic, which gradually increased and reached a maximum on the 3-rd and 10-th day. Skin flaps are characterized by a uniform increase in tissue oxygen saturation by day 5 (Figure 7). On day 10, in those patients with subcutaneous layer thickness less than 7 mm, a decrease in tissue oxygen saturation value was noted.
During the formation of skin flaps with a subcutaneous tissue thickness of less than 7–8 mm, by day 10, edema to the operated tissue was observed, since it was the cause of arterial blood flow disturbance due to squeezing of the vessels. In clinical practice, edema during operations on breast tissues may appear from 5 to 7–12 days as a reaction to the surgical treatment performed. After 2 months, saturation values in patients correlated with StO 2 values before surgery. In patients, the healing of biological tissues proceeded without the occurrence of serious disturbances throughout the postoperative period.
In the study of data samples for each research day, measurements averaged over all patients are dependent, since the same parameter was determined—saturation at certain points, but at different times relative to surgical intervention. StO 2 values averaged by 5–7 values of each diagnostic point. Accordingly, to conduct statistical analysis, it is necessary to use criteria such as the Wilcoxon test for pairwise comparison of each group of data and the Friedman test for a general comparison of all samples (Table 1).
Based on the calculations, it can be seen that between the measurements taken before surgery and on day 5 after it (Wilcoxon criterion W = 0 ), then after surgery and three days later ( W = 6 ) , on days 5 and 10 ( W = 4 ) , on day 5 and after 2 months ( W = 9 ) significant differences were found according to the Wilcoxon test with a significance level of p = 0.01 . In addition, statistical differences were confirmed for data groups measured before and 2 months after surgery ( W = 15 ) , after surgery and 1, 5 days after ( W = 11 ) , and 3 and 10 days ( W = 12 ) at a p = 0.05 . These conclusions were made by comparing the calculated values with the critical value of the Wilcoxon test, which, with a sample size of 12, is 17 at a significance level of p < 0.05 and 9 at p < 0.01 . Accordingly, in pairwise comparison of samples, in many cases there are statistical differences between groups of data.
Also, the Friedman criterion was calculated for a general comparison of all groups of data. Its value was determined to be χ F . 2 = 24.4 . The critical value of the Friedman criterion with a sample size of 12 is 24.7 at p = 0.01 , 21.9 at p = 0.025 , 19.7 at p = 0.005 . Accordingly, the analysis of the considered statistical criterion shows the existence of a statistical difference between all samples at a significance level of p < 0.025 . Thus, based on the statistical analysis, it can be concluded that there are significant differences between the measurements at different times regarding the surgical intervention performed on the research days indicated in this study.

4. Conclusions

The method of optical-spectral monitoring of hemoglobin oxygen saturation of breast tissues in the treatment of patients with breast cancer can allow us to count on improving the immediate results of surgical techniques, reducing the risk of postoperative complications due to timely adequate assessment of tissue blood flow. The advantages of this method, taking into account non-invasiveness, the possibility of intraoperative use, the absence of harmful factors inherent in the methods of radiation diagnostics, and lower cost, will allow us to recommend it for surgical practice.
The study made it possible to form protocols for assessing the viability of tissues applicable both directly during surgery and in the postoperative period in order to timely prescribe additional conservative treatment and predict healing in the operated area of the breast.
It is of interest to conduct further studies on breast tissue in patients who have undergone radiation therapy in order to select the optimal period for further reconstructive operations in order to reduce the number of stages of surgical treatment and obtain better cosmetic and therapeutic results. At the same time, the assessment of the state of the tissues of patients after radiation therapy is carried out on an outpatient basis within the framework of the research protocol currently being developed.

Author Contributions

Conceptualization, V.B.L. and T.A.S.; methodology, D.M.K.; software, D.M.K. and T.A.S.; validation, A.A.K., D.M.K. and T.A.S.; formal analysis, T.A.S. and V.B.L.; investigation, S.S.K., A.S.G., V.V.L. and V.I.K.; resources, E.P.K., E.Y.A., D.V.M., R.S.I.; data curation, D.M.K. and T.A.S.; writing—original draft preparation, D.M.K., T.A.S., A.A.K., V.V.L., A.S.G. and S.S.K.; writing—review and editing, D.M.K., T.A.S.; visualization, D.M.K.; supervision, V.B.L.; project administration, V.B.L. and T.A.S.; funding acquisition, V.B.L. All authors have read and agreed to the published version of the manuscript.

Funding

This work was supported by a Ministry of Science and Higher Education of the Russian Federation (agreement 075-15-2021-1343, 4 October 2021).

Institutional Review Board Statement

The study was conducted according to the guidelines of the Declaration of Helsinki and approved by the Institutional Review Board of I.M. Sechenov First Moscow State Medical University.

Informed Consent Statement

Informed consent was obtained from all subjects involved in the study.

Data Availability Statement

The data supporting the findings of this study are available within the article.

Conflicts of Interest

The authors declare no conflict of interest.

References

  1. Ahmad, A. Breast Cancer Metastasis and Drug Resistance: Challenges and Progress; Springer: Berlin/Heidelberg, Germany, 2019; Volume 1152. [Google Scholar]
  2. Rizvi, F.H.; Khan, M.K.; Almas, T.; Ullah, M.; Shafi, A.; Murad, M.F.; Ali, A.; Nadeem, F. Early Postoperative Outcomes after Surgery for Breast Cancer in a Developing Country. Cureus 2020, 12, e9941. [Google Scholar] [PubMed]
  3. Qin, Q.; Tan, Q.; Lian, B.; Mo, Q.; Huang, Z.; Wei, C. Postoperative outcomes of breast reconstruction after mastectomy: A retrospective study. Medicine 2018, 97, e9766. [Google Scholar] [CrossRef] [PubMed]
  4. Davies, K.; Allan, L.; Roblin, P.; Ross, D.; Farhadi, J. Factors affecting post-operative complications following skin sparing mastectomy with immediate breast reconstruction. Breast 2011, 20, 21–25. [Google Scholar] [CrossRef] [PubMed]
  5. Vitug, A.F.; Newman, L.A. Complications in breast surgery. Surg. Clin. N. Am. 2007, 87, 431–451. [Google Scholar] [CrossRef] [PubMed] [Green Version]
  6. Grobmyer, S.R.; Bland, K.I. Wound Care and Complications of Mastectomy. In The Breast; Elsevier: Amsterdam, The Netherlands, 2018; pp. 492–498. [Google Scholar]
  7. Surwit, E.; Tam, T. Postoperative Care; The Global Library of Womens Medicine: Carlisle, UK, 2008. [Google Scholar]
  8. Trop, I. Is There a Role for Imaging Surveillance after Mastectomy and Autologous Breast Reconstruction? Radiology 2018, 289, 49–55. [Google Scholar] [CrossRef] [PubMed] [Green Version]
  9. Graham, L.J.; Shupe, M.P.; Schneble, E.J.; Flynt, F.L.; Clemenshaw, M.N.; Kirkpatrick, A.D.; Gallagher, C.; Nissan, A.; Henry, L.; Stojadinovic, A.; et al. Current approaches and challenges in monitoring treatment responses in breast cancer. J. Cancer 2014, 5, 58. [Google Scholar] [CrossRef] [PubMed]
  10. Murthy, B.L.; Thomson, C.S.; Dodwell, D.; Shenoy, H.; Mikeljevic, J.S.; Forman, D.; Horgan, K. Postoperative wound complications and systemic recurrence in breast cancer. Br. J. Cancer 2007, 97, 1211–1217. [Google Scholar] [CrossRef] [PubMed] [Green Version]
  11. Pruimboom, T.; van Kuijk, S.M.; Qiu, S.S.; van den Bos, J.; Wieringa, F.P.; van der Hulst, R.R.; Schols, R.M. Optimizing indocyanine green fluorescence angiography in reconstructive flap surgery: A systematic review and ex vivi experiments. Surg. Innov. 2020, 27, 103–119. [Google Scholar] [CrossRef] [PubMed]
  12. Kühn, F.; Blohmer, J.U.; Karsten, M.M. Intraoperative indocyanine green fluorescence imaging in breast surgery. Arch. Gynecol. Obstet. 2020, 302, 463–472. [Google Scholar] [CrossRef] [PubMed]
  13. Kohler, L.H.; Köhler, H.; Kohler, S.; Langer, S.; Nuwayhid, R.; Gockel, I.; Spindler, N.; Osterhoff, G. Hyperspectral Imaging (HSI) as a new diagnostic tool in free flap monitoring for soft tissue reconstruction: A proof of concept study. BMC Surg. 2021, 21, 1–9. [Google Scholar] [CrossRef] [PubMed]
  14. Pruimboom, T.; Lindelauf, A.A.; Felli, E.; Sawor, J.H.; Deliaert, A.E.; van der Hulst, R.R.; Al-Taher, M.; Diana, M.; Schols, R.M. Perioperative Hyperspectral Imaging to Assess Mastectomy Skin Flap and DIEP Flap Perfusion in Immediate Autologous Breast Reconstruction: A Pilot Study. Diagnostics 2022, 12, 184. [Google Scholar] [CrossRef] [PubMed]
  15. Rao, R.; Saint-Cyr, M.; Ma, A.M.T.; Bowling, M.; Hatef, D.A.; Andrews, V.; Xie, X.J.; Zogakis, T.; Rohrich, R. Prediction of post-operative necrosis after mastectomy: A pilot study utilizing optical diffusion imaging spectroscopy. World J. Surg. Oncol. 2009, 7, 1–6. [Google Scholar] [CrossRef] [PubMed] [Green Version]
  16. Lindelauf, A.A.; Vranken, N.; Schols, R.M.; Bouman, E.A.; Weerwind, P.W.; van der Hulst, R.R. Exploring personalized postoperative non-invasive tissue oximetry in DIEP flap breast reconstruction. Eur. J. Plast. Surg. 2021, 45, 267–275. [Google Scholar] [CrossRef]
  17. Salgarello, M.; Pagliara, D.; Rossi, M.; Visconti, G.; Barone-Adesi, L. Postoperative monitoring of free DIEP flap in breast reconstruction with near-infrared spectroscopy: Variables affecting the regional oxygen saturation. J. Reconstr. Microsurg. 2018, 34, 383–388. [Google Scholar] [CrossRef] [PubMed]
  18. Bashkatov, A.N.; Genina, E.A.; Kochubey, V.I.; Tuchin, V.V. Optical properties of human skin, subcutaneous and mucous tissues in the wavelength range from 400 to 2000 nm. J. Phys. D Appl. Phys. 2005, 38, 2543. [Google Scholar] [CrossRef]
  19. Fanjul-Vélez, F.; Arévalo-Díaz, L.; Arce-Diego, J.L. Intra-class variability in diffuse reflectance spectroscopy: Application to porcine adipose tissue. Biomed. Opt. Express 2018, 9, 2297–2303. [Google Scholar] [CrossRef] [PubMed] [Green Version]
  20. Prahl, S. Optical Absorption of Hemoglobin. 1999. Available online: https://omlc.org/spectra/hemoglobin/ (accessed on 20 October 2022).
  21. Kholodtsova, M.N.; Grachev, P.V.; Savelieva, T.A.; Kalyagina, N.A.; Blondel, W.; Loschenov, V.B. Scattered and fluorescent photon track reconstruction in a biological tissue. Int. J. Photoenergy 2014, 2014, 517510. [Google Scholar] [CrossRef]
  22. Kustov, D.M.; Savelieva, T.A.; Mironov, T.A.; Kharnas, S.S.; Levkin, V.V.; Gorbunov, A.S.; Shiryaev, A.A.; Loschenov, V.B. Intraoperative Control of Hemoglobin Oxygen Saturation in the Intestinal Wall during Anastomosis Surgery. Photonics 2021, 8, 427. [Google Scholar] [CrossRef]
  23. Stroev, V.M.; Almas, H.F. Multispectral method for detecting subcutaneous formations. Young Sci. Conf. 2012, 12, 104–107. [Google Scholar]
  24. Oltulu, P.; Ince, B.; Kokbudak, N.; Findik, S.; Kilinc, F. Measurement of epidermis, dermis, and total skin thicknesses from six different body regions with a new ethical histometric technique. Turk. J. Plast. Surg. 2018, 26, 56. [Google Scholar]
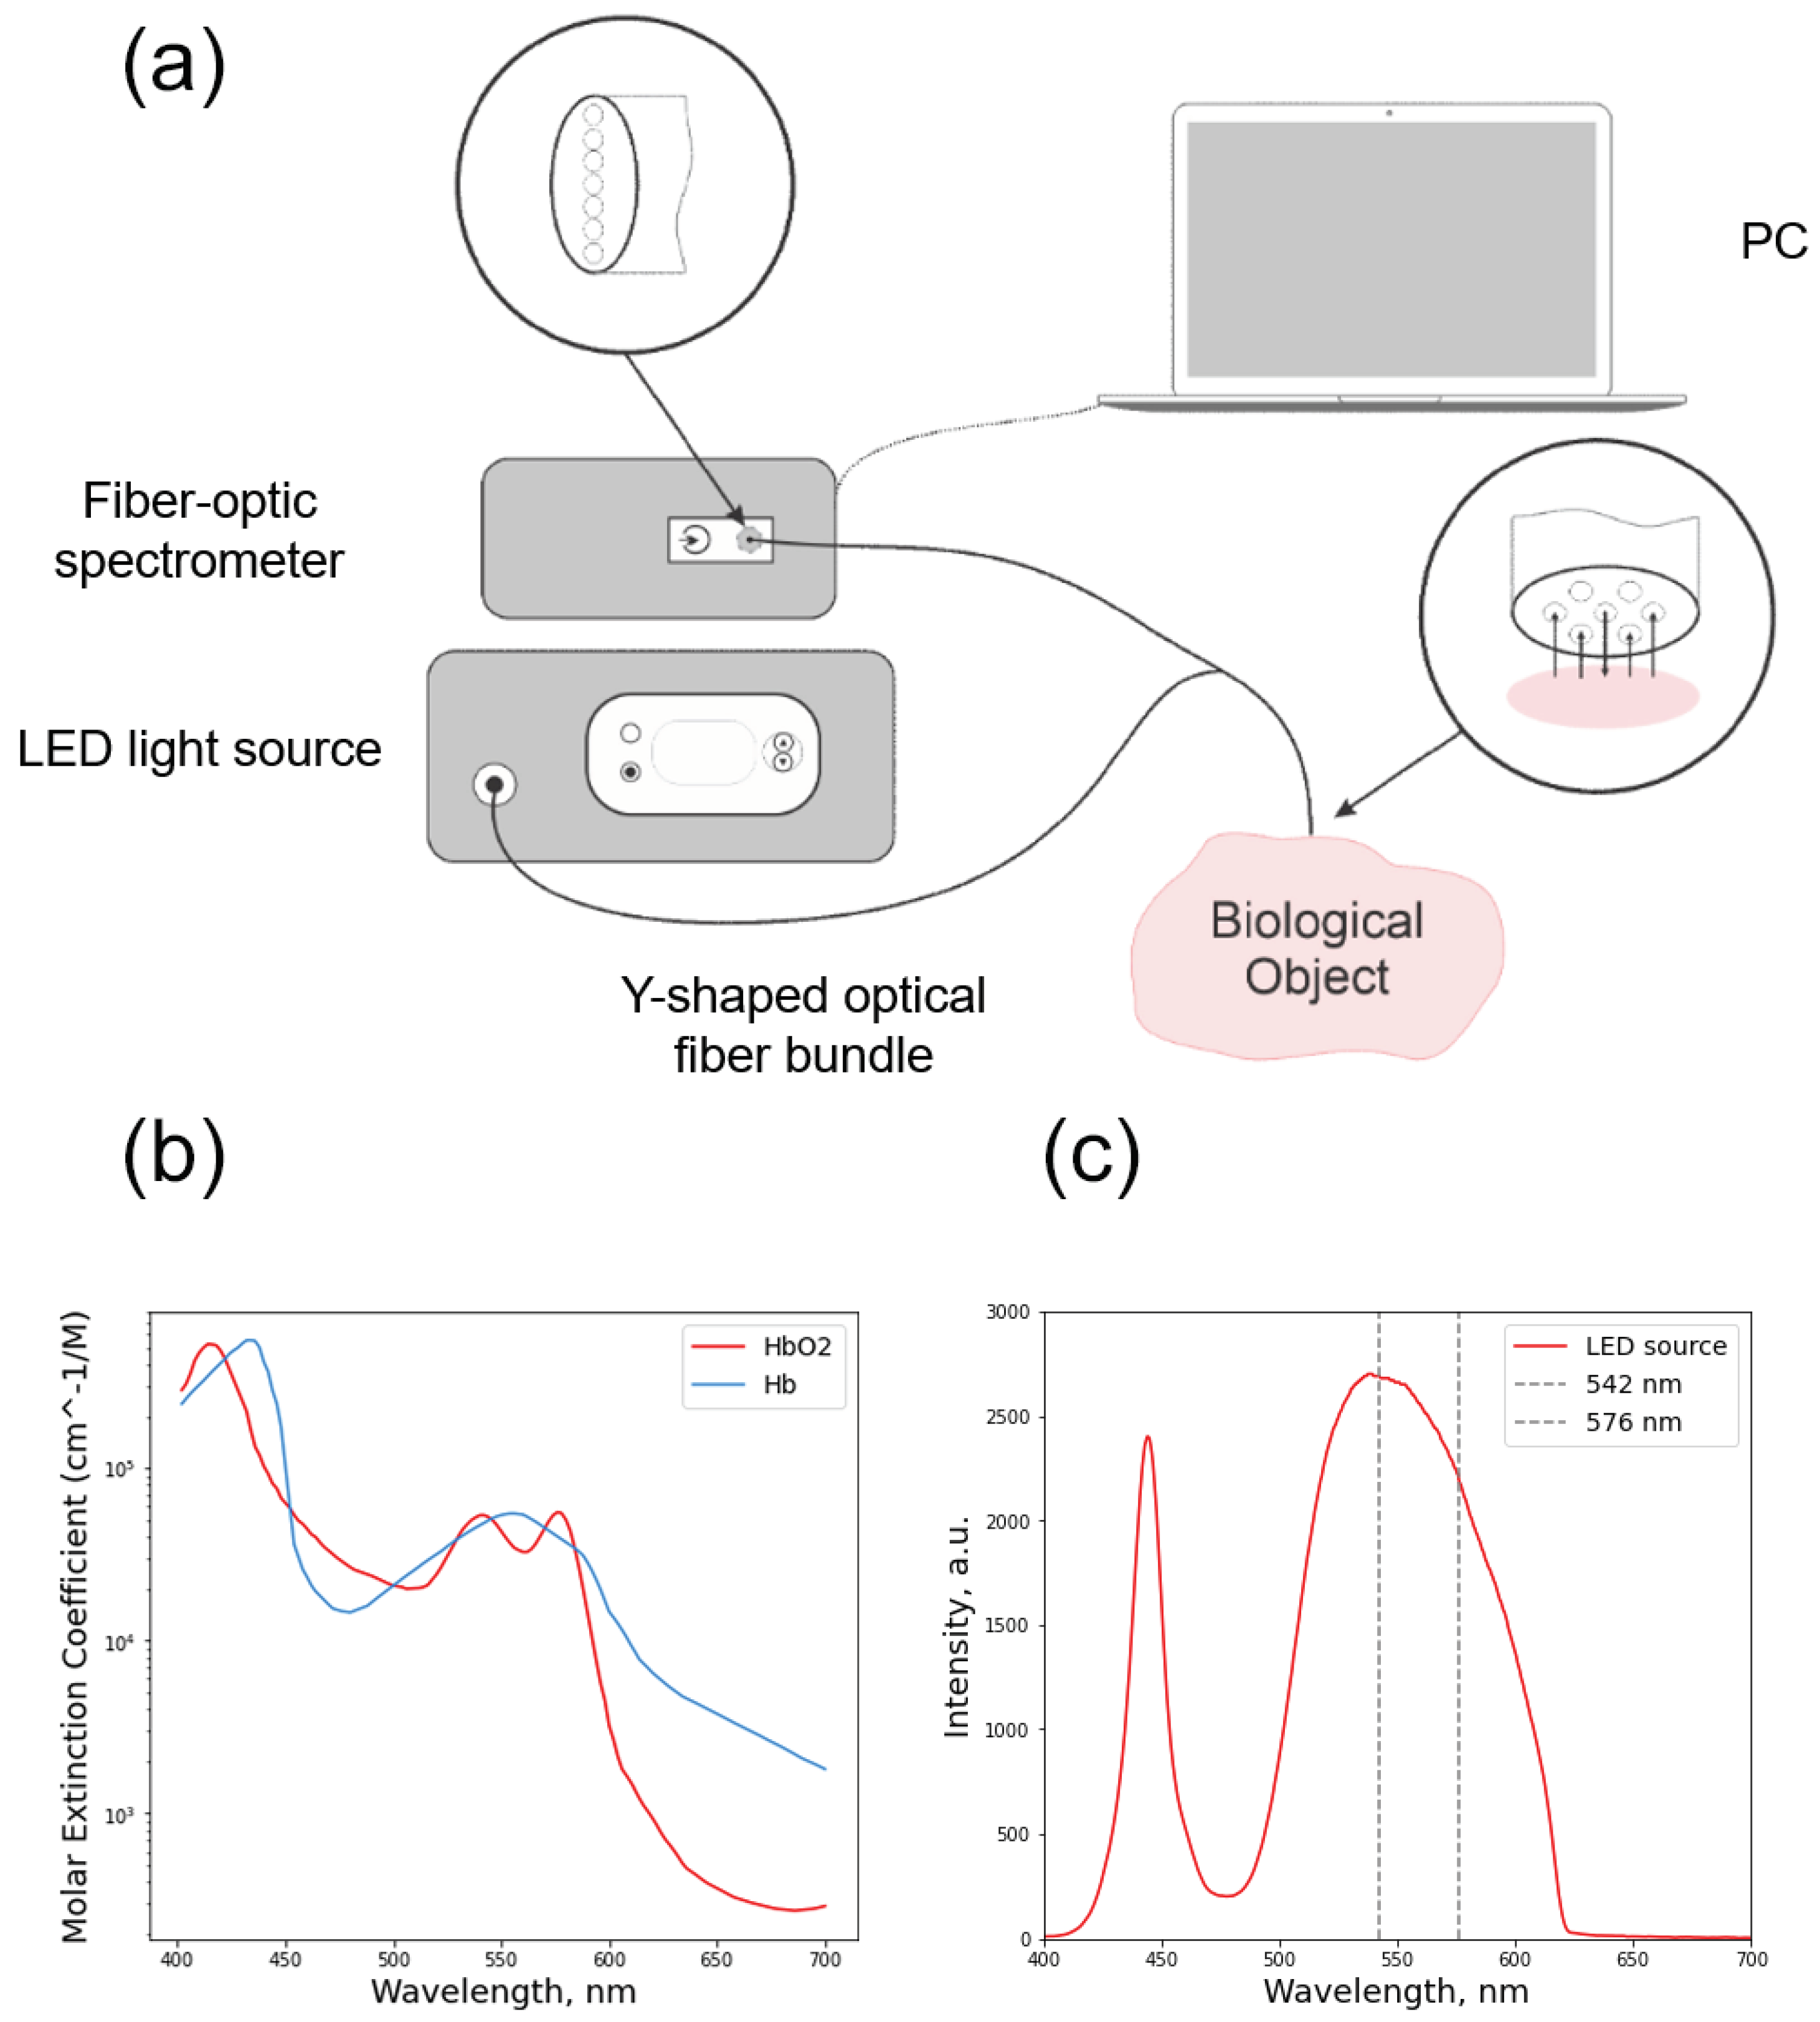
Figure 1. (a) The experimental setup, consisting of a source of broadband light radiation, a spectrometer, an optical Y-shaped fiber bundle and a PC. The optical Y-shaped fiber bundle consists of 7 monofibers: 1 fiber for emitting and 6 for receiving light; (b) Absorption spectra of oxyhemoglobin and hemoglobin; (c) Emission spectra of LED source, dashed lines is wavelength of oxyhemoglobin peaks.
Photonics 09 00821 g001
Figure 2. Measurements an optical phantom: (a) Before filling with a scattering medium that simulates the fatty layer of the mammary gland; (b) After filling with a scattering medium (intralipid). The receiving and emitting fibers were in contact with the surface of the medium above the tubes with blood.
Photonics 09 00821 g002
Figure 3. The attenuation coefficient spectra obtained at a distance between the emitting and detecting fibers of 2, 4, and 7 mm (top row) and diagrams showing the level of oxygen hemoglobin saturation calculated from the measured spectra (bottom row). The maximum signal detection depth is 3 mm at a distance between the fibers of 7 mm.
Photonics 09 00821 g003
Figure 4. Graphical picture of the location of points for optical-spectral control of the area of skin incisions (before and after suturing the edges of the wound). Points 1–8 is a measurements points of border of breast wound, 9–12 is a measurements points of areola, point 13 corresponds to nipple.
Photonics 09 00821 g004
Figure 5. Polar plot of StO 2 changes for each test point of breast measure, the color of the curve determines the day of measurement. The values of the polar axis corresponded to the StO 2 value in percent. Axes at different angles correspond to measurement points. The days of the measurements are highlighted in color.
Photonics 09 00821 g005
Figure 6. (a) The attenuation coefficient spectra obtained from areola. (b) View of the operated tissues of the NAC area, where optical-spectral control was performed. Black dots on NAC area is a wounds healing.
Photonics 09 00821 g006
Figure 7. Changes in indicators of optical-spectral control of tissue oxygen saturation: all obtained StO 2 values of each patient, measured on key days before and after surgery.
Photonics 09 00821 g007
Table 1. Wilcoxon test values based on clinical trial data. The data for each day corresponds to the average saturation value for all patients participating in the selected day.
BeforeAfter1 Day3 Day5 Day10 Day2 Month
Before
After34
1 day3312
3 day18620
5 day0111928
10 day363636124
2 month15323322928
Publisher’s Note: MDPI stays neutral with regard to jurisdictional claims in published maps and institutional affiliations.