Communication

Theoretical Development of Polymer-Based Integrated Lossy-Mode Resonance Sensor for Photonic Integrated Circuits

1
Cellboxlabs Ltd., LV-2164 Riga, Latvia
2
Institute of Solid State Physics, LV-1063 Riga, Latvia
3
Faculty of Materials Science and Applied Chemistry, Riga Technical University, LV-1048 Riga, Latvia
*
Author to whom correspondence should be addressed.
Photonics 2022, 9(10), 764; https://doi.org/10.3390/photonics9100764
Submission received: 6 September 2022 / Revised: 27 September 2022 / Accepted: 11 October 2022 / Published: 12 October 2022

Abstract

:
A promising phenomenon such as lossy-mode resonance (LMR) is of great interest in sensor applications. Until now, this phenomenon has been shown only in fibers or planar waveguides; however, given the rapid development of such an important technological area as photonic integrated circuits (PICs), it is important to transfer LMR technology specifically to PICs. In this article, we propose the theoretical development of an integrated polymer-based LMR sensor that will also contribute to the development of hybrid organic–inorganic PICs. This work theoretically shows that LMR can be achieved using polymer SU-8 waveguides on a glass substrate, on top of which TiO2 is deposited. In addition, the paper shows that multiple resonances can be achieved in the developed integrated sensor. The highest sensor sensitivity (about 1400 nm/RIU) was achieved with 40 nm of TiO2. The effect of the waveguide and coating geometries, as well as the polarizations of propagating modes, is studied in this paper.

1. Introduction

In last few decades, sensors implementing optical resonance structures, such as ring resonators, photonic crystals, etc., have been in high demand due to their high sensitivity to external changes [1,2]. In recent years, there has been great interest in the phenomenon of lossy-mode resonance (LMR) [3]. LMR can be observed when light is propagating through an optical fiber or waveguide, and it interacts with thin films that have positive real parts of permittivity higher in magnitude than both their own imaginary parts and the permittivity of the fiber or waveguide materials [4]. Lossy coatings that are deposited on optical fibers or waveguides induce attenuation bands in the transmission spectra, which can be explained as a coupling between core and lossy modes of dielectric-cladding thin film [5]. These attenuation bands are sensitive to a huge number of external parameters (pH [6], humidity [7], etc.); therefore they can be used as sensors in various applications [5].
LMR has several advantages over other optical-fiber- and waveguide-based sensing techniques. Compared to similar and more commonly used sensing methods, such as surface plasmon resonance (SPR), LMR can generate multiple resonances. At the same time, in comparison with SPR, LMR is observed using both TE- and TM-polarized light [8]. In addition, LMR is a more practical method due to the fact that this effect can be observed for various cladding materials, such as polymer [6], semiconductor [9] and dielectric coatings [10], providing flexibility and low-cost sensing-device fabrication.
Recently, polymers have become popular materials for waveguides fabrication [11]. Compared with inorganic materials, polymers are inexpensive, flexible, and can be functionalized to achieve desired properties for specific photonic applications [12]. Photoresist SU-8 is one of the most commonly used polymers in the field of integrated photonics due its chemical stability and simple patterning with direct laser lithography. SU-8 is ideal for waveguide applications in visible and near-infrared ranges due to its high transparency [13]. In the literature, LMR is observed mostly in the visible and near-infrared regions, making polymers a perfect candidate for the core material of LMR sensors [9]. However, it should be noted that LMR is observed in the UV range for some materials, which can cause certain difficulties when it is combined with polymer waveguides [14]. Among all materials, TiO2 was chosen as a coating for two reasons. First, there are many ways to deposit it over potential waveguides (magnetron sputtering [15], atomic-layer deposition [16], etc.). Secondly, SU-8 does not guide UV radiation very well, while TiO2 provides LMR in the red and near-infrared ranges, unlike some other dielectric coatings [14].
So far, the LMR effect has been shown in the literature only in fibers [9] or planar waveguides [17]. The transfer of LMR sensor technology to photonic integrated circuits (PICs) will gain huge interest from industry due to fabrication cheapness and scalability potential. This would be essential for Point-of-Care (POC) applications and Lab-on-Chip development where integrated sensors play a huge role. In addition to the above, the development of an integrated polymer-based LMR could also be extended to hybrid organic–inorganic PICs due to the simple integration of polymer with other photonic materials.
The aim of this work is to theoretically demonstrate for the first time the possibility of achieving the LMR effect in a level of integrated chip. At the same time, we consider it important to provide the simplest design so there will be no difficulties in the experimental implementation. Considering the above, the paper will evaluate the influence of the geometry of the SU-8 waveguide and lossy TiO2 coating thickness on the LMR signal, and will also propose the optimal solution with the highest sensor sensitivity.

2. Materials and Methods

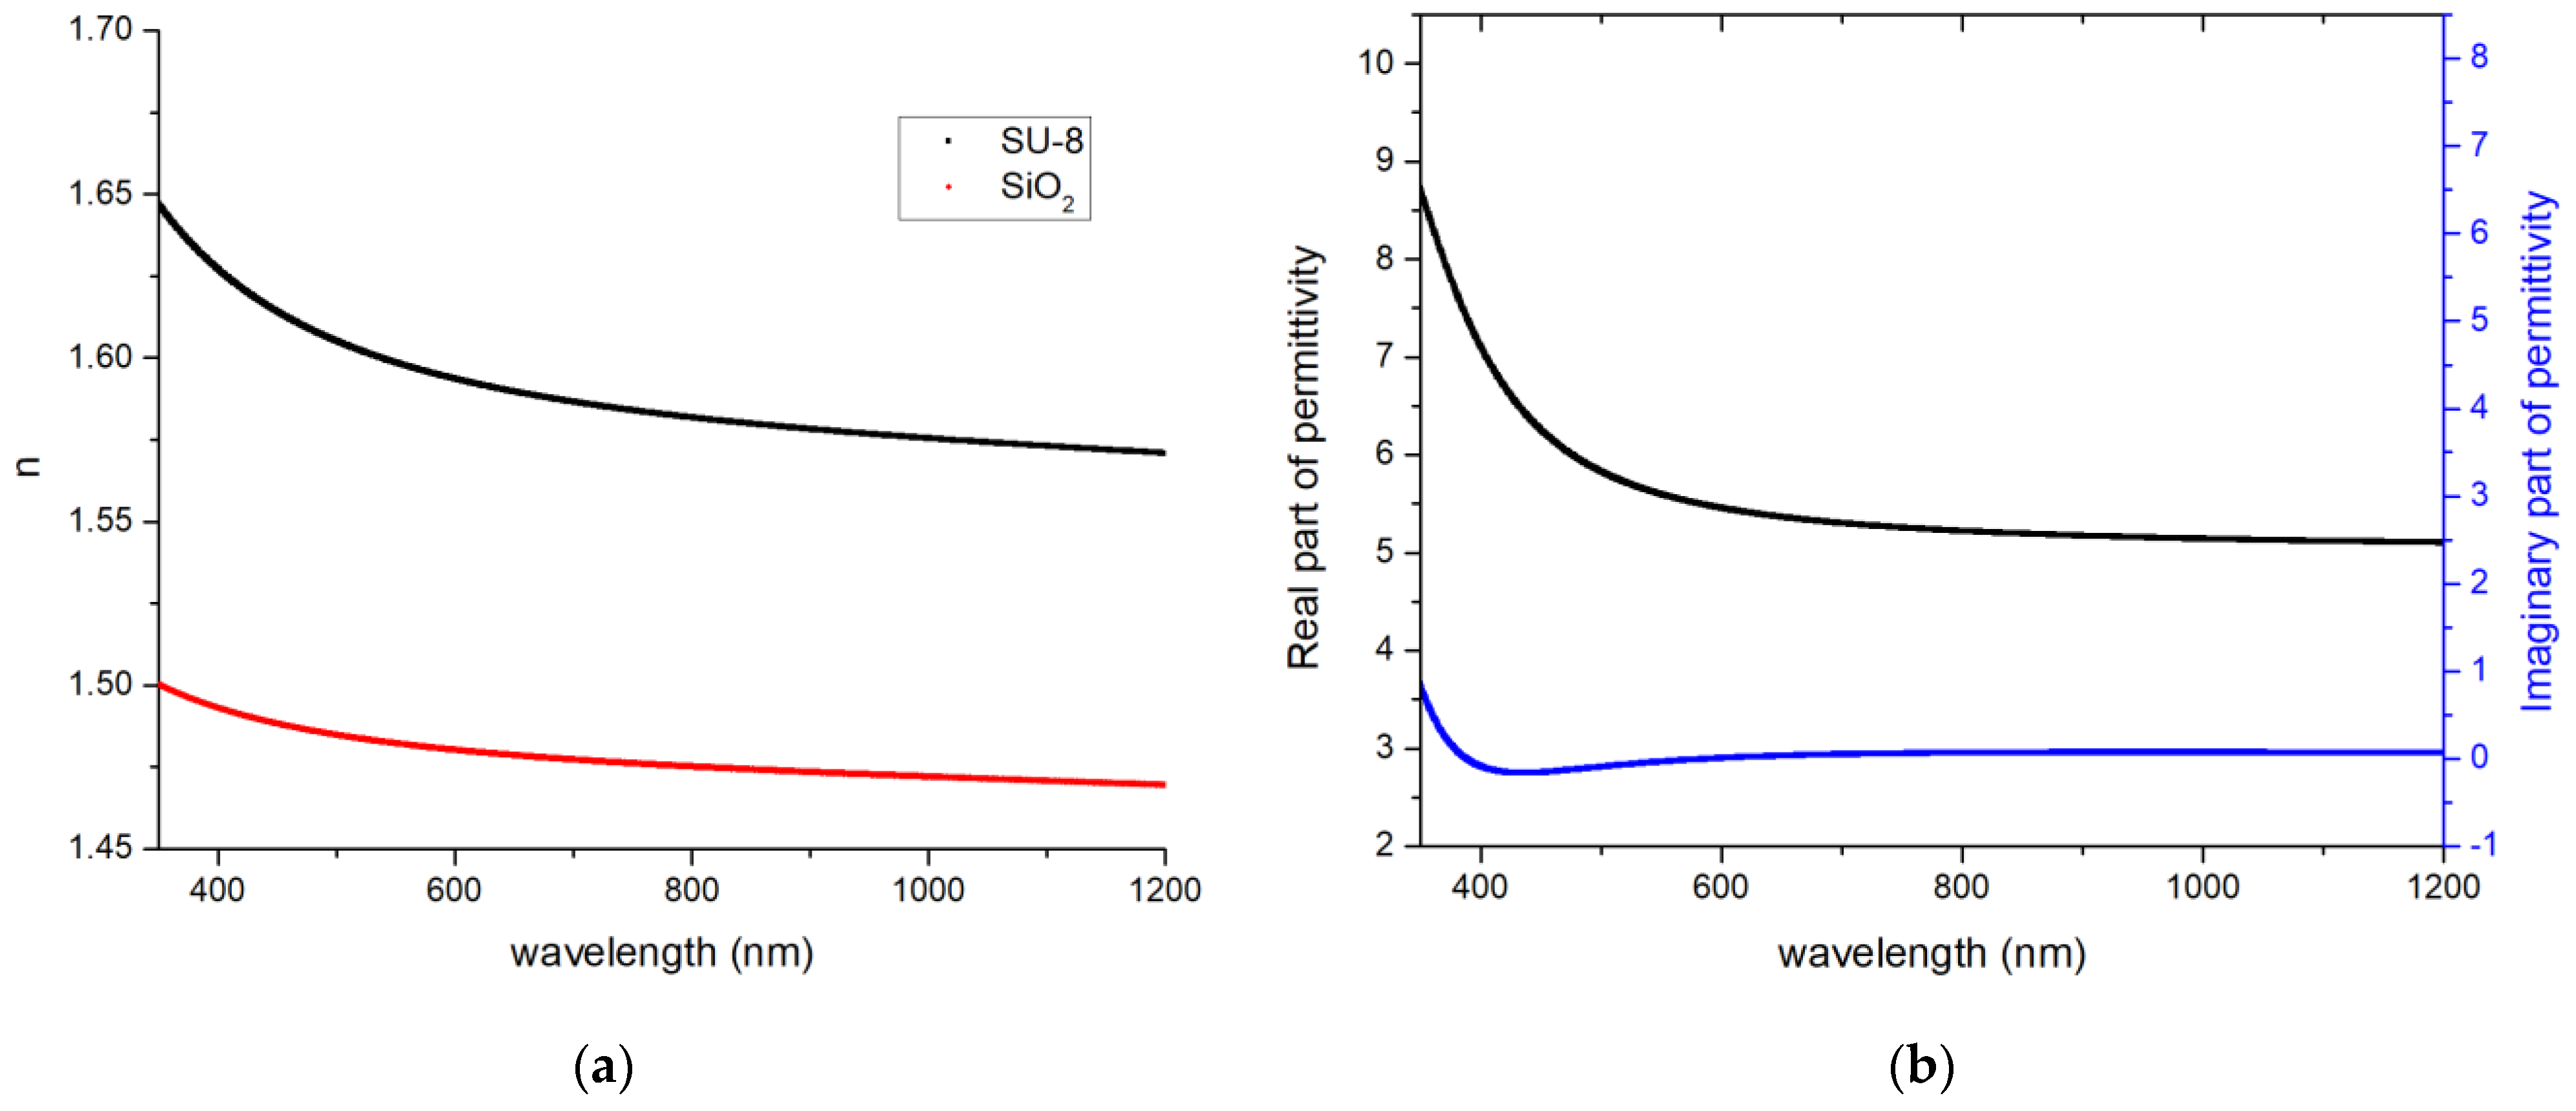
2.1. Materials Fabrication and Characterization

This section will describe the fabrication of SU-8 and TiO2 thin films for the subsequent measurement of their optical properties, which will be necessary for simulations. We spin-coated SU-8 on glass slides (75 × 25 × 1 mm) using Laurell WS650 system. We prepared these glass slides before photoresist spin coating using acetone, detergent, deionized water, and isopropanol in ultrasonic bath. We also performed photoresist oxygen plasma ashing using GIGAbatch 360 M for better adhesion of SU-8. All critical photolithography parameters are given in Table 1.
We sputtered TiO2 lossy thin film on glass slides (75 × 25 × 1 mm) using Sidrabe G500M reactive DC magnetron sputtering system. We performed sputtering process in Ar/O2 (Ar and O2 flow ratio was 3:1) plasma using Ti 100 × 200 × 9 mm target at 5 mTorr pressure and 300 W power.
We determined SU-8 photoresist, TiO2 thin film, and SiO2 glass slide optical properties using a Woollam RC2-XL spectral ellipsometer and CompleteEASE software. We carried out measurements at angles of incidence from 45° to 80° in the visible and near-infrared ranges. We found dispersion curves for SU-8 photoresist and SiO2 glass slide using Sellmeier equation from CompleteEASE software manual:
n = ε + A λ 2 λ 2 B 2 E λ 2 ,
where A , B and E are fitted coefficients and λ is given in μm.
TiO2 is an absorbing thin film; therefore, we used Lorentz oscillator model to determine optical properties. We determined TiO2 permittivity using equation from CompleteEASE software manual:
ε = ε + A m p E n 2 E 2 + A m p n B r n E n n E n n 2 E 2 i E B r n ,
where all parameters except photon energy E are fitted parameters.

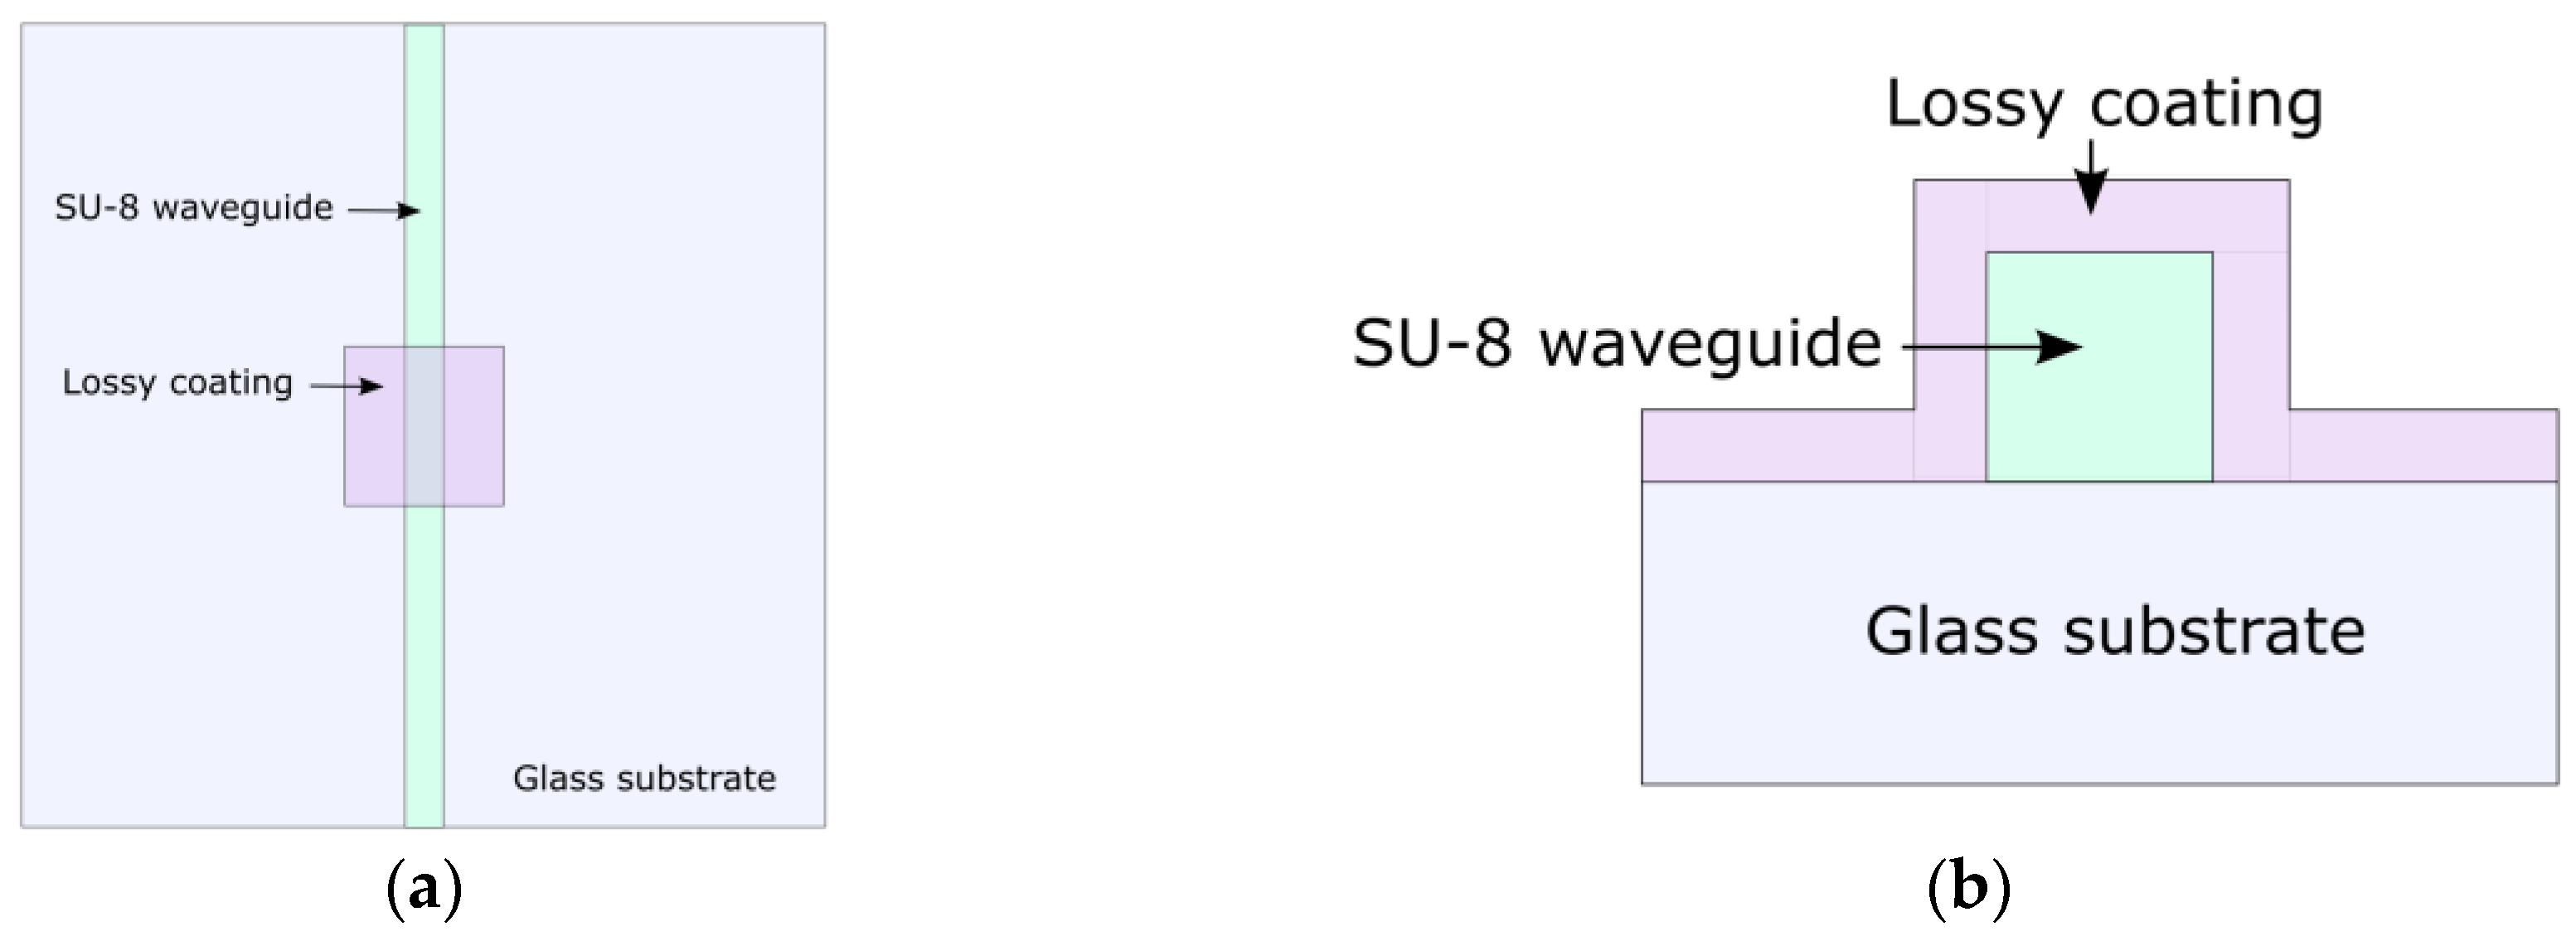
2.2. LMR Device Simulations

The design of the developed LMR sensor is shown in Figure 1. We used COMSOL Multiphysics and the finite element method (FEM) to simulate this problem. First, we defined geometry. We used two-dimensional cross-sectional geometry to determine the electromagnetic distribution of the guided mode. This approach characterizes the behavior of the guided mode in an infinite homogeneous waveguide and ignores many parameters that are unnecessary at this stage (e.g., the light input), which also increases the performance of calculations. This geometry is shown in Figure 1b. The next step was materials definition. At this stage, we defined four different environments (SiO2, SU-8, TiO2, and sensing media) with experimentally determined optical properties. To solve posed problems, we used “Electromagnetic Waves, Frequency Domain” physics. After choosing the physics, we also chose the mesh. We meshed thin-film domain with physics-controlled element size (element size of 200 nm). We meshed other domains with element sizes comparable to wavelength. The last step was to find solutions. We performed a parametric sweep to test various waveguide and coating geometries. WE carried out a mode analysis to determine the distribution of the electromagnetic field in the waveguide for various wavelengths from 400 to 1100 nm. From this, we evaluated electromagnetic field distribution effective refractive index value n e f f , which can be used to simulate transmittance spectra from equation in Ref. [18]:
T = e x p ( 4 π λ i m a g ( n e f f ) L ) ,
where T is transmittance, λ refers to light-source wavelength, and L corresponds to the sensing region length of 1 cm, which is the same as in other literature sources [14].

2.3. LMR Device Fabrication Guidelines
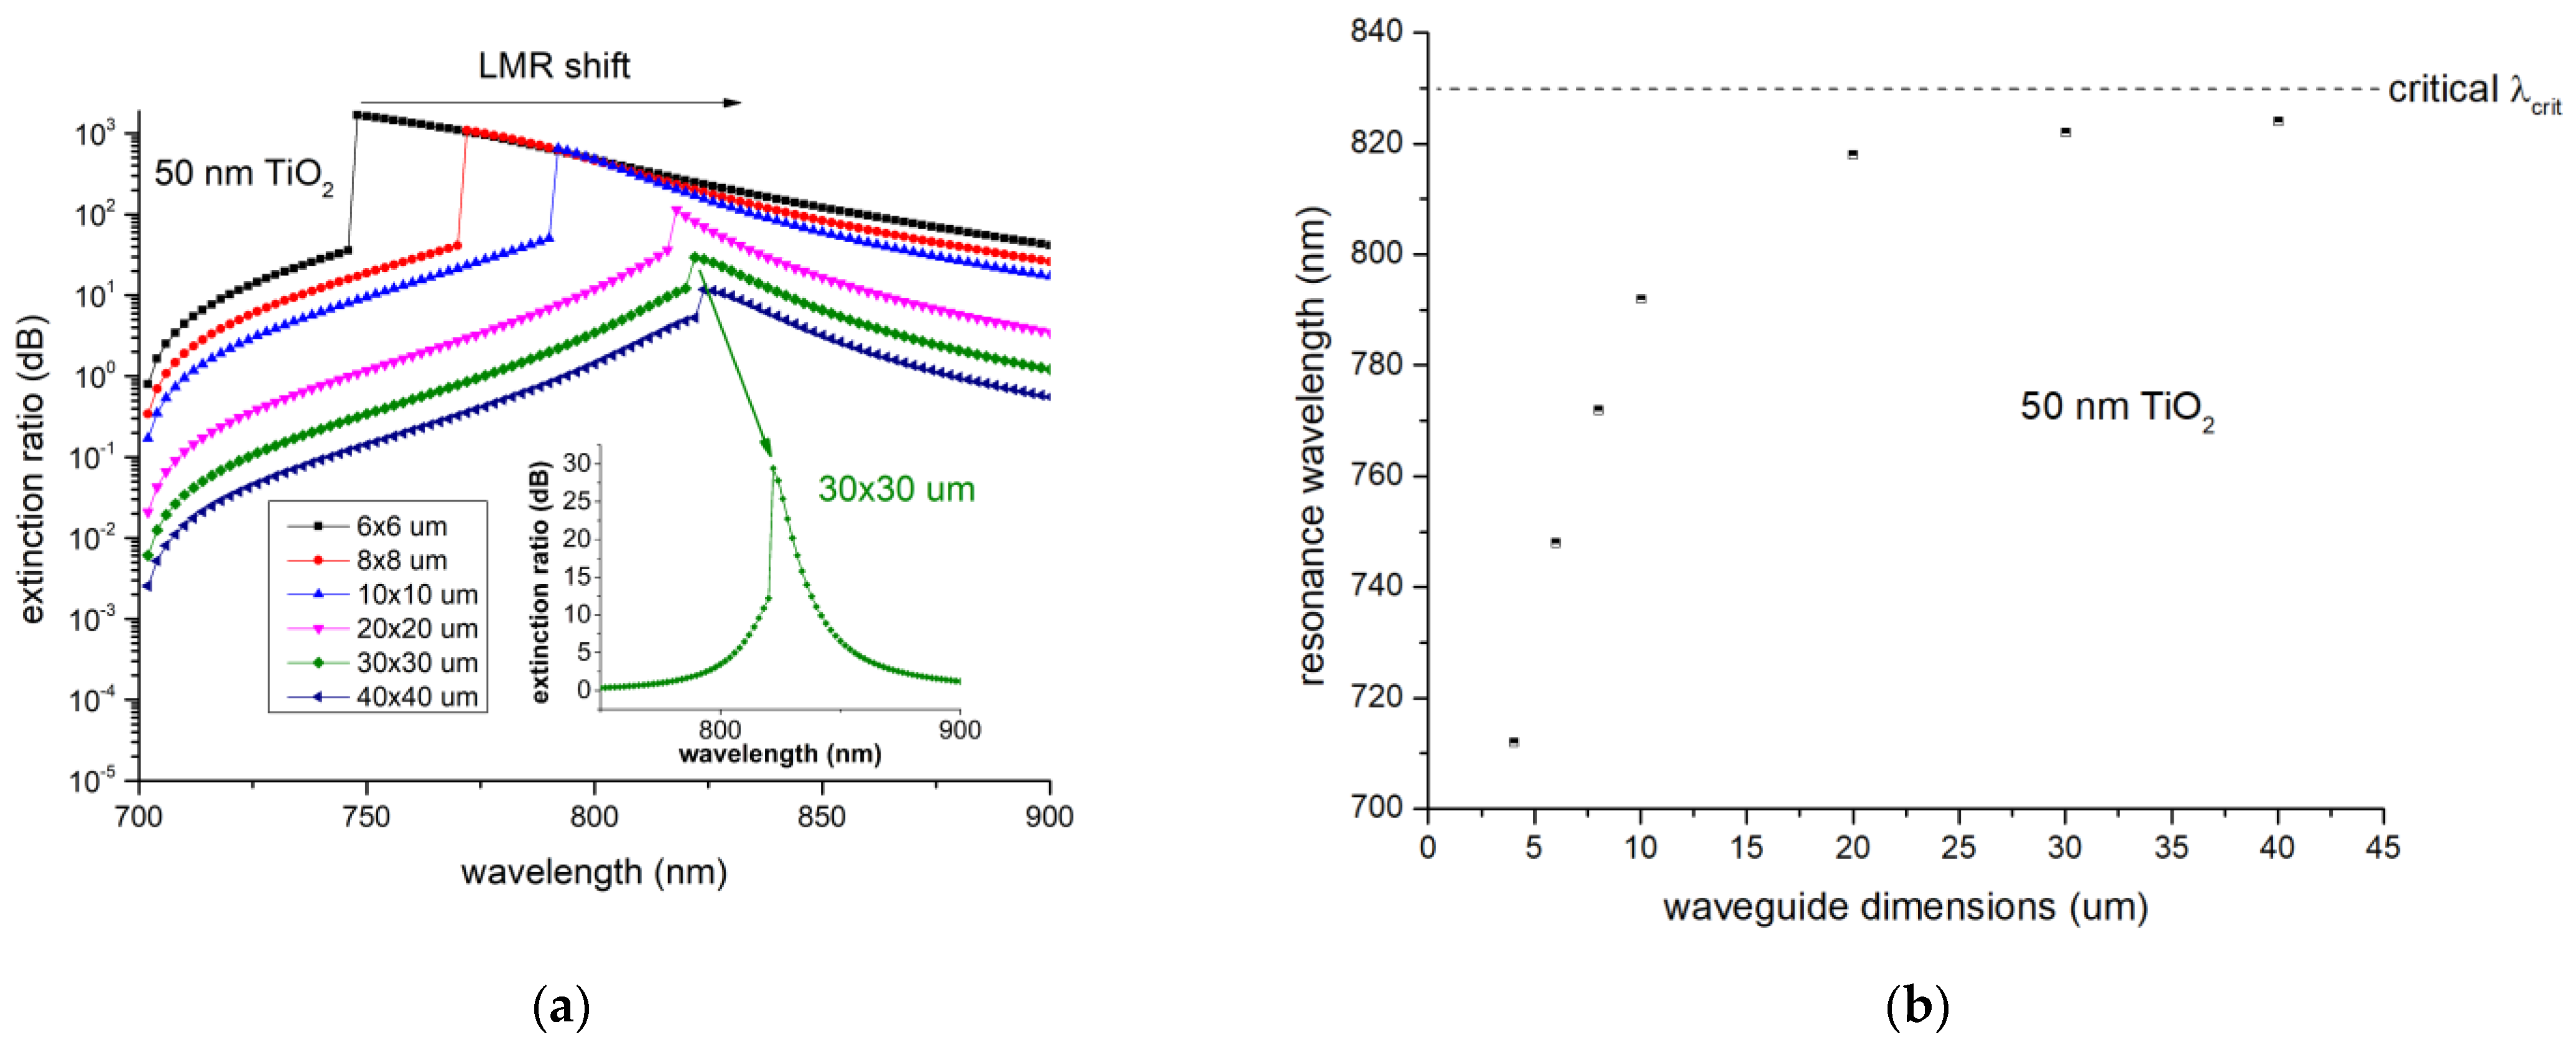
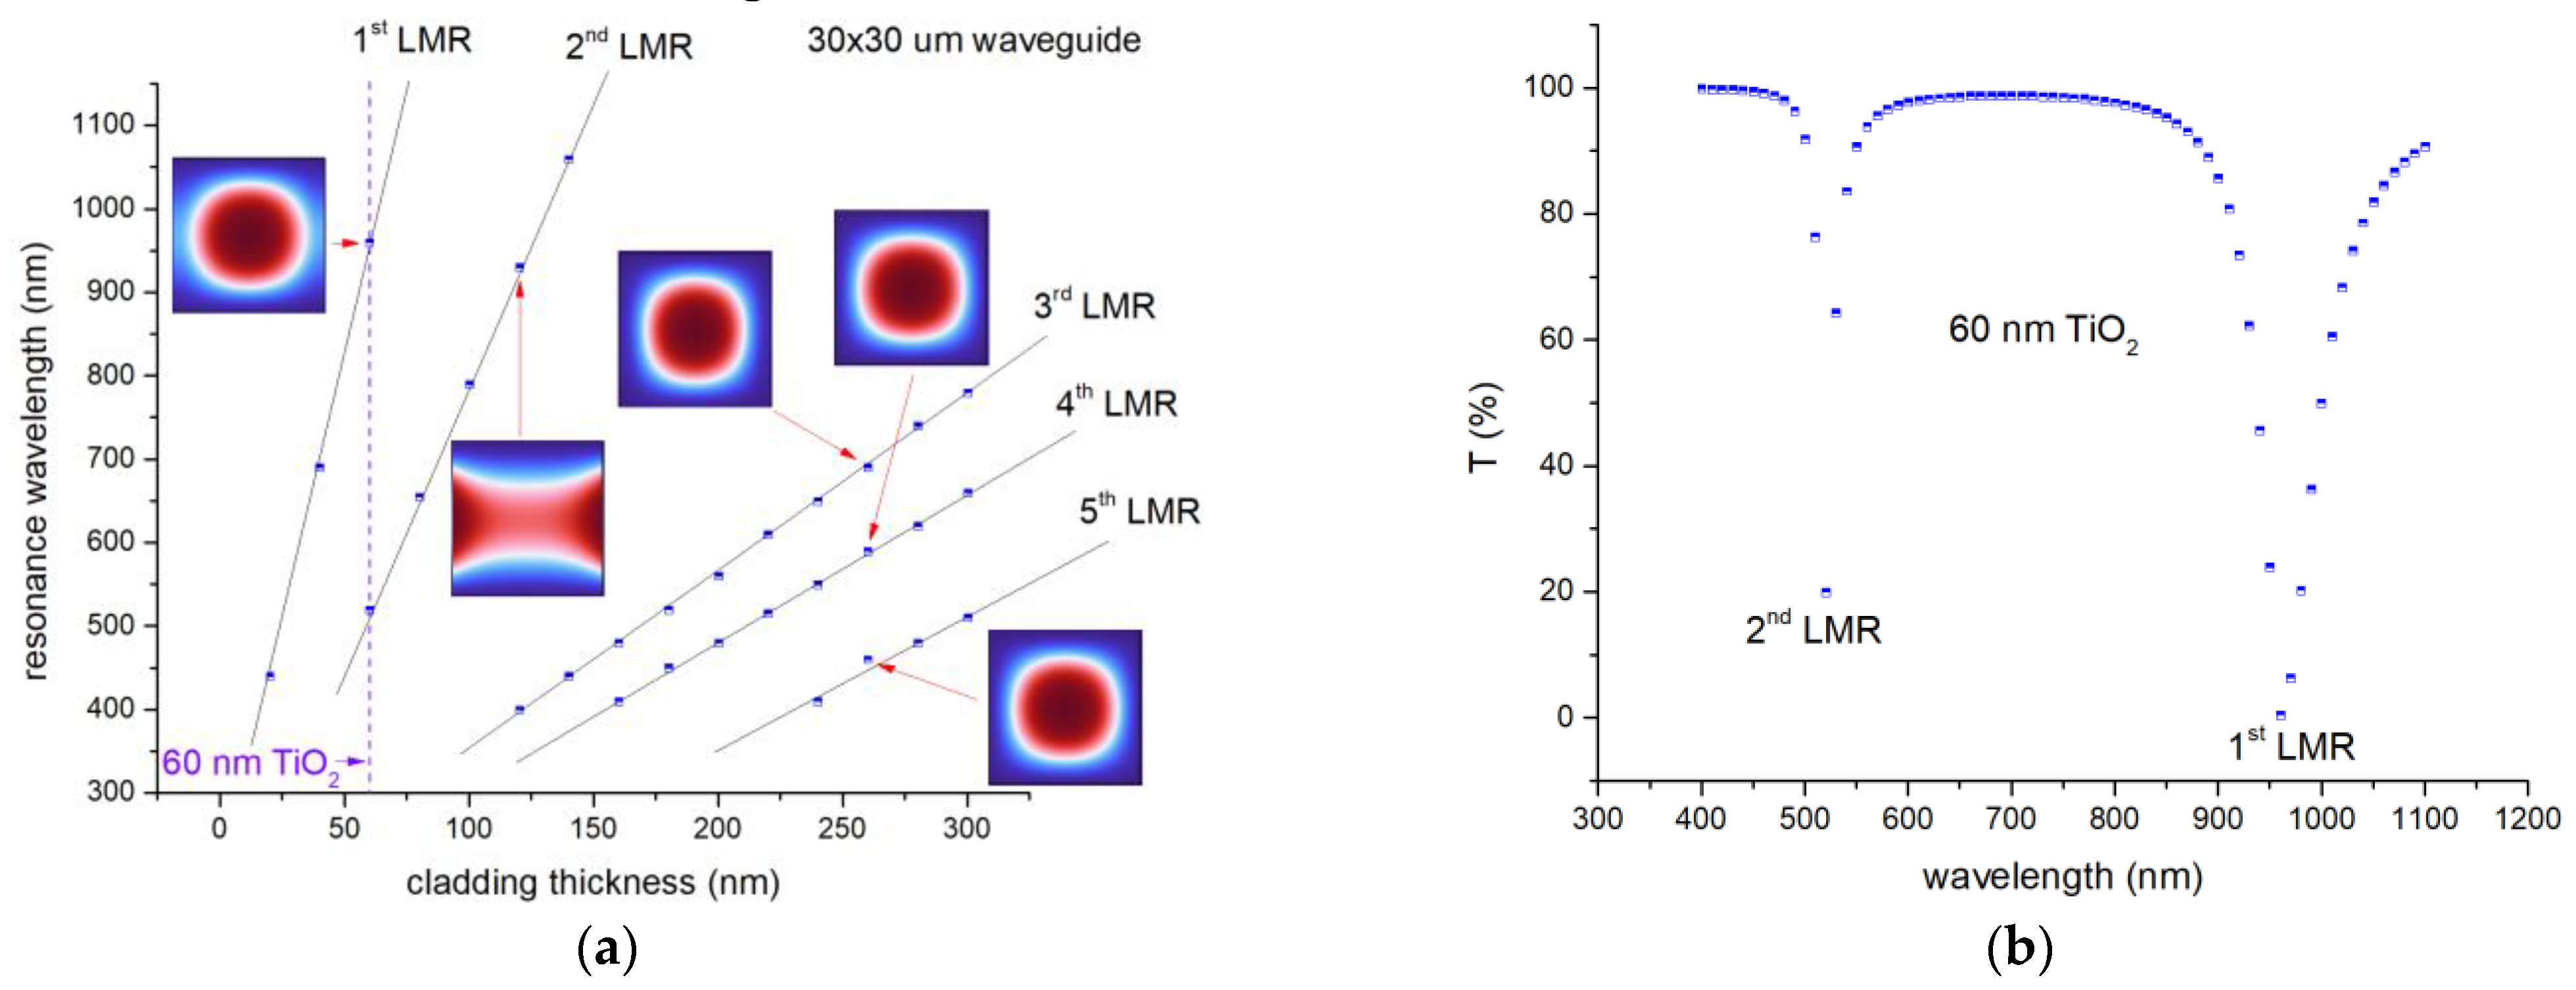
This section will describe the theoretical stages of fabrication for the developed LMR sensor, according to which we will later fabricate it ourselves. Before photolithography, glass slides should be scribed using diamond tool in order to cleave them with fabricated waveguides after photolithography procedure later for efficient fiber attachment.
SU-8 waveguide fabrication can be performed using the same photolithography procedure described in Section 2.1, excepting exposure step. Exposure should be performed using tool that provides possibility to selectively expose spin-coated photoresist.
After waveguide fabrication, TiO2 thin film should be sputtered over it through a shadow mask for cladding patterning using magnetron sputtering procedure described in Section 2.1. This approach will provide sufficient waveguide coverage with lossy coating.
Glass slides then should be cleaved along scribed lines, thus creating access to waveguide ends from the substrate-edge sides for edge-coupling light into photonic chip. Substrate edges with SU-8-waveguide ends should be flattened and smoothened by using grinder–polisher machine. MM fiber should be positioned carefully and permanently bonded to chip using rigid UV adhesive.

3. Results

The dispersion curves experimentally obtained after ellipsometry measurements for SiO2, SU-8, and TiO2 are given in Figure 2. The dispersions curves gave possibility to fit parameters from Equations (1) and (2). These parameters are summarized in Table 2.
Various square-type waveguides with side lengths from 4 to 40 µm were tested. To compare optical properties of these waveguides, extinction ratio spectra was used. First of all, it is clearly seen from Figure 3a that a higher extinction ratio is achieved for smaller waveguides, which is explained by the stronger interaction of the guided modes with the waveguide facets. In addition, from Figure 3a, it is clearly seen that the LMR absorbance depends on these dimensions—it shifts to near-infrared range with increasing waveguide dimensions. In this case, it is clearly seen that the resonance line tends to a critical value ( λ c r i t = 830   nm ) and, upon reaching certain dimensions of the waveguide, it almost does not shift (see Figure 3b). The effect of the optical fiber size on the LMR effect has been previously studied in the literature [14]; however, no shift has been observed there. Most likely, in this work, the authors have already reached a critical value at the smallest fiber diameter because the dependence of the LMR signal on the diameter was studied in the range from 50 to 800 μm. This critical wavelength corresponds to the LMR that should be observed when using multimode fiber. The dependence of the optical fiber diameter on the value of the effective refractive index has been studied in the literature [19]. This can explain the shift of the resonance line with a change in the dimensions of the waveguide due to changes in the resonance conditions. Another interesting effect worth noting is the relative change in transmittance when resonance is reached—it decreases with increasing waveguide dimensions.
In addition to the waveguide geometry, the thickness of the lossy coating also significantly affects the behavior of the LMR (see Figure 4). The resonance line shifts towards the near-infrared region when the lossy coating thickness increases. In addition, it is clearly seen that multiple resonances appear at a certain thickness of a thin film. Figure 4a is visually similar to the graph given in Ref. [20], where the optical fiber is coated with TiO2; however, some differences are also observed. First, in our particular case, LMR began to appear at thinner coatings, which is explained by a rather large difference in the refractive indices of the polymer waveguide and optical fiber silica. Secondly, it can be noted that in our case the difference in wavelength between the second and third LMR is much greater than between other LMRs.
As mentioned earlier, the LMR effect is used for sensing applications, so in addition to the simulations shown above, the sensitivity of the developed sensor was evaluated (see Figure 5). The sensitivity S of the LMR sensor is defined as the following formula [21]:
S = Δ λ Δ n ,
where Δ λ is the resonance wavelength shift and Δ n is the variation in the analyte refractive index.
Waveguide-based sensors are mainly used to detect analytical biomarkers in aqueous solutions; therefore, the sensor must provide high sensitivity in the refractive index range of 1.3–1.4 [21]. In this range for 40 nm, TiO2 lossy cladding simulations showed the highest sensitivity around 1400 nm/RIU. This sensitivity is significantly higher than that reported in the literature for a TiO2-coated LMR sensor (634 nm/RIU) [22]. Comparing the obtained results with other coatings (e.g., ZnO), the results are also encouraging. It was shown in the literature that in the considered range of refractive indices, the authors achieved a sensitivity of 500 nm/RIU [14].
The detection accuracy is related to the FWHM, which depends on the width of the LMR resonance dip. Q-factor is a parameter that characterizes the overall performance of the LMR sensor, which is defined as the following formula [23]:
Q = S F W H M .
The Q-factor in the dependence of TiO2 thickness is shown in Figure 6. The highest Q-factor was achieved with a TiO2 coating thickness of 40 nm (28 RIU−1). This value is lower than for the LMR sensor mentioned in Ref. [23]; however, it is worth noting that this sensor is not based on fibers or waveguides. It is possible that the use of waveguides significantly reduces the quality factor.
The effect of light polarization on the behavior of the LMR was also studied. It can be seen from Figure 7 that the TE and TM modes have a small shift in the resonance line relative to each other. This is very important from the point of view that when unpolarized light is introduced, the resulting resonance line will be wider than in simulations. It is also worth noting that the FWHM is larger for TE-polarized light, which is most likely due to the fact that the guided mode interacts with the side facets of the waveguide, while TM-polarized light interacts with only one top facet.

4. Discussion

In this paper, we studied the LMR effect in the SU-8 waveguide with TiO2 cladding and the influence of the waveguide and coating geometries on the LMR effect. In cases where it is necessary to adjust the LMR wavelength, smaller waveguides can be used because this wavelength is sensitive to small waveguide dimensions. If this wavelength is not so important, then from a practical point of view, it is advisable to use larger waveguides—it is easier to introduce light into such waveguides.
We have shown that multiple resonances can also be observed in coated polymer waveguides; however, some differences have also been observed compared with inorganic silica optical fibers [20]. In the SU-8 waveguide, in order to achieve a similar LMR as in optical fiber [4], it is necessary to use thinner TiO2 coating, which is explained by a rather large difference in the refractive indices of the polymer waveguide and optical fiber silica.
The highest sensitivity of the developed sensor was 1400 nm/RIU, which is higher than that indicated in the literature for a similar coating [22]. This sensitivity was achieved at 40 nm TiO2 for a square-type waveguide with a side length of 30 µm. However, it is worth noting that some applications may require additional resonance lines, in which case a thicker lossy coating will be required.
The highest Q-factor of the developed sensor was 28 RIU−1. This Q-factor was achieved at 40 nm TiO2 for a square-type waveguide with a side length of 30 μm. This Q-factor is lower than for the Kretschmann configuration-based LMR sensor mentioned in Ref. [23] and for the waveguide-based ring resonator sensors mentioned in Refs. [24,25,26].
The effect of polarization on the LMR was also considered. TE and TM polarizations give different FWHMs in the LMR peak. In addition, TE and TM polarizations generate LMR at slightly different wavelengths; however, this shift is less than those found in the literature [3].
The next step in this study will be the actual fabrication of the sensor, as well as its testing. In the future, this developed sensor will be used to analyze such biological entities as the extracellular vesicles of cancer cells. So far, the literature has not shown the possibility of analyzing EVs using the LMR technique; therefore, it makes sense to compare the sensitivity of the designed sensor with other optical waveguide-based sensors for EVs analysis. For example, the sensitivity of a refractive index sensor based on polymer Bragg grating for EVs detection is only 408–861 nm/RIU, which is almost twice worse compared with our suggested solution [27].

Author Contributions

Conceptualization, E.L. and A.B.; methodology, E.L. and A.B.; software, E.L.; validation, G.M. and A.B.; formal analysis, E.L. and A.B.; writing—original draft preparation, E.L.; writing—review and editing, E.L.; visualization, E.L.; supervision, G.M.; project administration, G.M.; funding acquisition, G.M. All authors have read and agreed to the published version of the manuscript.

Funding

This research was funded by the European Regional Development Fund project “Development of a Novel Microfluidic Device for Label-Free Quantification of Prostate Cancer-Derived Extracellular Vesicles and Analysis of their RNA Content” (PROCEX) (1.1.1.1/20/A/045) and the European Union’s Horizon 2020 Framework Program H2020-WIDESPREAD-01-2016-2017-TeamingPhase2 under grant agreement No. 739508, project CAMART2.

Acknowledgments

The authors acknowledge Riga Technical University, the Institute of Solid State Physics, Cellboxlab Ltd., and the European Regional Development Fund for the opportunity to publish this research.

Conflicts of Interest

The authors declare no conflict of interest.

References

  1. Ali, L.; Mohammed, M.U.; Khan, M.; Yousuf, A.H.B.; Chowdhury, M.H. High-Quality Optical Ring Resonator Based Biosensor for Cancer Detection. IEEE Sens. J. 2019, 20, 1867–1875. [Google Scholar] [CrossRef]
  2. Inan, H.; Poyraz, M.; Inci, F.; Lifson, M.A.; Baday, M.; Cunningham, B.T.; Demirci, U. Photonic crystals: Emerging biosensors and them Soc irev promise for point-of-care applications. Chem. Soc. Rev. 2016, 46, 366–388. [Google Scholar] [CrossRef] [PubMed] [Green Version]
  3. Fuentes, O.; Del Villar, I.; Corres, J.M.; Matias, I.R. Lossy Mode Resonance Sensors Based on Lateral Light Incidence in Nanocoated Planar Waveguides. Sci. Rep. 2019, 9, 8882. [Google Scholar] [CrossRef] [Green Version]
  4. Del Villar, I.; Arregui, F.J.; Zamarreño, C.R.; Corres, J.M.; Bariain, C.; Goicoechea, J.; Elosua, C.; Hernaez, M.; Rivero, P.J.; Socorro, A.B.; et al. Optical Sensors Based on Lossy-Mode Resonances. Sens. Actuators B Chem. 2017, 240, 174–185. [Google Scholar] [CrossRef]
  5. Wang, Q.; Zhao, W.M. A Comprehensive Review of Lossy Mode Resonance-Based Fiber Optic Sensors. Opt. Lasers Eng. 2018, 100, 47–60. [Google Scholar] [CrossRef]
  6. Zamarreño, C.R.; Hernáez, M.; Del Villar, I.; Matías, I.R.; Arregui, F.J. Optical Fiber PH Sensor Based on Lossy-Mode Resonances by Means of Thin Polymeric Coatings. Sensors Actuators B Chem. 2011, 155, 290–297. [Google Scholar] [CrossRef]
  7. Zamarreño, C.R.; Hernaez, M.; Del Villar, I.; Matias, I.R.; Arregui, F.J. Tunable Humidity Sensor Based on ITO-Coated Optical Fiber. Sens. Actuators B Chem. 2010, 146, 414–417. [Google Scholar] [CrossRef]
  8. Fuentes, O.; Goicoechea, J.; Corres, J.M.; Del Villar, I.; Ozcariz, A.; Matias, I.R. Generation of Lossy Mode Resonances with Different Nanocoatings Deposited on Coverslips. Opt. Express 2020, 28, 288. [Google Scholar] [CrossRef]
  9. Arregui, F.J.; Del Villar, I.; Corres, J.M.; Goicoechea, J.; Carlos, R.; Elosua, C.; Hernaez, M.; Rivero, P.J.; Socorro, A.B.; Sanchez, P.; et al. Fiber-Optic Lossy Mode Resonance Sensors. Procedia Eng. 2014, 87, 3–8. [Google Scholar] [CrossRef] [Green Version]
  10. Sudas, D.P.; Zakharov, L.Y.; Jitov, V.A.; Golant, K.M. Silicon Oxynitride Thin Film Coating to Lossy Mode Resonance Fiber-Optic Refractometer. Sensors 2022, 22, 3665. [Google Scholar] [CrossRef]
  11. Eldada, L.; Shacklette, L. Advances in polymer integrated optics. IEEE J. Sel. Top. Quantum Electron. 2000, 6, 54–68. [Google Scholar] [CrossRef]
  12. Paquet, C.; Kumacheva, E. Nano Structured Polymers for Photonics. Mater. Today 2008, 11, 48–56. [Google Scholar] [CrossRef]
  13. Lorenz, H.; Despont, M.; Fahrni, N.; LaBianca, N.; Renaud, P.; Vettiger, P. SU-8: A Low-Cost Negative Resist For MEMS. J. Micormech. Microeng. 1997, 7, 121. [Google Scholar] [CrossRef]
  14. Usha, S.P.; Gupta, B.D. Performance Analysis of Zinc Oxide-Implemented Lossy Mode Resonance-Based Optical Fiber Refractive Index Sensor Utilizing Thin Film/Nanostructure. Appl. Opt. 2017, 56, 5716. [Google Scholar] [CrossRef] [PubMed]
  15. Nezar, S.; Saoula, N.; Sali, S.; Faiz, M.; Mekki, M.; Laoufi, N.A.; Tabet, N. Properties of TiO 2 Thin Films Deposited by Rf Reactive Magnetron Sputtering on Biased Substrates. Appl. Surf. Sci. 2017, 395, 172–179. [Google Scholar] [CrossRef]
  16. Chung, H.K.; Won, S.O.; Park, Y.; Kim, J.S.; Park, T.J.; Kim, S.K. Atomic-Layer Deposition of TiO2 Thin Films with a Thermally Stable (CpMe5)Ti(OMe)3 Precursor. Appl. Surf. Sci. 2021, 550, 149381. [Google Scholar] [CrossRef]
  17. Benítez, M.; Zubiate, P.; Del Villar, I.; Socorro-Leránoz, A.B.; Matías, I.R. Lossy Mode Resonance Based Microfluidic Platform Developed on Planar Waveguide for Biosensing Applications. Biosensors 2022, 12, 403. [Google Scholar] [CrossRef] [PubMed]
  18. Kadhim, R.A.; Yuan, L.; Xu, H.; Wu, J.; Wang, Z. Highly Sensitive D-Shaped Optical Fiber Surface Plasmon Resonance Refractive Index Sensor Based on Ag-α-Fe2O3 Grating. IEEE Sens. J. 2020, 20, 9816–9824. [Google Scholar] [CrossRef]
  19. Shahzadi, R.; Shahzad, A.; Qamar, F.; Shahzadi, R.; Ali, M. Effective Refractive Index and V-Parameter Characterization for Guided Modes in Multilmode. Nano and Three Layer Optical Fibers. Int. J. Inf. Technol. Electr. Eng. 2018, 7, 20–27. [Google Scholar]
  20. Del Villar, I.; Hernaez, M.; Zamarreño, C.R.; Sánchez, P.; Fernández-valdivielso, C.; Arregui, F.J.; Matias, I.R. Design Rules for Lossy Mode Resonance Based Sensors. Appl. Opt. 2012, 51, 4298–4307. [Google Scholar] [CrossRef] [Green Version]
  21. Tien, C.-L.; Mao, T.-L.; Li, C.-Y. Lossy Mode Resonance Sensors Fabricated by RF Magnetron Sputtering GZO Thin Film and D-Shaped Fibers. Coatings 2020, 10, 29. [Google Scholar] [CrossRef]
  22. Burnat, D.; Koba, M.; Wachnicki, Ł.; Gierałtowska, S.; Godlewski, M.; Śmietana, M. Refractive Index Sensitivity of Optical Fiber Lossy-Mode Resonance Sensors Based on Atomic Layer Deposited TiO x Thin Overlay. In Proceedings of the Sixth European Workshop on Optical Fibre Sensors (EWOFS’2016), Limerick, Ireland, 30 May 2016; Volume 9916, p. 99161G. [Google Scholar] [CrossRef]
  23. Zhang, Y.; Zhang, P.; Zhao, M.; Xu, D.; Wang, J.; Li, Z.; Tang, T.; Shen, J.; Li, C. A High Sensitivity Lossy Mode Resonance Refractive Index Sensor Based on SBS Structure. Results Phys. 2022, 36, 105454. [Google Scholar] [CrossRef]
  24. Ciminelli, C.; Innone, F.; Brunetti, G.; Conteduca, D.; Dell’Olio, F.; Tatoli, T.; Armenise, M.N. Rigorous model for the design of ultra-high Q-factor resonant cavities. In Proceedings of the 18th International Conference on Transparent Optical Networks 2016, Trento, Italy, 10–14 July 2016; pp. 1–4. [Google Scholar] [CrossRef]
  25. Madani, A.; Kleinert, M.; Stolarek, D.; Zimmermann, L.; Ma, L.; Schmidt, O.G. Vertical Optical Ring Resonators Fully Integrated with Nanophotonic Waveguides on Silicon-on-Insulator Substrates. Opt. Lett. 2015, 40, 3826. [Google Scholar] [CrossRef] [PubMed] [Green Version]
  26. Madani, A.; Harazim, S.M.; Quiñones, V.A.B.; Kleinert, M.; Finn, A.; Naz, E.S.G.; Ma, L.; Schmidt, O.G. Optical microtube cavities monolithically integrated on photonic chips for optofluidic sensing. Opt. Lett. 2017, 42, 486–489. [Google Scholar] [CrossRef]
  27. Saha, N.; Brunetti, G.; Kumar, A.; Armenise, M.N.; Ciminelli, C. Highly Sensitive Refractive Index Sensor Based on Polymer Bragg Grating: A Case Study on Extracellular Vesicles Detection. Biosensors 2022, 12, 415. [Google Scholar] [CrossRef] [PubMed]
Figure 1. Integrated LMR sensor design: (a) top view, (b) cross-sectional view.
Photonics 09 00764 g001
Figure 2. Dispersion curves: (a) transparent SU-8 and SiO2; (b) absorbing TiO2.
Photonics 09 00764 g002
Figure 3. Effect of waveguide dimensions on the LMR effect: (a) extinction ratio spectra for different waveguide dimensions; (b) LMR wavelength depending on the dimensions of the waveguide.
Photonics 09 00764 g003
Figure 4. LMR in dependence of lossy cladding thickness: (a) resonance wavelength vs. cladding thickness; (b) transmittance spectrum at TiO2 thickness of 60 nm.
Photonics 09 00764 g004
Figure 5. LMR sensor sensitivity: (a) LMR shift with a change in the refractive index of the medium; (b) influence of lossy coating thickness on sensitivity.
Photonics 09 00764 g005
Figure 6. Q-factor in dependence of TiO2 thickness.
Photonics 09 00764 g006
Figure 7. Differences in LMR depending on the polarization of light.
Photonics 09 00764 g007
Table 1. SU-8 thin film fabrication.
Process StepsEquipment and Materials UsedCritical Parameters
Spin coatingLaurell WS650, Gersteltec GM1060 photoresist
  • Acceleration for 30 s: 100 rpm/s
  • Constant rotation speed for 30 s: 1000 rpm
  • Acceleration for 30 s: −100 rpm/s
Soft bakeUnitemp high-precision hot plates
  • Temperature ramp rate for 500 s: 6 °C/min
  • Holding temperature for 300 s: 95 °C
ExposureMask aligner Suss MA6
  • Light source wavelength: 365 nm
  • Flood exposure dose: 300 mJ/cm2
Post bakeUnitemp high-precision hot plates
  • Temperature rate for 270 s: 6 °C/min
  • Holding temperature for 300 s: 95 °C
Developmentmr-Dev 600
  • Development time: 120 s
Hard bakeUnitemp high-precision hot plates
  • Temperature ramp rate for 1200 s: 6 °C/min
  • Holding temperature for 1800 s: 165 °C
Table 2. Materials’ fitted parameters.
MaterialEquation UsedFitted Parameters
SU-8(1) ε = 1 ,   A = 1.389 ,   B = 0.15083   μ m 2 , E = 0.0184   μ m 2
SiO2(1) ε = 1 ,   A = 1.168 ,   B = 0.09091   μ m 2 , E = 0.0100   μ m 2
TiO2(2) ε = 1 ,   A m p = 106.9   eV 2 ,   E n = 5.9   eV ,   A m p 1 = 24.0 ,   B r 1 = 1.4   eV ,   E n 1 = 4.1   eV ,   A m p 2 = 19.9 ,   B r 2 = 1.4   eV , E n 2 = 4.0   eV .
Publisher’s Note: MDPI stays neutral with regard to jurisdictional claims in published maps and institutional affiliations.

