Fiber-Optic Axial-Strain Sensor with Sensitivity Enhancement and Temperature Compensation


Abstract
:1. Introduction
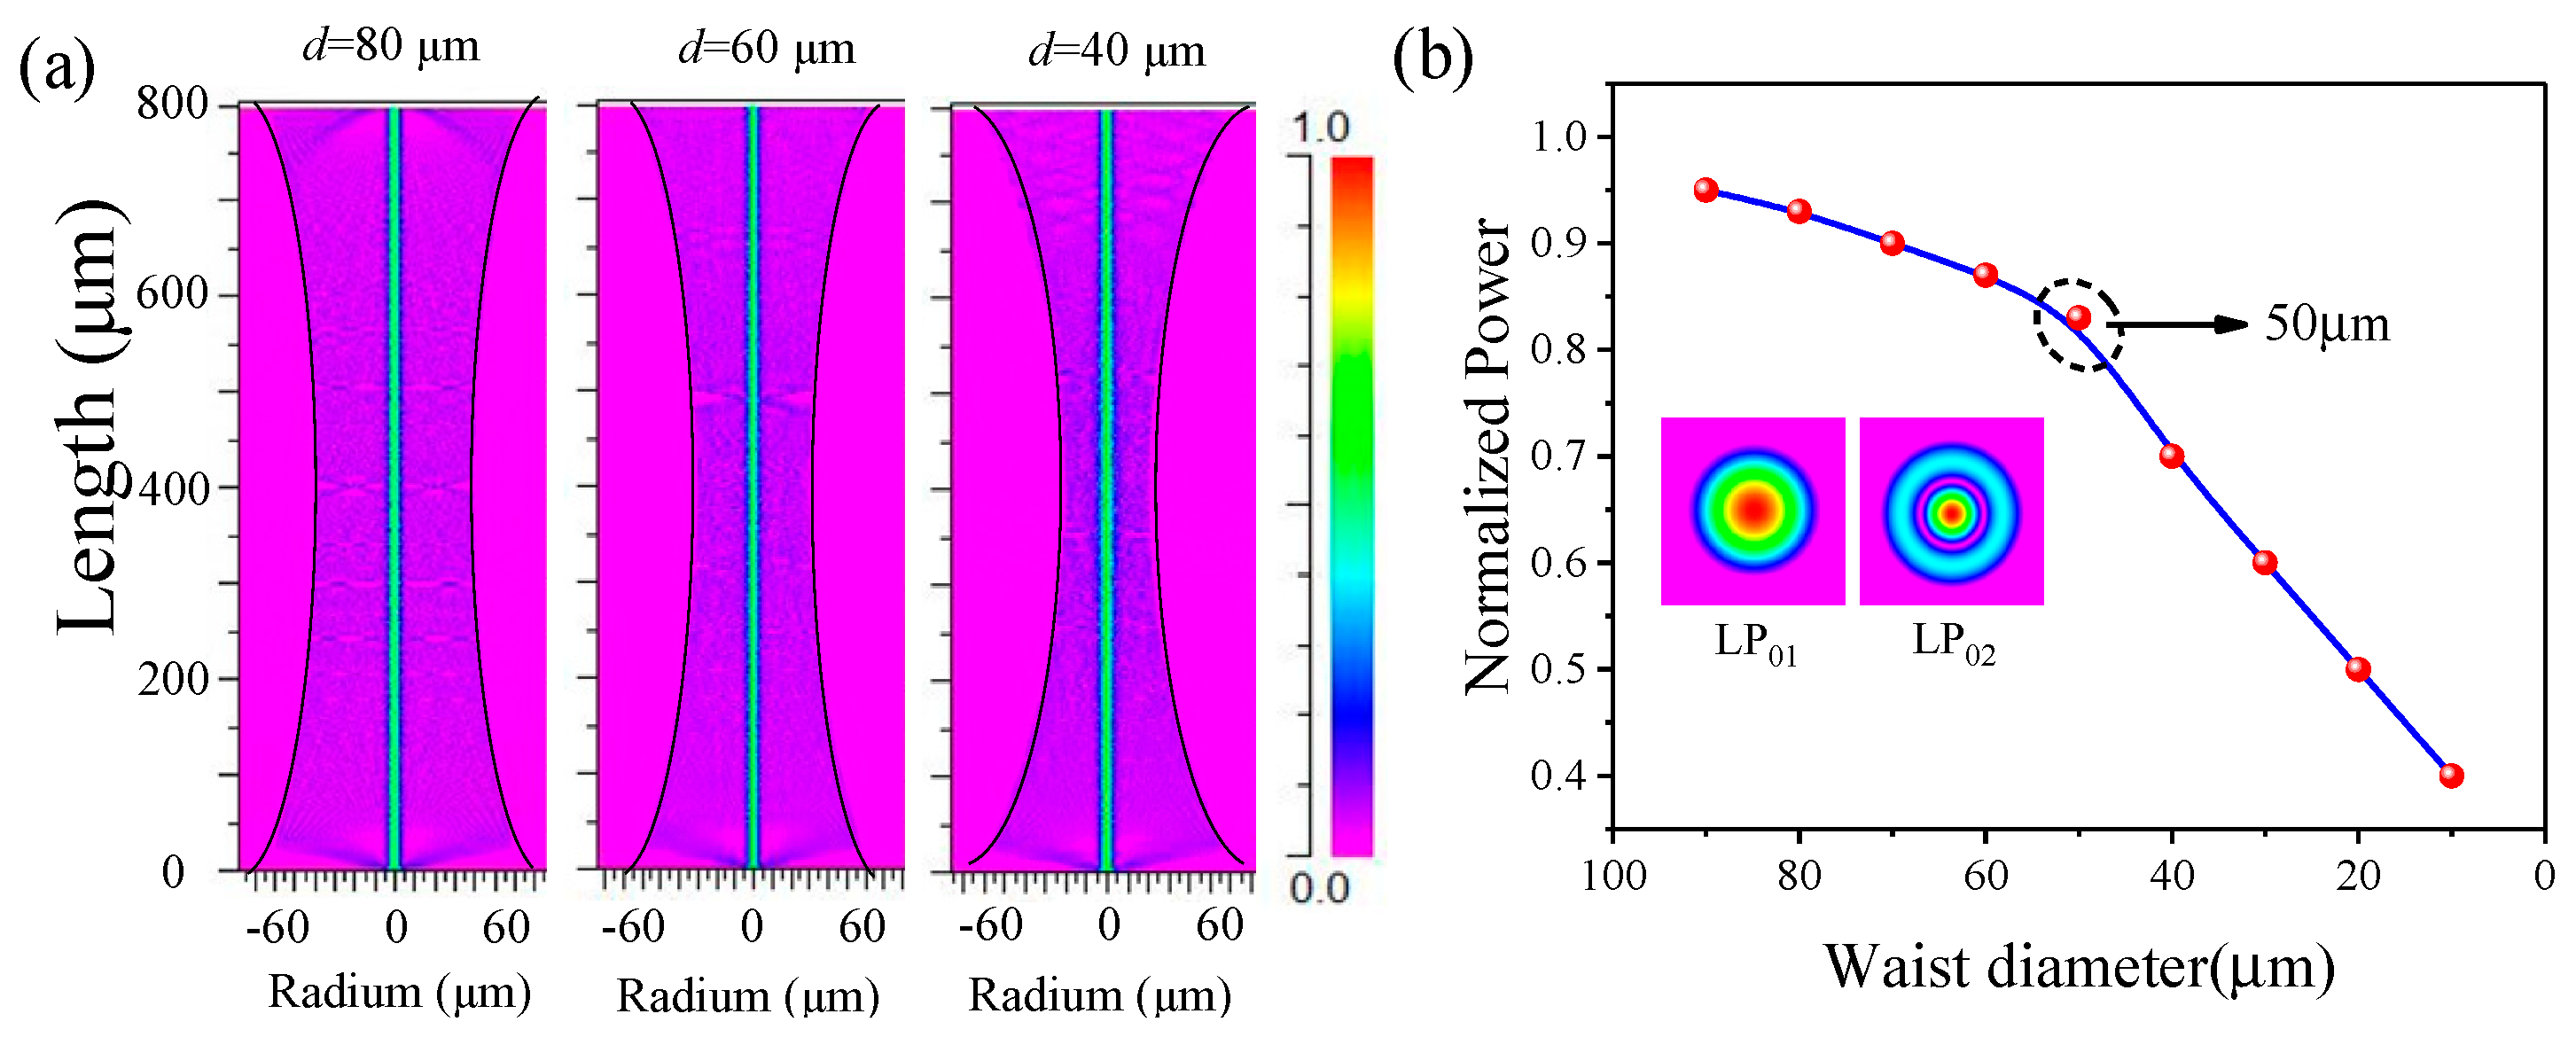
2. Principle
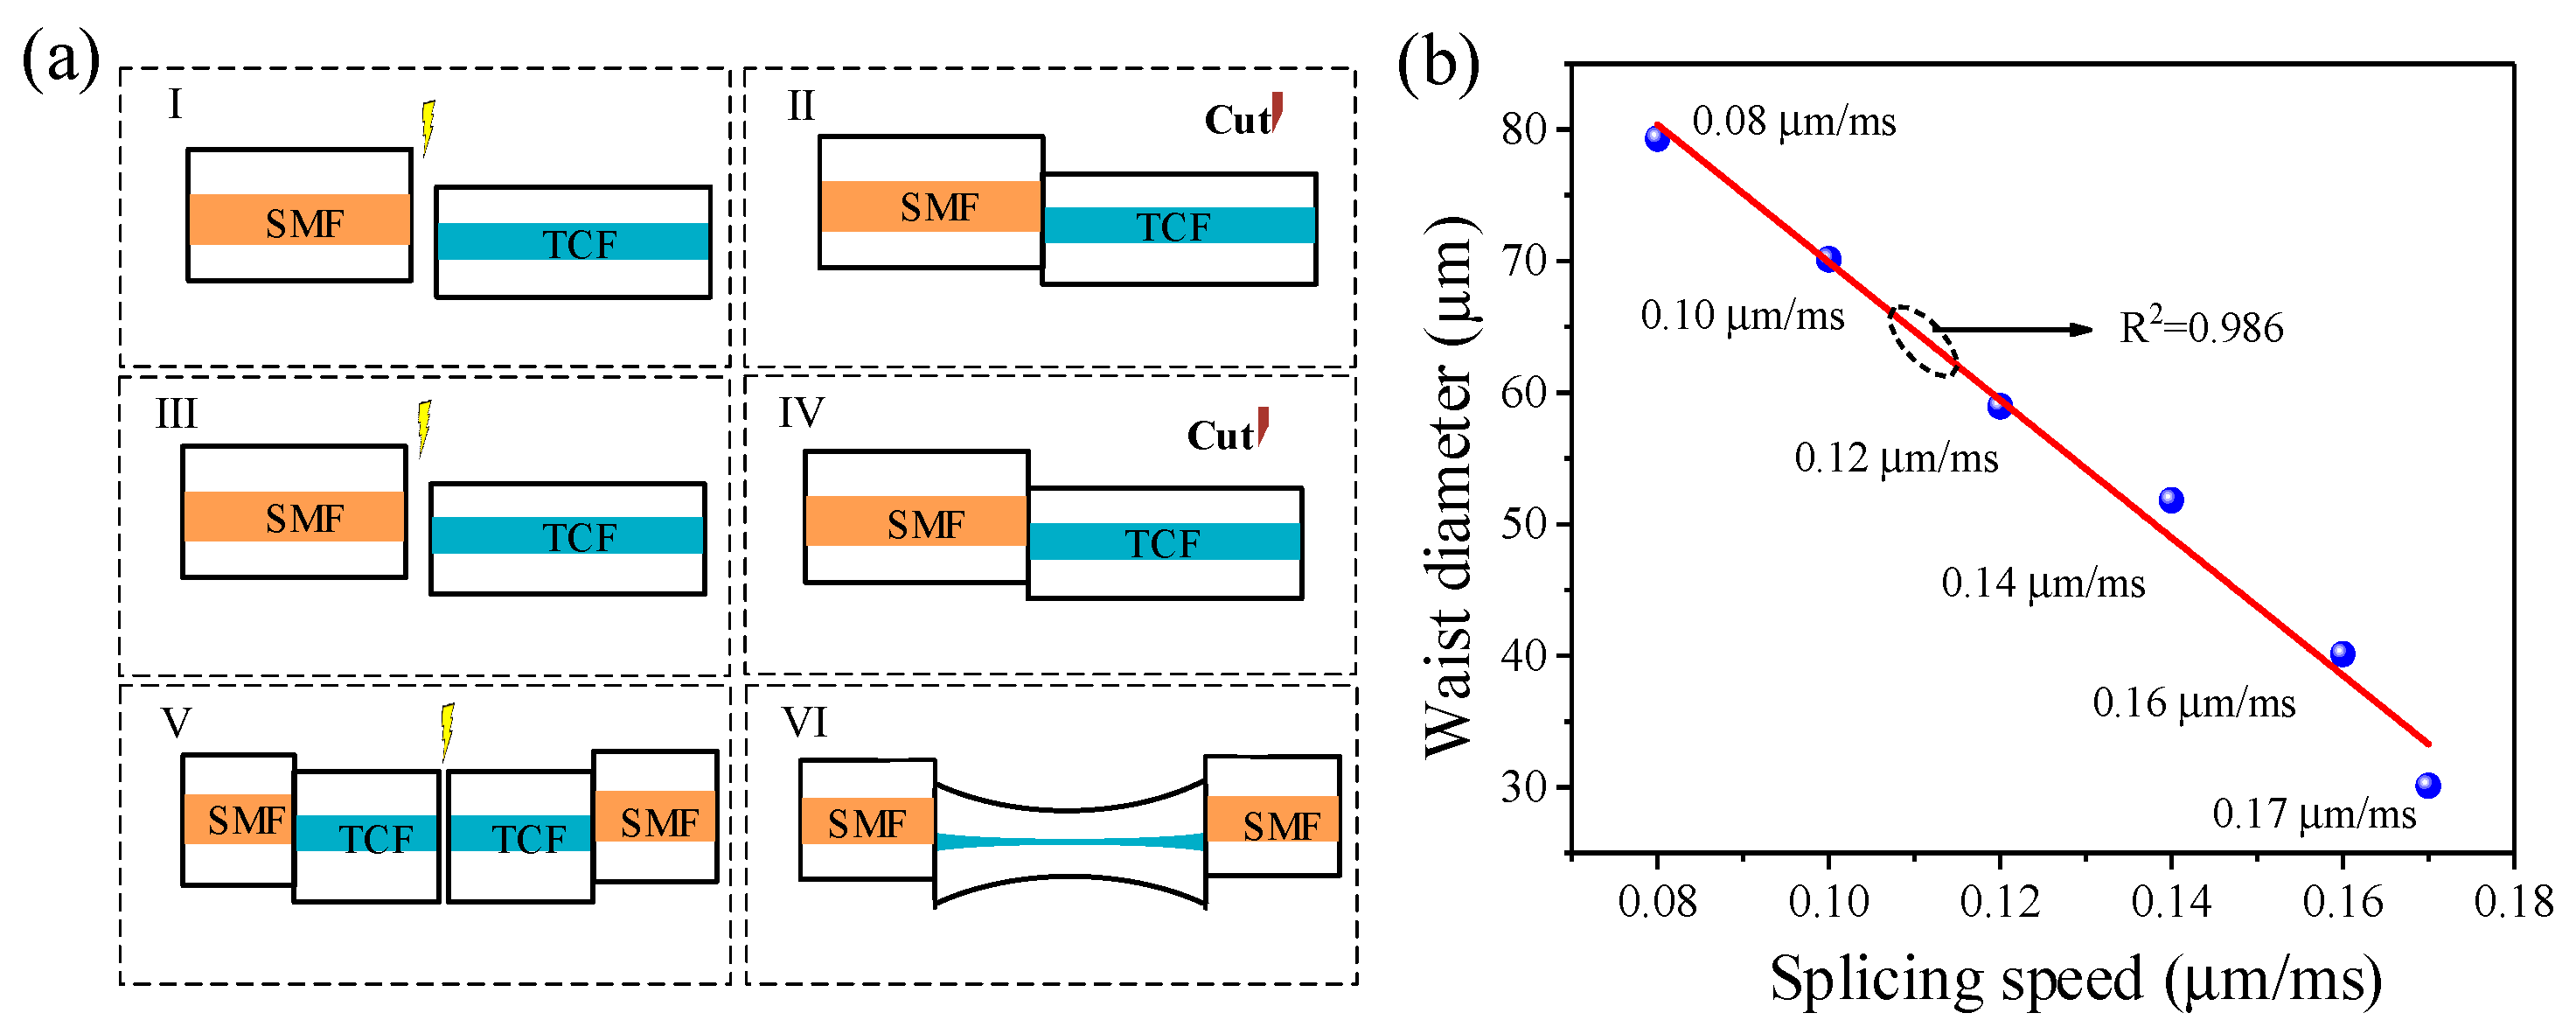
3. Simulation and Fabrication
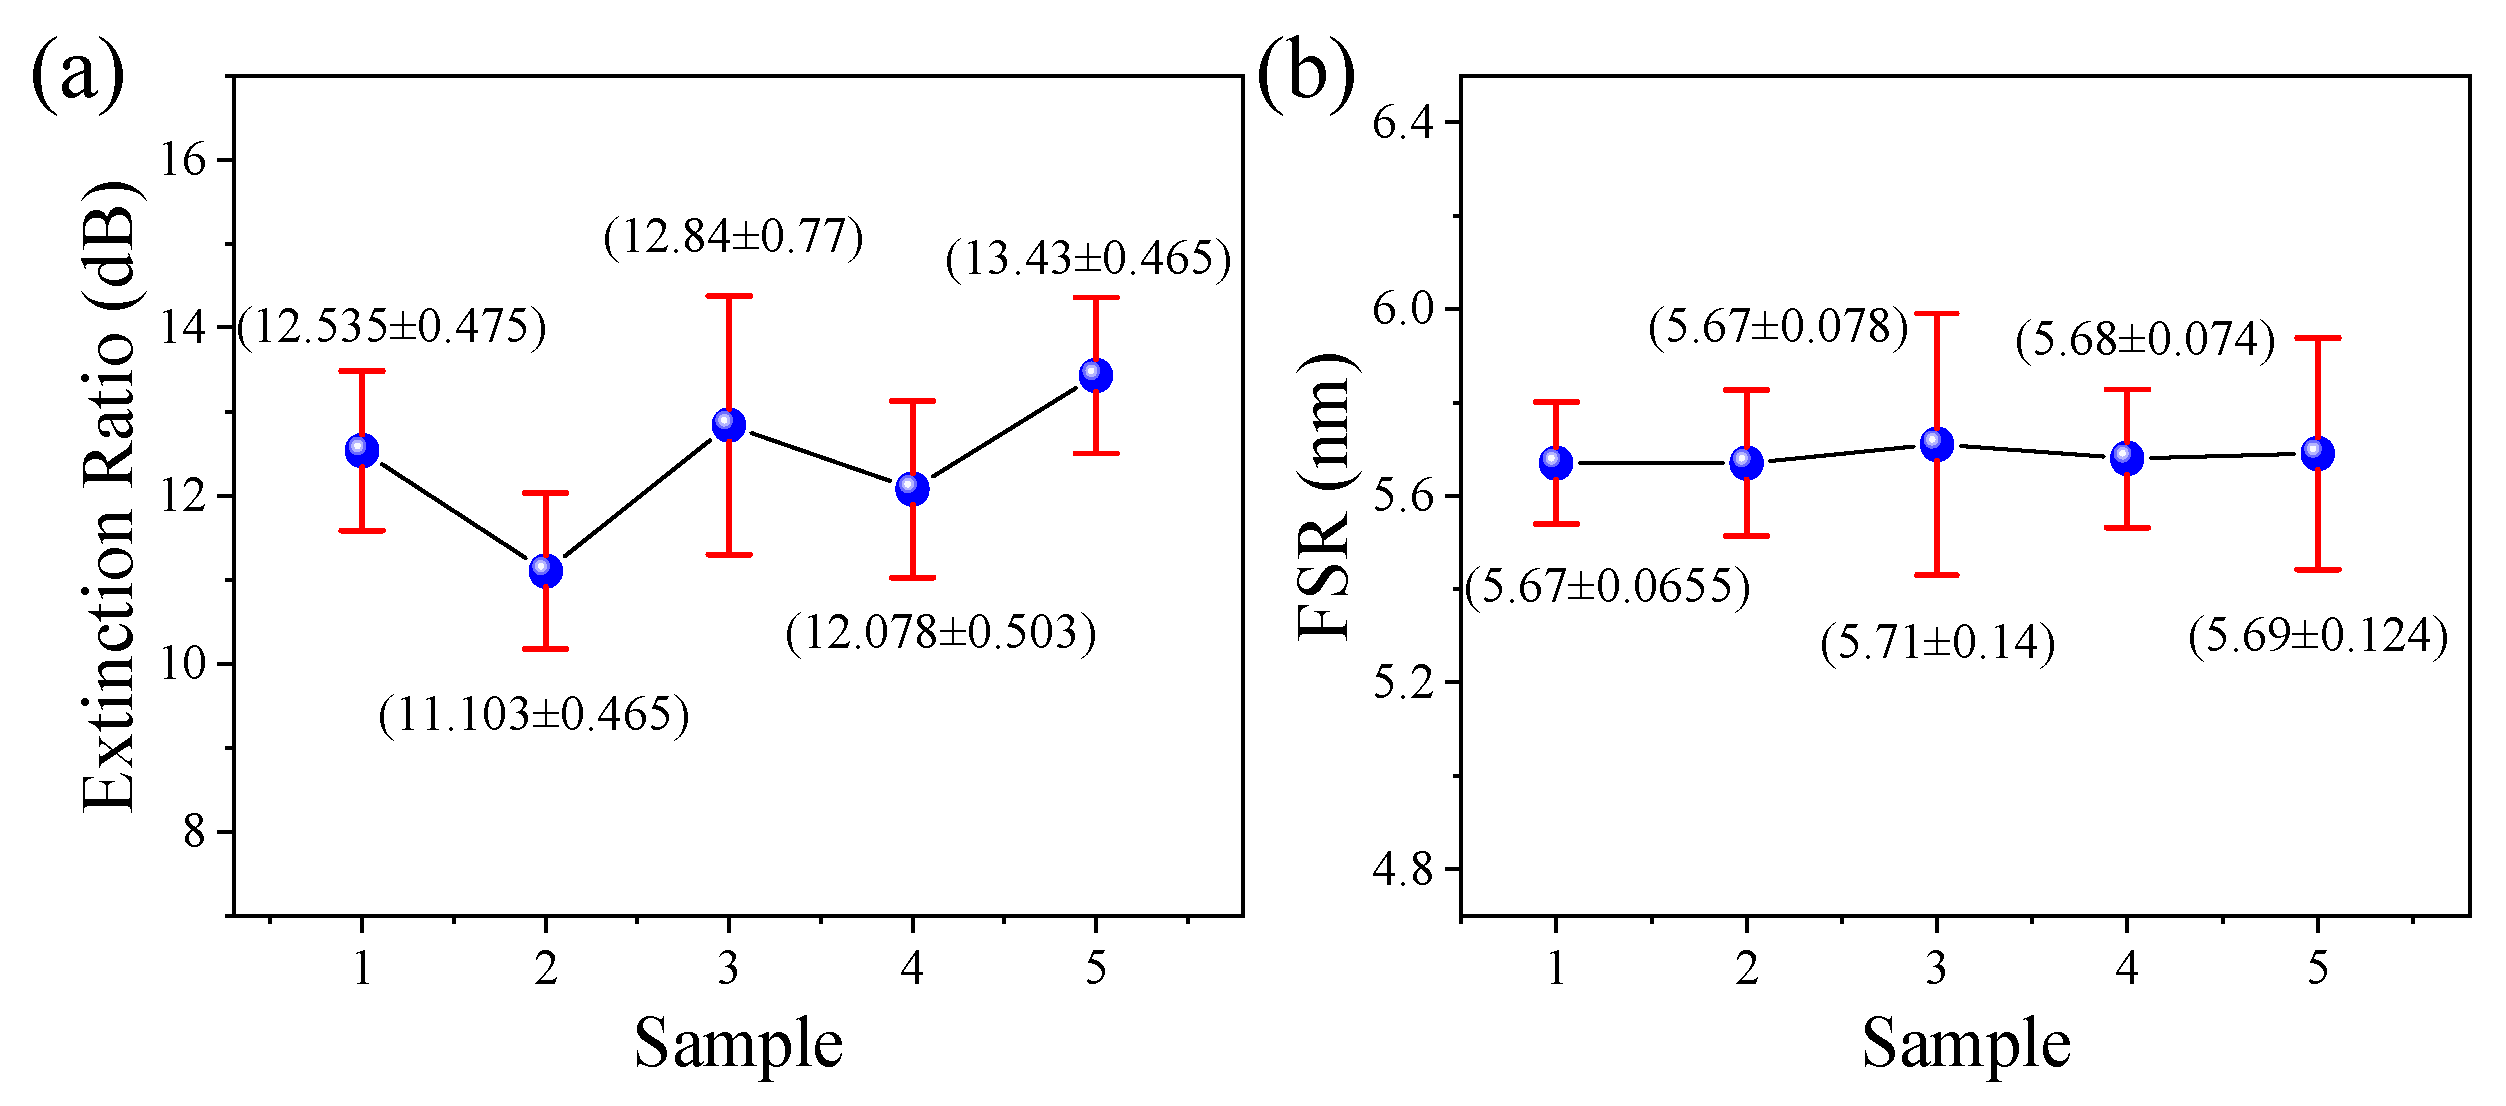
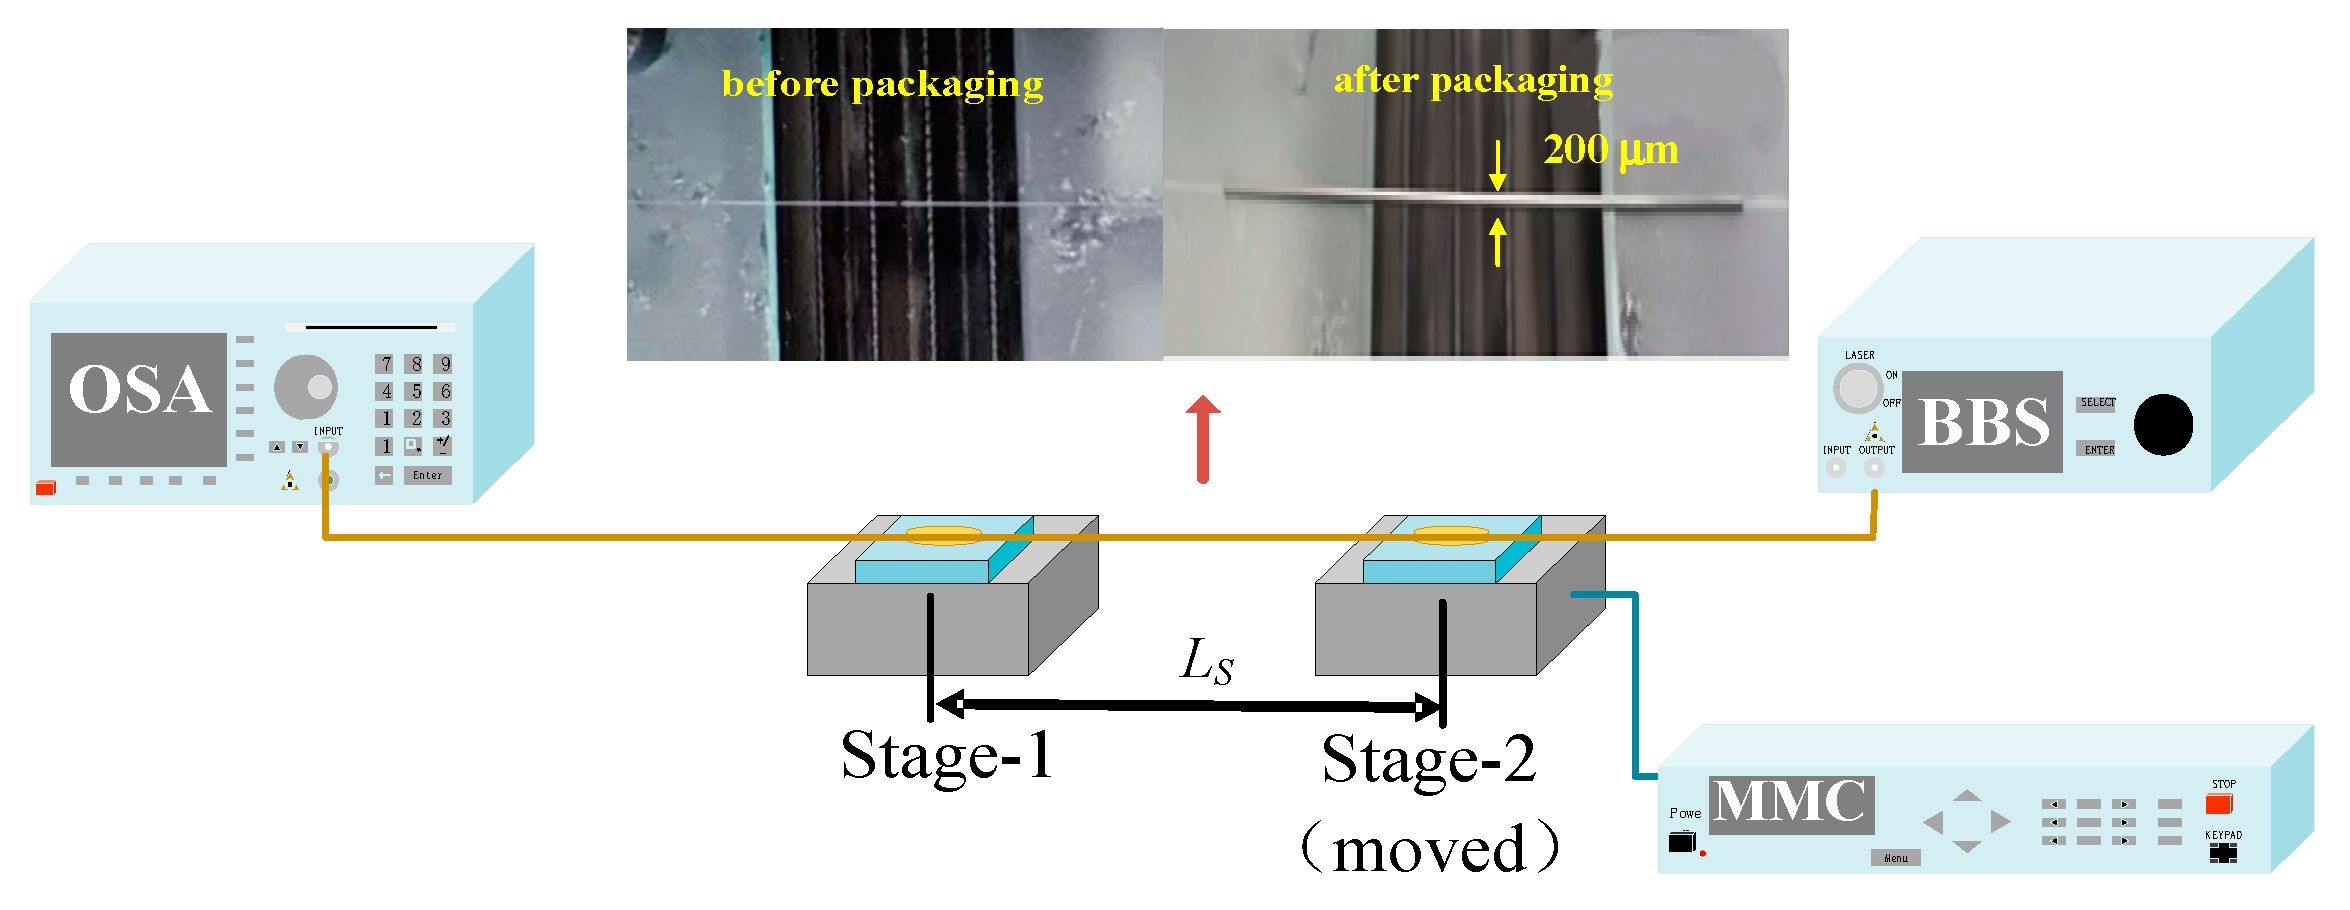
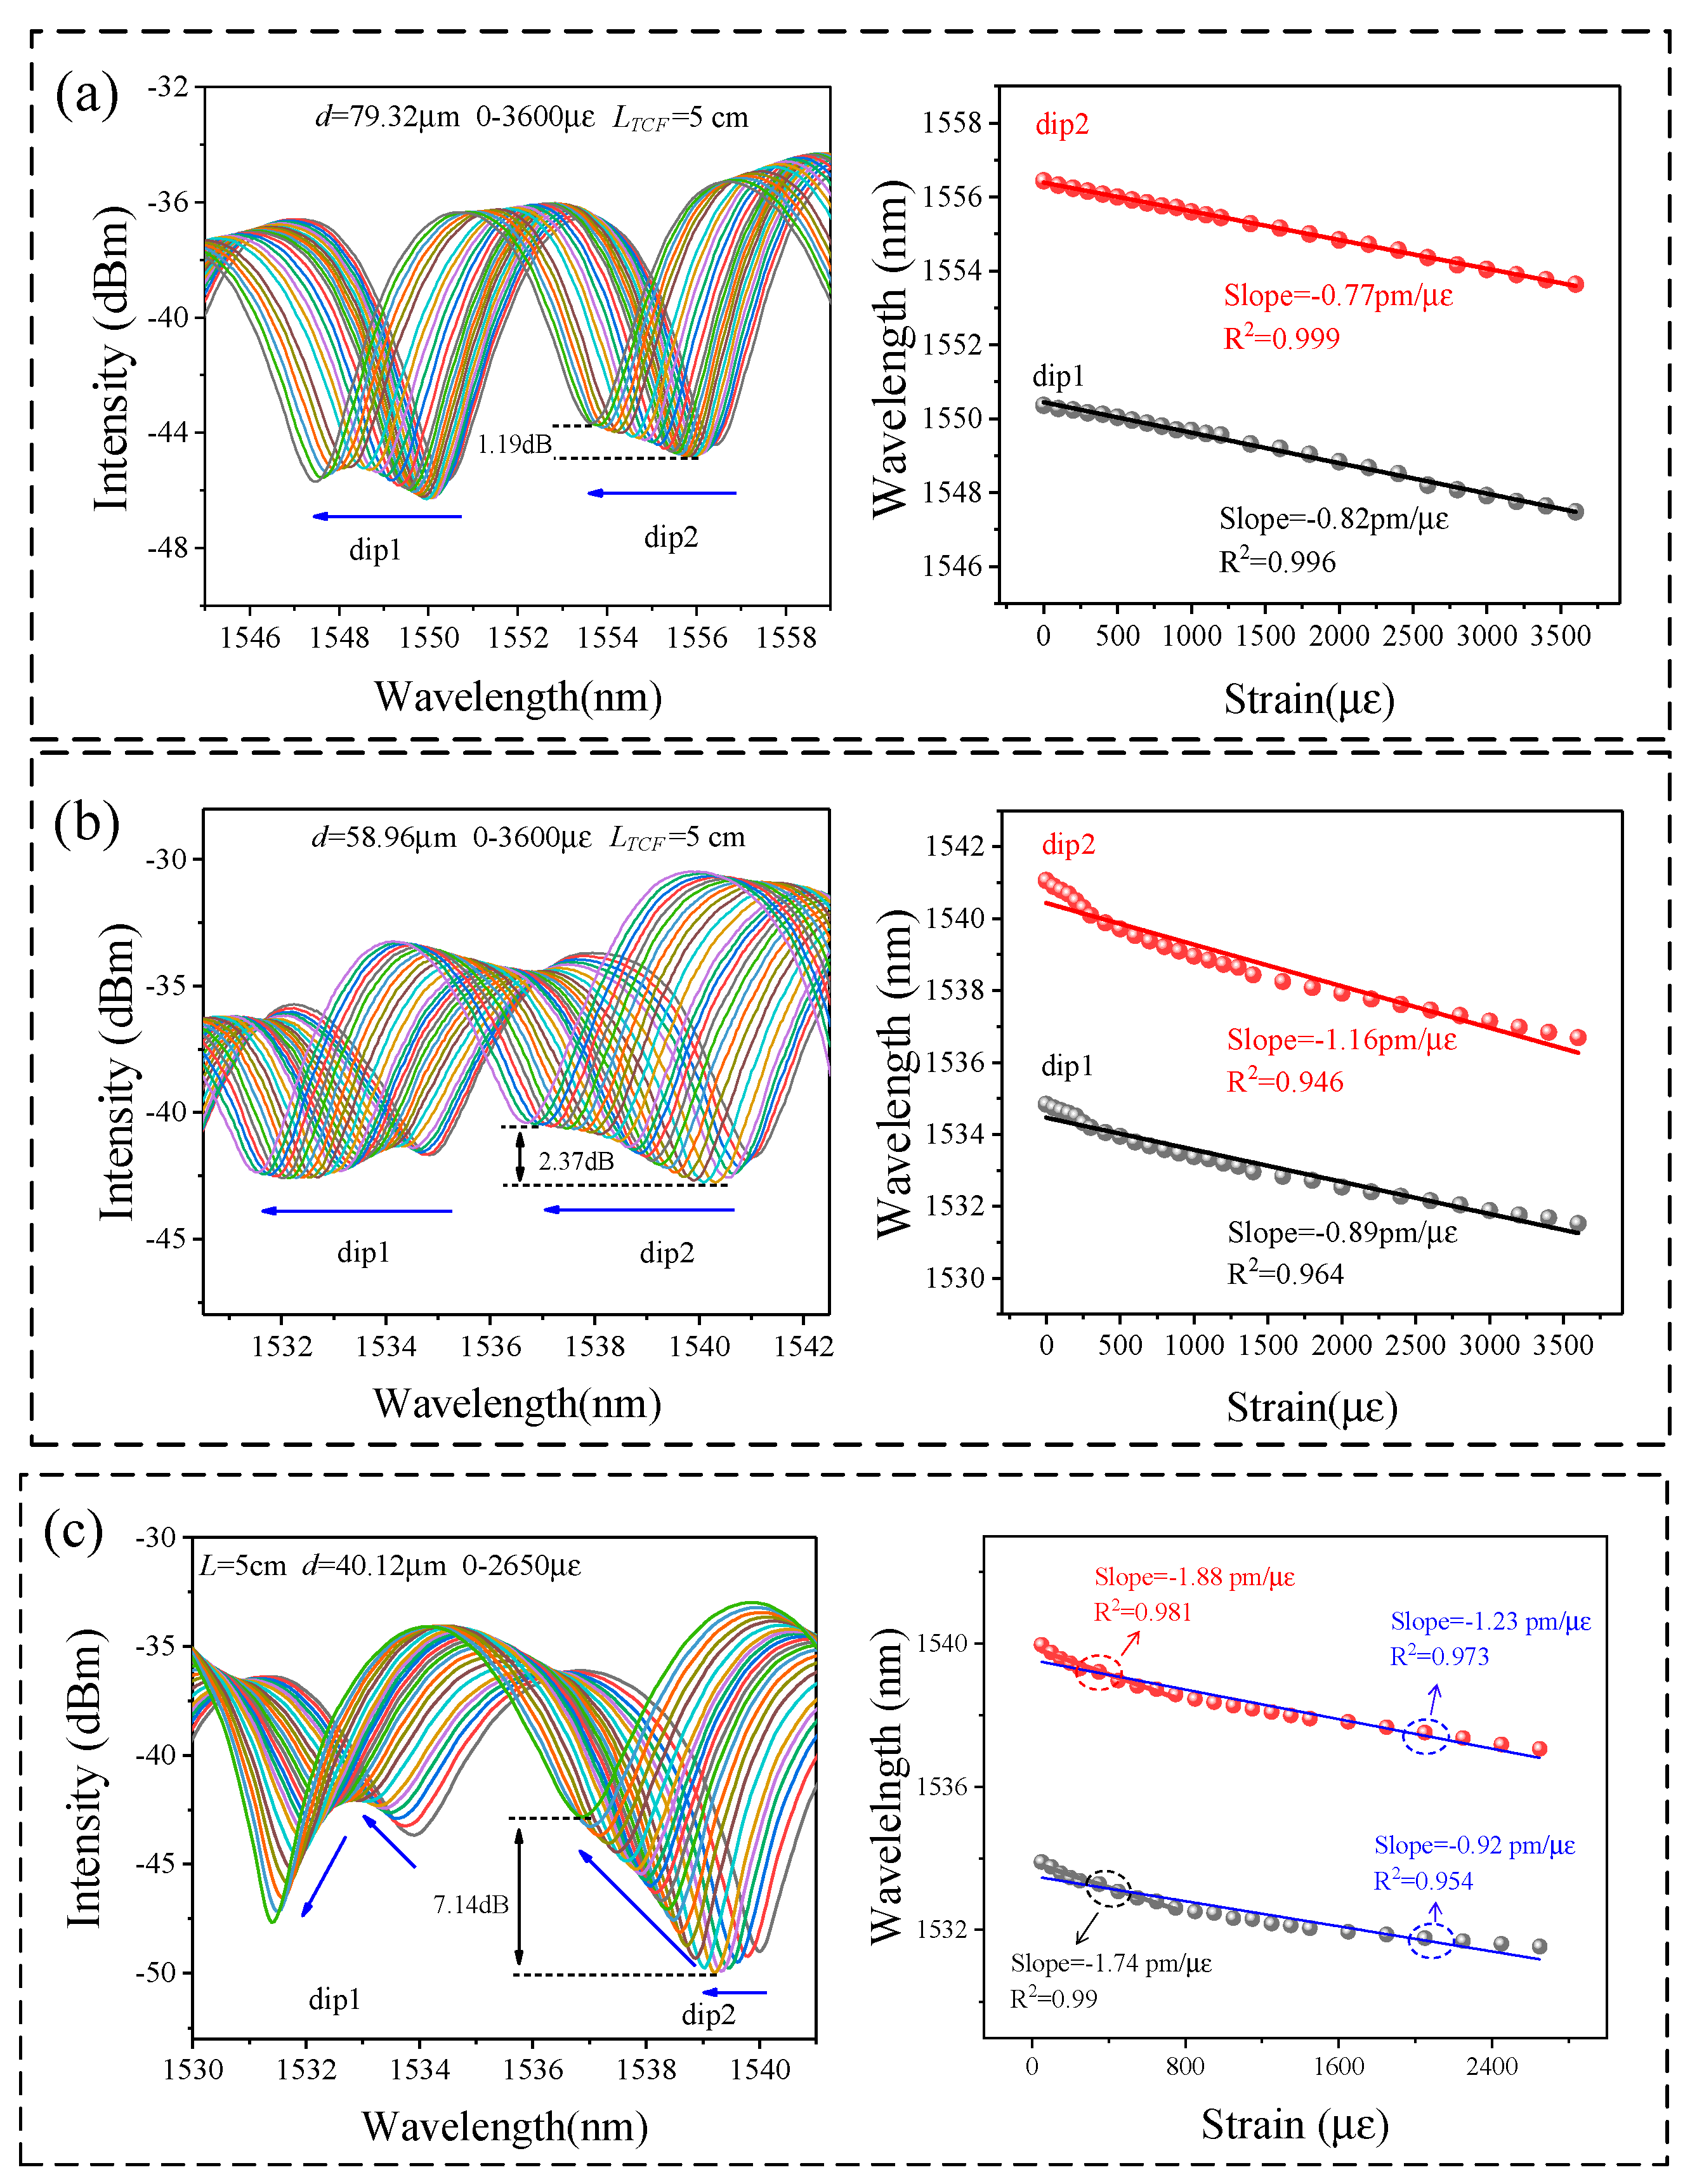
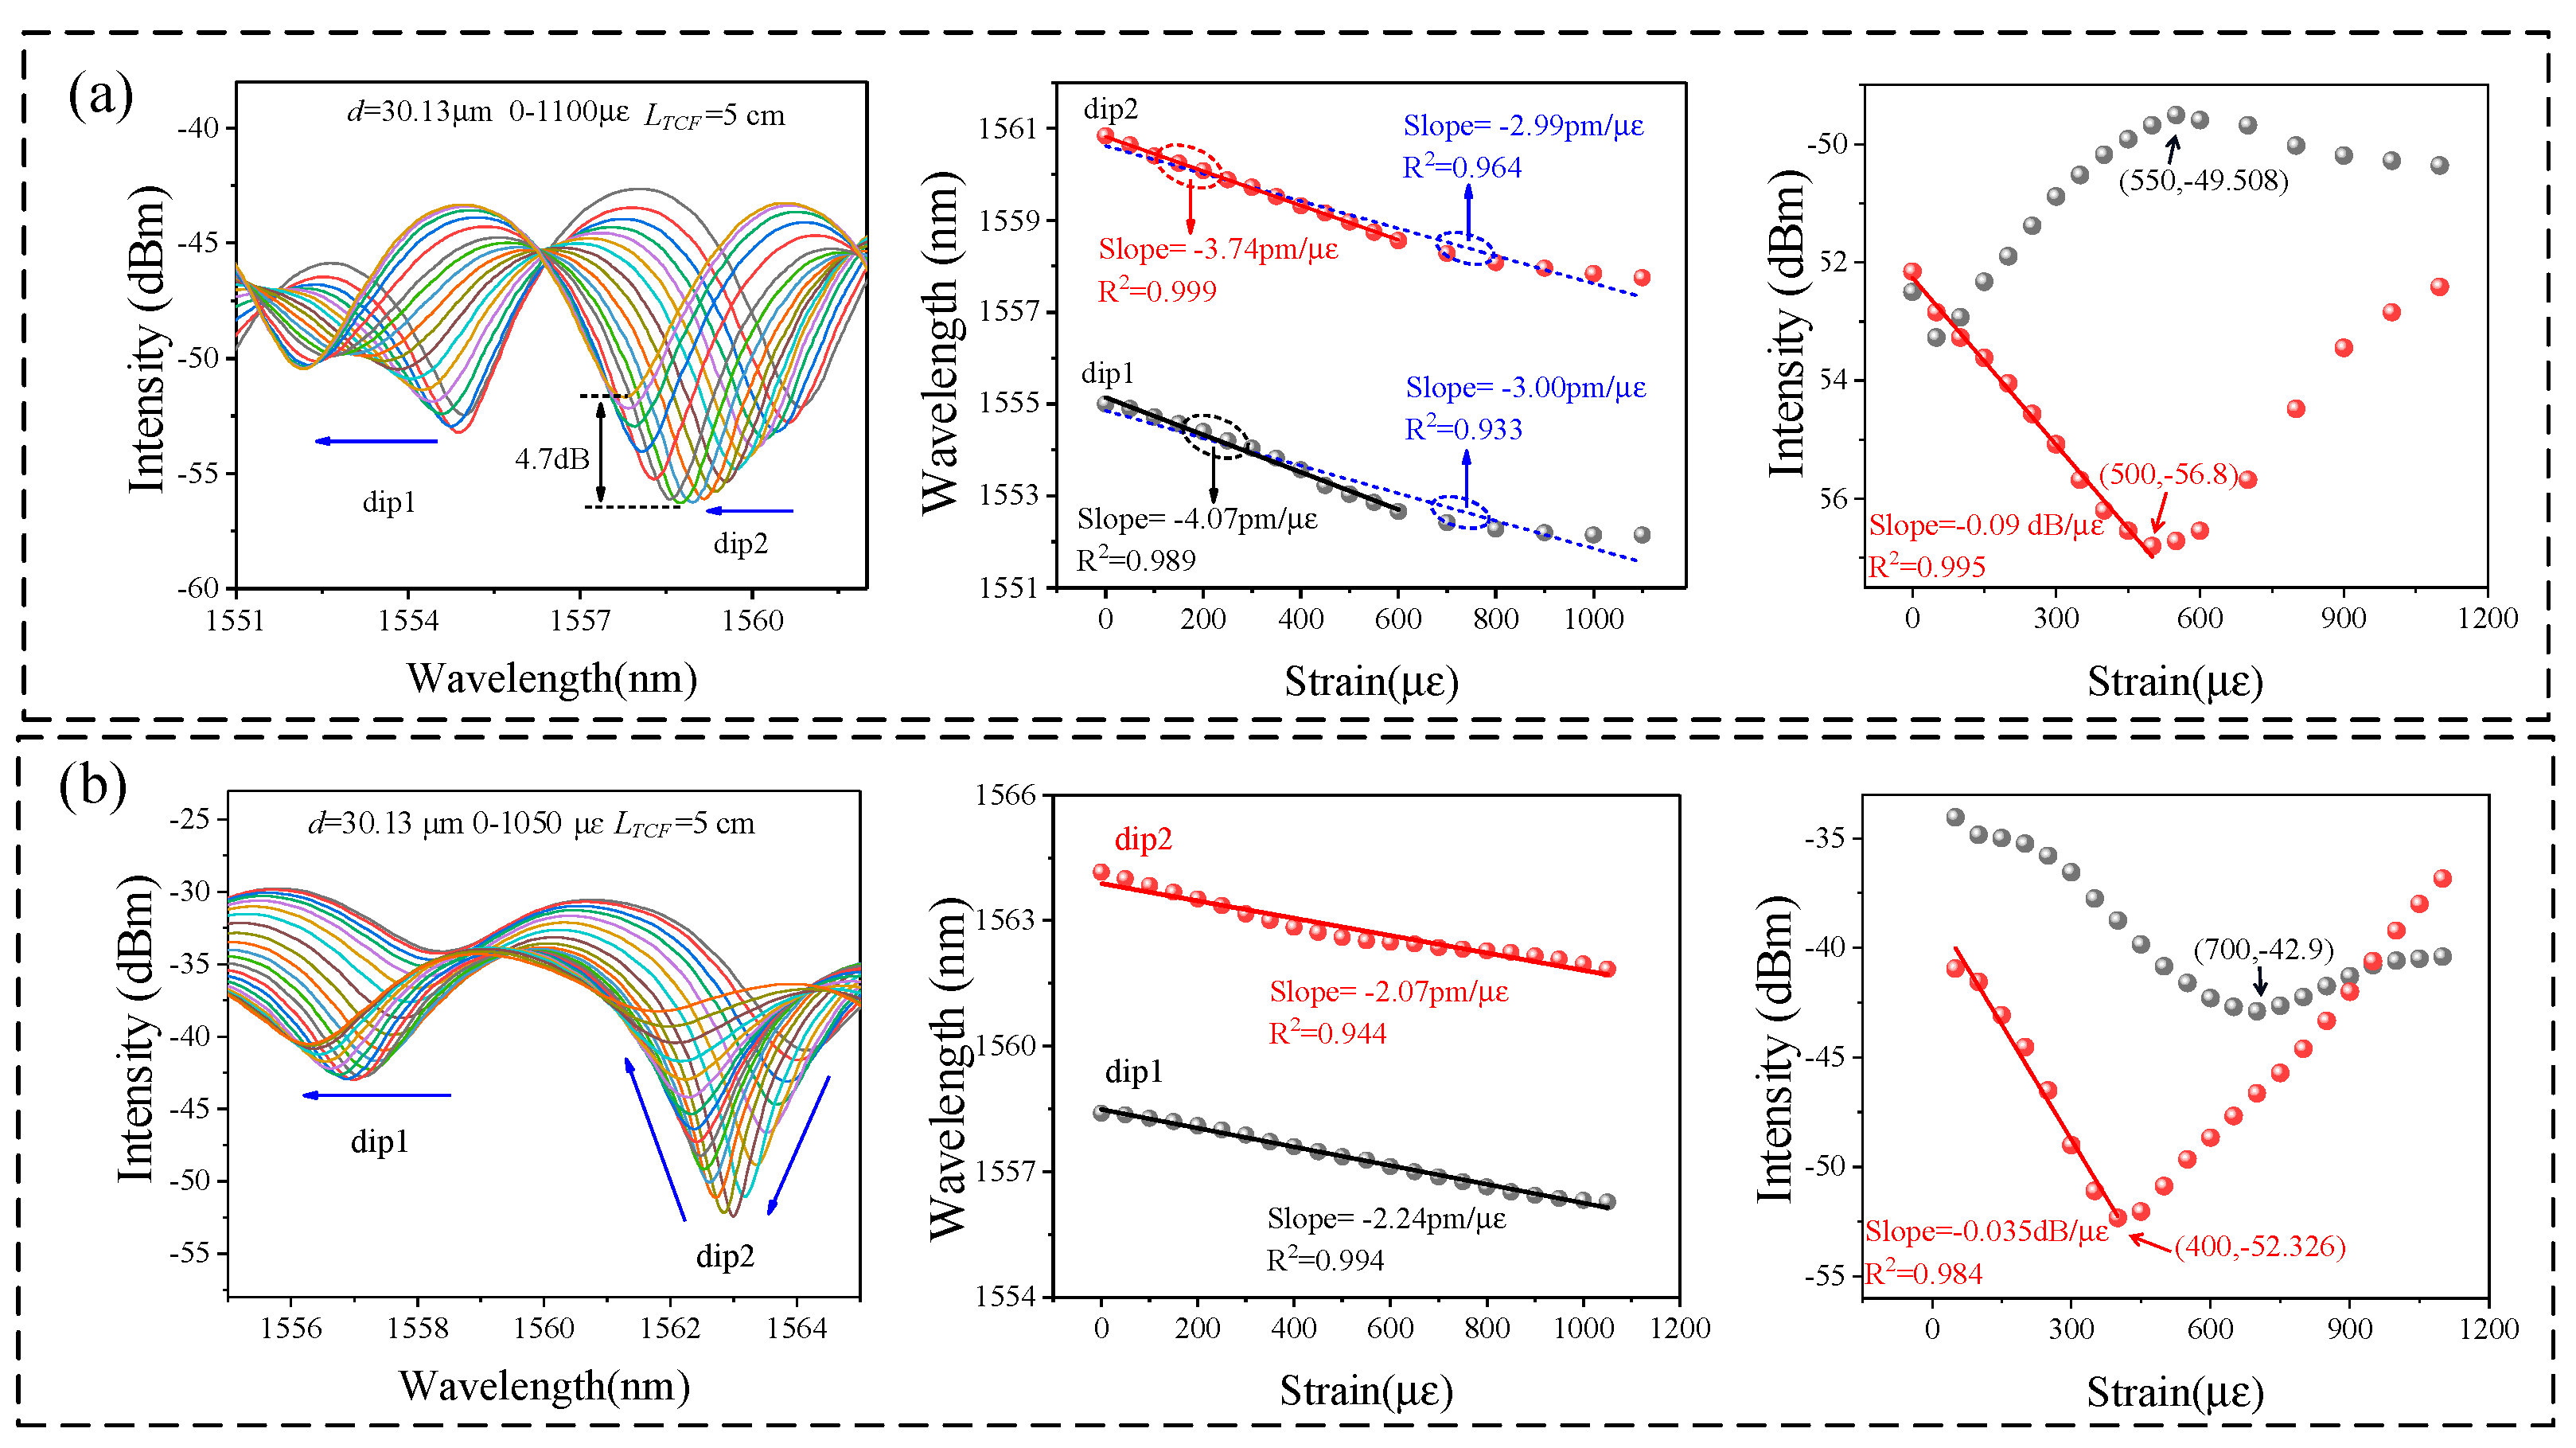
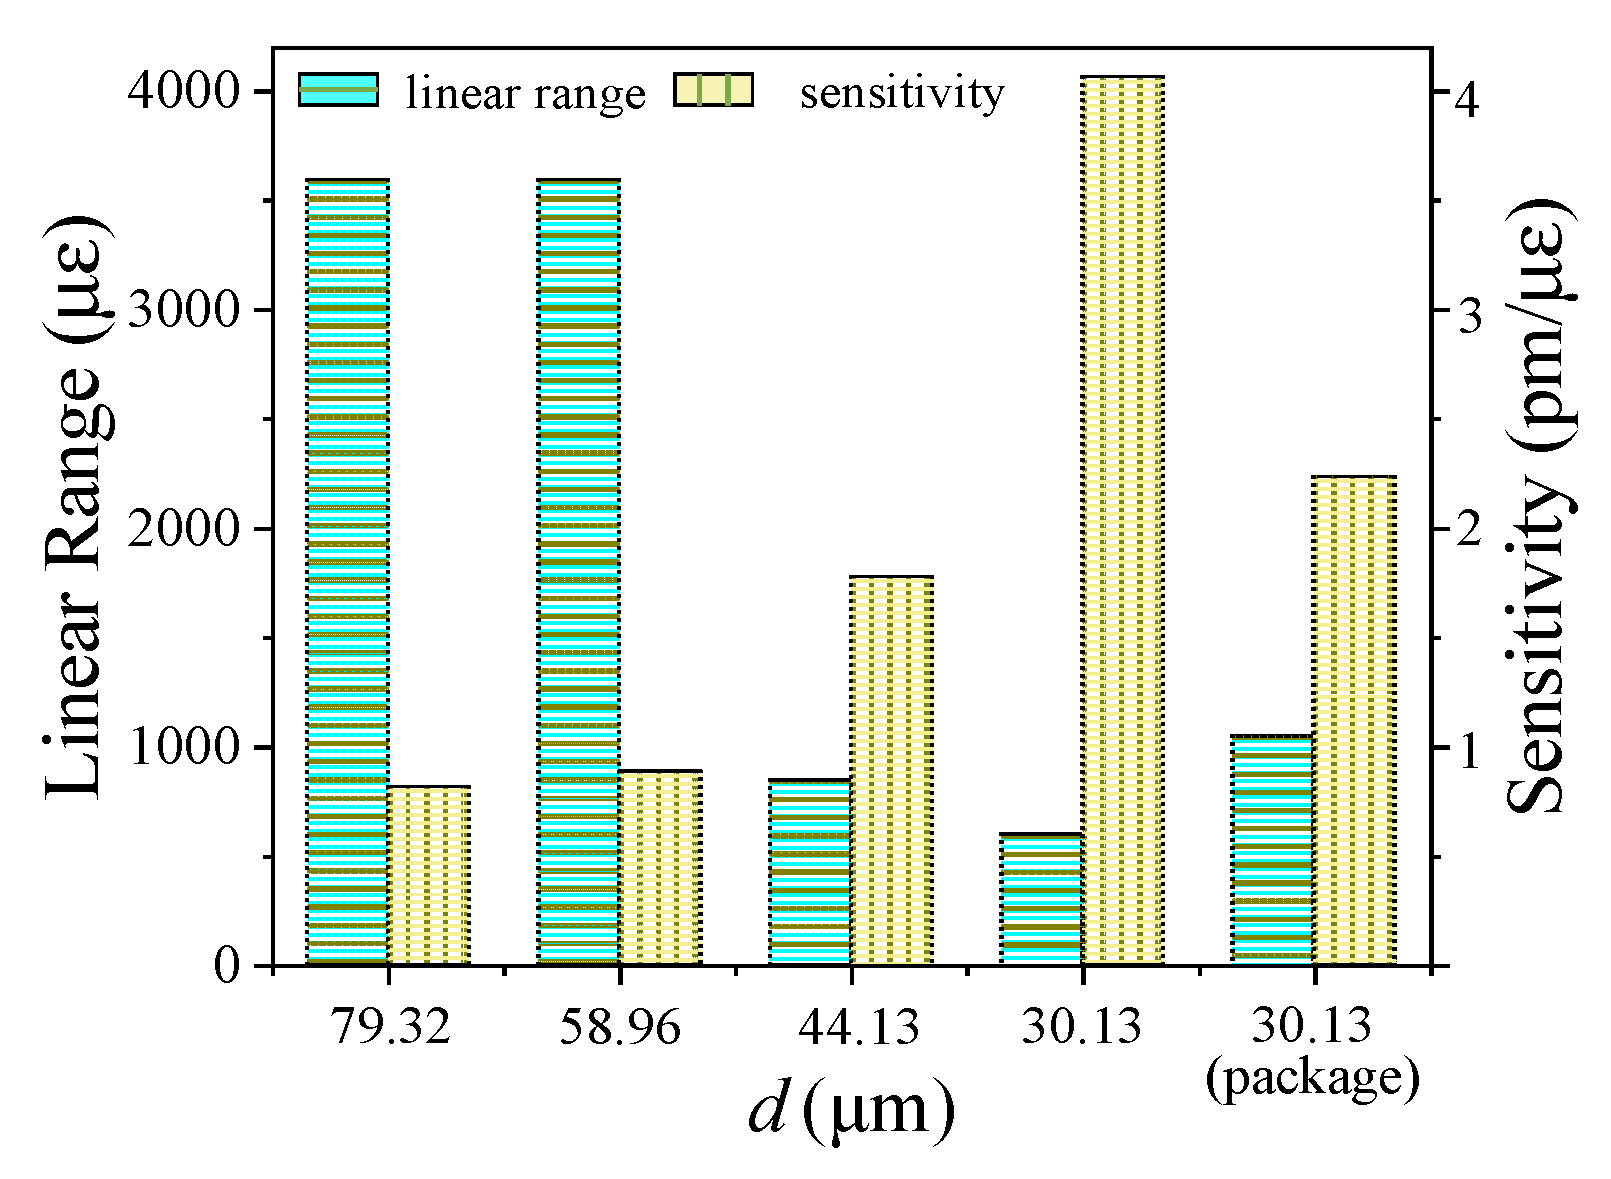
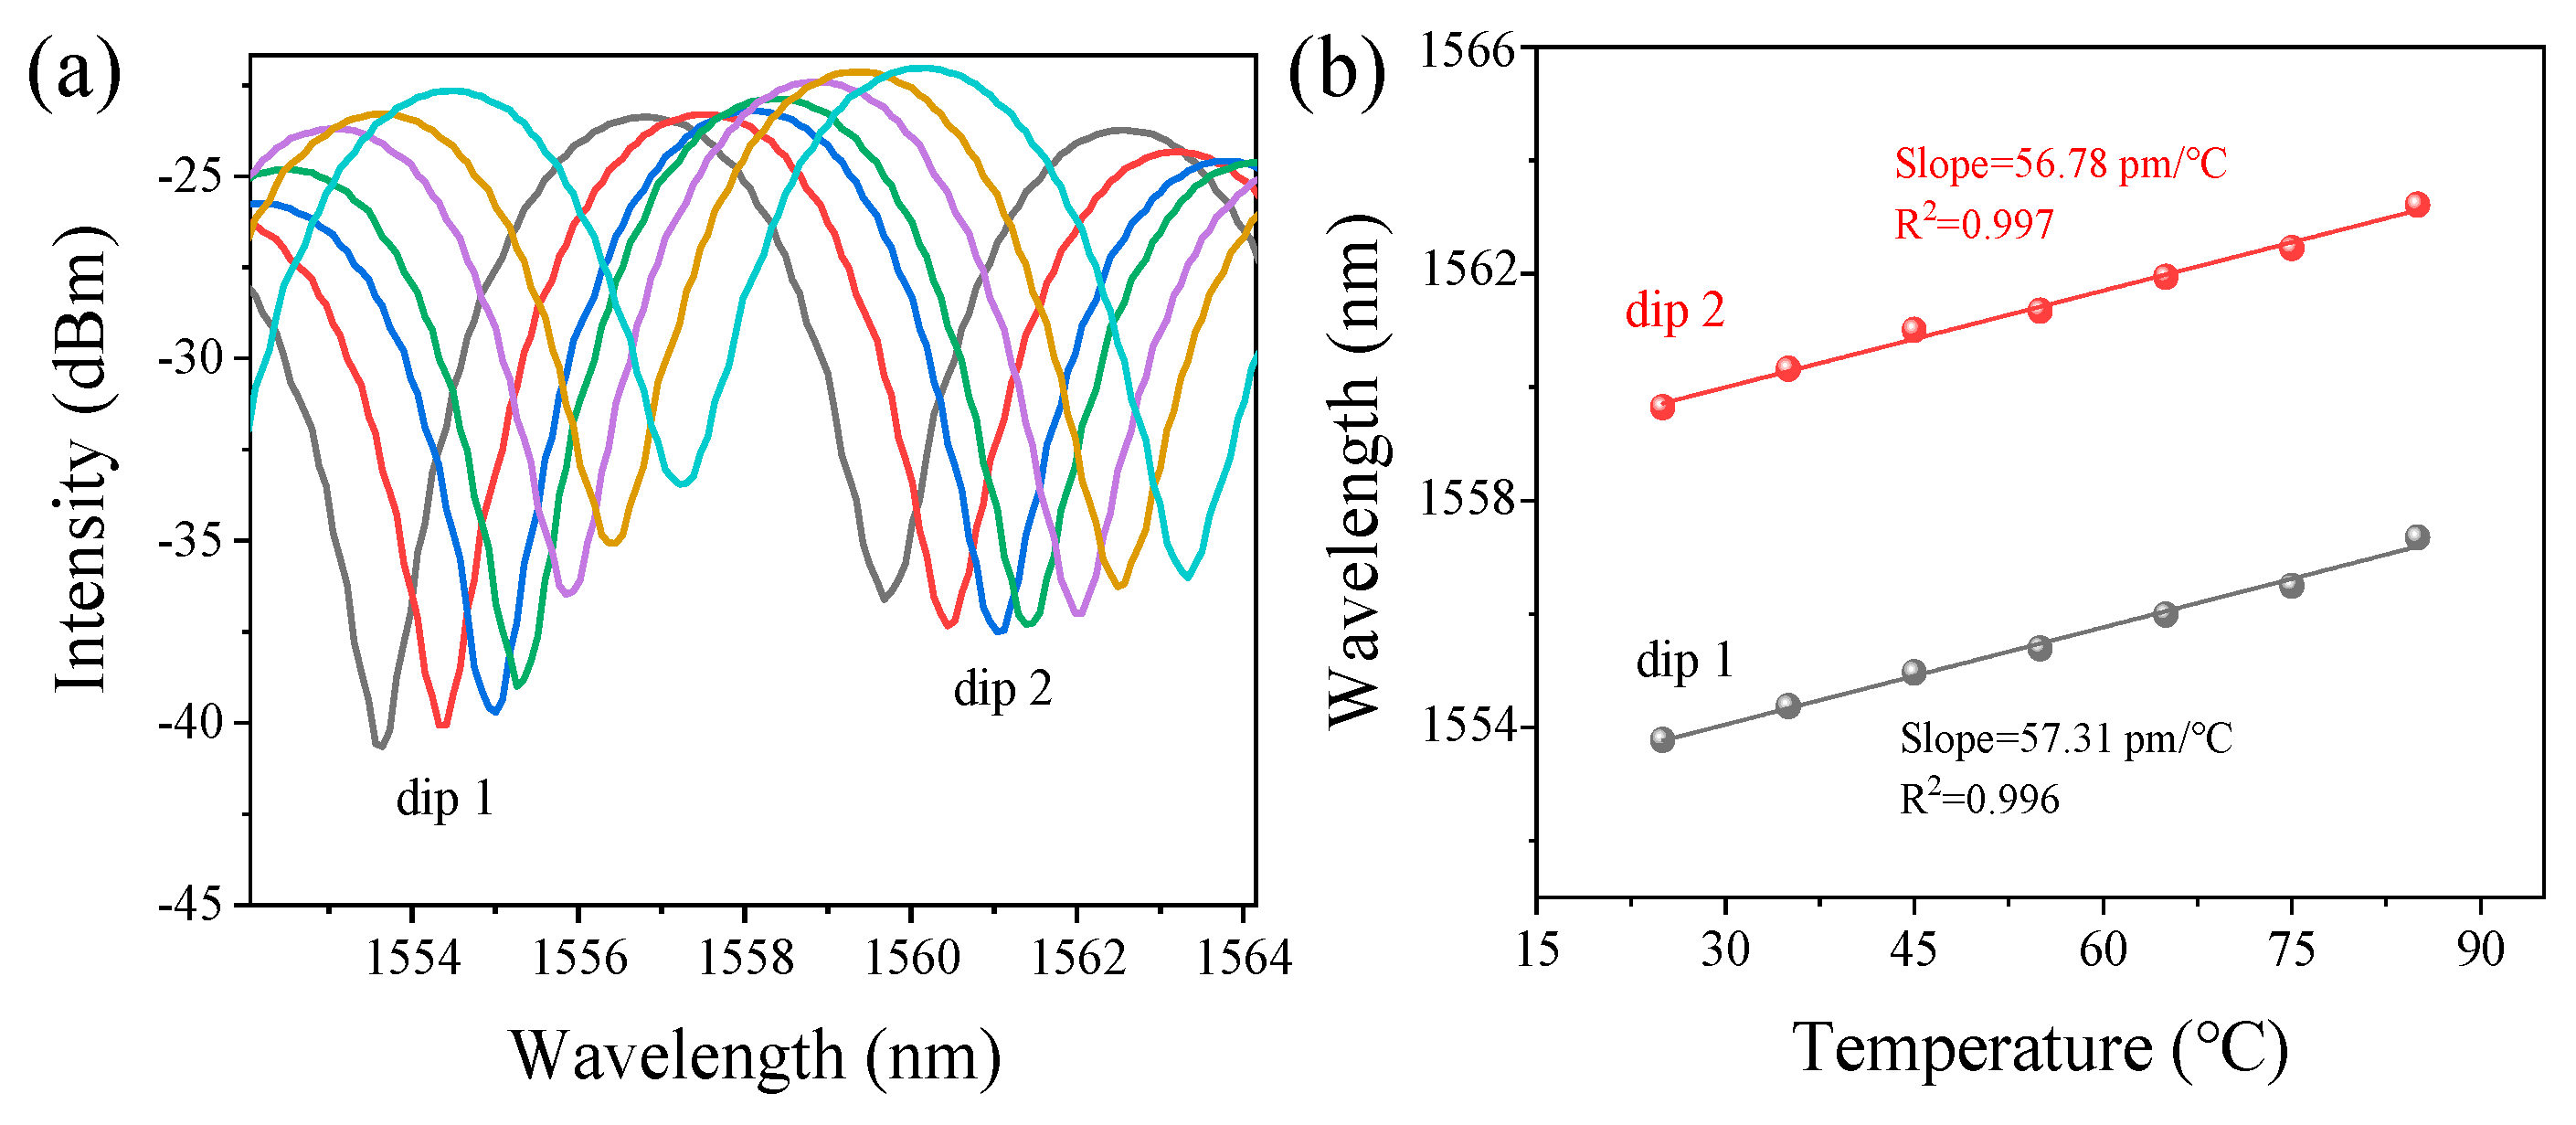
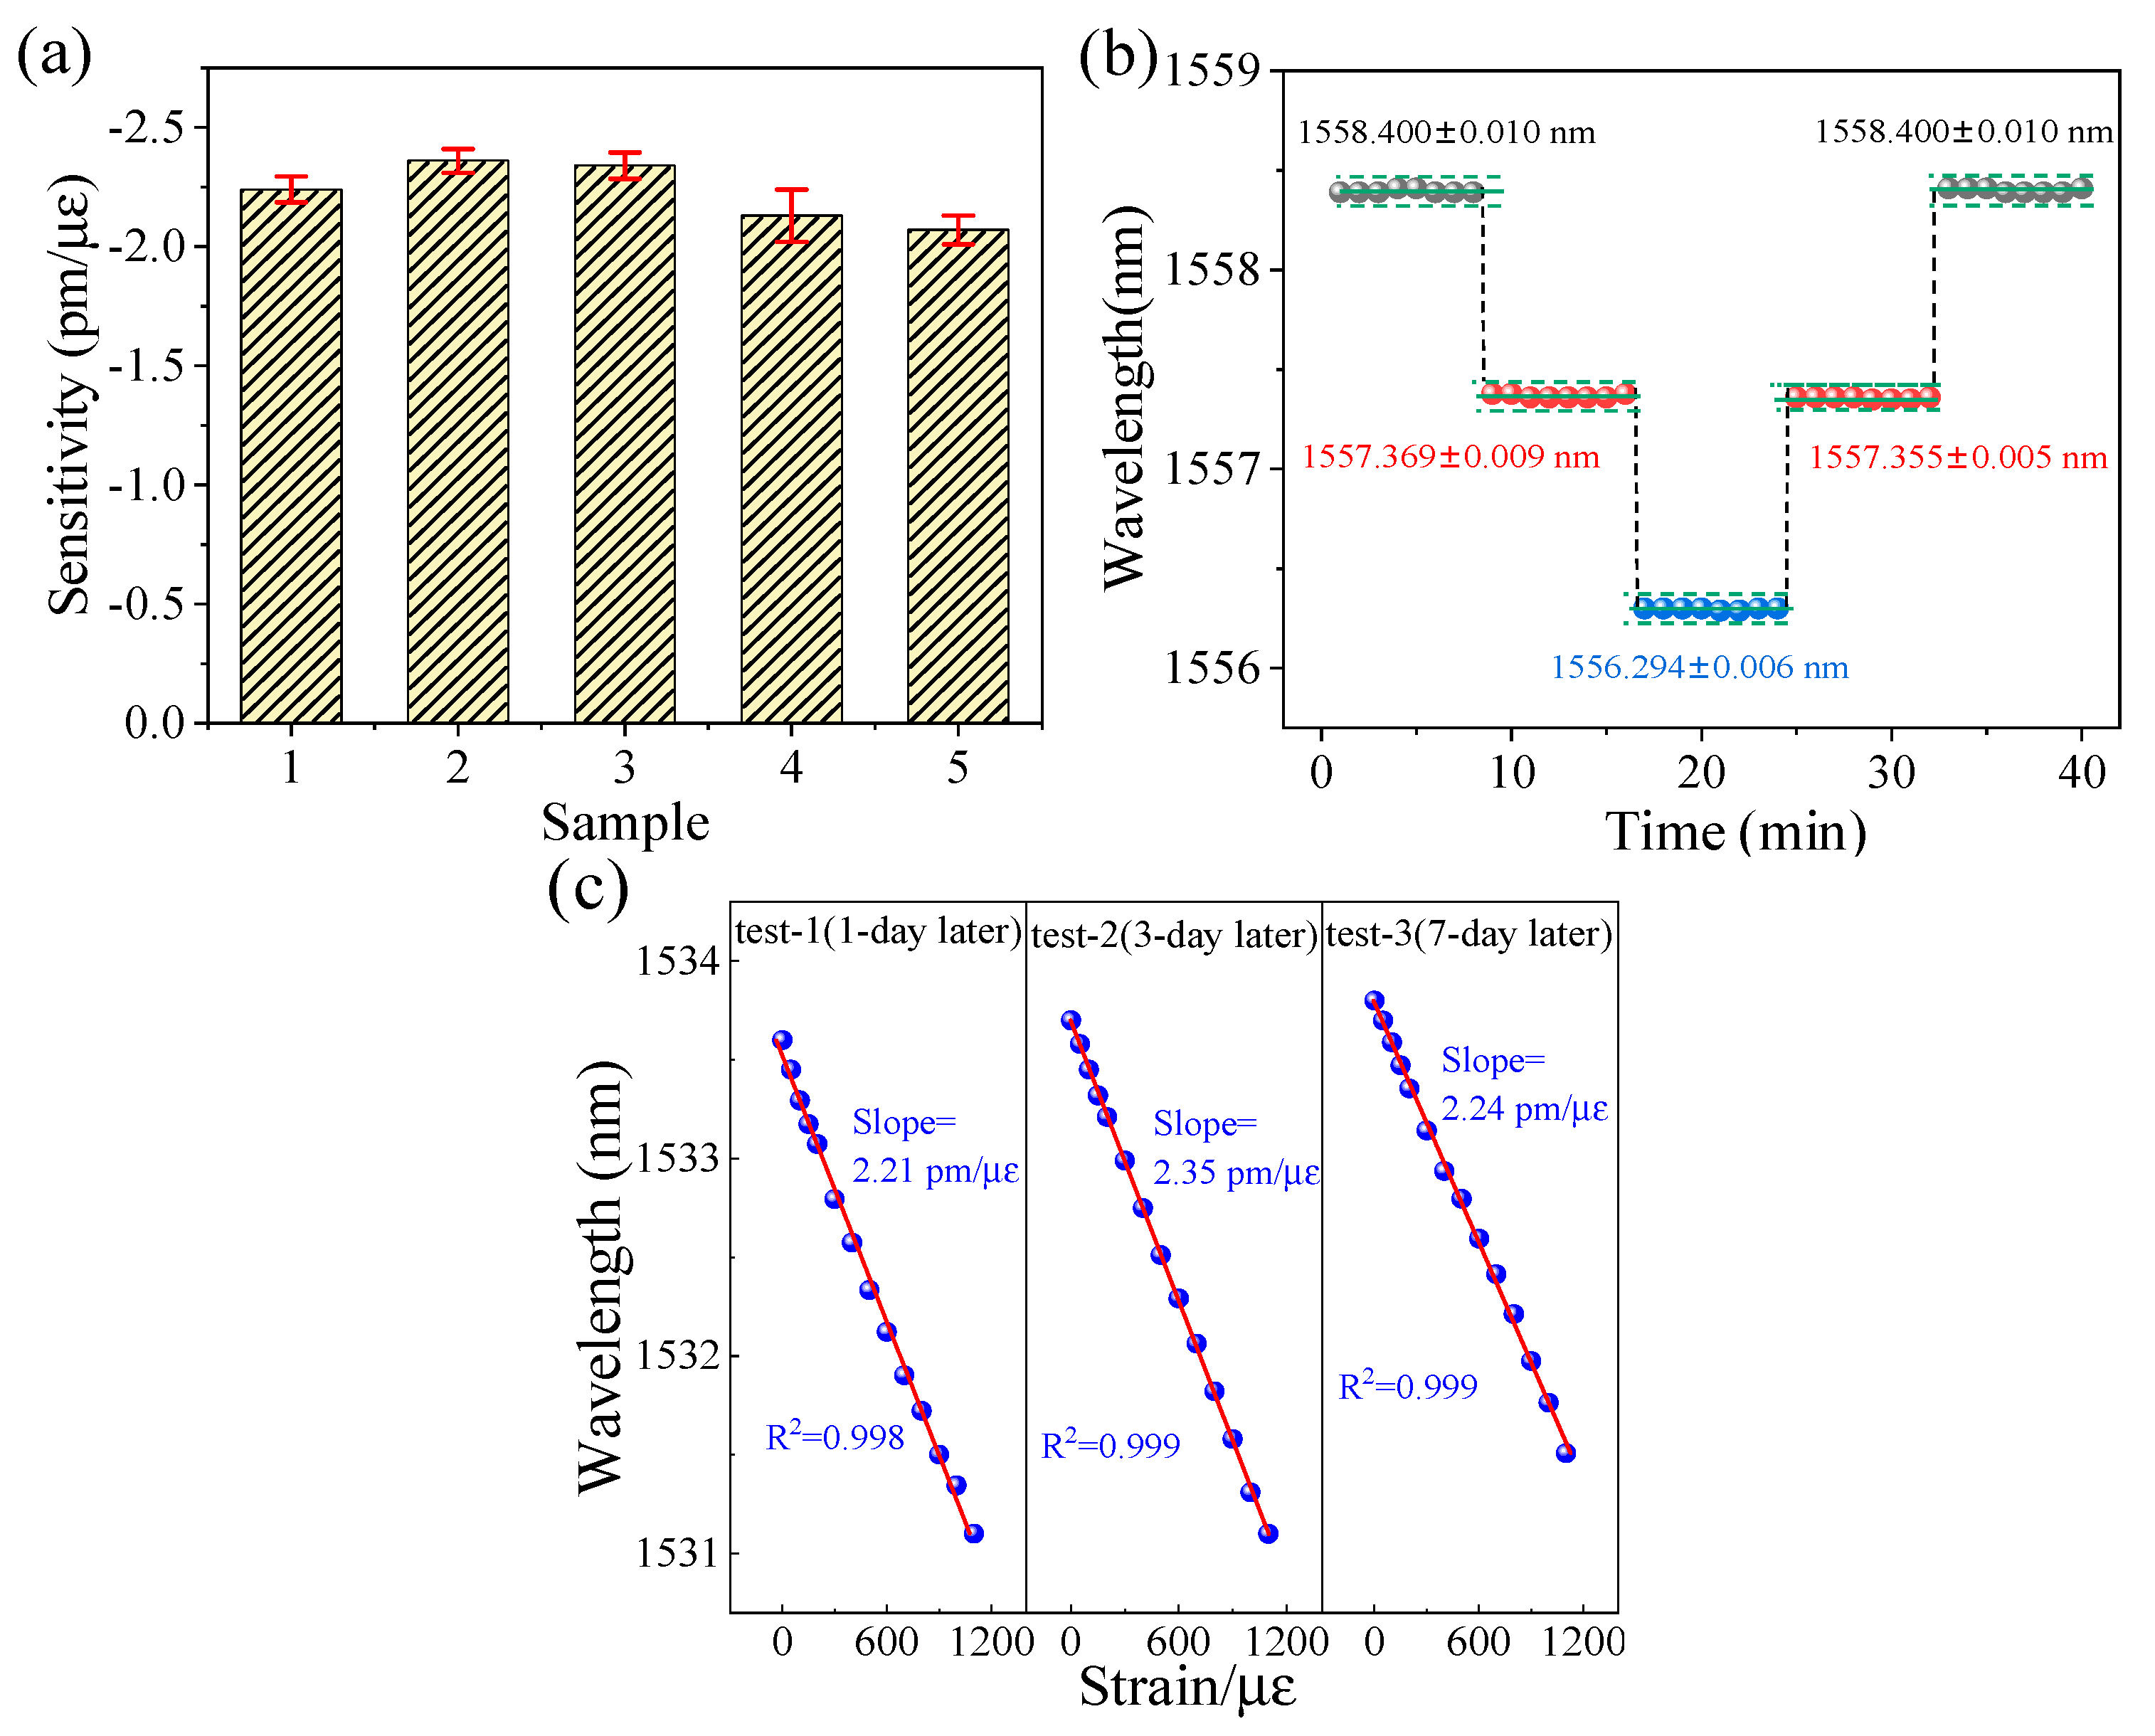
4. Experiments and Results
5. Discussion
6. Conclusions
Author Contributions
Funding
Institutional Review Board Statement
Informed Consent Statement
Data Availability Statement
Conflicts of Interest
References
- Massaroni, C.; Saccomandi, P.; Formica, D.; Presti, D.L.; Caponero, M.A.; Di Tomaso, G.; Giurazza, F.; Muto, M.; Schena, E. Design and Feasibility Assessment of a Magnetic Resonance-Compatible Smart Textile Based on Fiber Bragg Grating Sensors for Respiratory Monitoring. IEEE Sens. J. 2016, 16, 8103–8110. [Google Scholar] [CrossRef]
- Gong, Z.; Xiang, Z.; OuYang, X.; Zhang, J.; Lau, N.; Zhou, J.; Chan, C.C. Wearable Fiber Optic Technology Based on Smart Textile: A Review. Materials 2019, 12, 3311. [Google Scholar] [CrossRef] [PubMed]
- Koyama, Y.; Nishiyama, M.; Watanabe, K. Smart Textile Using Hetero-Core Optical Fiber for Heartbeat and Respiration Monitoring. IEEE Sens. J. 2018, 18, 6175–6180. [Google Scholar] [CrossRef]
- Xiao, F.; Chen, G.S.; Hulsey, J.L. Monitoring bridge dynamic responses using fiber Bragg grating tiltmeters. Sensors 2017, 17, 2390. [Google Scholar] [CrossRef]
- Feng, W.; Yang, X.; Yu, J.; Yue, Z. Strain and temperature sensor based on fiber Bragg grating cascaded bi-tapered four-core fiber Mach–Zehnder interferometer. J. Phys. D Appl. Phys. 2020, 53, 465104. [Google Scholar] [CrossRef]
- Campanella, C.E.; Cuccovillo, A.; Campanella, C.; Yurt, A.; Passaro, V.M.N. Fibre Bragg Grating Based Strain Sensors: Review of Technology and Applications. Sensors 2018, 18, 3115. [Google Scholar] [CrossRef] [PubMed]
- Ascorbe, J.; Coelho, L.; Santos, J.L.; Frazao, O.; Corres, J.M. Temperature Compensated Strain Sensor Based on Long-Period Gratings and Microspheres. IEEE Photonics Technol. Lett. 2018, 30, 67–70. [Google Scholar] [CrossRef]
- Wang, Y. Review of long period fiber gratings written by CO2 laser. J. Appl. Phys. 2010, 108, 081101. [Google Scholar] [CrossRef]
- Dash, J.N.; Negi, N.; Jha, R. Graphene Oxide Coated PCF Interferometer for Enhanced Strain Sensitivity. J. Light. Technol. 2017, 35, 5385–5390. [Google Scholar] [CrossRef]
- Hu, L.M.; Chan, C.C.; Dong, X.Y.; Wang, Y.P.; Zu, P.; Wong, W.C.; Qian, W.W.; Li, T. Photonic crystal fiber strain sensor based on modified Mach-Zehnder interferometer. IEEE Photonics J. 2012, 4, 114–118. [Google Scholar] [CrossRef]
- Dong, L.; Gang, T.; Bian, C.; Tong, R.; Wang, J.; Hu, M. A high sensitivity optical fiber strain sensor based on hollow core tapering. Opt. Fiber Technol. 2020, 56, 102179. [Google Scholar] [CrossRef]
- Zhang, C.; Ning, T.; Zheng, J.; Xu, J.; Gao, X.; Lin, H.; Li, J.; Pei, L. An optical fiber strain sensor by using of taper based TCF structure. Opt. Laser Technol. 2019, 120, 105687. [Google Scholar] [CrossRef]
- Zhang, X.; Liu, C.; Liu, J.; Yang, J. Single Modal Interference-Based Fiber-Optic Sensor for Simultaneous Measurement of Curvature and Strain with Dual-Differential Temperature Compensation. IEEE Sens. J. 2018, 18, 8375–8380. [Google Scholar] [CrossRef]
- Korposh, S.; James, S.; Lee, S.-W.; Tatam, R. Tapered Optical Fibre Sensors: Current Trends and Future Perspectives. Sensors 2019, 19, 2294. [Google Scholar] [CrossRef]
- Wieduwilt, T.; Brückner, S.; Bartelt, H. High force measurement sensitivity with fiber Bragg gratings fabricated in uniform-waist fiber tapers. Meas. Sci. Technol. 2011, 22, 075201. [Google Scholar] [CrossRef]
- Li, P.; Fu, C.; Zhong, H.; Du, B.; Guo, K.; Meng, Y.; Du, C.; He, J.; Wang, L.; Wang, Y. A Nondestructive Measurement Method of Optical Fiber Young’s Modulus Based on OFDR. Sensors 2022, 22, 1450. [Google Scholar] [CrossRef] [PubMed]
- Largani, S.R.H.; Wen, H.-Y.; Chen, J.-L.; Chiang, C.-C. Photoresist-free, laser-assisted chemical etching process for long-period fiber grating. Opt. Express 2019, 27, 28606–28617. [Google Scholar] [CrossRef]
- Kadir, N.A.A.; Wahid, M.H.A.; Lokman, M.Q.; Irawati, N.; Hamzah, A.; Harun, S.W. Side-Polished Optical Fiber Structure for Sodium Nitrate Sensor. IEEE Sens. J. 2020, 20, 5929–5934. [Google Scholar] [CrossRef]
- Esposito, F.; Ranjan, R.; Campopiano, S.; Iadicicco, A. Arc-Induced Long Period Gratings from Standard to Polarization-Maintaining and Photonic Crystal Fibers. Sensors 2018, 18, 918. [Google Scholar] [CrossRef]
- Zhu, F.; Wang, Y.; Zhang, Z.; Liao, C.; Xu, L.; He, J.; Wang, C.; Li, Z.; Yang, T. Taper Embedded Phase-Shifted Fiber Bragg Grating Fabricated by Femtosecond Laser Line-by-Line Inscription. IEEE Photonics J. 2017, 10, 7500208. [Google Scholar] [CrossRef]
- Felipe, A.; Espíndola, G.; Kalinowski, H.J.; Lima, J.A.S.; Paterno, A.S. Stepwise fabrication of arbitrary fiber optic tapers. Opt. Express 2012, 20, 19893. [Google Scholar] [CrossRef] [PubMed]
- Yu, Y.; Bian, Q.; Lu, Y.; Zhang, X.; Yang, J.; Liang, L. High Sensitivity All Optical Fiber Conductivity-Temperature-Depth (CTD) Sensing Based on an Optical Microfiber Coupler (OMC). J. Light. Technol. 2019, 37, 2739–2747. [Google Scholar] [CrossRef]
- Wang, S.; Miao, Y.; Fei, C.; Zhang, H.; Li, B. A High-Sensitivity Temperature Sensor Based on a Liquid Cladding Tapered Microfiber. IEEE Sens. J. 2021, 21, 6152–6157. [Google Scholar] [CrossRef]
- Xin, J.; Lou, X.; Dong, M.; Zhu, L. Heat-treatment of fiber Bragg grating by arc discharge. Opt. Fiber Technol. 2019, 48, 70–75. [Google Scholar] [CrossRef]
- Zhang, H.; Zhang, M.; Kang, J.; Zhang, X.; Yang, J. High sensitivity fiber-optic strain sensor based on modified microfiber-assisted open-cavity Mach-Zehnder interferometer. J. Light. Technol. 2021, 39, 4556–4563. [Google Scholar] [CrossRef]
- Wen, J.; Yan, X.; Gao, X.; Li, K.; Wang, J. Axial Strain Sensor Based on Microfiber Couplers Operating at the Dispersion Turning Point. IEEE Sens. J. 2022, 22, 4090–4095. [Google Scholar] [CrossRef]
- Zhu, Y.-Q.; Yu, Y.-S.; Zhao, Y.; Guo, Q.; Ming, X.-Y.; Lei, C.-X.; Sun, H.-B. Highly Sensitive Directional Torsion Sensor Based on a Helical Panda Fiber Taper. IEEE Photonics Technol. Lett. 2019, 31, 1009–1012. [Google Scholar] [CrossRef]
- Hou, L.; Yang, J.; Zhang, X.; Kang, J.; Ran, L. Bias-taper-based hybrid modal interferometer for simultaneous triple-parameter measurement with joint wavelength and intensity demodulation. IEEE Sens. J. 2019, 19, 9775–9781. [Google Scholar] [CrossRef]
- Yan, S.-C.; Zhao, Y.; Chen, M.-Q.; Liu, Q. Optical fiber strain sensor with double S-tapers. Instrum. Sci. Technol. 2020, 49, 313–326. [Google Scholar] [CrossRef]
- Hu, Y.; Ning, T.; Zhang, C.; Zheng, J.; Pei, L.; Lin, H.; Li, J.; Chen, Y. Strain sensor based on two concatenated abrupt-tapers in twin-core fiber. Opt. Fiber Technol. 2018, 46, 1–4. [Google Scholar] [CrossRef]
- Liu, C.; Zhang, M.; Zhang, H.; Yang, J.; Shang, Q.; Yang, X.; Wang, S.; Ran, L. Tapered-open-cavity-based in-line Mach–Zehnder interferometer for highly sensitive axial-strain measurement. Opt. Express 2022, 30, 6341–6354. [Google Scholar] [CrossRef] [PubMed]
- Wu, H.; Lin, Q.; Jiang, Z.; Zhang, F.; Li, L.; Zhao, L. A temperature and strain sensor based on a cascade of double fiber Bragg grating. Meas. Sci. Technol. 2019, 30, 065104. [Google Scholar] [CrossRef]
- Saccomanno, A.; Laudati, A.; Szillasi, Z.; Beni, N.; Cutolo, A.; Irace, A.; Giordano, M.; Buontempo, S.; Cusano, A.; Breglio, G. Long-Term Temperature Monitoring in CMS Using Fiber Optic Sensors. IEEE Sens. J. 2012, 12, 3392–3398. [Google Scholar] [CrossRef]
- Her, S.-C.; Lin, W.-N. Simultaneous Measurement of Temperature and Mechanical Strain Using a Fiber Bragg Grating Sensor. Sensors 2020, 20, 4223. [Google Scholar] [CrossRef] [PubMed]
- Li, Z.; Hou, L.; Ran, L.; Kang, J.; Yang, J. Ultra-Sensitive Fiber Refractive Index Sensor with Intensity Modulation and Self-Temperature Compensation. Sensors 2019, 19, 3820. [Google Scholar] [CrossRef]
- Kang, J.; Hou, L.; Li, Z.; Liu, X.; Zhang, X.; Yang, J. Low Refractive-Index and Temperature Crosstalk Fiber-Optic Liquid Level Sensor Based on Cascaded Quasi-Microfiber and Double-Cladding Fiber Structure. IEEE Sens. J. 2021, 21, 1554–1560. [Google Scholar] [CrossRef]
- Liu, C.; Sun, D.; Yang, J.; Zhang, H.; Ran, L. Ultra-Sensitive Intensity Modulated Strain Sensor by Tapered Thin-Core Fiber Based Modal Interferometer. Photonics 2021, 8, 372. [Google Scholar] [CrossRef]
- Zhang, H.; Zhang, H.; Hou, L.; Zhang, M.; Yang, J. Self-Temperature Compensated Fiber-Optic Liquid Level Sensor with Ultra-Long Linear Range Using Quasi-Single Modal Interferometer. IEEE Sens. J. 2021, 21, 14868–14875. [Google Scholar] [CrossRef]
- Zhang, J.; Yang, J.; Hou, L.; Ran, L. Temperature compensated fiber-optic liquid level sensor by micro-sphere based in-line Michelson interferometer. Opt. Fiber Technol. 2022, 68, 102817. [Google Scholar] [CrossRef]
- Liu, J.; Zhang, X.; Yang, J.; Kang, J.; Wang, X. Common difference temperature compensation based fiber refractive index sensor through asymmetrical core-offset splicing. Opt. Commun. 2018, 427, 261–265. [Google Scholar] [CrossRef]


| Structures | Sensitivity | Linear Range | Temperature Compensation | Refs |
|---|---|---|---|---|
| FBG in four-core fiber | −1.83 pm/µε | 0–1000 µε | Yes | [5] |
| LPG and microspheres | 0.8 pm/µε | 0–1500 µε | No | [7] |
| tapered hollow core fiber | 2.7 pm/µε | 0–2100 µε | No | [10] |
| TCF-MZI | −1.92 pm/µε | 0–800 µε | Yes | [13] |
| microfiber coupler | 83 pm/µε | 0–400 µε | No | [25] |
| dual-tapered twin-core fiber | 6.39 pm/µε | 0–500 µε | No | [29] |
| tapered micro-cavity | 45 pm/µε | 0–110 µε | No | [31] |
| tapered TCF | −4.07 pm/µε | 0–600 µε | Yes | Our work |
| −2.23 pm/µε (after package) | 0–1100 µε |
Publisher’s Note: MDPI stays neutral with regard to jurisdictional claims in published maps and institutional affiliations. |
© 2022 by the authors. Licensee MDPI, Basel, Switzerland. This article is an open access article distributed under the terms and conditions of the Creative Commons Attribution (CC BY) license (https://creativecommons.org/licenses/by/4.0/).
Share and Cite
Yang, X.; Liu, C.; Yang, J.; Sun, D.; Ran, L. Fiber-Optic Axial-Strain Sensor with Sensitivity Enhancement and Temperature Compensation. Photonics 2022, 9, 709. https://doi.org/10.3390/photonics9100709
Yang X, Liu C, Yang J, Sun D, Ran L. Fiber-Optic Axial-Strain Sensor with Sensitivity Enhancement and Temperature Compensation. Photonics. 2022; 9(10):709. https://doi.org/10.3390/photonics9100709
Chicago/Turabian StyleYang, Xiaotong, Chuanxu Liu, Jiuru Yang, Dexue Sun, and Lingling Ran. 2022. "Fiber-Optic Axial-Strain Sensor with Sensitivity Enhancement and Temperature Compensation" Photonics 9, no. 10: 709. https://doi.org/10.3390/photonics9100709
APA StyleYang, X., Liu, C., Yang, J., Sun, D., & Ran, L. (2022). Fiber-Optic Axial-Strain Sensor with Sensitivity Enhancement and Temperature Compensation. Photonics, 9(10), 709. https://doi.org/10.3390/photonics9100709