Article

Full Poincaré Mueller Polarimetry Using a CCD Camera

by
Juan Carlos Suárez-Bermejo
1,
Juan Carlos González de Sande
2,*,
Gemma Piquero
3,
Antonio Virgilio Failla
4 and
Massimo Santarsiero
5
1
Materials Science Department, Universidad Politécnica de Madrid, Avda. de la Memoria, 28040 Madrid, Spain
2
ETSIS de Telecomunicación, Universidad Politécnica de Madrid, Campus Sur, 28031 Madrid, Spain
3
Departamento de Óptica, Universidad Complutense de Madrid, 28040 Madrid, Spain
4
UKE Microscopy Imaging Facility (UMIF), University Medical Center Hamburg-Eppendorf, 20246 Hamburg, Germany
5
Dipartimento di Ingegneria Industriale, Elettronica e Meccanica, Università Roma Tre, Via V. Volterra 62, 00146 Rome, Italy
*
Author to whom correspondence should be addressed.
Photonics 2022, 9(10), 702; https://doi.org/10.3390/photonics9100702
Submission received: 6 September 2022 / Revised: 20 September 2022 / Accepted: 24 September 2022 / Published: 28 September 2022

Abstract

:
A new method is proposed to perform Mueller matrix polarimetry using a Full Poincaré beam (i.e., a non-uniformly polarized beam presenting all polarization states across its section) as a parallel polarization state generator and a charge-coupled device (CCD) camera as a detector of the polarization state analyzer. In this way, the polarization change is measured for all possible input states simultaneously. To obtain the Mueller matrix of the sample, the overdetermined system of equations that relates the input and output states of polarization is solved by means of the Moore–Penrose pseudo-inverse. Preliminary numerical simulations are performed to identify and exhaustively analyze the main sources of error. In order to test the method, experimental measurements are presented for several known samples, showing an excellent agreement between the experimentally obtained Mueller matrices and the theoretically expected ones.

1. Introduction

Sample polarimetry is a non-invasive technique to determine the linear optical behavior of an unknown sample [1,2,3]. This behavior is related to the sample composition, structure, thickness, surface roughness, etc, and its knowledge is very useful in many different areas, such as medical diagnostic techniques [4,5,6,7,8,9,10,11], technological materials characterization and fabrication control [2,12,13,14,15,16,17], identification and counting of microplastics in wastewater [18] or air pollution detection [19,20,21]. Many different Mueller matrix polarimetric techniques have been developed up to now (see, for example, [1,2,10,22,23,24]).
Mueller matrix polarimetry is based on the determination of the polarization changes occurring when a polarized light beam passes through, is reflected by, or is modified in any other way by a sample. Several input polarization states must be tested to obtain a complete characterization of the linear optical properties of the sample. Recently, non-uniformly polarized beams, i.e., beams that present different polarization states across their transverse section, have been proposed for Mueller polarimetry [25,26,27,28,29]. In particular, spirally polarized beams have been used [27,28]. In that case, however, it is not possible to find four linearly independent states of polarization across the beam profile, which is necessary to obtain a complete characterization of a general Mueller matrix.
Non-uniformly polarized beams that contain all possible states of polarization are known as full Poincaré beams (FPBs) [30,31]. They can be generated in an easy way focusing a laser beam onto a uniaxial crystal [32,33] and, in combination with a point-like Stokes polarimeter, have already been used to determine the Mueller matrix of a sample by measuring the Stokes parameters at four selected points in the beam cross section [29,34].
In this work, full Poincaré beams are used with a different approach. A polarization state analyzer (PSA) consisting of a linear polarizer and a quarter-wave phase plate (QWP) [2,35,36] has been used, followed by a charge-coupled device (CCD) camera as detector. In this way, the polarization maps of the whole beam cross section (before and after the sample) can be measured. Since a full Poincaré beam is used as the input, all possible polarization states are tested at once [37,38]. Every pixel of the CCD camera potentially gives information about the polarization changes induced by the sample and can be used to reduce the uncertainty on the reconstructed Mueller matrix. We will refer to this technique as Full Poincaré Mueller Polarimetry (FPMP). Of course, the samples under testing are required to be homogeneous, at least in regions not smaller than the beam cross section.
Some numerical simulations were already carried out to identify the most significant error sources in the experimental determination of a Mueller matrix in FPMP [39,40]. Here, we first study, by numerical simulation, the effects of such error sources on a practical FPMP system and then experimentally test the performance of the system for several known samples.
This paper is organized as follows: in Section 2, the technique to obtain the Mueller matrix of samples by means of FPBs is recalled. Section 3 is devoted to present the numerical simulations, while in Section 4 the approach is implemented, and experimental results are reported. A discussion of the obtained results is presented in Section 5. Finally, in Section 6, brief concluding remarks are given.

2. Full Poincaré Mueller Polarimetry

The four Stokes parameters, arranged in a 4 × 1 vector, appropriately describe the polarization state of light [2,35,36]. They can be experimentally obtained from power measurements as [35,36]
S 0 = P 0 + P π / 2 + P π / 4 + P π / 4 + P λ / 4 , π / 4 + P λ / 4 , π / 4 / 3 , S 1 = P 0 P π / 2 , S 2 = P π / 4 P π / 4 , S 3 = P λ / 4 , π / 4 P λ / 4 , π / 4 ,
where P β and P λ / 4 , β are the powers measured after a linear polarizer and after a QWP followed by a linear polarizer, respectively. The subscript β refers to the angle between the x-axis and the polarizer transmission axis, while λ / 4 denotes the presence of the QWP with its fast axis at 0 degrees with respect to the x-axis [1,2,35].
When polarized light interacts with a sample, the state of polarization changes. Neglecting nonlinear effects, the polarization state of the exiting beam, S out , is related to that of the input one, S in , through the expression [2,36]
S out = M ^ S in ,
where M ^ = m i j ( i , j = 0 , 1 , 2 , 3 ) is the 4 × 4 Mueller matrix of the specimen. Equation (2) holds for every point in the transverse section of the beam. Then, the Stokes parameters of the input beam, measured at N pixels of the CCD camera, can be arranged in a 4 × N matrix, S ^ in . The same procedure can be followed for the output beam and a second 4 × N matrix, S ^ out , is constructed. Then, the following set of linear equations can be written:
S ^ out = M ^ S ^ in .
Since we are dealing with a full Poincaré input beam, the polarization states of this input beam cover the entire surface of the Poincaré sphere, so that one can certainly find a set of four points of the beam cross section whose polarization states are linearly independent and the rank of the S ^ in matrix is maximum, i.e., 4. Therefore, the product S ^ in S ^ in T , where T denotes transpose, is invertible and the right Moore–Penrose pseudo-inverse of the matrix S ^ in can be computed as [41]
S ^ in = S ^ in T S ^ in S ^ in T 1 .
Multiplying both sides of Equation (3) by this pseudo-inverse, the Mueller matrix of the sample is obtained as
M ^ = S ^ out S ^ in .
This process could be performed considering the whole sensor of the CCD camera, so that the Stokes parameters measured at any pixel could be included in the matrix–inversion procedure. However, it may be convenient to limit the number of used pixels because some of them could not provide accurate values of the Stokes parameters. Then, some criteria can be adopted to choose the pixels to be used for the recovery process.
The first criterion consists of taking into account only those pixels where the measured power exceeds a given minimum value. In particular, we choose 10 % of the maximum power across the beam section as a reasonable value in order to obtain a high signal-to-noise ratio.
The second one concerns the polarization degree measured at every pixel, which should always fall into the range [0, 1]. Pixels where the measured value exceeds this interval denote an incorrect determination of the Stokes parameters, and should be excluded. In particular, the input beam is totally polarized and its degree of polarization is expected to be 1 everywhere. However, due to experimental errors, values below and over 1 can be also found. In the present case, we choose only those pixels where the measured degree of polarization for total polarized light is 1.0 ± 0.1 .
Furthermore, the region of the input beam cross section used to measure the Stokes parameters must be chosen in such a way that it includes all possible polarization states. The selection of this region depends on the way the FPB has been generated. In the present case, all possible polarization states can be found (twice) in a circular region with a suitable radius centered on the beam axis [33].

3. Errors Analysis

In this section, we numerically simulate an experimental Mueller matrix recovery procedure using FPMP and a CCD camera, to obtain quantitative estimates of the errors induced by the most significant error sources. The experimental setup is shown in Figure 1a. The dashed rectangle shows the polarization state generator (PSG), which is described in detail in Ref. [33]. It consists of a He-Ne laser, a polarizer with its transmission axis in the vertical direction (P 1 ), a microscope objective (MO) that focuses the light onto a calcite crystal (whose optic axis is denoted by a double arrow), and a lens (L) that collimates the exiting beam. It has been shown that, at the exit of the calcite crystal, the beam is of the full Poincaré type [33]. Then, the FPB passes through the sample, described by the Mueller matrix M ^ T . Finally, the polarization map is measured by means of a PSA, made up of a (removable) QWP with a fast axis along the horizontal direction, a rotatable linear polarizer (P), and a CCD camera as power detector. To measure the input beam polarization map, the sample is removed.
The main error sources in FPMP have been identified as [39,40]: inaccuracy in the measurement of the power at each pixel of the CCD camera, mainly due to statistical noise; possible fluctuations in the intensity of the input light across the beam section; inaccuracy in the orientation of the polarizer and QWP axes; lateral and vertical displacements of the recorded images that may occur due to possible deviations of the angle of incidence on the sample with respect to the normal. Obviously, if the samples are not homogeneous over a region larger than the beam cross section, there will be added uncertainties that are not considered in this work.
On the other hand, the effects of using real optical components for the PSA can be suppressed, or minimized, by accurate calibrations of these components. Furthermore, since the polarization state of a FPB varies from a point to another, the average values of the Stokes parameters over the pixel area are obtained. However, due to the linearity of Equation (3), in the absence of any other sources of error, these average values will give the exact Mueller matrix of the sample. The effect of averaging the Stokes parameters has been studied in the presence of other errors and turns out to be negligible when the pixel area is small enough with respect to the considered region [29,34].
Therefore, we will focus on the effects of inaccurate power measurement, inaccurate positioning of the axes of the optical elements, and possible shifts of the recorded images.
In our simulation, the power map that would be measured by a CCD camera located after the PSA is theoretically calculated without the sample (input beam) (see Figure 1b). A Gaussian random noise, with a given amplitude level, is added to the expected power value of each pixel (see Figure 1c). From these noisy images, the Stokes parameter maps of the input beam ( S in ) and the output beam ( S out ) are obtained by applying Equation (1) (see Figure 1d). The same procedure has been carried out for the output beam taking into account the sample.
The procedure described in the previous section is applied with these two sets of noisy Stokes parameter maps, and the recovered Mueller matrix, say M ^ S , is compared to M ^ T . Finally, the root mean square (rms) of the 4 × 4 difference matrix δ M ^ = M ^ S M ^ T , evaluated as
rms δ M ^ = 1 4 i , j = 0 3 δ M i j 2 ,
is taken as representative of the recovering error.
To obtain a sensible estimate of the magnitude of the power inaccuracy, one can deal with in a real FPMP experiment, we performed a study of the fluctuations of the power measured by each pixel of the CCD camera used in our system. In this study, the experimental setup shown in Figure 1a was used with the polarizer P transmission axis fixed in the vertical direction (y-axis) and without any sample or wave plates. Then, 25 images were recorded under the same conditions as during the experimental measurements of the test samples, and one of them was chosen and compared with the mean of the remaining 24 images. This process was repeated 25 times for each of the images, with different power levels. The cumulative noise in each pixel was calculated as the difference of the measured power in each pixel for one of the images and the mean of the remaining 24 images. It turned out that these differences follow quite well a Gaussian distribution, whose standard deviation approximately grows linearly with the power level. The ratio of the observed standard deviation to the mean measured power level resulted in the range of 0.007–0.01 for power levels above 1/5 of the saturation level of the CCD camera. Therefore, in the simulations we set, the amplitude of the added Gaussian noise as 0.01.
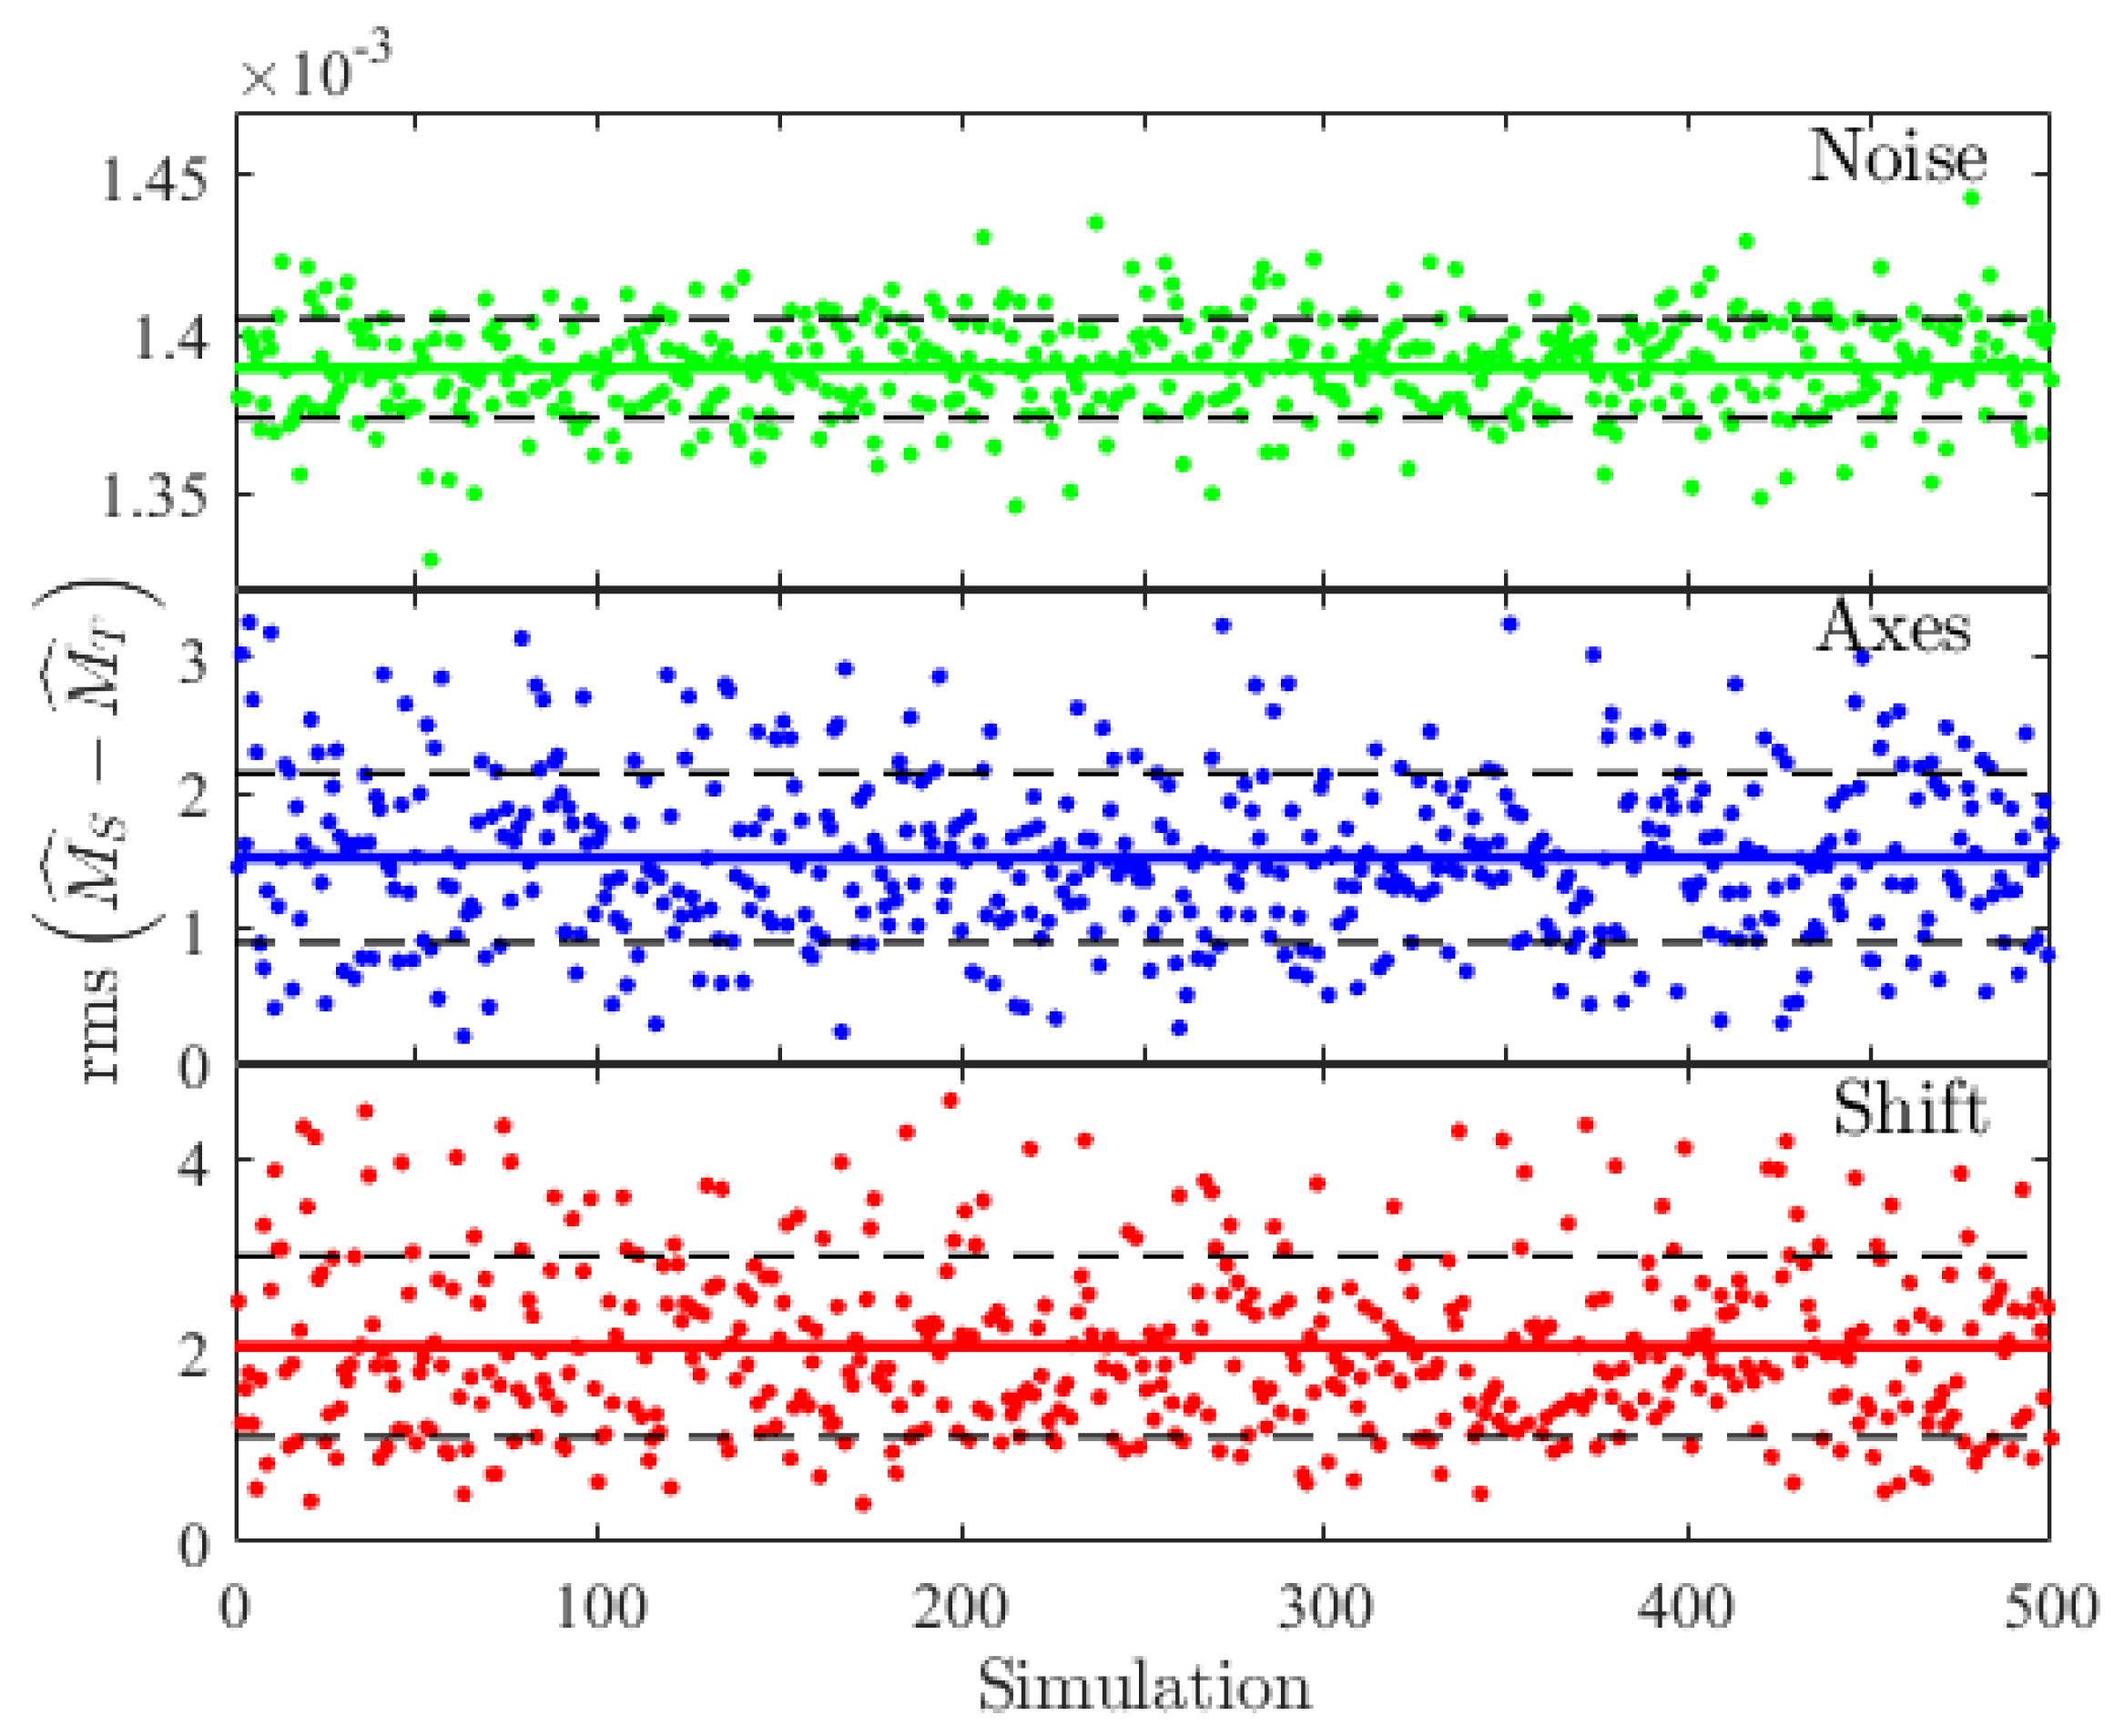
For each considered ideal sample, 500 realizations of the simulated measurement process were performed, and, in each of these, a random noise with the above characteristics is added to the power measurements, while the other significant parameters are kept fixed. The upper part of Figure 2 shows an example of the simulation results for air as the sample. It can be noted that the rms for each individual realization of the simulation presents low dispersion and its mean value is rather small, typically lower than 1.5 × 10 3 . Although the differences for each individual matrix element of the obtained and the real Mueller matrix could be larger, one can expect that, in a real experiment, the error on each of the elements would be of the order of 1.5 × 10 3 , if the only source of error is the inaccuracy of the power measurement at each pixel.
The second significant error source is the possible deviation of the axes of the optical elements in the PSA from their ideal positions. Since the fast axis of the QWP does not have to move between measurements, a fixed value of its fast axis is considered for all realizations of the simulated experiment, thus producing a systematic error. For the case of the orientation of the transmission axis of the linear polarizer, a random error uniformly distributed in the interval ( Δ , Δ ) is considered. The theoretical Stokes parameters of the generated FPB beam are used to calculate the simulated images for each of the six PSA configurations but taking into account the errors in the position of the axes. On the basis of the precision with which it is reasonable to orient the anisotropic elements used in the experiment, the value Δ = 0.003 rad (approximately 10 ) was considered. The central part of Figure 2 shows the result of 500 realizations of the simulated experiment, considering only this error source and, again, the air as the sample. It can be observed that the average value of the rms is around 1.5 × 10 3 . In this case, the fluctuations of the rms values are quite large, around 1/3 of the average value.
Finally, we consider the possible image shifting between measurements. In this case, we consider random shifts uniformly distributed in a given range for both sets of six images (for the input and output beam). For 2 mm thick plane parallel samples, and considering maximum deviation from the normal incidence up to 1 lateral shift of the images should be lower than 25 μ m. Converting this distance into number of pixels, a maximum image shift of six pixels could be expected. Random integer numbers are generated in the ( N p , N p ) range (with N p = 6 ) and both horizontal and vertical shifts of each of the images were considered. The lower part of Figure 2 shows the rms of the differences between theoretical Mueller matrix and calculated ones for 500 simulated experiments with air as a sample. The average of the rms values is around 2 × 10 3 .
The above simulation procedures have been followed for several theoretical samples: air, a QWP, a half-wave phase plate (HWP), and a dichroic linear polarizer (LP). Two different orientations were considered for the fast axis or the transmission axis of the anisotropic samples. Figure 3 summarizes the results of these simulations. It can be seen that the errors due to noise in the power measurement, to axis misalignments of the PSA optical components, and to possible image shifts are of the same order of magnitude. For air and phase wave plates, the average rms values are quite similar and always below 3 × 10 3 considering any origin for this errors. In the case of the linear polarizer, the average rms of the differences is always lower (around the half) than for air and phase plates.

4. Experimental Results

To experimentally check the proposed method, the setup shown schematically in Figure 1a has been used. A full Poincaré beam has been generated by using the system in the dotted-line rectangle of the schematics in Figure 1a [33]: A He-Ne laser beam (Spectra Physics model 117A, λ = 632.8 nm, stabilized both in power and in frequency) is focused by a microscope objective onto the input face of a 20 mm length calcite crystal, having optic axis along the z-direction. It has been shown that the beam at the exit surface of the crystal presents all polarization states within a circle of a radius r M that depends on the crystal characteristics [33].
The beam emerging from the crystal, whose spot size width is larger than the radius r M , is collimated by a lens and used as the input beam in our experiment. A SP620U CCD camera is used to record the experimental images. The pixel size is 4.4  μm and the number of effective pixels is 1600 × 1200 , so that the whole usable area is 7.1 × 5.4 mm 2 , the lowest measurable signal is 2.5 nW / cm 2 , and its dynamic range is over 60 dB.
Figure 4 shows the recorded images for the six selected configurations of the PSA, both for the input beam (common to all measurements) and for the output beam for the case of a QWP having its fast axis at π / 3 with respect to the horizontal direction. The values at each pixel (coded as a color scale) are proportional to the measured power. These values are normalized to the maximum power measured across the input beam section.
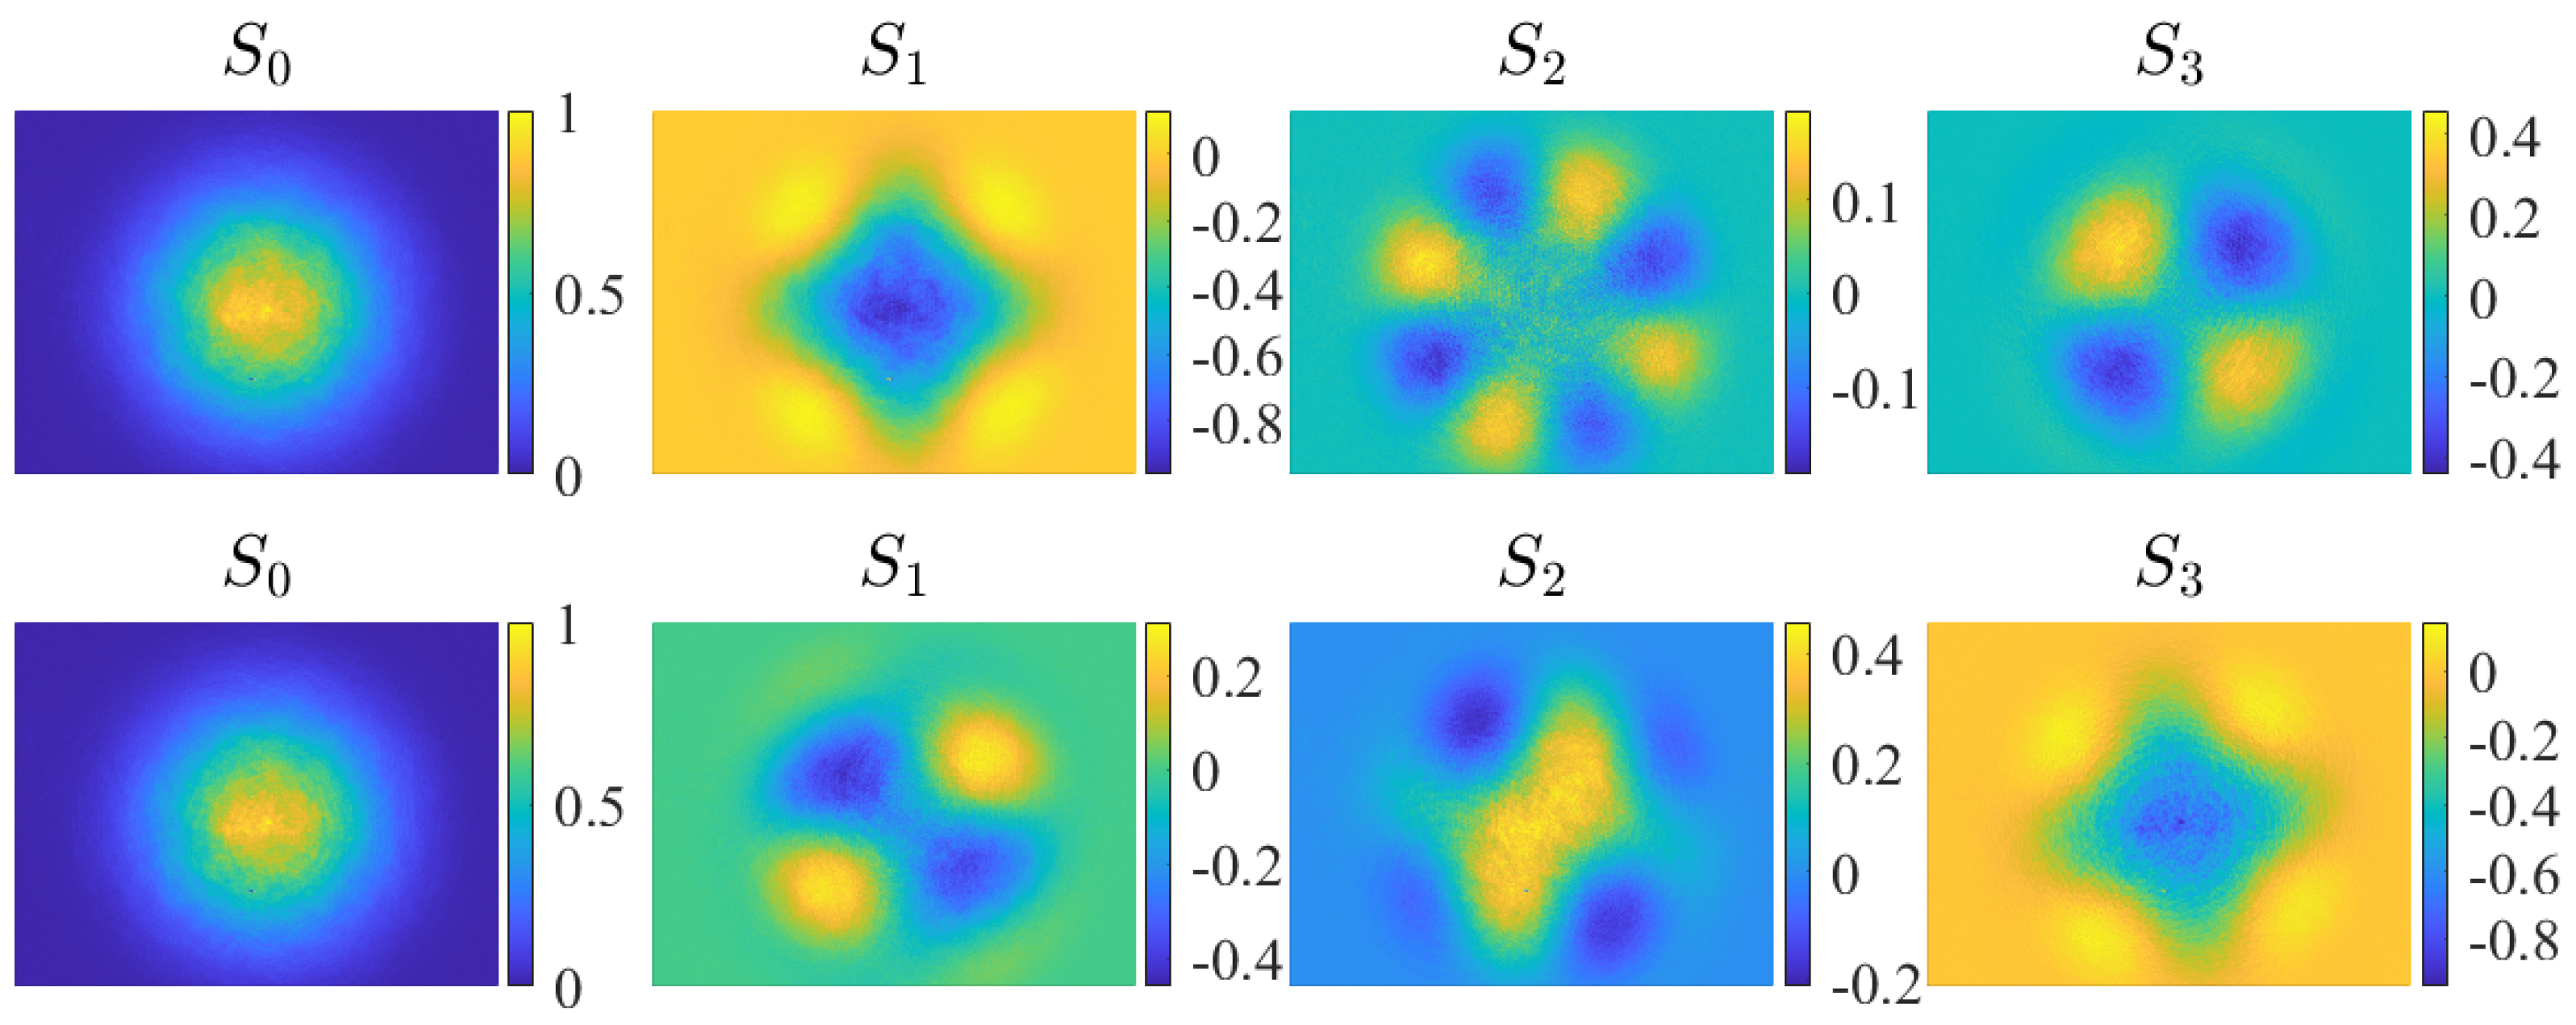
From these images, the input and output Stokes parameter maps were obtained using Equation (1). The Stokes parameter maps for the input beam and output beam for a particular measured sample are shown in Figure 5. From these Stokes parameter maps, following the procedure described in Section 2, the pair of matrices S ^ in and S ^ out are constructed for each studied sample.
The performance of the proposed method has been tested with air, a QWP, a HWP, and a dichroic LP. The phase wave plates and the polarizer were previously characterized, and the parameters reported in Table 1 were obtained. The fast axis of the wave plates has been oriented at 0 and π / 3 with respect to the x-axis while the transmission axis of the polarizer at π / 2 and π / 3 , so that seven different Mueller matrices have been measured. About 1 million pixels meet the criteria described in Section 2 to be taken into account in the calculation. With our laptop (Intel i7 processor), the calculation time is about 2 s.
The Mueller matrices obtained experimentally are compared to the theoretical ones, calculated with the corresponding parameters and rotation angles [2,29]. Table 2 summarizes the results obtained for all the samples. The experimental values of the Mueller matrix elements are reported, together with the rms value of the difference with the theoretical ones.

5. Discussion

From the results shown in Table 2, it can be seen that there is excellent agreement between the measured and expected Mueller matrices for all samples analyzed. In particular, it can be seen that the rms values of the differences given by Equation (6) are less than 0.007 for all samples. It can be noted that, for all of the considered samples except one, the rms value of the differences between the experimental matrix and the theoretical one for each sample are lower than in the previously published work where this kind of FPB was used in combination with an adapted commercial Stokes polarimeter [29].
The absolute value of the differences between the experimentally measured Mueller matrix elements, and the theoretical ones are also shown in Figure 6 for each of the samples. It must be noted that the maximum difference for individual Mueller matrix elements is always below 0.015 for all samples (see a vertical scale in Figure 6). For two samples (air and linear polarizer at π / 2 ), the maximum difference is below 0.005.
The maximum absolute value of the differences for each Mueller matrix elements obtained in the present work is also lower than in the previous one except for the linear polarizer with its transmission axis at π / 3 in which case this maximum difference is similar.
Similar levels of the rms value (0.0018) have been found for air as a calibration sample for a Mueller matrix polarimeter that uses a similar PSA to that in the present experiment [42]. For a Mueller matrix polarimeter with a PSA made up of a rotating QWP or dual-rotating retarders and a linear polarizer, rms values on the order of 0.004–0.04 or even higher have been reported for air and phase wave-plates as samples [11,16,43,44]. For Mueller matrix polarimeters using photoelastic modulators or liquid-crystal variable retarders, the rms of the difference between the measured Mueller matrix and the expected ones in the range 0.006–0.028 has been found [22,23].

6. Conclusions

Full Poincaré Mueller Polarimetry can be carried out by using different setups. In this paper, a technique using a CCD as a detector has been presented, which takes advantage of the simultaneous presence of all possible polarization states across the input beam transverse section. With the proposed setup, six images are recorded, corresponding to six specific configurations of the polarization state analyzer, for both the input and output beam, from which the input and output Stokes parameter maps are obtained. An overdetermined system of equations is constructed by selecting a number (possibly very high) of pixels from these maps, which can be solved to recover the Mueller matrix of the sample by means of the Moore–Penrose pseudo-inverse. Reconstruction errors are first analyzed by means of numerical simulations. Then, the proposed technique has been experimentally tested by measuring the Mueller matrix of seven calibrated samples, showing excellent accuracy. A reduction in the differences between measured and expected Mueller matrix values was observed for all but one sample.

Author Contributions

All authors contributed equally to this work. All authors have read and agreed to the published version of the manuscript.

Funding

This research was funded by Spanish Ministerio de Economía y Competitividad under Grant No. PID2019-104268GB-C21.

Institutional Review Board Statement

Not applicable.

Informed Consent Statement

Not applicable.

Data Availability Statement

Not applicable.

Conflicts of Interest

The authors declare no conflict of interest. The funders had no role in the design of the study; in the collection, analyses, or interpretation of data; in the writing of the manuscript; or in the decision to publish the results.

Abbreviations

The following abbreviations are used in this manuscript:
AGNAdditive Gaussian noise
CCDCharge-coupled device
FPBFull Poincaré beam
FPMPFull Poincaré Mueller polarimetry
HWPHalf wave plate
LPLinear polarizer
QWPQuarter wave plate
PSAPolarization state analyzer
PSGPolarization state generator
rmsroot mean square

References

  1. Azzam, R.M.A. Stokes-vector and Mueller-matrix polarimetry [Invited]. J. Opt. Soc. Am. A 2016, 33, 1396–1408. [Google Scholar] [CrossRef] [PubMed]
  2. Chipman, R.; Lam, W.; Young, G. Polarized Light and Optical Systems; Optical Sciences and Applications of Light; CRC Press: Boca Raton, FL, USA, 2018. [Google Scholar]
  3. Gil, J.J.; Ossikovski, R. Polarized Light and the Mueller Matrix Approach; CRC Press Taylor & Francis Group: Boca Raton, FL, USA, 2016. [Google Scholar] [CrossRef]
  4. Tuchin, V.V.; Wang, L.; Zymnayakov, D.A. Optical Polarization in Biomedical Applications; Springer: Berlin/Heidelberg, Germany, 2006. [Google Scholar]
  5. Ghosh, N.; Vitkin, A.I. Tissue polarimetry: Concepts, challenges, applications, and outlook. J. Biomed. Opt. 2011, 16, 110801. [Google Scholar] [CrossRef] [PubMed]
  6. Alali, S.; Gribble, A.; Vitkin, I.A. Rapid wide-field Mueller matrix polarimetry imaging based on four photoelastic modulators with no moving parts. Opt. Lett. 2016, 41, 1038–1041. [Google Scholar] [CrossRef]
  7. Ushenko, V.; Sdobnov, A.; Syvokorovskaya, A.; Dubolazov, A.; Vanchulyak, O.; Ushenko, A.; Ushenko, Y.; Gorsky, M.; Sidor, M.; Bykov, A.; et al. 3D Mueller-Matrix Diffusive Tomography of Polycrystalline Blood Films for Cancer Diagnosis. Photonics 2018, 5, 54. [Google Scholar] [CrossRef]
  8. Sheng, W.; Li, W.; Qi, J.; Liu, T.; He, H.; Dong, Y.; Liu, S.; Wu, J.; Elson, D.S.; Ma, H. Quantitative Analysis of 4 × 4 Mueller Matrix Transformation Parameters for Biomedical Imaging. Photonics 2019, 6, 34. [Google Scholar] [CrossRef]
  9. Le, V.N.D.; Saytashev, I.; Saha, S.; Lopez, P.F.; Laughrey, M.; Ramella-Roman, J.C. Depth-resolved Mueller matrix polarimetry microscopy of the rat cornea. Biomed. Opt. Express 2020, 11, 5982–5994. [Google Scholar] [CrossRef] [PubMed]
  10. He, C.; He, H.; Chang, J.; Chen, B.; Ma, H.; Booth, M.J. Polarisation optics for biomedical and clinical applications: A review. Light. Sci. Appl. 2021, 10, 194. [Google Scholar] [CrossRef]
  11. Huynh, R.N.; Nehmetallah, G.; Raub, C.B. Mueller matrix polarimetry and polar decomposition of articular cartilage imaged in reflectance. Biomed. Opt. Express 2021, 12, 5160–5178. [Google Scholar] [CrossRef]
  12. de Sande, J.C.G.; Rodríguez, A.; Rodríguez, T. Spectroscopic ellipsometry determination of the refractive index of strained Si1−xGex layers in the near-infrared wavelength range (0.9–1.7 μm). Appl. Phys. Lett. 1995, 67, 3402–3404. [Google Scholar] [CrossRef]
  13. de Sande, J.C.G.; Serna, R.; Gonzalo, J.; Afonso, C.N.; Hole, D.E.; Naudon, A. Refractive index of Ag nanocrystals composite films in the neighborhood of the surface plasmon resonance. J. Appl. Phys. 2002, 91, 1536–1541. [Google Scholar] [CrossRef]
  14. Savenkov, S.N. Mueller Matrix Polarimetry in Material Science, Biomedical and Environmental Applications. In Handbook of Coherent-Domain Optical Methods: Biomedical Diagnostics, Environmental Monitoring, and Materials Science; Tuchin, V.V., Ed.; Springer: New York, NY, USA, 2013; pp. 1175–1253. [Google Scholar] [CrossRef]
  15. López-Morales, G.; Sánchez-López, M.d.M.; Lizana, A.; Moreno, I.; Campos, J. Mueller Matrix Polarimetric Imaging Analysis of Optical Components for the Generation of Cylindrical Vector Beams. Crystals 2020, 10, 1155. [Google Scholar] [CrossRef]
  16. Ray, S.K.; Ghosh, N.; Vitkin, A. Diattenuation and retardance signature of plasmonic gold nanorods in turbid media revealed by Mueller matrix polarimetry. Sci. Rep. 2021, 11, 20017. [Google Scholar] [CrossRef] [PubMed]
  17. Tiwari, V.; Bisht, N.S. Combined Jones-Stokes Polarimetry and Its Decomposition into Associated Anisotropic Characteristics of Spatial Light Modulator. Photonics 2022, 9, 195. [Google Scholar] [CrossRef]
  18. Sierra, I.; Chialanza, M.R.; Faccio, R.; Carrizo, D.; Fornaro, L.; Pérez-Parada, A. Identification of microplastics in wastewater samples by means of polarized light optical microscopy. Environ. Sci. Pollut. Res. 2020, 27, 7409–7419. [Google Scholar] [CrossRef] [PubMed]
  19. Kobayashi, H.; Hayashi, M.; Shiraishi, K.; Nakura, Y.; Enomoto, T.; Miura, K.; Takahashi, H.; Igarashi, Y.; Naoe, H.; Kaneyasu, N.; et al. Development of a polarization optical particle counter capable of aerosol type classification. Atmos. Environ. 2014, 97, 486–492. [Google Scholar] [CrossRef]
  20. Li, D.; Chen, F.; Zeng, N.; Qiu, Z.; He, H.; He, Y.; Ma, H. Study on polarization scattering applied in aerosol recognition in the air. Opt. Express 2019, 27, A581–A595. [Google Scholar] [CrossRef]
  21. Qi, S.; Huang, Z.; Ma, X.; Huang, J.; Zhou, T.; Zhang, S.; Dong, Q.; Bi, J.; Shi, J. Classification of atmospheric aerosols and clouds by use of dual-polarization lidar measurements. Opt. Express 2021, 29, 23461–23476. [Google Scholar] [CrossRef] [PubMed]
  22. Bueno, J.M. Polarimetry using liquid-crystal variable retarders: Theory and calibration. J. Opt. A Pure Appl. Opt. 2000, 2, 216. [Google Scholar] [CrossRef] [Green Version]
  23. Martínez-Ponce, G.; Solano, C.; Pérez-Barrios, C. Hybrid complete Mueller polarimeter based on phase modulators. Opt. Lasers Eng. 2011, 49, 723–728. [Google Scholar] [CrossRef]
  24. Reddy, S.G.; Prabhakar, S.; Aadhi, A.; Kumar, A.; Shah, M.; Singh, R.P.; Simon, R. Measuring the Mueller matrix of an arbitrary optical element with a universal SU(2) polarization gadget. J. Opt. Soc. Am. A 2014, 31, 610–615. [Google Scholar] [CrossRef]
  25. Tripathi, S.; Toussaint, K.C. Rapid Mueller matrix polarimetry based on parallelized polarization state generation and detection. Opt. Express 2009, 17, 21396–21407. [Google Scholar] [CrossRef] [PubMed]
  26. Töppel, F.; Aiello, A.; Marquardt, C.; Giacobino, E.; Leuchs, G. Classical entanglement in polarization metrology. New J. Phys. 2014, 16, 073019. [Google Scholar] [CrossRef]
  27. de Sande, J.C.G.; Santarsiero, M.; Piquero, G. Spirally polarized beams for polarimetry measurements of deterministic and homogeneous samples. Opt. Lasers Eng. 2017, 91, 97–105. [Google Scholar] [CrossRef]
  28. de Sande, J.C.G.; Piquero, G.; Santarsiero, M. Polarimetry with azimuthally polarized light. Opt. Commun. 2018, 410, 961–965. [Google Scholar] [CrossRef]
  29. Suárez-Bermejo, J.C.; de Sande, J.C.G.; Santarsiero, M.; Piquero, G. Mueller matrix polarimetry using full Poincaré beams. Opt. Lasers Eng. 2019, 122, 134–141. [Google Scholar] [CrossRef]
  30. Beckley, A.M.; Brown, T.G.; Alonso, M.A. Full Poincaré beams. Opt. Express 2010, 18, 10777–10785. [Google Scholar] [CrossRef] [PubMed]
  31. Galvez, E.J.; Khadka, S.; Schubert, W.H.; Nomoto, S. Poincaré-beam patterns produced by nonseparable superpositions of Laguerre-Gauss and polarization modes of light. Appl. Opt. 2012, 51, 2925–2934. [Google Scholar] [CrossRef] [PubMed]
  32. Piquero, G.; Vargas-Balbuena, J. Non-uniformly polarized beams across their transverse profiles: An introductory study for undergraduate optics courses. Eur. J. Phys. 2004, 25, 793–800. [Google Scholar] [CrossRef]
  33. Piquero, G.; Monroy, L.; Santarsiero, M.; Alonzo, M.; de Sande, J.C.G. Synthesis of full Poincaré beams by means of uniaxial crystals. J. Opt. 2018, 20, 065602. [Google Scholar] [CrossRef]
  34. Suárez-Bermejo, J.C.; de Sande, J.C.G.; Santarsiero, M.; Piquero, G. Analysis of the Errors in Polarimetry with Full Poincaré Beams. In Proceedings of the 2019 PhotonIcs Electromagnetics Research Symposium-Spring (PIERS-Spring), Rome, Italy, 17–20 June 2019; pp. 2621–2627. [Google Scholar]
  35. Born, M.; Wolf, E. Principles of Optics, 6th (corrected) ed.; Cambridge University Press: Cambridge, UK, 1980. [Google Scholar]
  36. Goldstein, D.H. Polarized Light, 2nd (revised and expanded) ed.; Marcel Dekker, Inc.: New York, NY, USA, 2003. [Google Scholar]
  37. de Sande, J.C.G.; Piquero, G.; Suárez-Bermejo, J.C.; Santarsiero, M. Beams with propagation-invariant transverse polarization pattern. arXiv 2021, arXiv:2102.00024. [Google Scholar]
  38. de Sande, J.C.G.; Piquero, G.; Suárez-Bermejo, J.C.; Santarsiero, M. Mueller Matrix Polarimetry with Invariant Polarization Pattern Beams. Photonics 2021, 8, 491. [Google Scholar] [CrossRef]
  39. Suárez-Bermejo, J.C.; De Sande, J.C.G.; Santarsiero, M.; Piquero, G. Numerical Analysis of CCD Images for Polarimetry with Full Poincaré Beams. Sens. Transducer 2020, 247, 18–24. [Google Scholar]
  40. Suárez-Bermejo, J.C.; de Sande, J.C.G.; Santarsiero, M.; Piquero, G. Experimental Mueller matrix polarimetry with full Poincaré beams and a CCD camera. EPJ Web Conf. 2021, 255, 12005. [Google Scholar] [CrossRef]
  41. Ben-Israel, A.; Greville, T.N. Generalized Inverses, 2nd ed.; Springer: Berlin/Heidelberg, Germany, 2003. [Google Scholar] [CrossRef]
  42. del Hoyo, J.; Sanchez-Brea, L.M.; Gomez-Pedrero, J.A. High precision calibration method for a four-axis Mueller matrix polarimeter. Opt. Lasers Eng. 2020, 132, 106112. [Google Scholar] [CrossRef]
  43. Dev, K.; Asundi, A. Mueller–Stokes polarimetric characterization of transmissive liquid crystal spatial light modulator. Opt. Lasers Eng. 2012, 50, 599–607. [Google Scholar] [CrossRef]
  44. Zhou, G.; Li, Y.; Liu, K. Efficient calibration method of total polarimetric errors in a channeled spectropolarimeter. Appl. Opt. 2021, 60, 3623–3628. [Google Scholar] [CrossRef] [PubMed]
Figure 1. (a) Experimental setup; (b) theoretical images for the input beam; (c) theoretical images with additive Gaussian noise (AGN); (d) calculated Stokes parameters from noisy images.
Photonics 09 00702 g001
Figure 2. Root mean square of the differences between the theoretical Mueller matrix and the calculated one from each individual realization of the simulated experiment for air as sample. Different sources of errors are considered. Color solid lines indicate the mean value for each case and dashed black lines are at a one standard deviation distance of the mean values.
Photonics 09 00702 g002
Figure 3. Mean values and standard deviations of the rms of the differences between the theoretical Mueller matrix and the calculated one from 500 realizations of the simulated experiment for different samples.
Photonics 09 00702 g003
Figure 4. Measured power maps normalized to the maximum intensity value of the input beam. Top: input beam for all samples; Bottom: output beam in the case of a QWP with its fast axis at π / 3 with respect to the horizontal direction.
Photonics 09 00702 g004
Figure 5. Stokes parameters’ maps normalized to the maximum power of the input beam. Top: input beam for all samples; Bottom: output beam in the case of a QWP with its fast axis at π / 3 relative to the horizontal direction.
Photonics 09 00702 g005
Figure 6. Absolute value of the difference of the experimental Mueller matrix and the theoretical one for each studied sample.
Photonics 09 00702 g006
Table 1. Parameters of the samples. Transmittance ( m 00 ) and retardance ( γ ) for the wave plates and maximum (q) and minimum (p) transmittances for the linear polarizer.
SampleParameters
QWP m 00 = 0.974 ± 0.006 γ = ( 0.503 ± 0.005 ) π
HWP m 00 = 0.991 ± 0.009 γ = ( 0.997 ± 0.005 ) π
LP q = 0.520 ± 0.001 p = 0.0008 ± 0.001
Table 2. Experimental Mueller matrices obtained for different samples (Air, QWP, HWP, LP) and orientations ( ϕ ). The last column reports the rms of the difference between the experimental Mueller matrices and the expected ones.
Sample ( ϕ ) M ^ rms δ M ^
Air 1.0047 0.0037 0.0000 0.0001 0.0004 1.0002 0.0004 0.0000 0.0018 0.0006 0.9980 0.0017 0.0029 0.0020 0.0001 0.9995 0.0019
QWP (0) 0.9795 0.0027 0.0017 0.0018 0.0073 0.9835 0.0140 0.0082 0.0028 0.0057 0.0117 0.9692 0.0062 0.0152 0.9694 0.0025 0.0055
QWP π 3 0.9801 0.0127 0.0014 0.0015 0.0016 0.2457 0.4316 0.8382 0.0009 0.4359 0.7172 0.4977 0.0034 0.8351 0.4985 0.0098 0.0039
HWP (0) 0.9942 0.0039 0.0014 0.0023 0.0023 0.9944 0.0044 0.0007 0.0047 0.0014 0.9849 0.0019 0.0142 0.0132 0.0109 0.9914 0.0062
HWP π 3 0.9961 0.0034 0.0004 0.0007 0.0069 0.4859 0.8573 0.0194 0.0022 0.8633 0.4926 0.0061 0.0055 0.0042 0.0047 0.9915 0.0044
LP π 2 0.2589 0.2591 0.0001 0.0010 0.2592 0.2581 0.0003 0.0005 0.0005 0.0009 0.0011 0.0004 0.0039 0.0030 0.0007 0.0009 0.0016
LP π 3 0.2631 0.1405 0.2168 0.0002 0.1372 0.0698 0.1154 0.0002 0.2287 0.1192 0.1899 0.0032 0.0090 0.0055 0.0008 0.0004 0.0047
Publisher’s Note: MDPI stays neutral with regard to jurisdictional claims in published maps and institutional affiliations.