Article

Impact of Mode-Area Dispersion on Nonlinear Pulse Propagation in Gas-Filled Anti-Resonant Hollow-Core Fiber

1
School of Electrical and Electronic Engineering, Nanyang Technological University, Singapore 639798, Singapore
2
Optical Sciences Group, Research School of Physics, The Australian National University, Canberra, ACT 2600, Australia
*
Author to whom correspondence should be addressed.
Photonics 2022, 9(1), 25; https://doi.org/10.3390/photonics9010025
Submission received: 9 November 2021 / Revised: 8 December 2021 / Accepted: 28 December 2021 / Published: 1 January 2022
(This article belongs to the Special Issue Photonic Crystal Fibers: Design, Fabrication and Applications)

Abstract

:
We numerically investigate the effect of mode-area dispersion in a tubular-type anti-resonant hollow-core fiber by using a modified generalized nonlinear Schrödinger equation that takes into account the wavelength-dependent mode area in its nonlinear term. The pulse evolution dynamics with and without the effect of mode-area dispersion are compared and analyzed. We show that strong dispersion of the mode area in the proximity of the cladding wall thickness-induced resonances has a significant impact on the soliton pulse propagation, resulting in considerable changes in the conversion efficiencies in nonlinear frequency mixing processes. The differences become more prominent when the pump has higher energy and is nearer to a resonance. Hence, the mode-area dispersion must be accounted for when modeling such a case.

Graphical Abstract

1. Introduction

The anti-resonant hollow-core fiber (AR-HCF) is gaining growing popularity owing to its ability to guide light through a hollow channel [1,2]. Nonlinear optics is among the areas where AR-HCF is finding interesting applications [3,4,5]. The tubular-type AR-HCF, which consists of several thin-wall dielectric cladding tubes surrounding the central hollow core has a simple structure that is relatively easy to fabricate, yet achieves reasonably low loss [6]. It offers a wide transmission window and a high power-damage threshold. It can also be filled with gas for tunable dispersion and nonlinearity. The long light-matter interaction length in gas-filled AR-HCF offers an ideal platform for developing coherent broadband light sources using nonlinear effects [7]. The light guidance in AR-HCF can be described by the anti-resonant reflection model [8], where the light in the hollow core is tightly confined via strong reflection at the core-cladding interface at wavelengths that satisfy the anti-resonant condition. In AR-HCF, the guiding properties such as the transmission loss, dispersion, and mode-area, exhibit smooth variation across the anti-resonant (transmission) bands, while they change rapidly near the resonant wavelengths. Such characteristics have been exploited in several recent studies for generating multi-octave-spanning supercontinuum [9,10] and mediating nonlinear frequency down-conversion [11]. The rapid change in the dispersion near the resonance enables various combinations of phase-matched nonlinear frequency mixing processes to be achieved [12]. Moreover, since the locations of the resonances are solely determined by the cladding wall thickness, it is possible to induce emission at a desired wavelength by tailoring the cladding wall thickness [9,11].
While there are a handful of studies reporting the effect of fast variation in the dispersion profile near the cladding-wall thickness-induced resonances on nonlinear pulse propagation in gas-filled AR-HCF, less attention has been paid to the impact of the rapid mode area change around these resonances. The effect of mode-area dispersion on nonlinear pulse propagation was first theoretically studied in single-mode photonic band-gap fiber [13]. It turned out that the mode-area dispersion is an important factor in dictating femtosecond pulse propagation, and, therefore, it has been commonly incorporated in numerical studies involving photonic bandgap fibers [14,15]. On the other hand, the effect of mode-area dispersion has not been thoroughly considered in the past numerical studies that involve nonlinear pulse propagation in gas-filled AR-HCFs. A constant mode area evaluated at the pump wavelength was assumed in most cases. However, such an assumption may become invalid in small-core fibers, as well as when the pump is close to the resonance, due to strong mode-area dispersion. In this work, we present a numerical study on the effect of mode-area dispersion in a small-core AR-HCF together with an insightful analysis in detail. As we shall see, this becomes non-negligible when the pump of sufficient energy is launched near the resonance. Such a clear impact of the mode-area dispersion in gas-filled AR-HCF has not been observed until now.

2. Modeling Pulse Propagation in Gas-Filled AR-HCF with Mode-Area Dispersion

To accurately model the pulse propagation near the resonance of AR-HCF, we use a modified generalized nonlinear Schrödinger equation. We present the equation in the frequency domain, rewriting the nonlinear coefficient γ in a form that includes the full wavelength-dependence of the effective mode area. This is given as [13,14,16]:
C ˜ z L ^ ( ω ) C ˜ ( z , ω ) = i γ ( ω ) [ 1 + ω ω 0 ω 0 ] { C ( z , t ) R ( T ) | C ( z , T T ) | 2 d T } ,
where:
γ ( ω ) = n 2 n 0 ω 0 c n e f f ( ω ) A e f f ( ω ) A e f f ( ω 0 )   ,
L ^ ( ω ) = i [ β ( ω ) β 0 β 1 ( ω ω 0 ) ] α ( ω ) 2 ,
{ C ( z , t ) } = C ˜ ( z , ω ) = [ A e f f ( ω ) A e f f ( ω 0 ) ] 1 4 A ˜ ( z , ω ) .
ω is the angular frequency with ω 0 denoting the carrier, and z is the propagation length; γ ( ω ) is the wavelength-dependent nonlinear coefficient that includes the dispersions of the effective index, n e f f ( ω ) , and effective mode area, A e f f ( ω ) ; n 0 and n 2   are the linear and nonlinear refractive indices, respectively; C ˜ ( z , ω )   is the normalized form of the spectral amplitude, A ˜ ( z , ω ) , which sets the unit to be consistent within the equation [16]; L ^ ( ω ) represents the linear operator which includes the full frequency dependent wavevector β ( ω )   and attenuation α ( ω ) ; β 0 and β 1 are the zeroth- and first-order Taylor series expansion coefficients of β ( ω ) around ω 0 , which are related to the phase and group velocities at the carrier, respectively; T = t β 1 z is then the time frame moving at the group velocity of the pulse; and R (   T ) represents the Raman response function of the nonlinear medium. This term can be removed when AR-HCF is filled with atomic gas. The pulse can also be subject to self-induced photoionization. However, for the set of parameters considered in this numerical study, we can neglect this. The pulse propagation simulation is carried out by solving the modified generalized nonlinear Schrödinger equation using a split-step Fourier method in MATLAB.
We consider a silica-based AR-HCF with the core diameter D = 20 µm surrounded by eight cladding tubes each with inner diameter d = 7 µm and wall thickness t = 570 nm. The index of silica is obtained from a Sellmeier equation [17], and it ranges between 1.435 and 1.538 in the 0.2–2.2 µm wavelength region. An idealized cross-section of the fiber is presented in the inset of Figure 1b. Optical properties of the evacuated AR-HCF, i.e., the effective index, mode area, and confinement loss for the fundamental core mode, are obtained using the finite-element method (FEM) in COMSOL Multiphysics. We use the pressure-dependent dispersion and nonlinear index of the filling gas as measured in Refs. [18,19], respectively. The blue line in Figure 1a is the group-velocity dispersion (GVD or β 2 , 2 β ( ω ) / ω 2 ) of the fundamental mode when it is filled with 20 bar xenon. The first- to fourth-order resonant bands located at 900–1400 nm, 550–630 nm, 390–420 nm, and 300–320 nm, are highlighted in yellow. The red-dashed line represents the GVD profile of an equivalent dielectric capillary having the same core size. It agrees well with that of AR-HCF in the transmission bands, especially towards the short wavelength side. The difference between the capillary and AR-HCF grows from 1650 nm onwards. The confinement loss of the AR-HCF in dB per unit length is shown in grey shade. Figure 1b presents the effective area of the fundamental core mode as a function of the wavelength. The mode area varies smoothly in the transmission windows but changes rapidly near the resonances. A large increase in the mode area in the resonant bands leads to a substantial reduction in the nonlinearity since they are inversely proportional to each other.
We observe that the effective area of the fundamental core mode increases with the decreasing order of the transmission window, whereas within each transmission band, it decreases with the wavelength. A similar observation has been reported in [20]. Noting that the effective mode area in a solid-core fiber grows monotonically with wavelength, we attribute this unintuitive effect in AR-HCF to the fact that the guidance originates from the presence of microstructured cladding. As the wavelength increases, the relative cross-sectional size of the AR-HCF structure with respect to the wavelength shrinks, resulting in the longer wavelength light experiencing a stronger effect of the waveguide. This leads to tighter confinement of the mode and a smaller effective mode area at a longer wavelength within a given transmission band. However, the general tendency of the mode spreading over a larger area when the wavelength increases as seen in solid-core fiber is also in effect. Due to the above two effects competing against one another, the variation of the mode area across transmission bands in AR-HCF, excluding the regions around resonances, is relatively small (e.g., the difference is only 1.8% between the mode at 0.5 µm and 2 µm)

3. Discussion

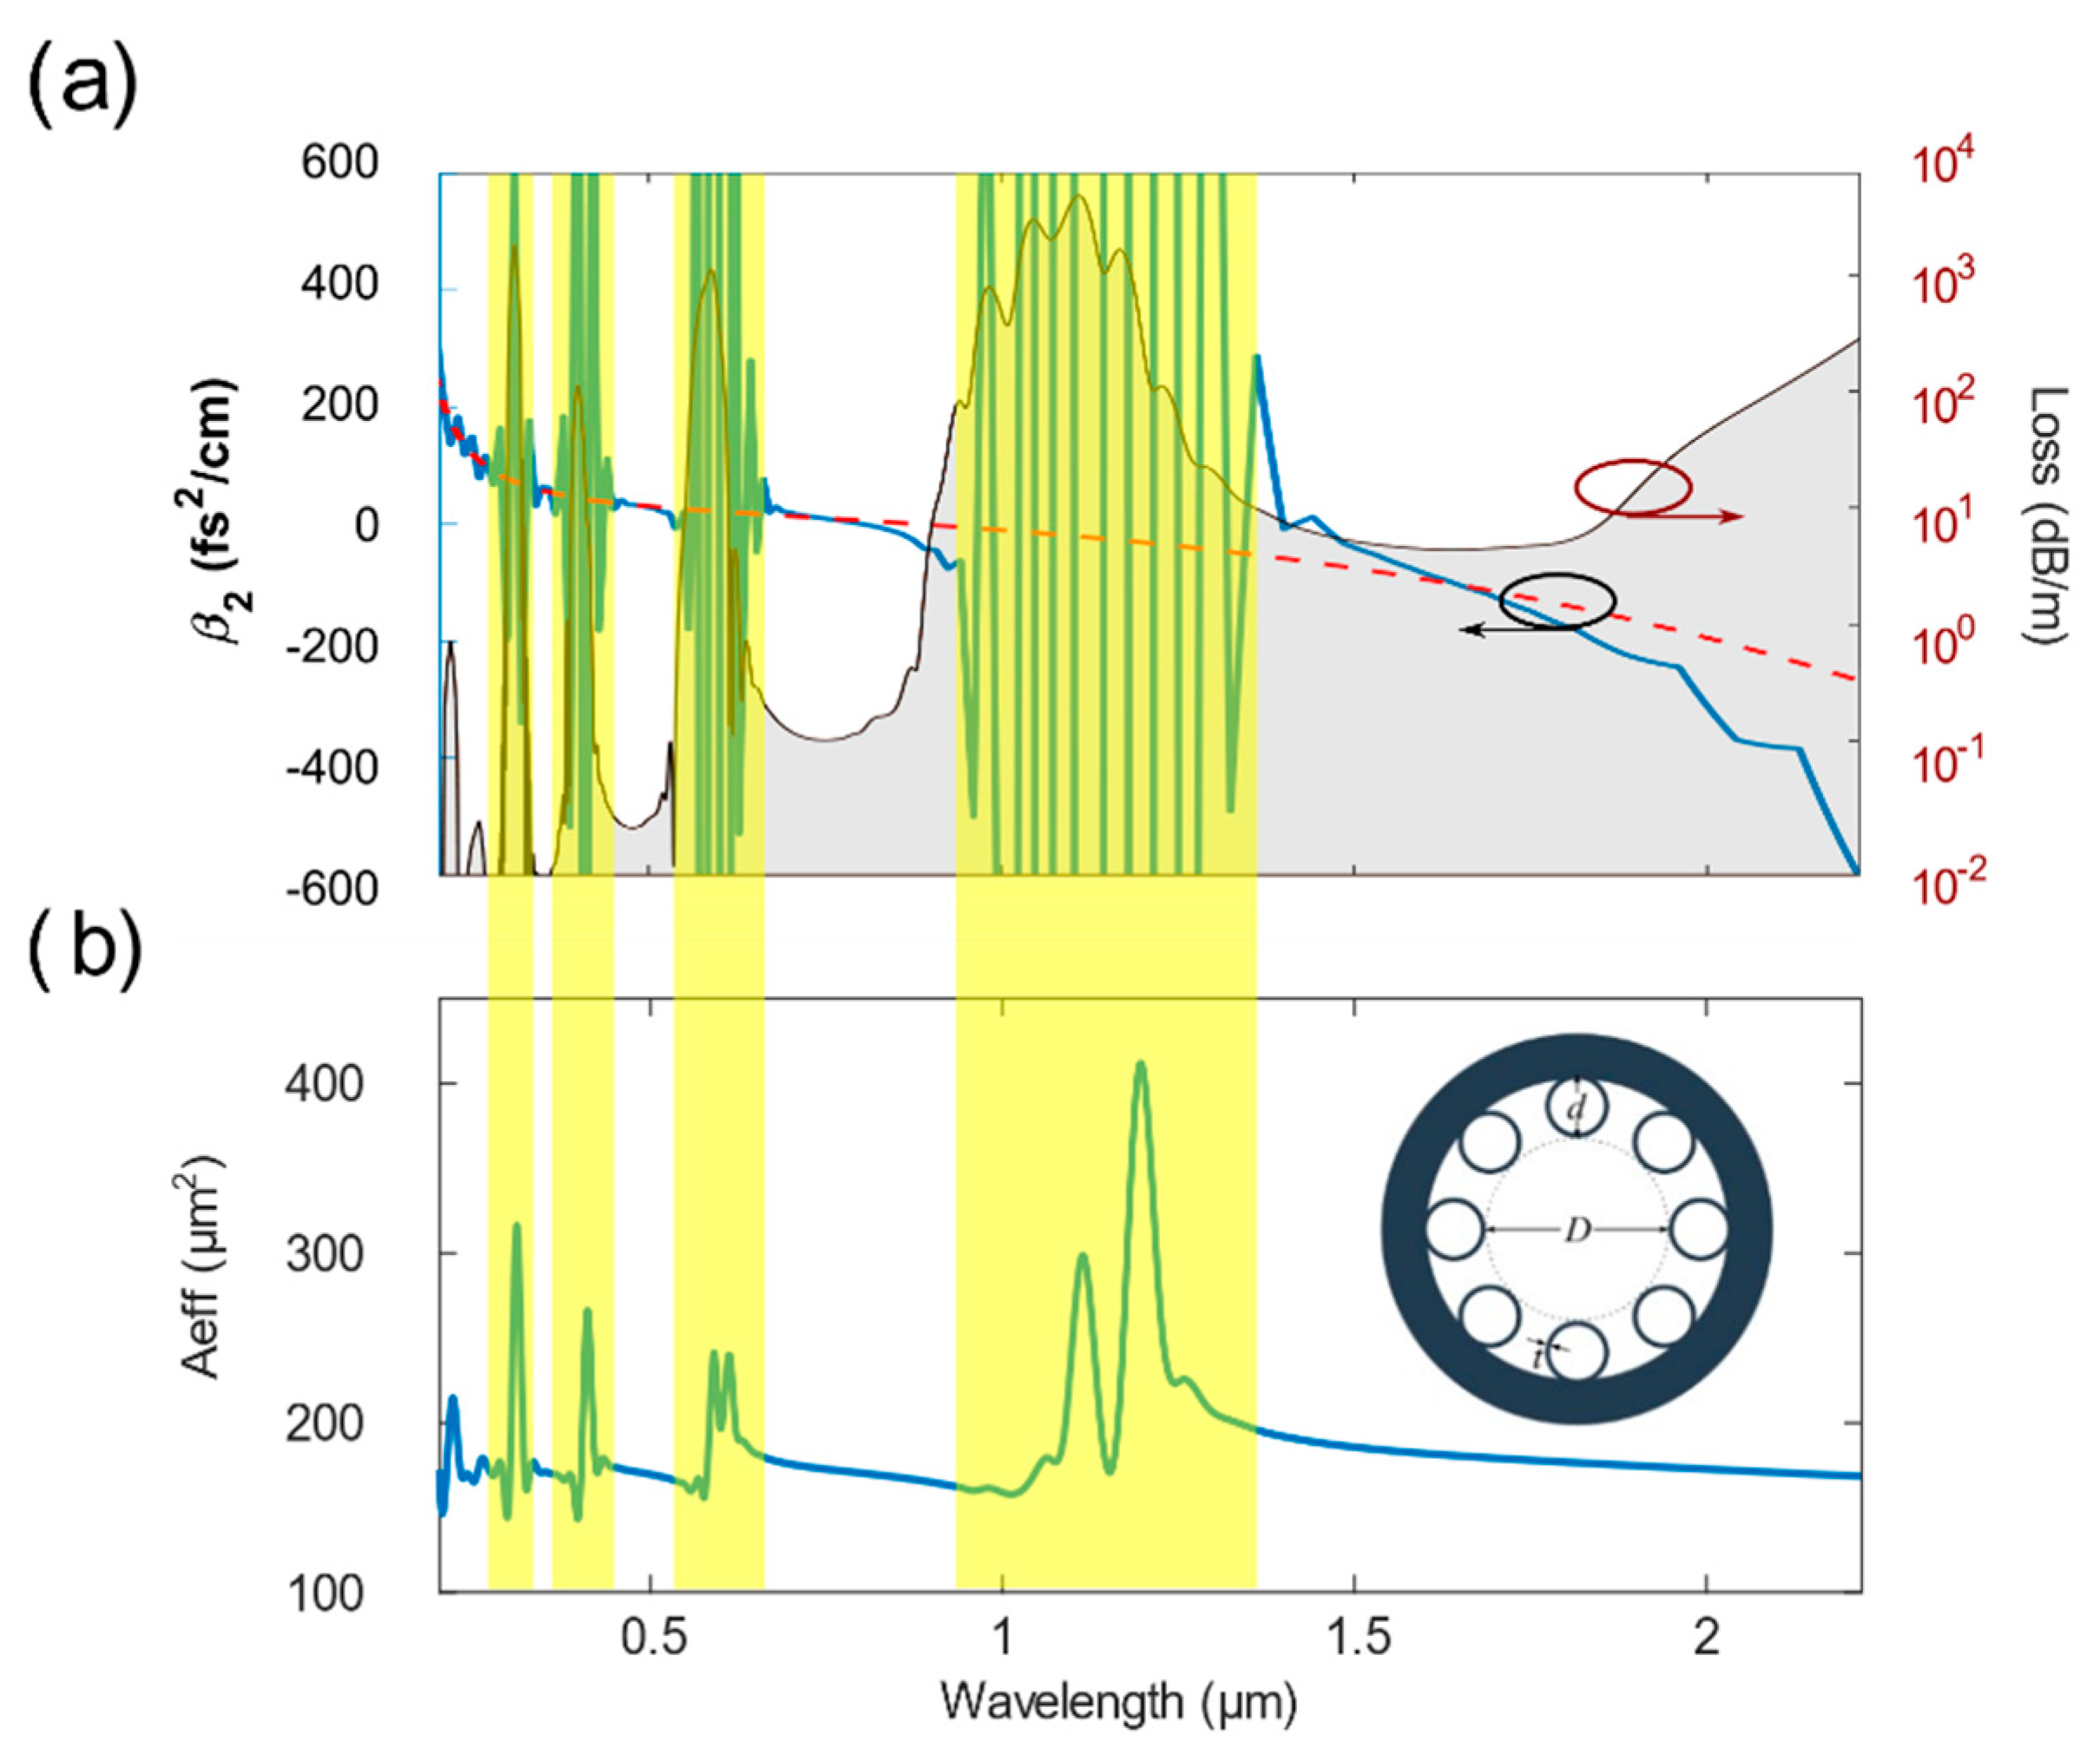
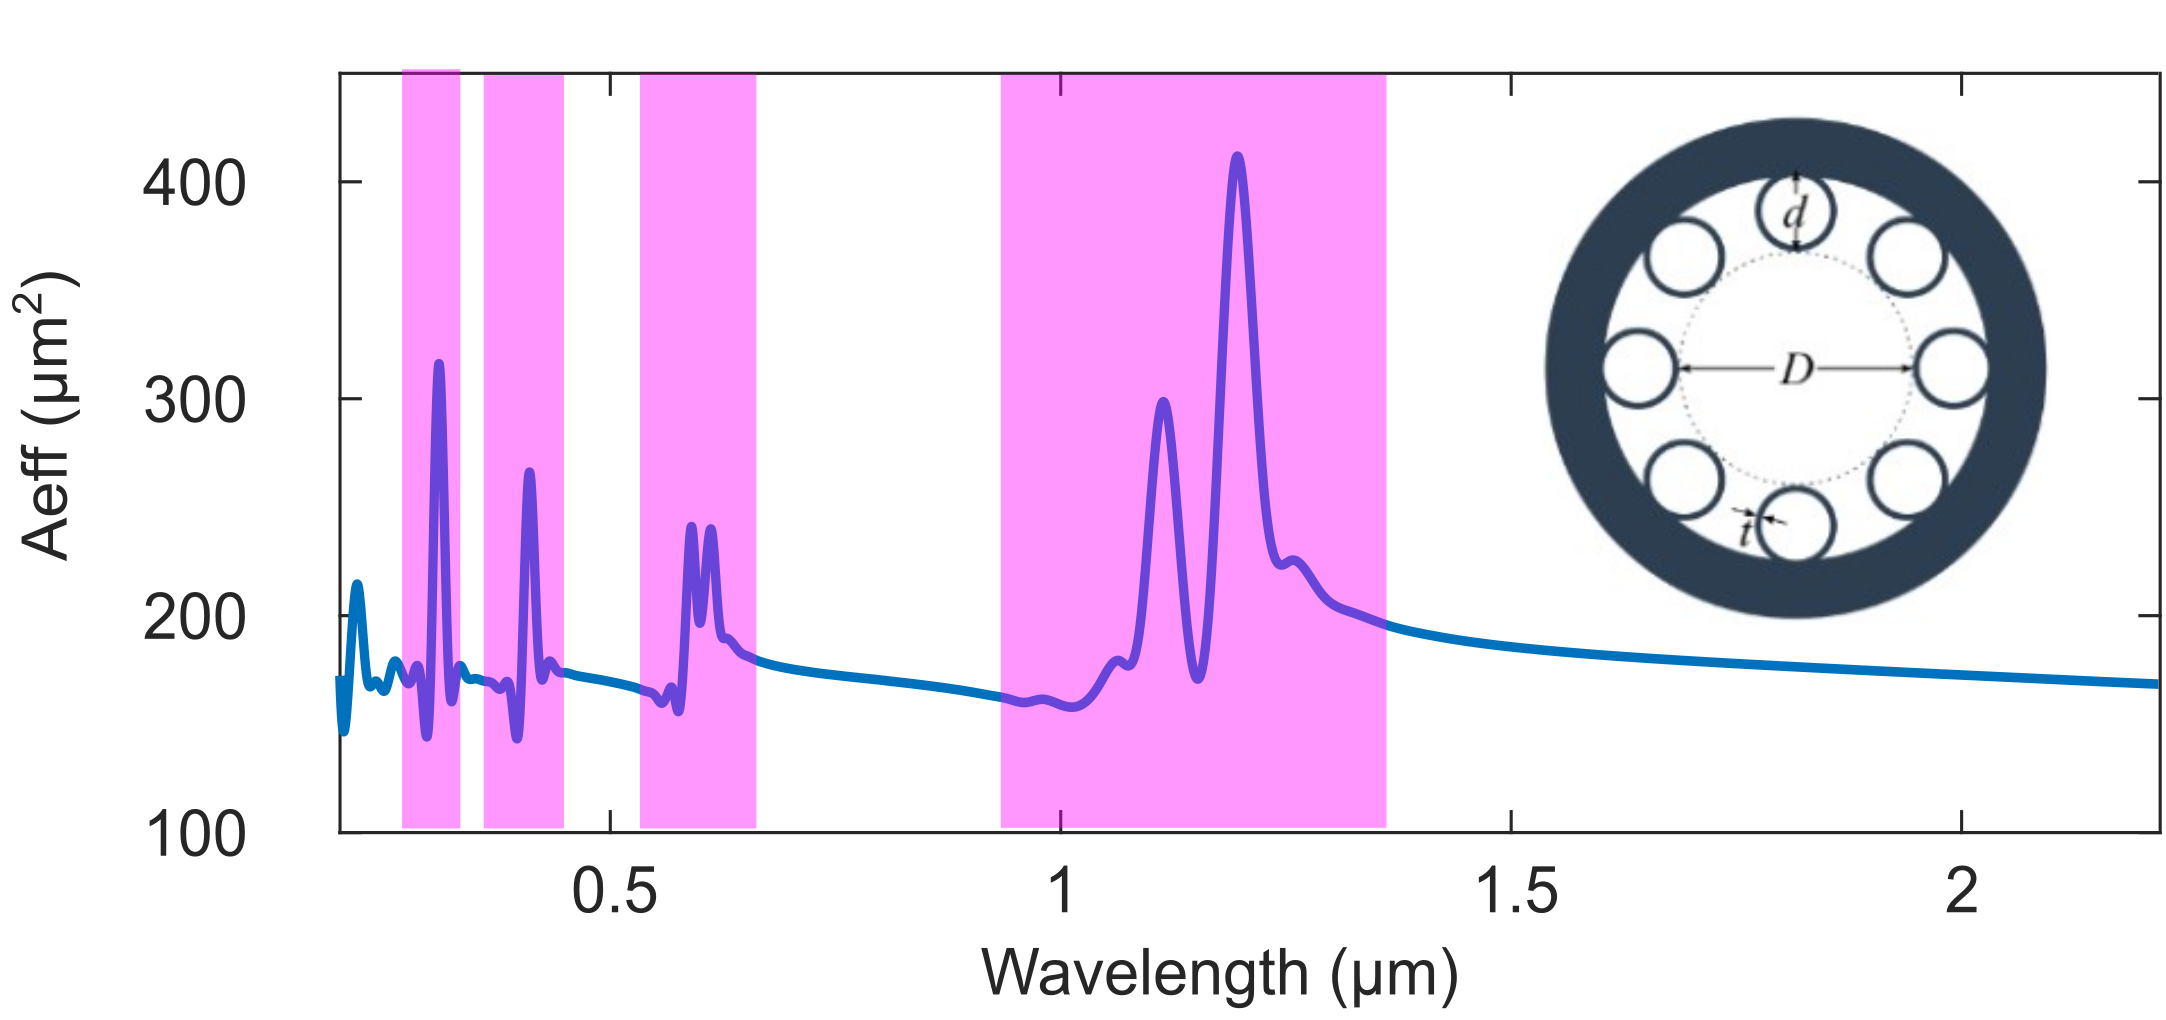
3.1. Pulse Propagation at 1430 nm

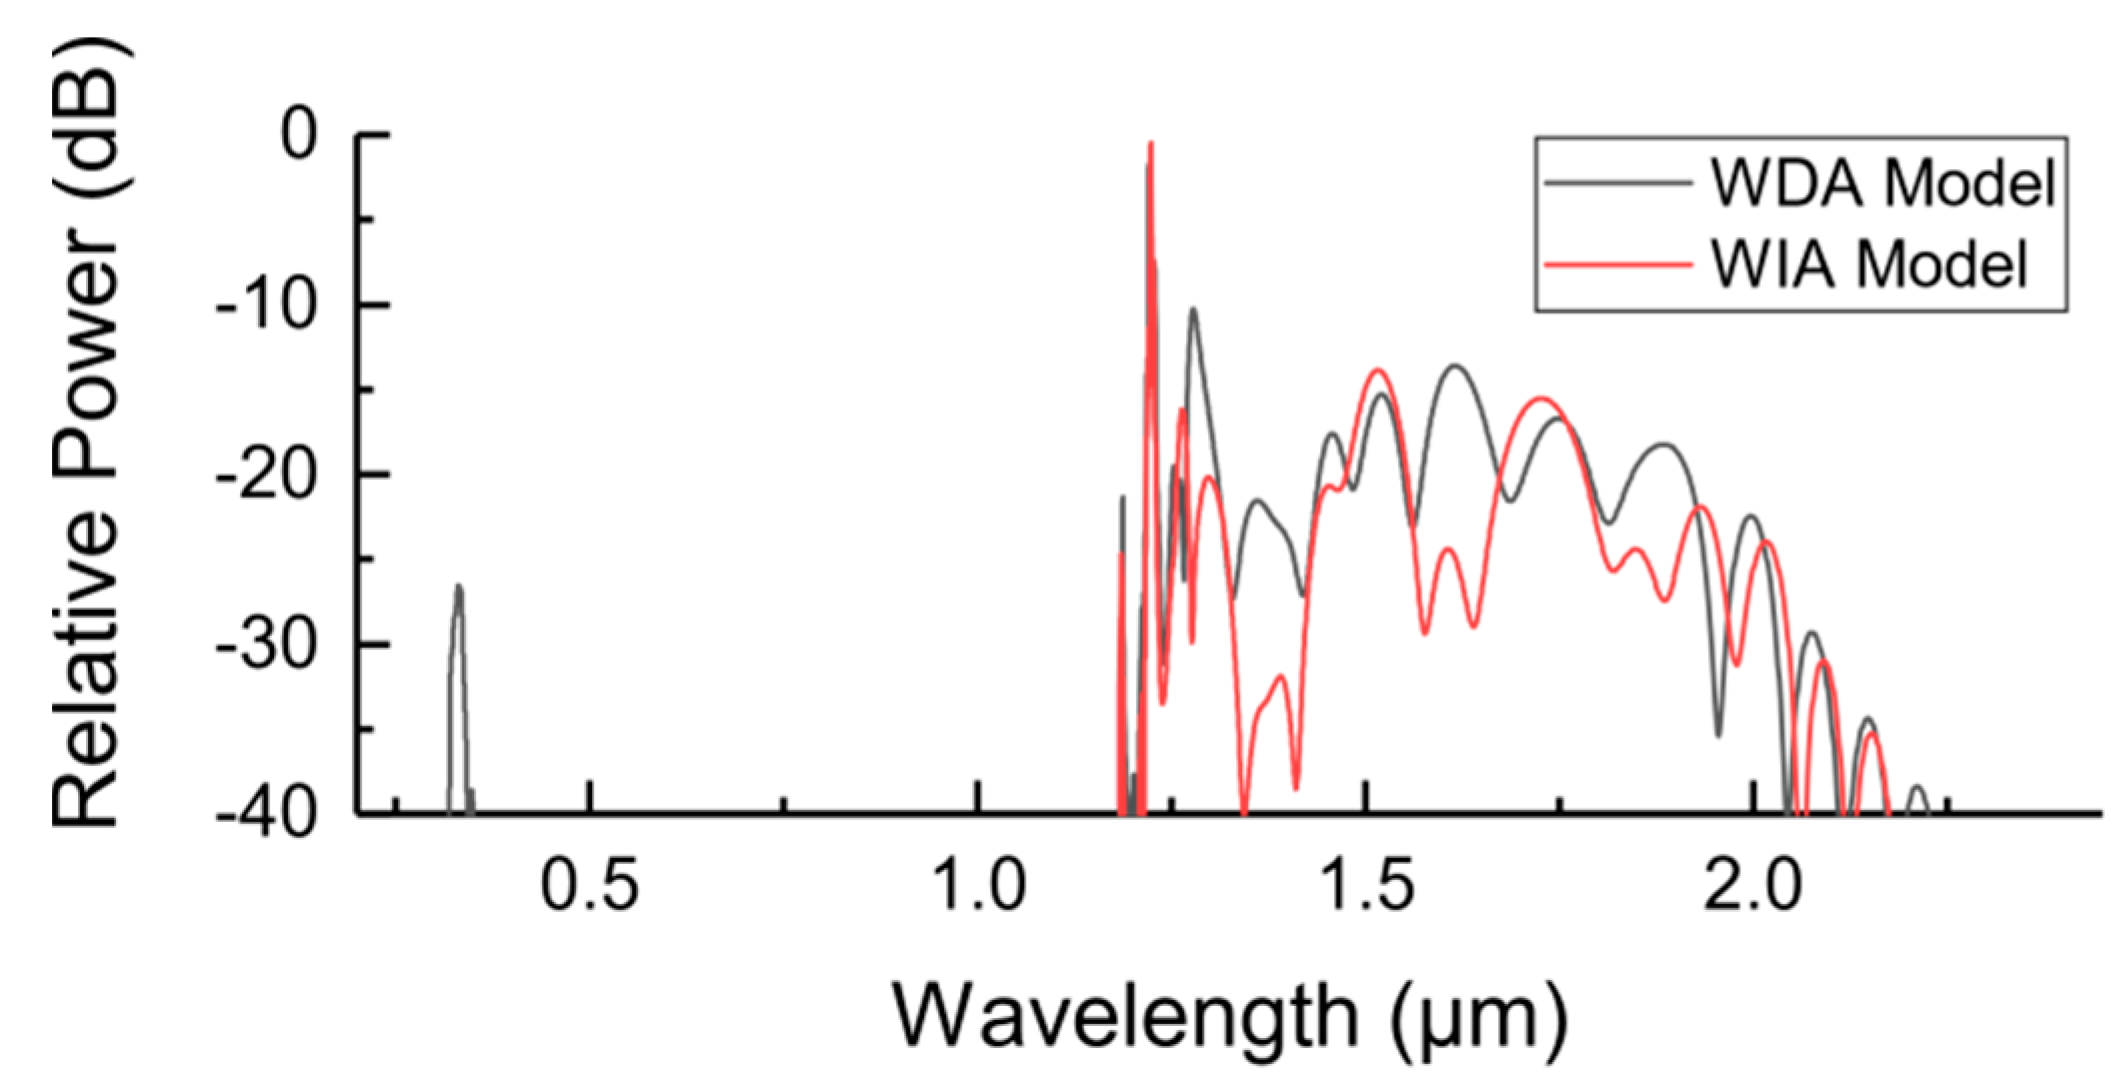
We first investigate the case where the femtosecond pump is at 1430 nm wavelength as an example, which is close to the first resonant band and within the first transmission window. We launch a 30 fs, 0.8 µJ pulse centered at 1430 nm into a 5 cm-long AR-HCF filled with 20 bar xenon. We simulate the pulse propagation using two different models. One accounts for the wavelength-dependent mode area (WDA model) as outlined in Equations (1–4), and the other one assumes a constant mode area for all wavelengths, i.e., wavelength-independent mode area model (WIA model). The spectra obtained with the two models at the output of the fiber are shown in 
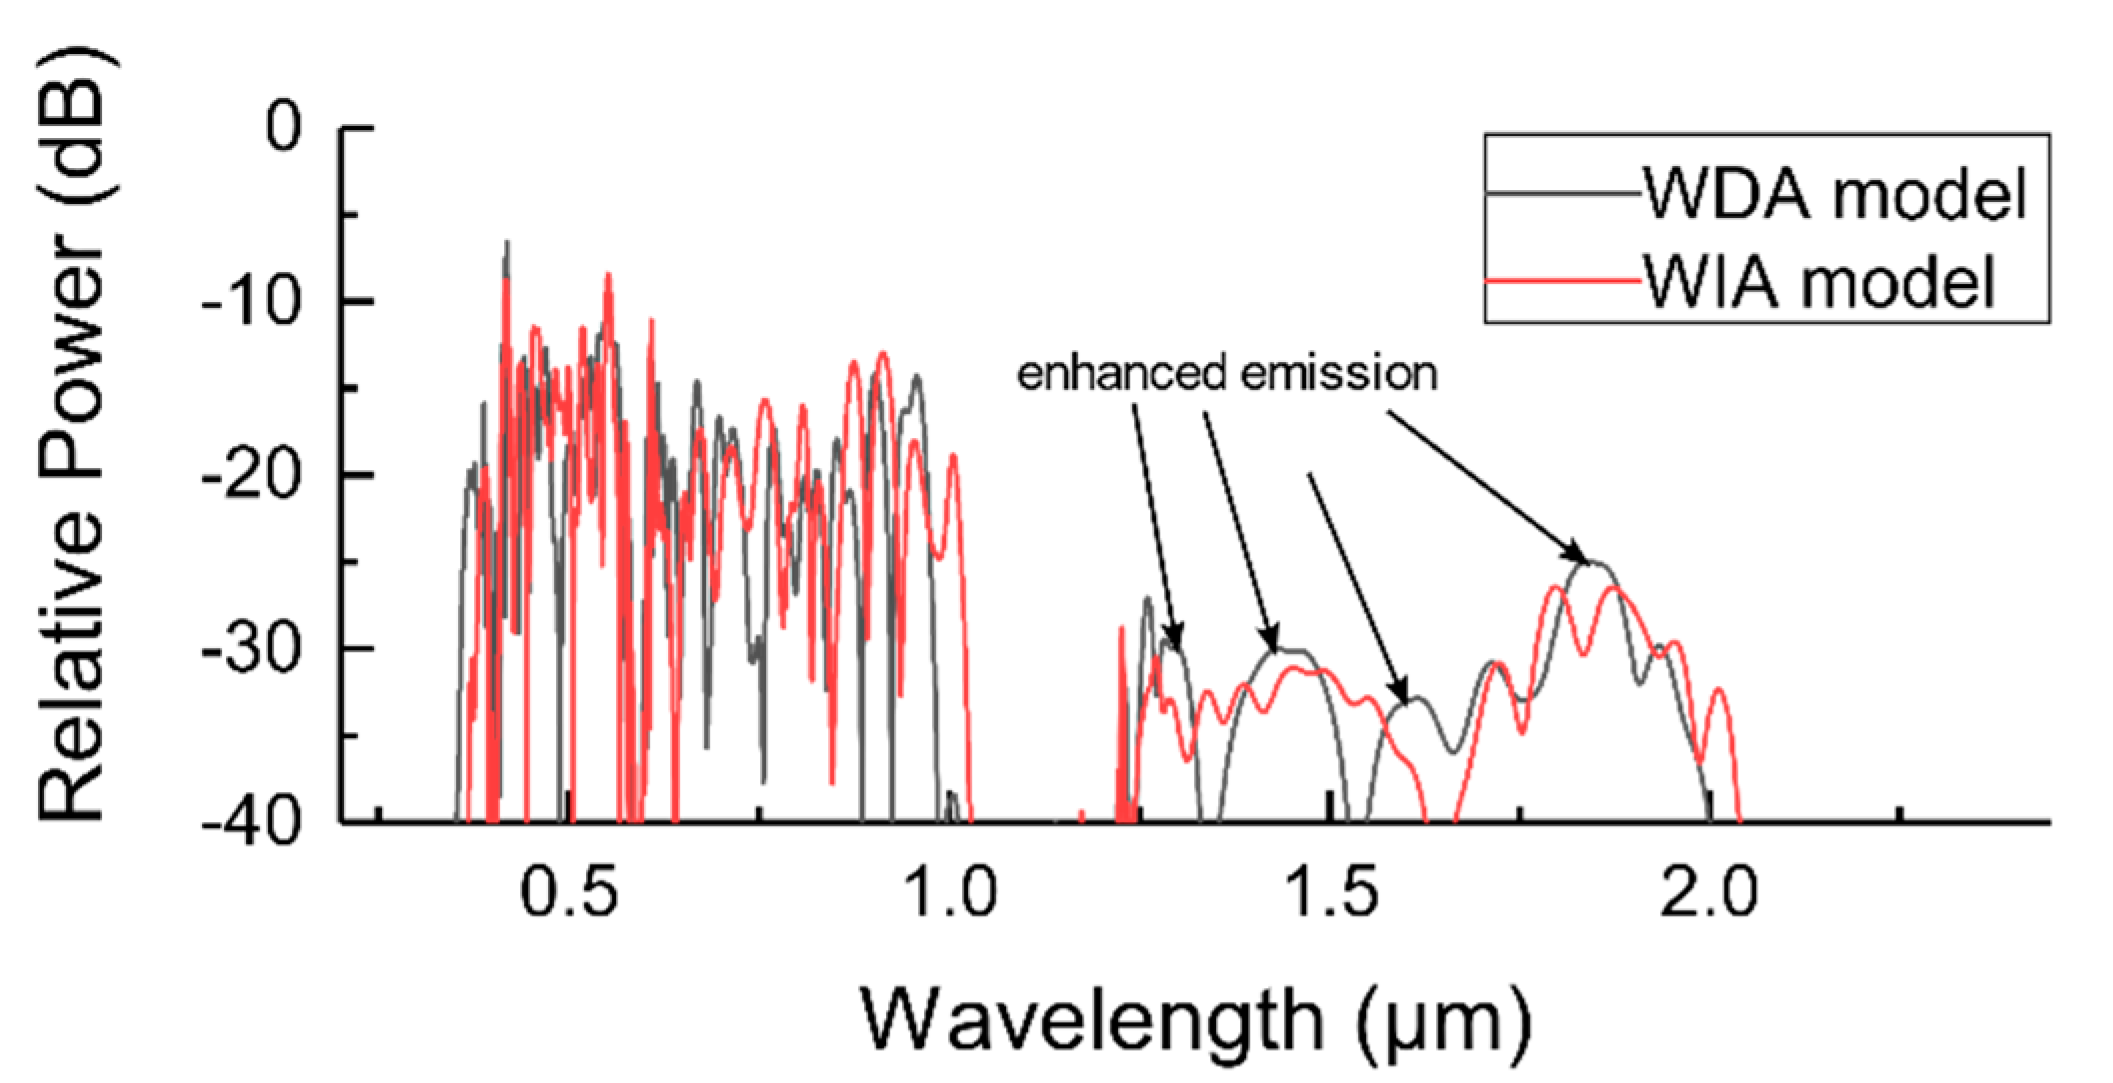
Figure 2. They are normalized with respect to the maximum peak power obtained with the WDA model. We note that the spectral output of the WDA model is flatter, and it exhibits a spectral peak at 330 nm generated via dispersive wave emission. This is absent in the WIA model.
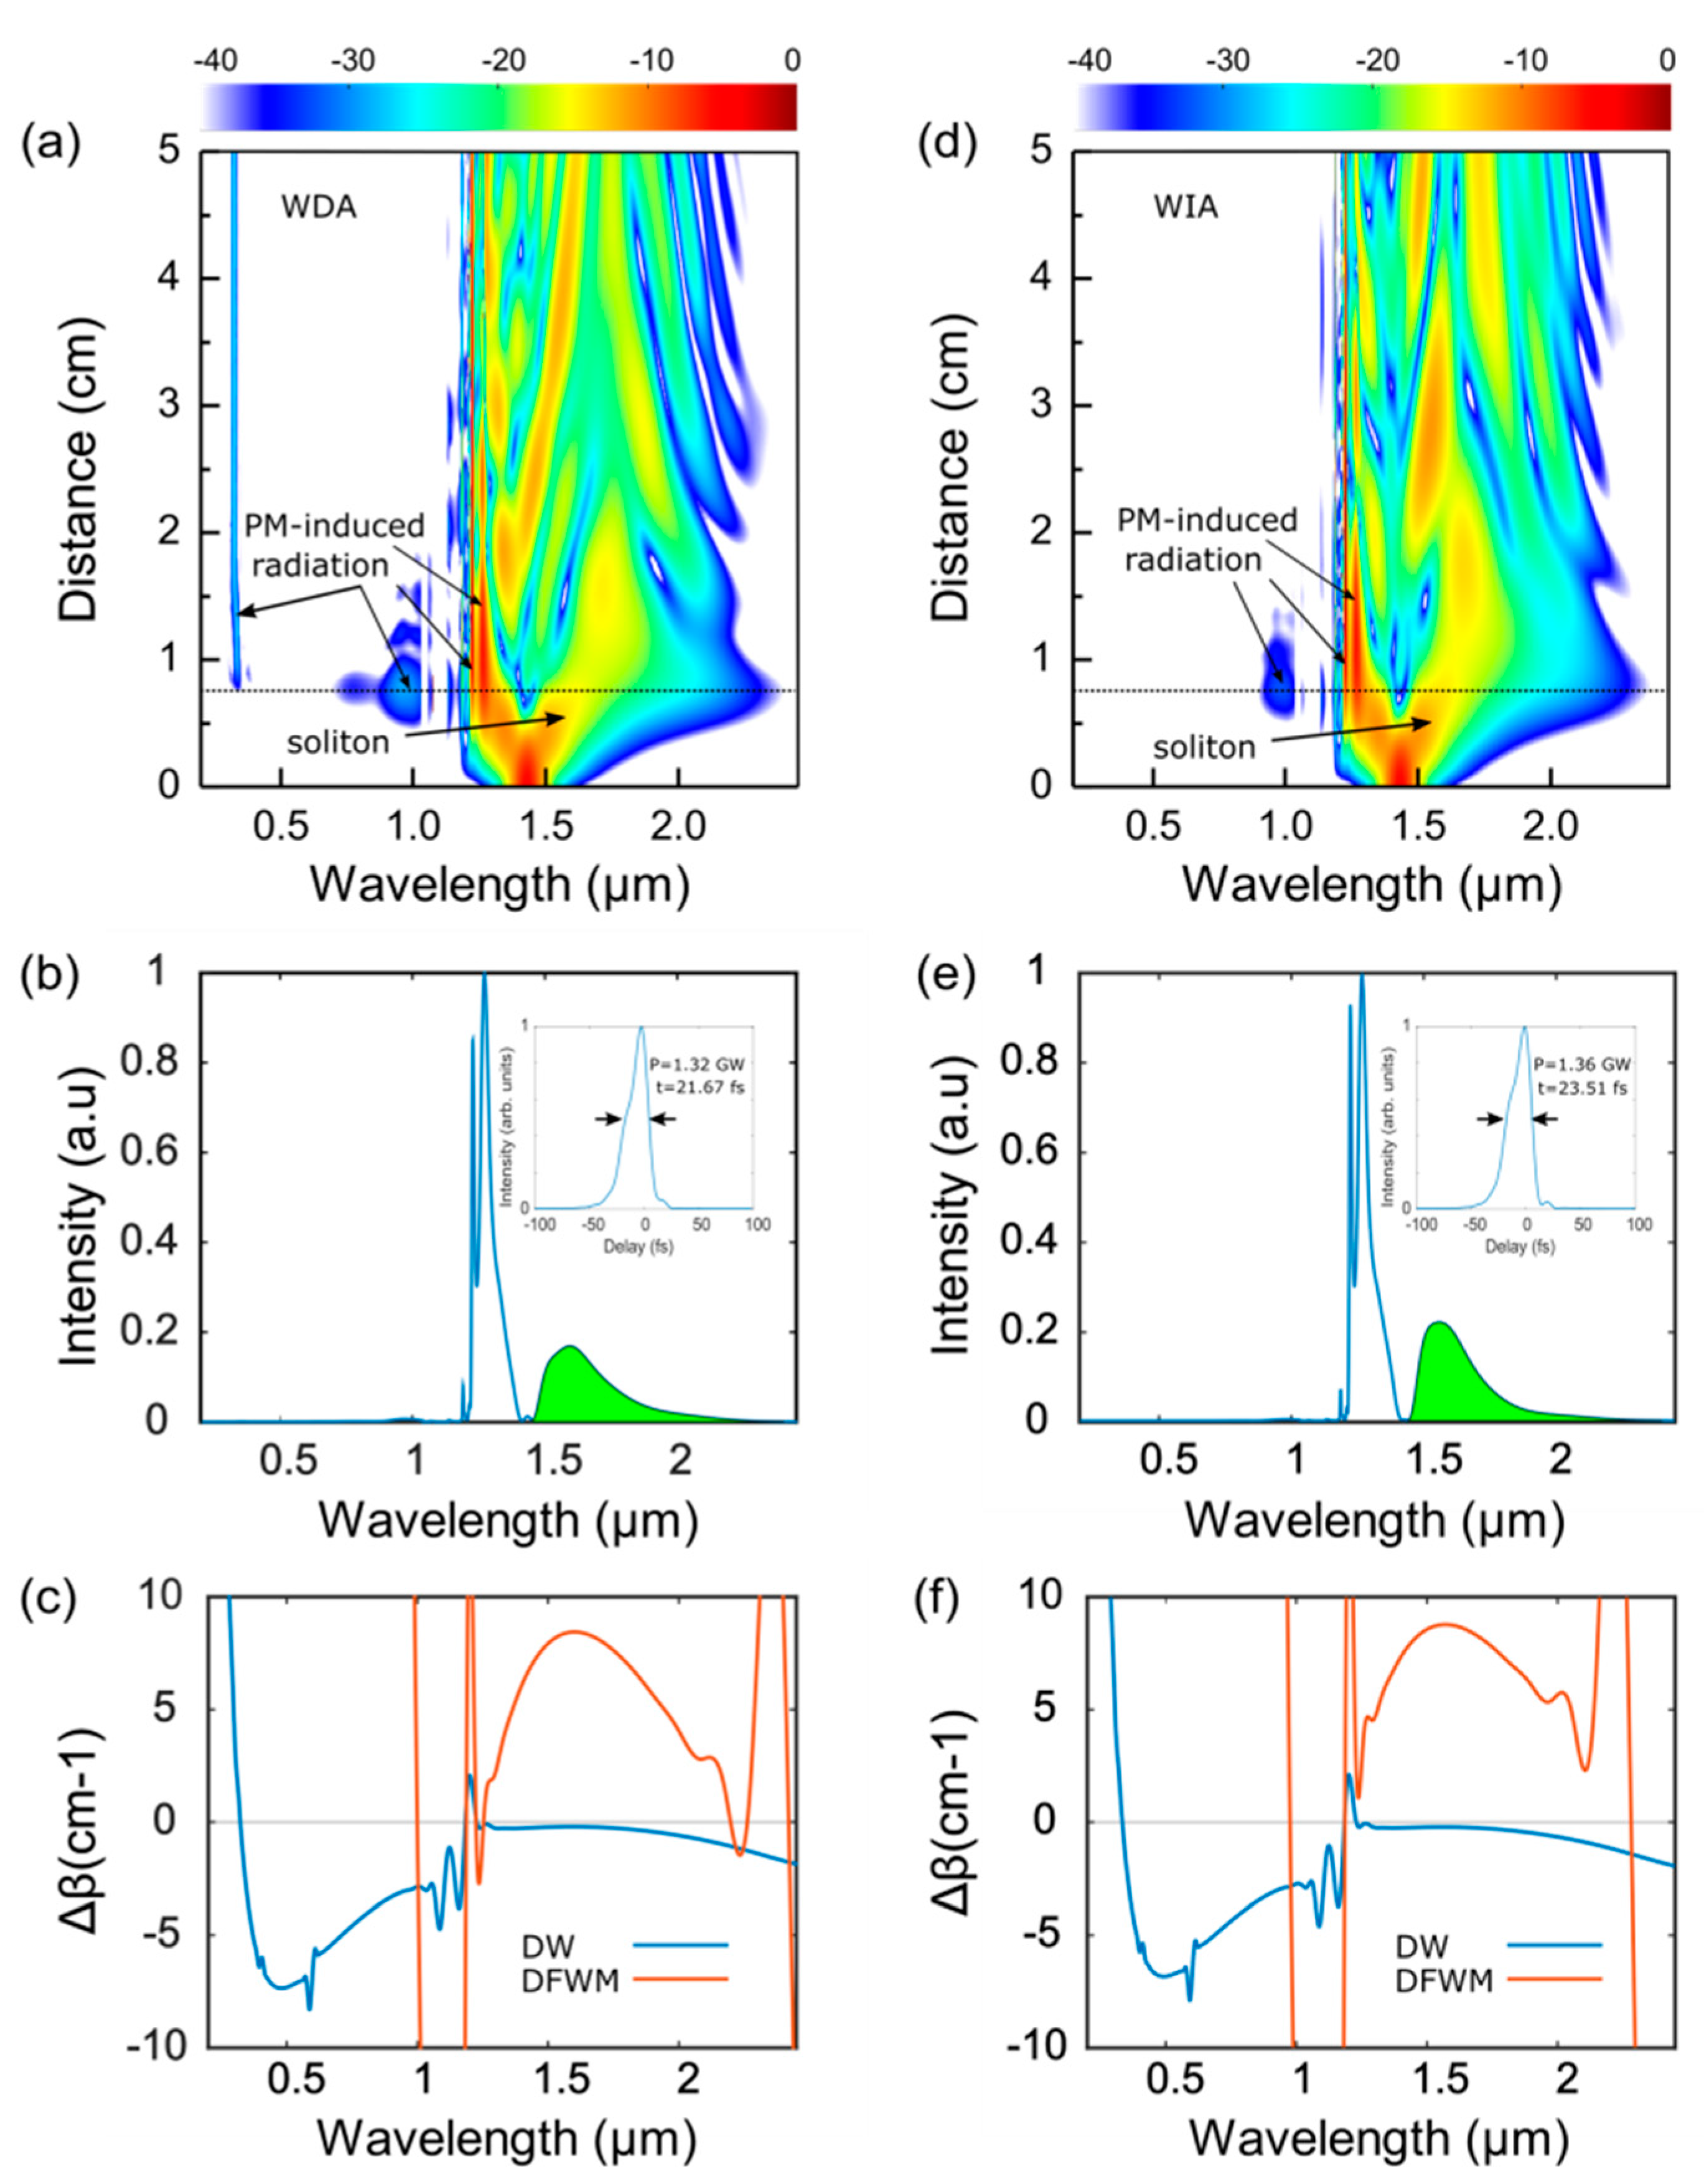
To identify the origin of the differences in the two cases, we compare the spectral evolutions under the two models shown in Figure 3a,d. In both models, the pump at 1430 nm initially experiences weak normal dispersion. Due to strong nonlinearity coming from the high-density xenon, it undergoes rapid spectral broadening induced by self-phase modulation in both models, and a large chunk of the spectrum tunnels into the anomalous dispersion regime located above 1450 nm. The presence of the first resonant band near the pump prevents the broadening of the spectrum towards the shorter wavelength side. A similar phenomenon has also been observed in Ref. [14], where the authors referred to it as a frequency locking effect. The strong effect of third-order dispersion near the resonance decelerates further frequency shift. As a result, the spectrum broadens asymmetrically towards the longer wavelength and the spectral component in the anomalous dispersion regime forms a soliton. In both cases, the maximum spectral broadening is achieved at around 0.75 cm, where the pulse is compressed to its shortest duration. After reaching the maximum compression, soliton fission accompanied by emission of a dispersive wave (DW) at 330 nm is observed in the WDA model, which arises due to the phase-matching between the soliton and linear wave in the presence of higher-order dispersion [21]. The broadened pump spectrum overlaps with the phase-matching point initiating the onset of DW [22,23,24]. Nevertheless, as shown in Figure 3d, this is absent in the case of the WIA model. Since the DW generation is mediated by the soliton, we extract the green highlighted spectral components in Figure 3b,e. We note that the two highlighted spectral components are both in the anomalous dispersion regime. However, they are centered at different wavelengths. In the WDA model, the center wavelength—wavelength with the highest intensity—is at 1591 nm, while in the WIA model, this is at 1559 nm. The temporal profiles of the green highlighted spectra are presented in the respective insets. Namely, the peak power is 1.32 GW and the full width at half maximum (FWHM) duration is 21.7 fs in the WDA model, corresponding to the soliton number, N = 2.8 . In the WIA model, the peak power is slightly higher at 1.36 GW and FWHM duration is longer at 23.5 fs, amounting to the soliton number, N = 3.4 . Figure 3c,f shows the DW and degenerate four-wave mixing (DFWM) dephasings for the two solitons using their respective center wavelengths of the green-highlighted spectral band as the pump. The DW and DFWM phase-matching conditions are given by [25]:
β DW ( ω ) = β ( ω ) [ β ( ω s o l ) + β 1 ( ω s o l ) ( ω ω s o l ) + γ P s o l 2 ] ,
β DFWM = β ( ω s ) + β ( ω i ) 2 β ( ω p ) + 2 γ P .  
In Equation (5), ω s o l is the center angular frequency of the soliton and P s o l is the peak power at its maximum compression point. In Equation (6), ω p , ω i , and ω s are the angular frequencies of the pump, idler, and signal in the DFWM process, and we use ω p = ω s o l in plotting Figure 3e,f. P is the peak power of the pump soliton as indicated in the insets of Figure 3b,e.
In Figure 3c, the DW emission at 330 nm for the WDA model is accurately predicted. Some other phase-matching points, such as those located at 1.06 µm, 1.18 µm, and 1.23 µm in the dephasing plot are also manifested by radiations that appear at these wavelengths in Figure 3a. Radiation induced by the rest of the phase-matching points is either too weak to be observed or being overlapped by the main pulse spectral. Observations are similar in the WIA model shown in Figure 3d,e. However, we note that the phase-matching at around 330 nm is not reflected in the spectral evolution shown in Figure 3d. We attribute this to weaker spectral overlap between the soliton and DW phase-matching point as shown in the subsequent analysis. The differences between the dephasings in both models are small, which is because the inclusion of the mode-area dispersion only slightly affects the nonlinear correction term, which has only a small contribution to the dephasing in both DW emission and DFWM process.
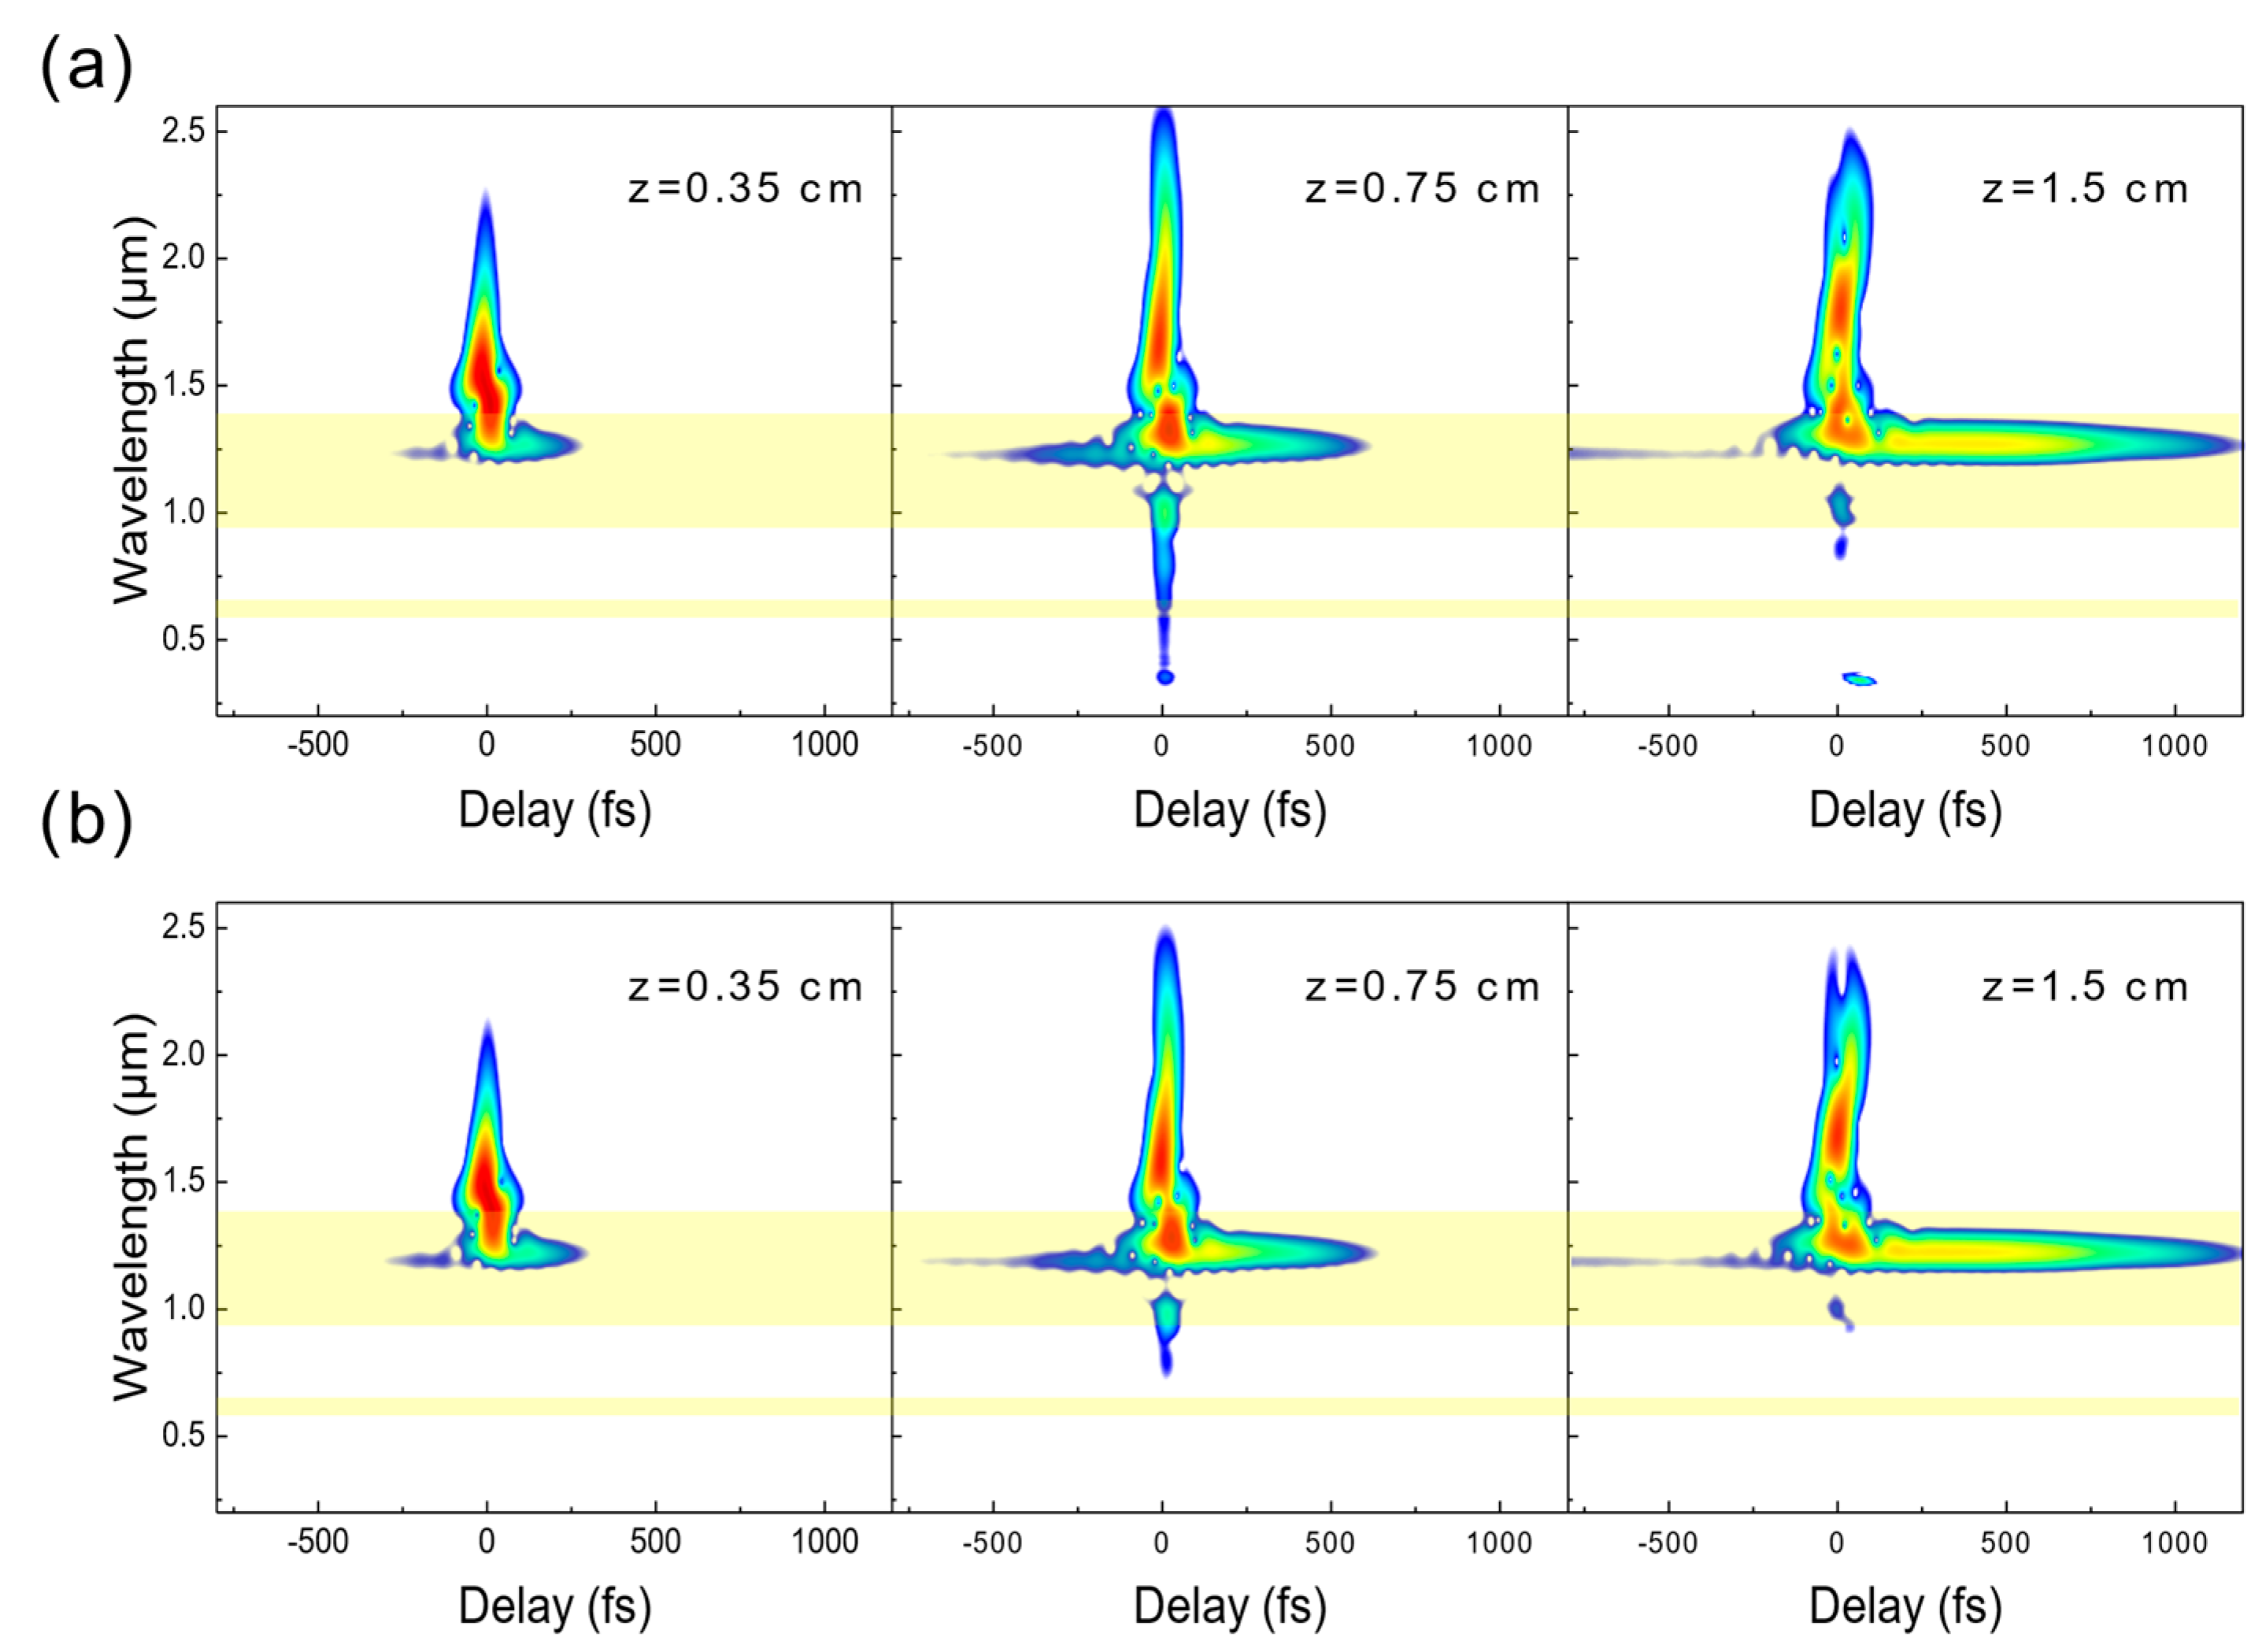
Figure 4a,b presents the spectrograms at different positions in AR-HCF with the WDA and WIA models. They are obtained using the cross-correlation frequency-resolved optical gating with a 35 fs Gaussian pulse as the gate. The pulse initially undergoes SPM-induced symmetric spectral broadening. After propagating for a short distance, the blue edge of the spectrum enters the highly dispersive resonant region, where the pulse experiences rapid temporal broadening and a decrease in the peak intensity. Moreover, the loss and mode area also increase substantially in the resonant band. The combination of these effects prohibits the spectrum’s further extension toward the shorter wavelength, making it highly asymmetric.
At 0.75 cm, the pulse reaches the maximum compression point, as indicated by the black dashed lines in Figure 3a,d. In the case of the WDA model, the spectrum broadens significantly and overcomes the high-loss in the resonant region (highlighted in yellow in Figure 4) and seeding sufficient photons at the DW phase-matching point at 330 nm. In the case of the WIA model, the spectral broadening is weaker, and its tail does not reach the phase-matching point in the ultraviolet region as shown in Figure 4b middle panel, thus no emission is observed at 330 nm. A bigger spectral broadening is achieved in the WDA model than in the WIA model despite the lower soliton number.
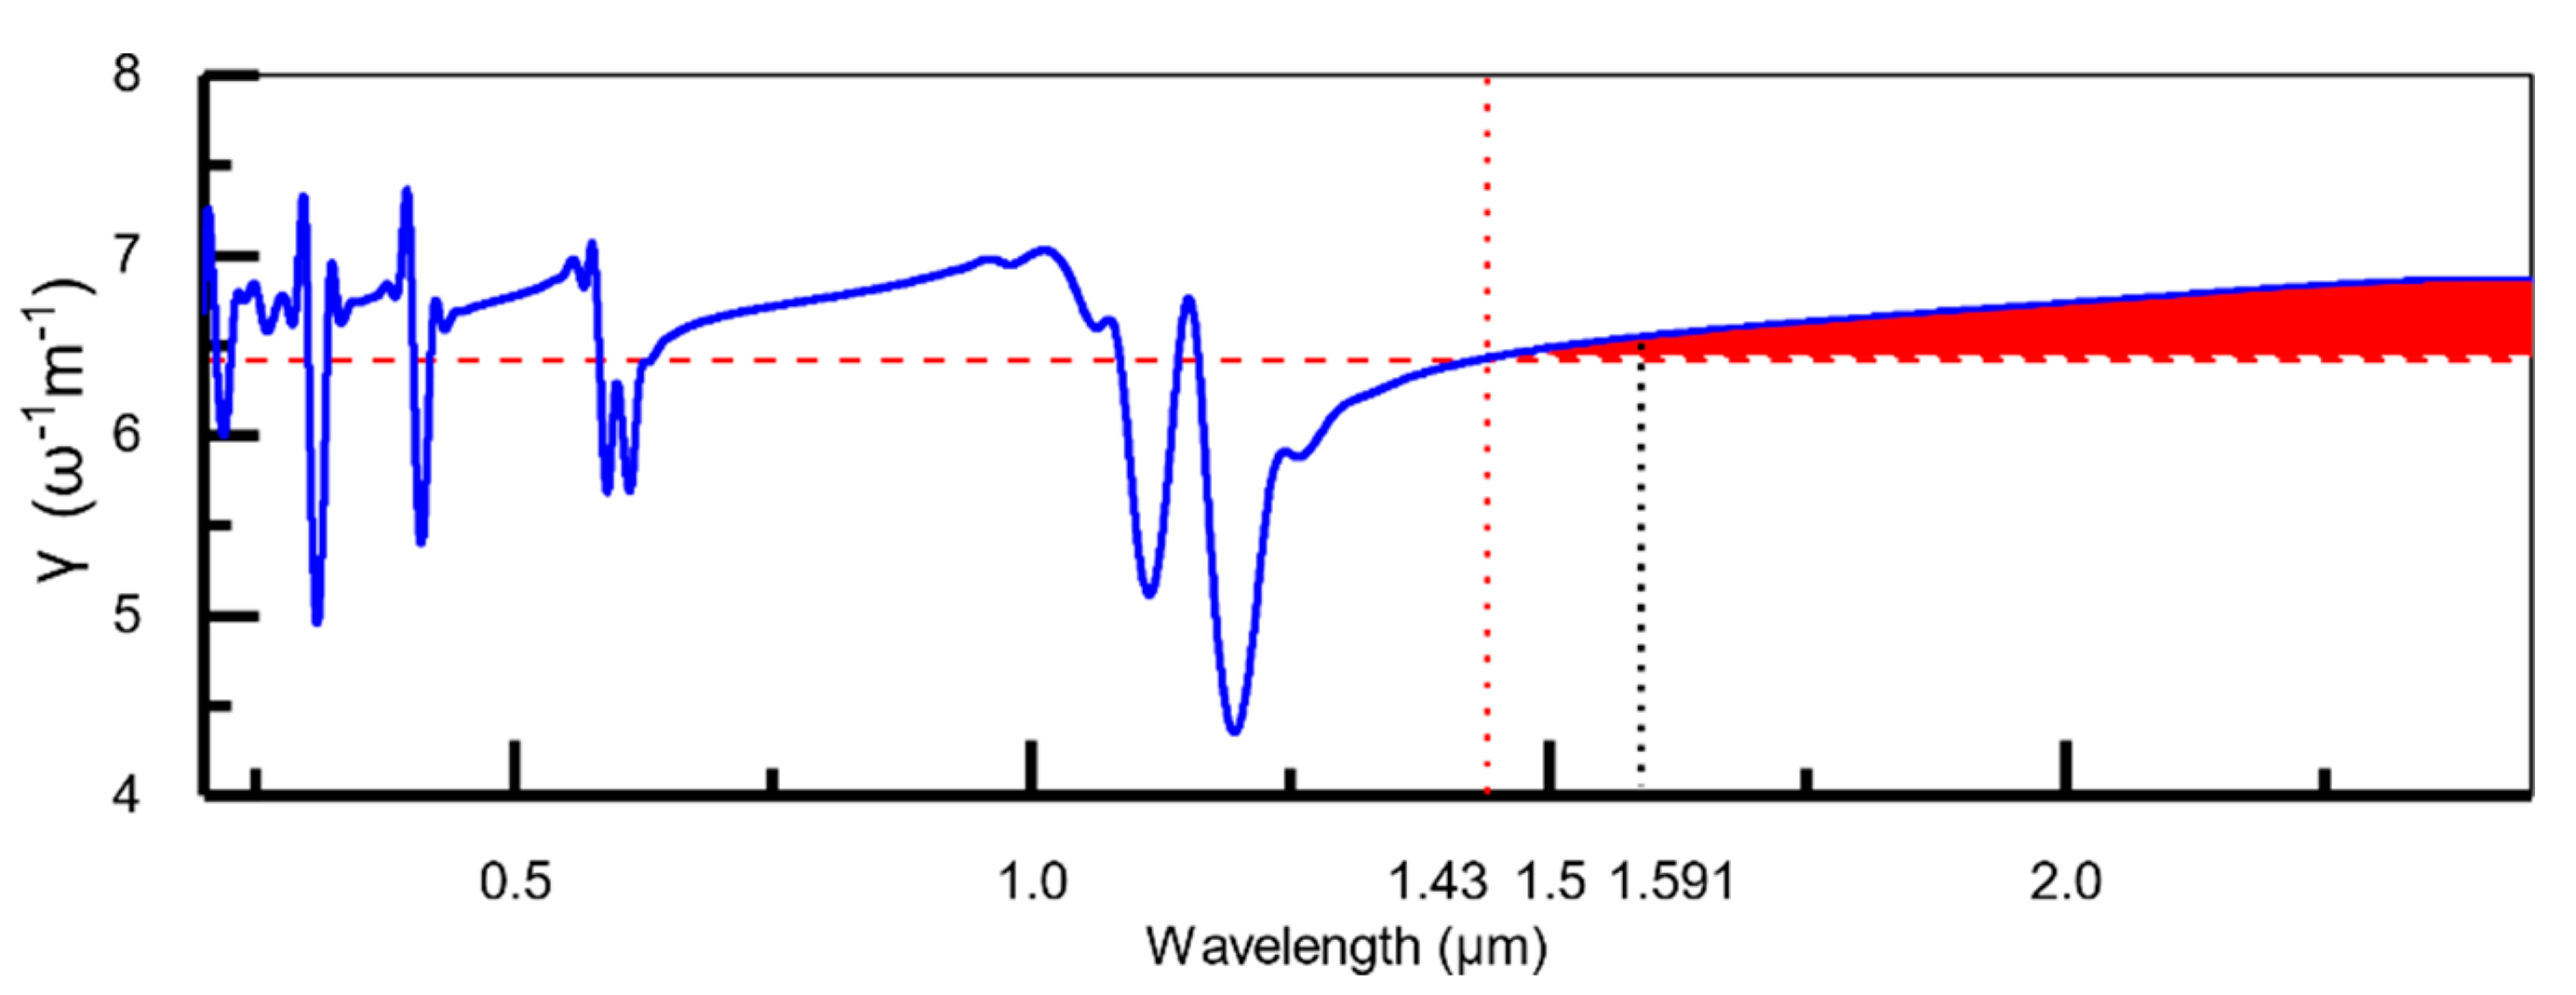
The reason for the shorter compressed duration and stronger spectral broadening in the WDA model despite the smaller soliton number is due to the wavelength-dependent nonlinear coefficient, γ ( ω ) . Figure 5 shows γ ( ω ) in the spectral region of our interest, and this is what is used in the pulse propagation simulation in the WDA model. The vertical red-dotted line marks the pump at 1430 nm, and the horizontal red-dashed line indicates the nonlinear coefficient at the pump wavelength, which is the value that is used in the WIA model. The soliton appears centered in the red shaded area, and hence the nonlinear coefficient experienced by the soliton in the WIA model is underestimated. The higher nonlinear parameter shifts the soliton in the WDA model further to the longer wavelength (center wavelength of 1591 nm at 0.75 cm) than the WIA model (center wavelength of 1559 nm at 0.75 cm) due to larger nonlinear phase shift induced by the stronger nonlinearity. As seen from the GVD profile in 
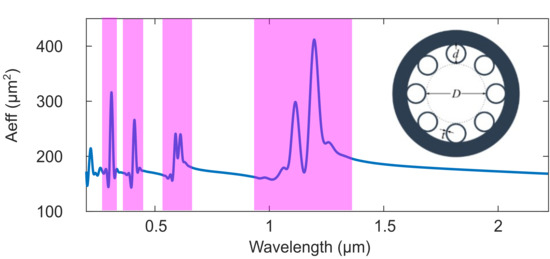
Figure 1a, further away from the zero-dispersion wavelength at 1450 nm alleviates the impact of higher-order dispersion which deteriorates the soliton effect compression [26], resulting in a shorter compressed duration for the soliton in the WDA model that supports a wider spectral broadening, as shown in the second column in Figure 4a,b. Moreover, a higher nonlinear coefficient also enables more efficient energy transfer via the DFWM process [27] to the intermediate wavelength at 1.06 µm in the WDA model, as evident in Figure 3a,d.
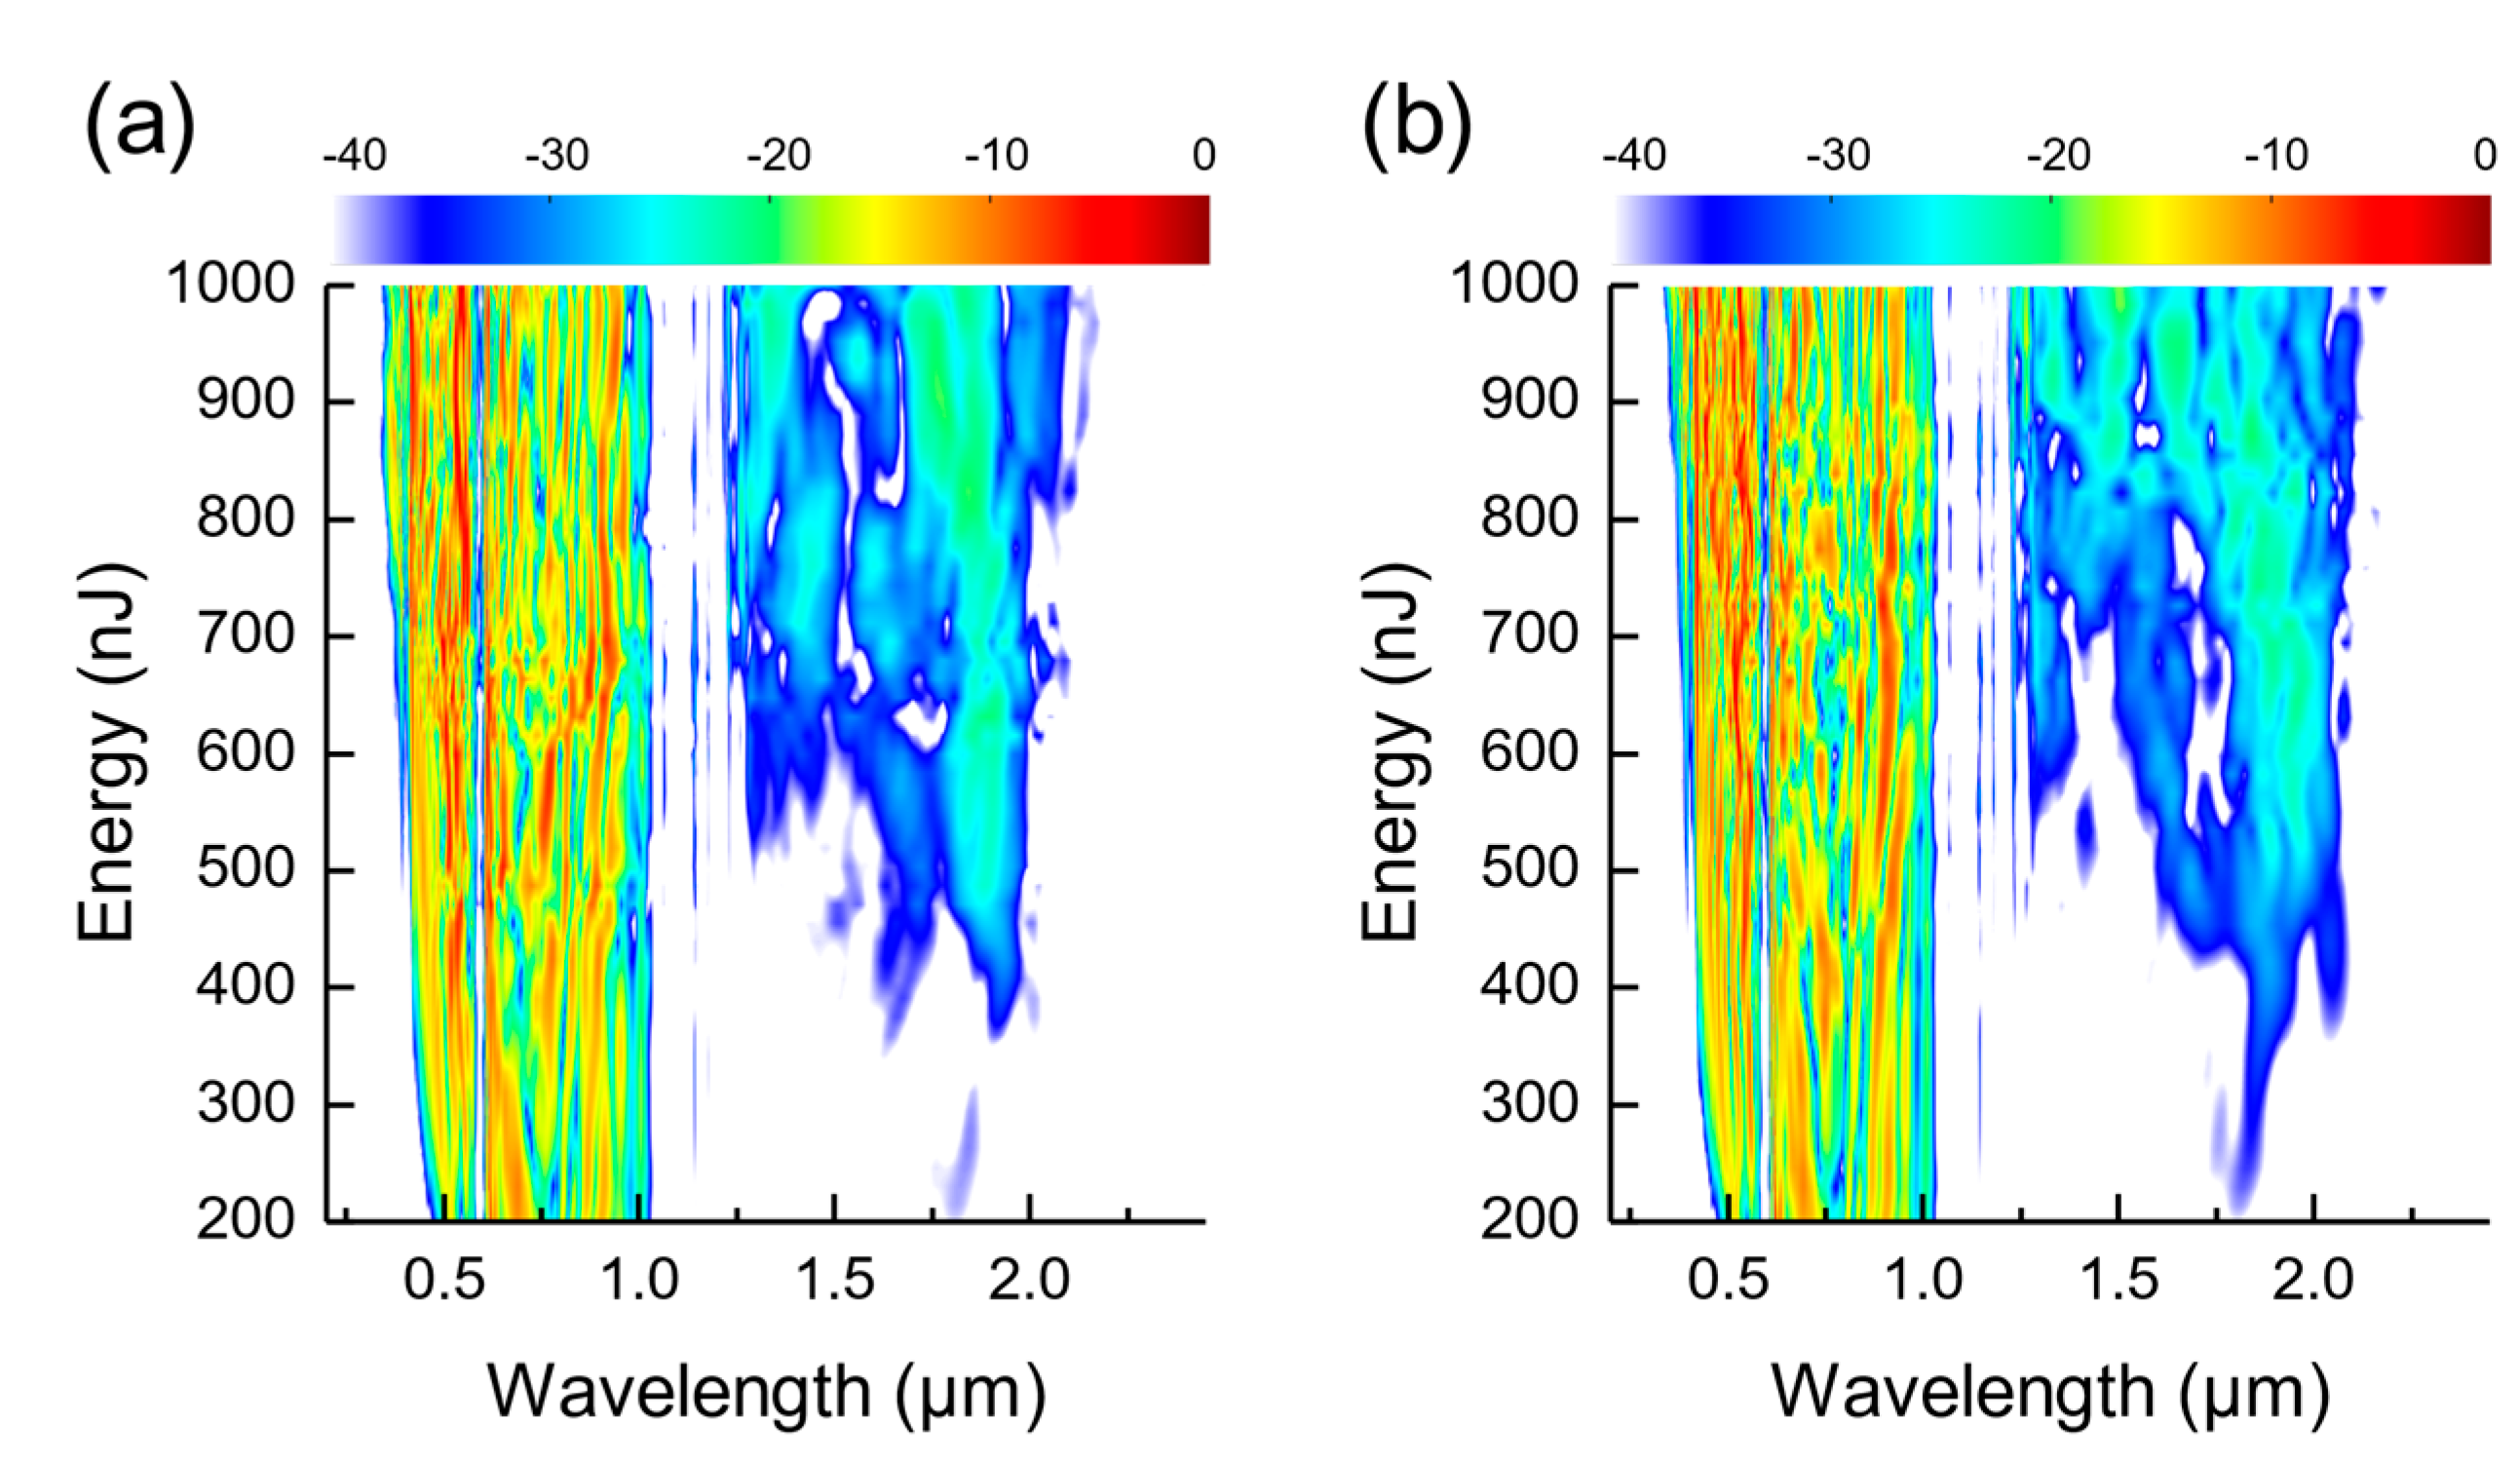
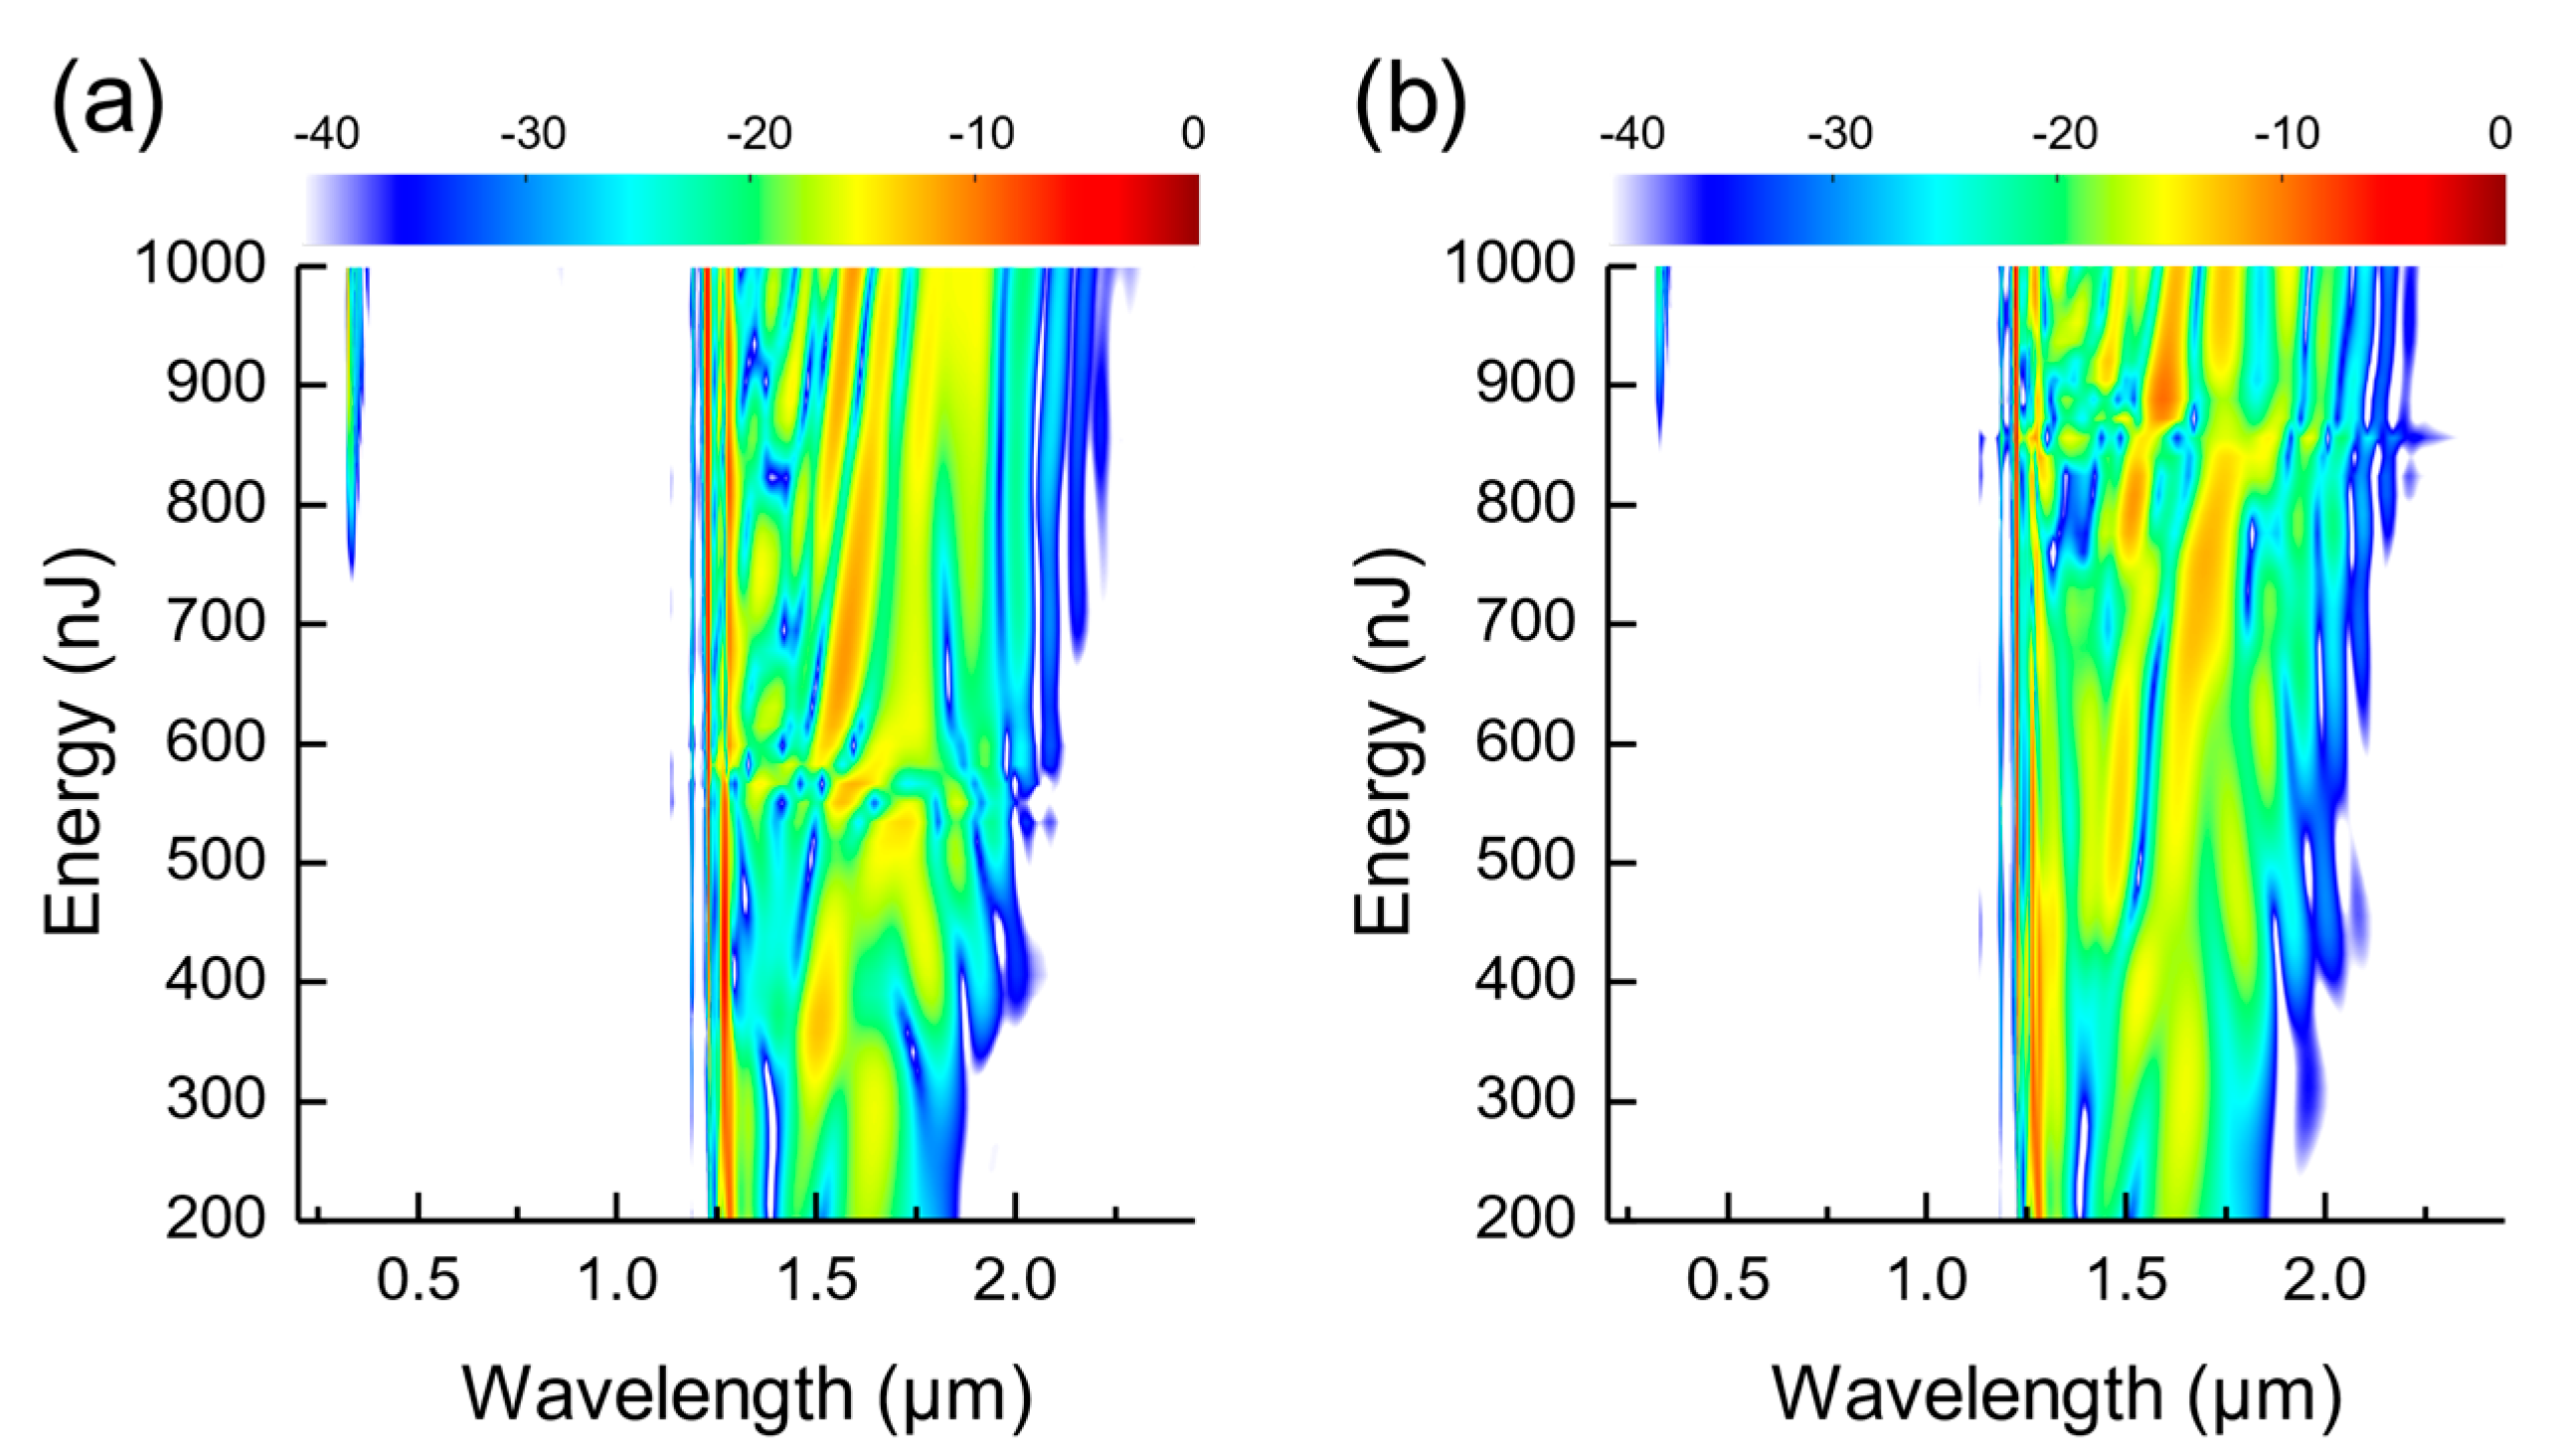
Figure 6a,b shows the color density plot of the spectrum at the output of the 5 cm-long AR-HCF for varying pump pulse energies in the WDA and WIA models, respectively. The two results are indistinguishable at low energy levels (below 350 nJ), indicating that the effect of mode-area dispersion is small in this regime. As the pump energy increases, notable differences appear, implying growing importance of the mode-area dispersion. We also notice the threshold pump energy required for the onset of DW in the WIA model is higher (850 nJ) than the WDA model (740 nJ).

3.2. Pulse Propagation at 800 nm

We carry out another study with the pump now at 800 nm to observe the effect of mode-area dispersion when the system is pumped in the second transmission window. The other system parameters are kept the same as before. Figure 7 shows the spectral outputs obtained with the two models. Enhanced emissions at around 1300, 1430, 1620, and 1840 nm are observed in the WDA model.
Unlike in the previous case where there is a broad spectral region of anomalous dispersion close to the pump that can facilitate the formation of solitons, the pump is bounded by resonant bands on both sides at 630 and 900 nm. Soliton can be formed in the spectral region between 800 and 900 nm, i.e., within the anomalous dispersion regime of the second transmission window. Outside this range, the dispersion and loss become very high, severely perturbing the pulse and suppressing the spectral advance into these regions. 
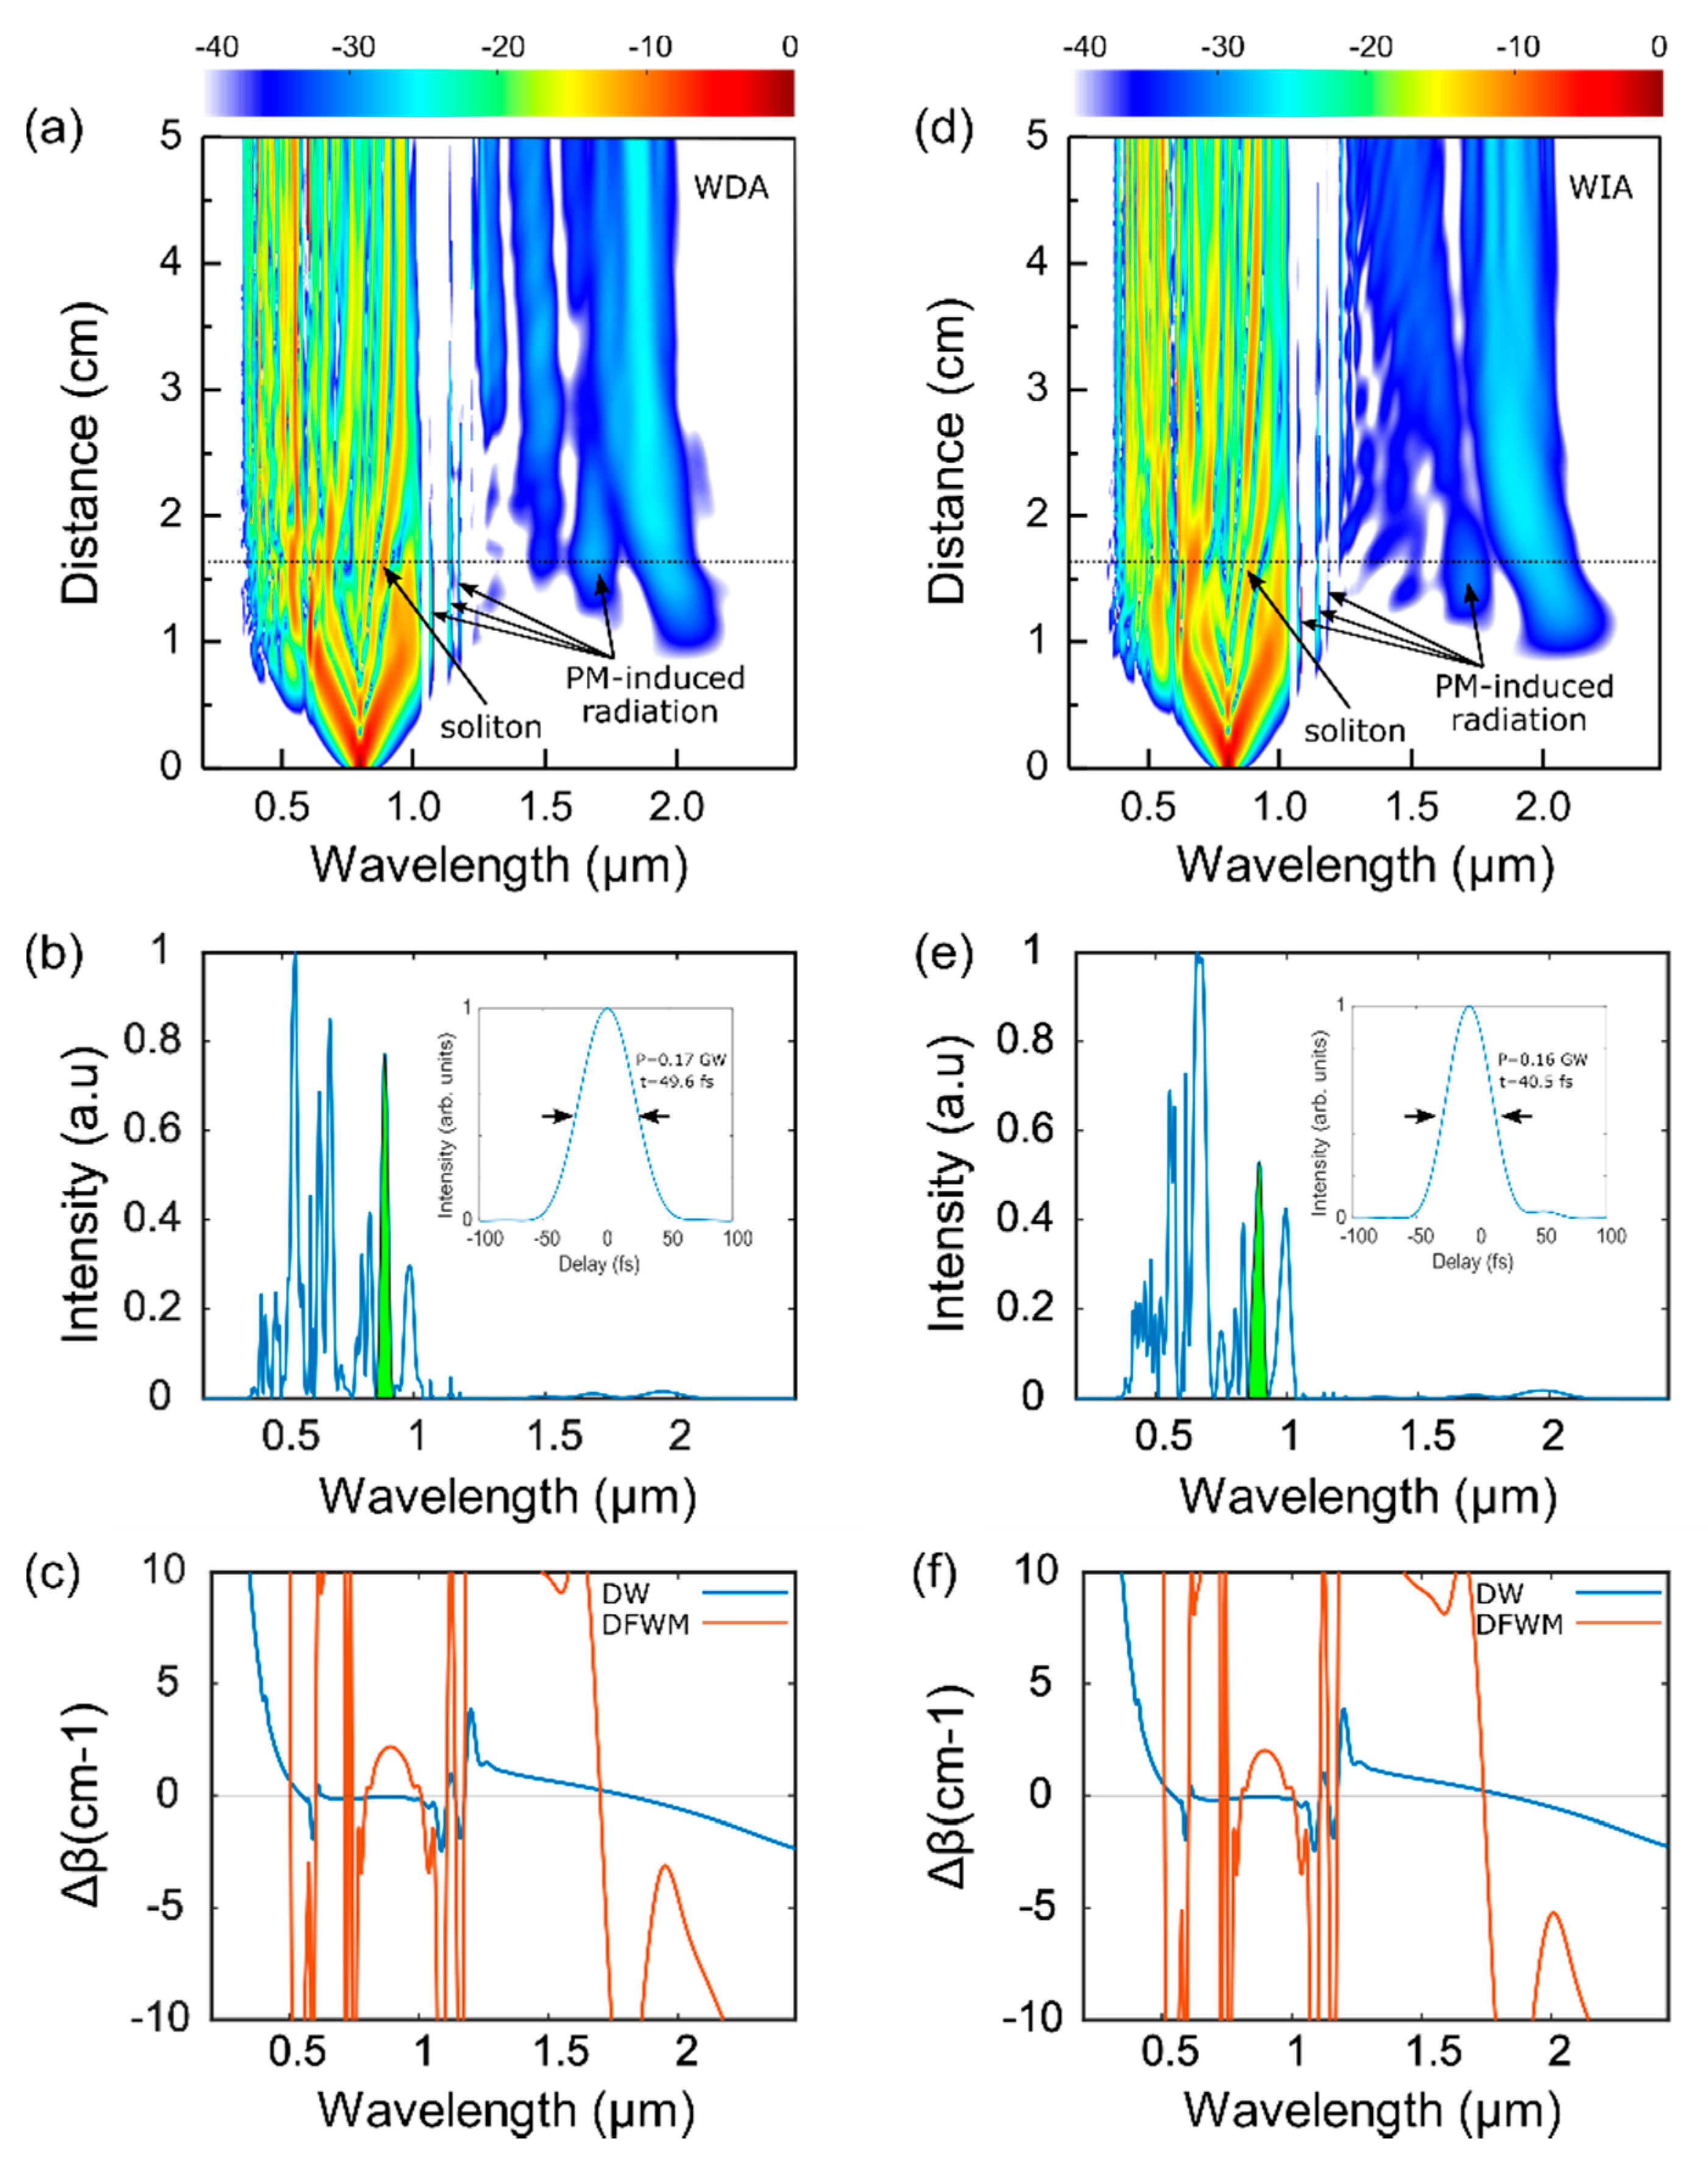
Figure 8a,d shows the color density plots of the spectral evolutions of the 800 nm pump in the two models. A soliton appears in both the WDA and WIA models with different central wavelengths of 889 and 895 nm, respectively at z = 1.65 cm, as indicated in Figure 8a,d. Figure 8b,e shows the spectra at z = 1.65 cm for the two models. The part of the spectrum that forms the soliton is highlighted in green. In the time domain, this part translates to a pulse with the peak power of 170 MW and FWHM duration of 49.6 fs amounting to a higher-order soliton with N = 4.64 in the case of the WDA model, and peak power of 160 MW and FWHM duration of 40.5 fs amounting to N = 3.54 soliton in the WIA model. Figure 8c,f shows the DW and DFWM dephasing induced by the soliton highlighted in Figure 8b,e as the pump. Multiple DW and DFWM phase-matching wavelengths are achieved in both models. Some of them can be identified in the spectral evolutions in Figure 8a,d, such as the discrete narrow radiation bands in the first resonant region as well as the radiation at 1.68 µm, as indicated by the arrows. Their spectral locations match well with those predicted in the dephasing plots in Figure 8c,f. Other radiations such as the band at around 2 µm are induced through four-wave mixing as we shall see later.
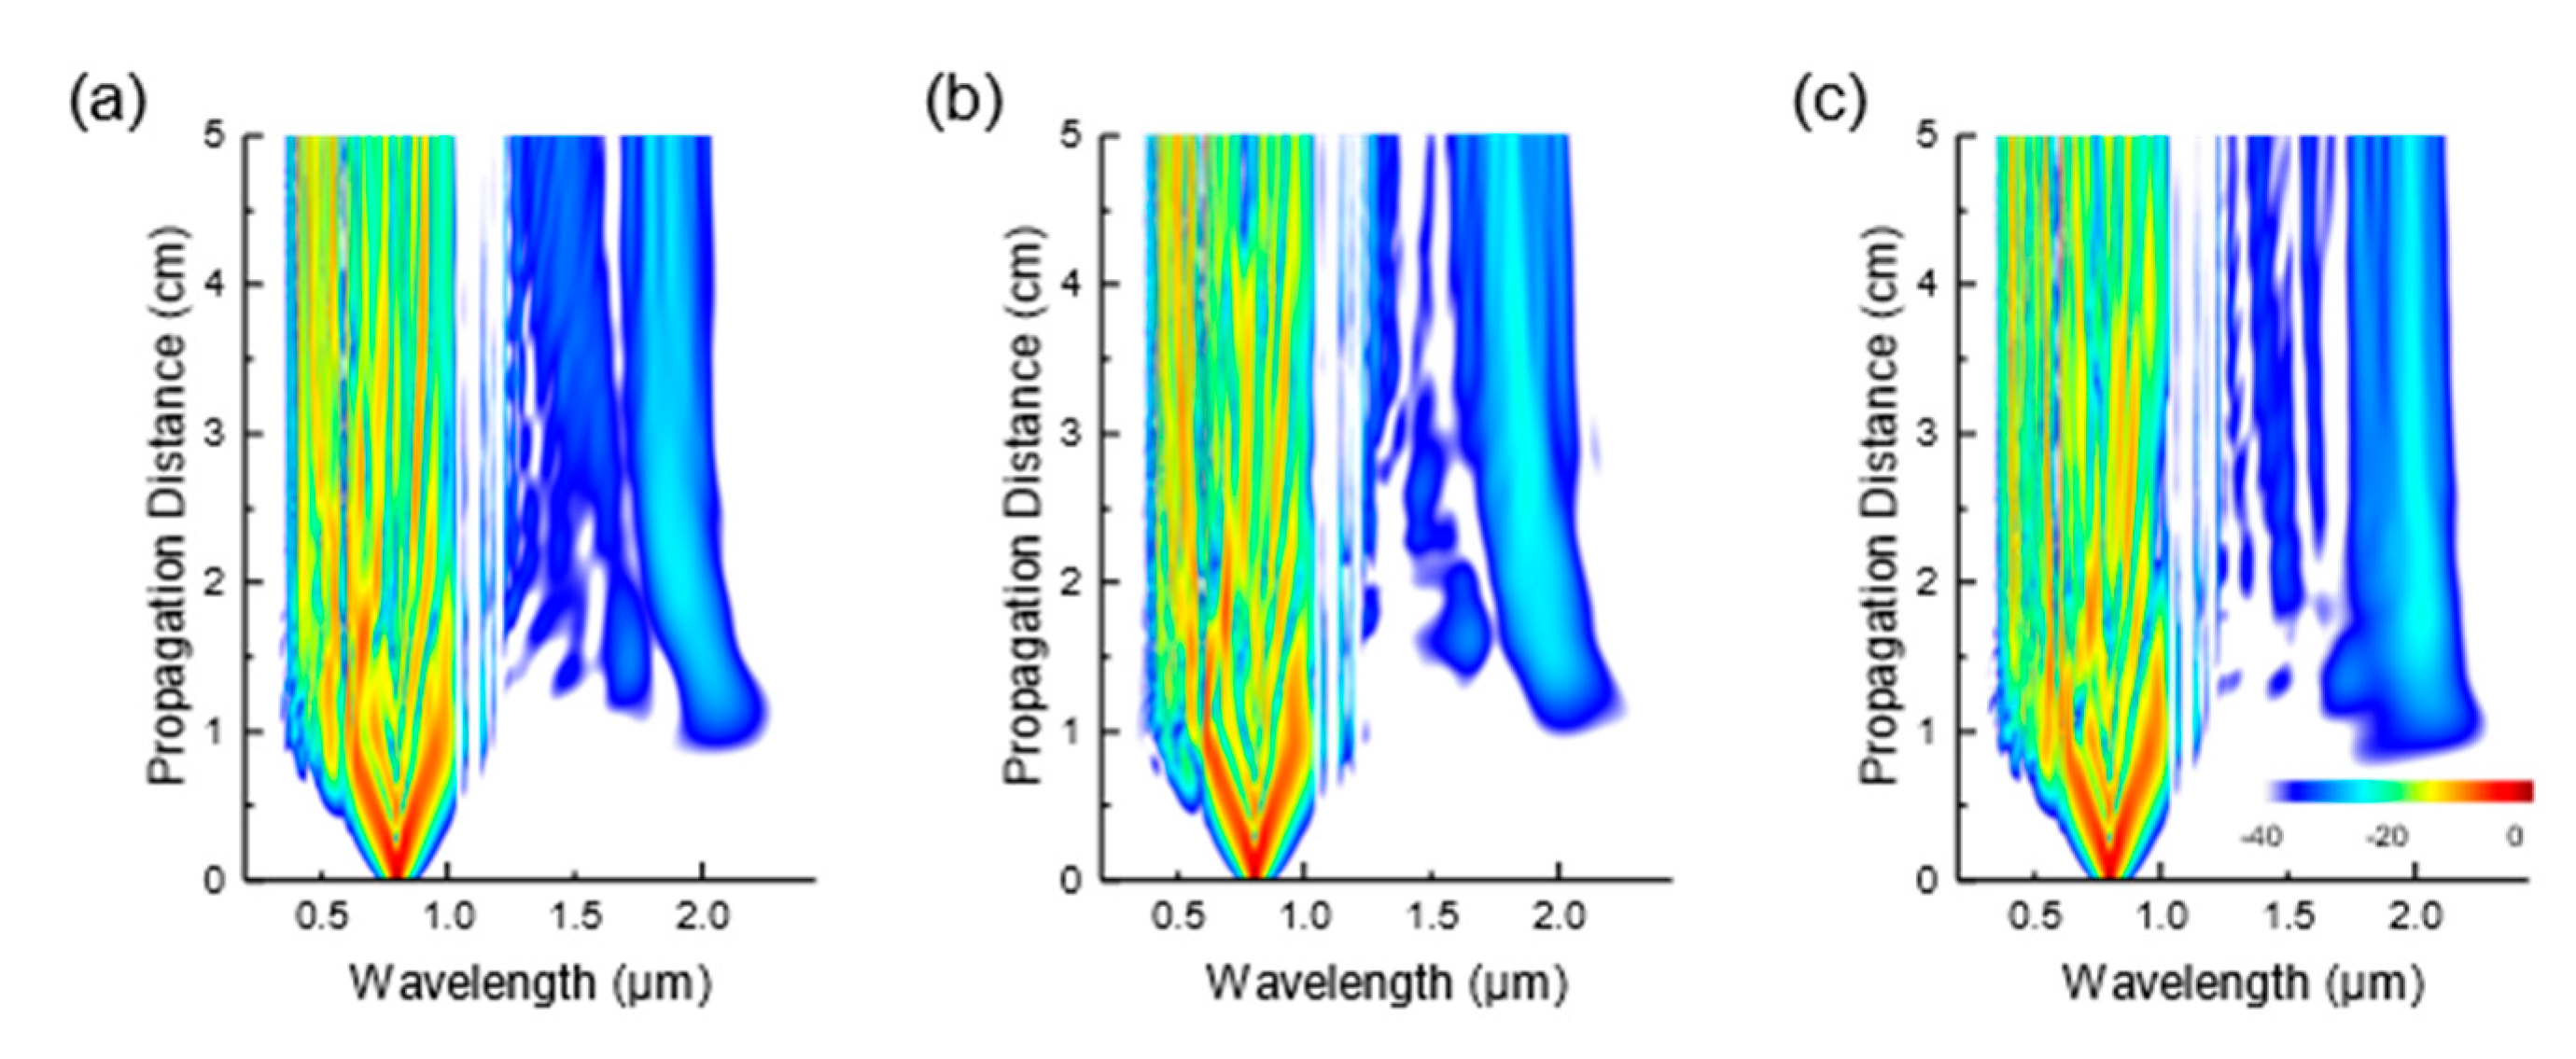
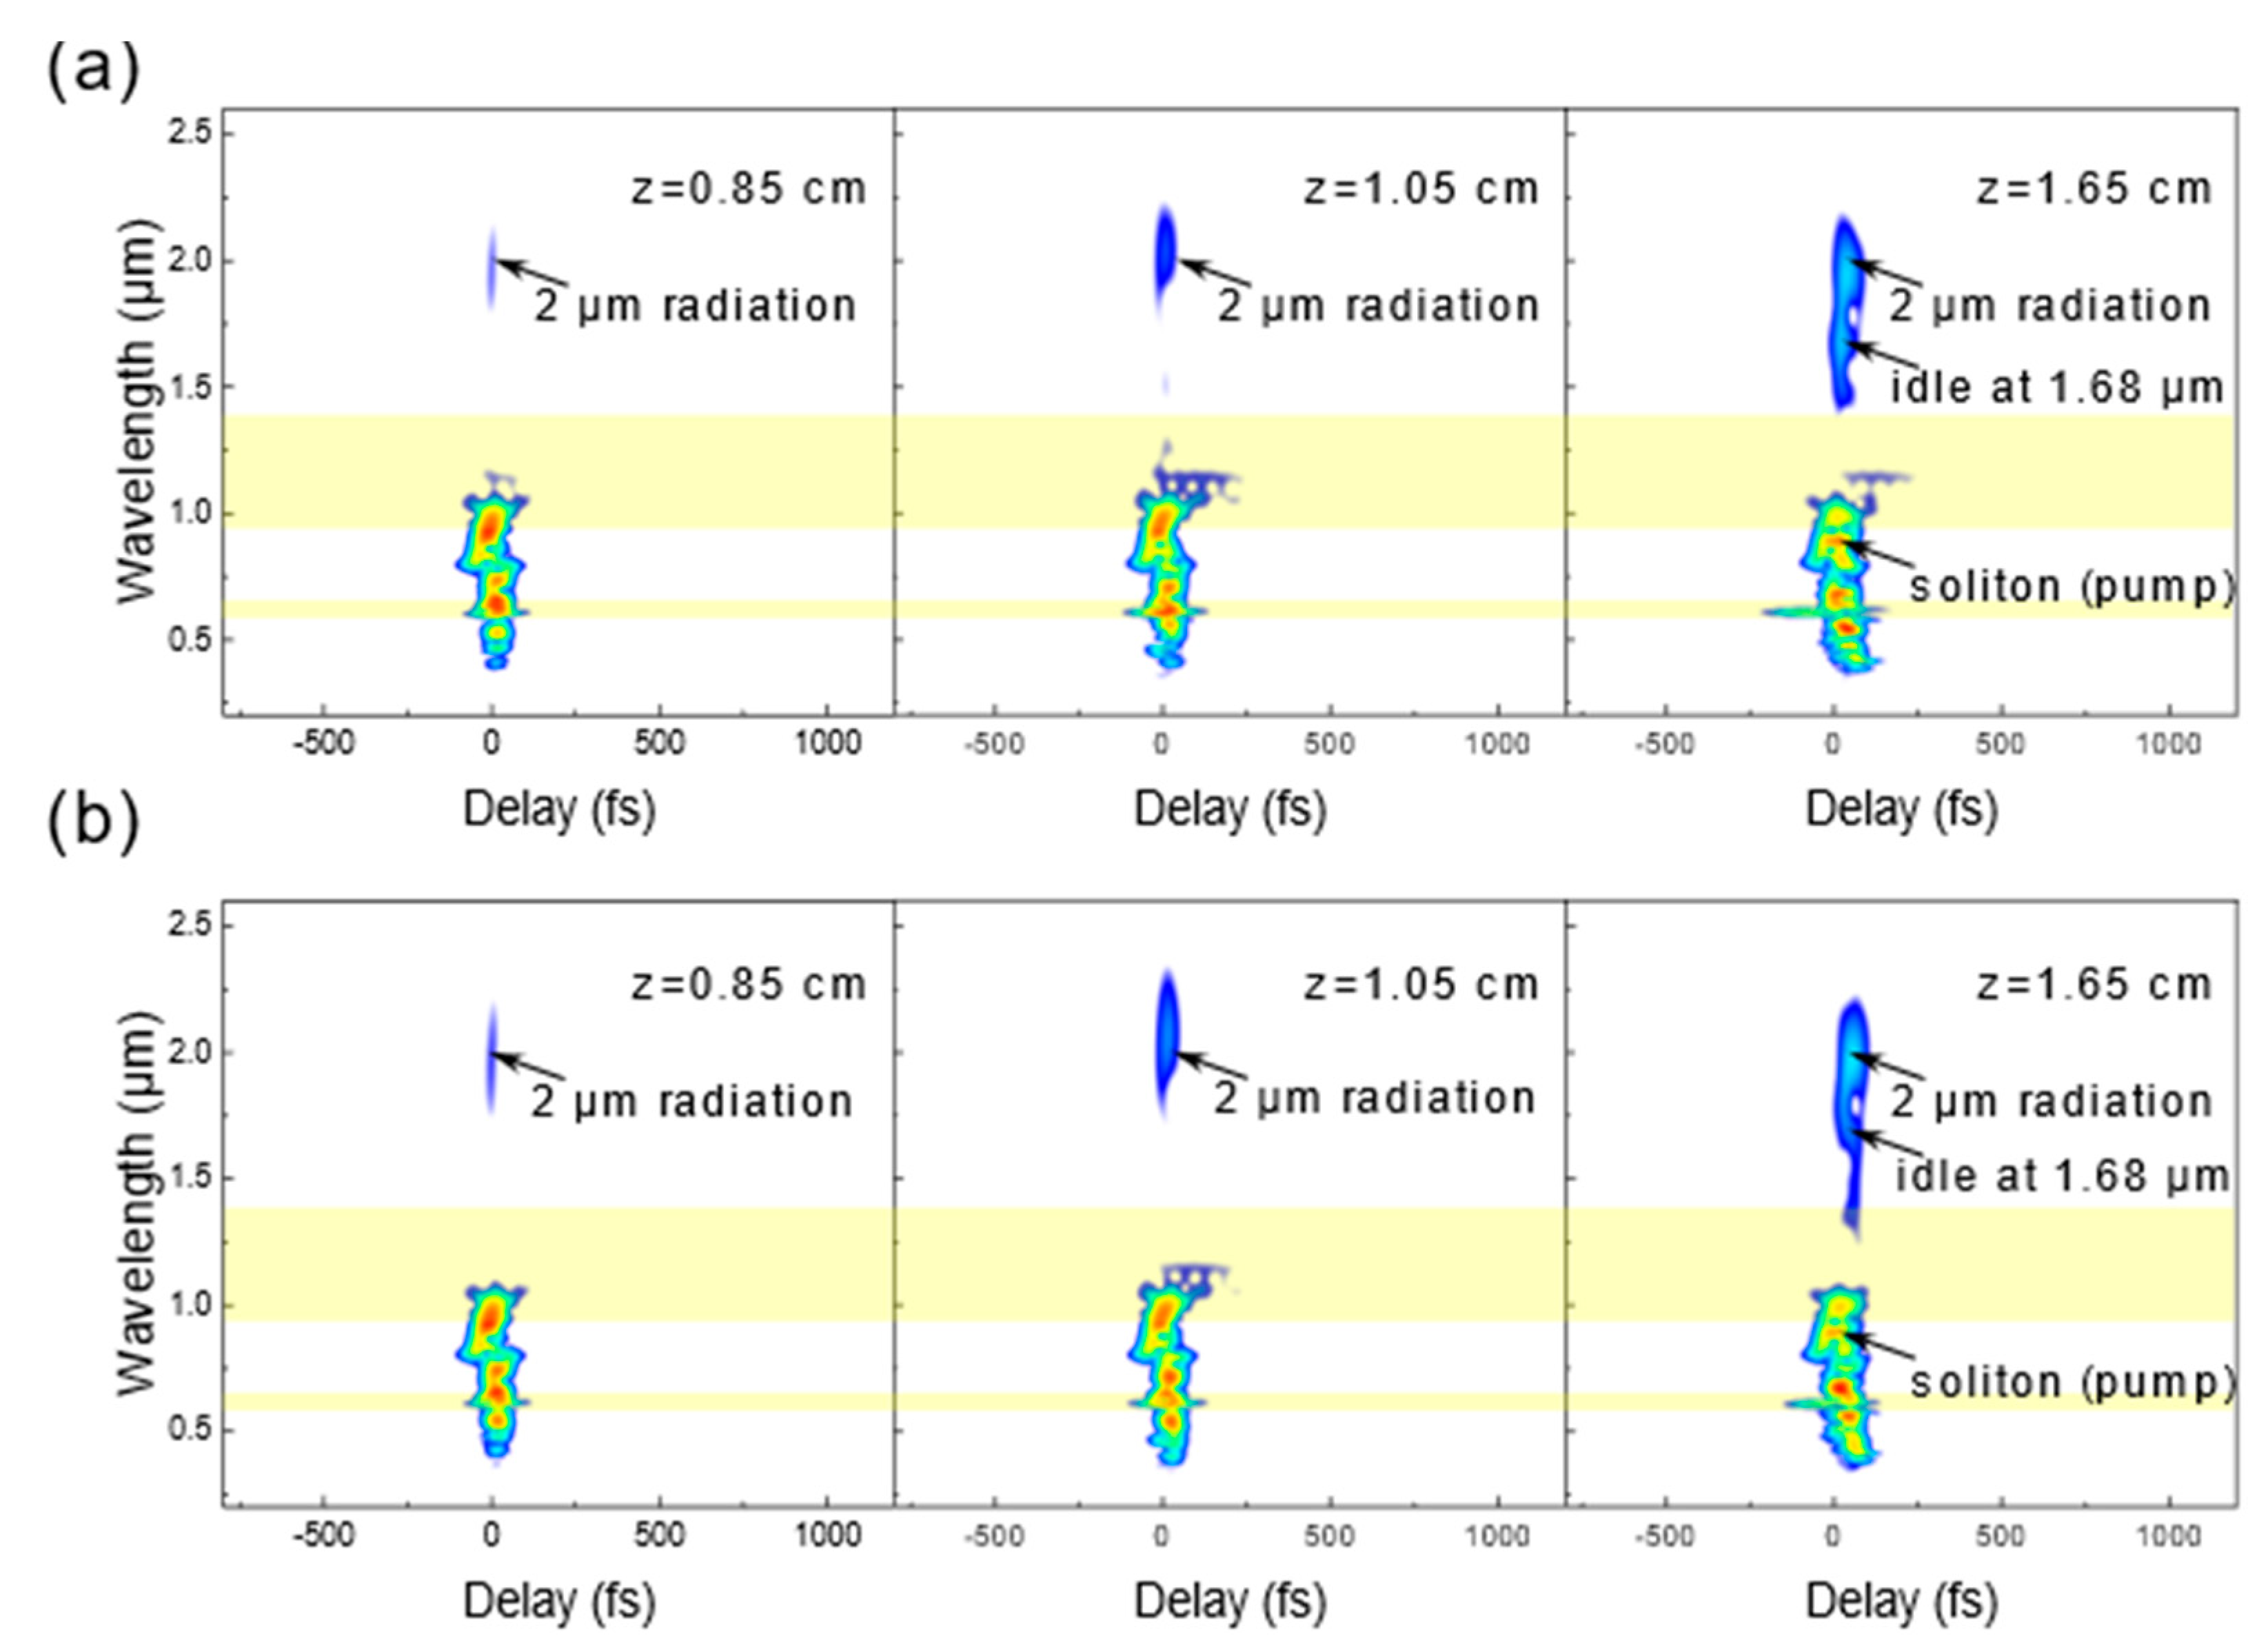
We plot the spectrogram evolutions for the two cases using the same approach as in Figure 4. These are presented in Figure 9. In both the WDA and WIA models, the pulse initially experiences self-phase modulation induced spectral broadening. At z = 0.85 cm, the red-edge of the spectrum reaches the wavelength of around 1.17 µm, which is in the first resonant band (wide yellow area), while the blue edge of spectrum continues to move to the shorter wavelength, passing through the second resonant band (narrow yellow area), and eventually appears in the third transmission window. At the same time, weak radiation emerges at 2 µm in both cases.
At z = 1.05 cm, the red edge of the spectrum is pushed further into the first resonant band and more energy is transferred to the 1.9–2.2 µm region. As it will be shown in the subsequent section, this radiation is caused by a four-wave mixing process induced by the pump photons in the first resonant band at around 1.17 μm. At z = 1.65 cm, the soliton indicated by the arrows in the last column in Figure 9 generates a new wavelength component centered at 1.68 µm through the DFWM process. The newly generated band at 1.68 µm overlaps with the pump soliton in the time domain in both models, as shown in the last columns in Figure 9a,b. Similarly, the 2 µm radiation also overlaps temporally with the pump located in the first resonant band in both models.
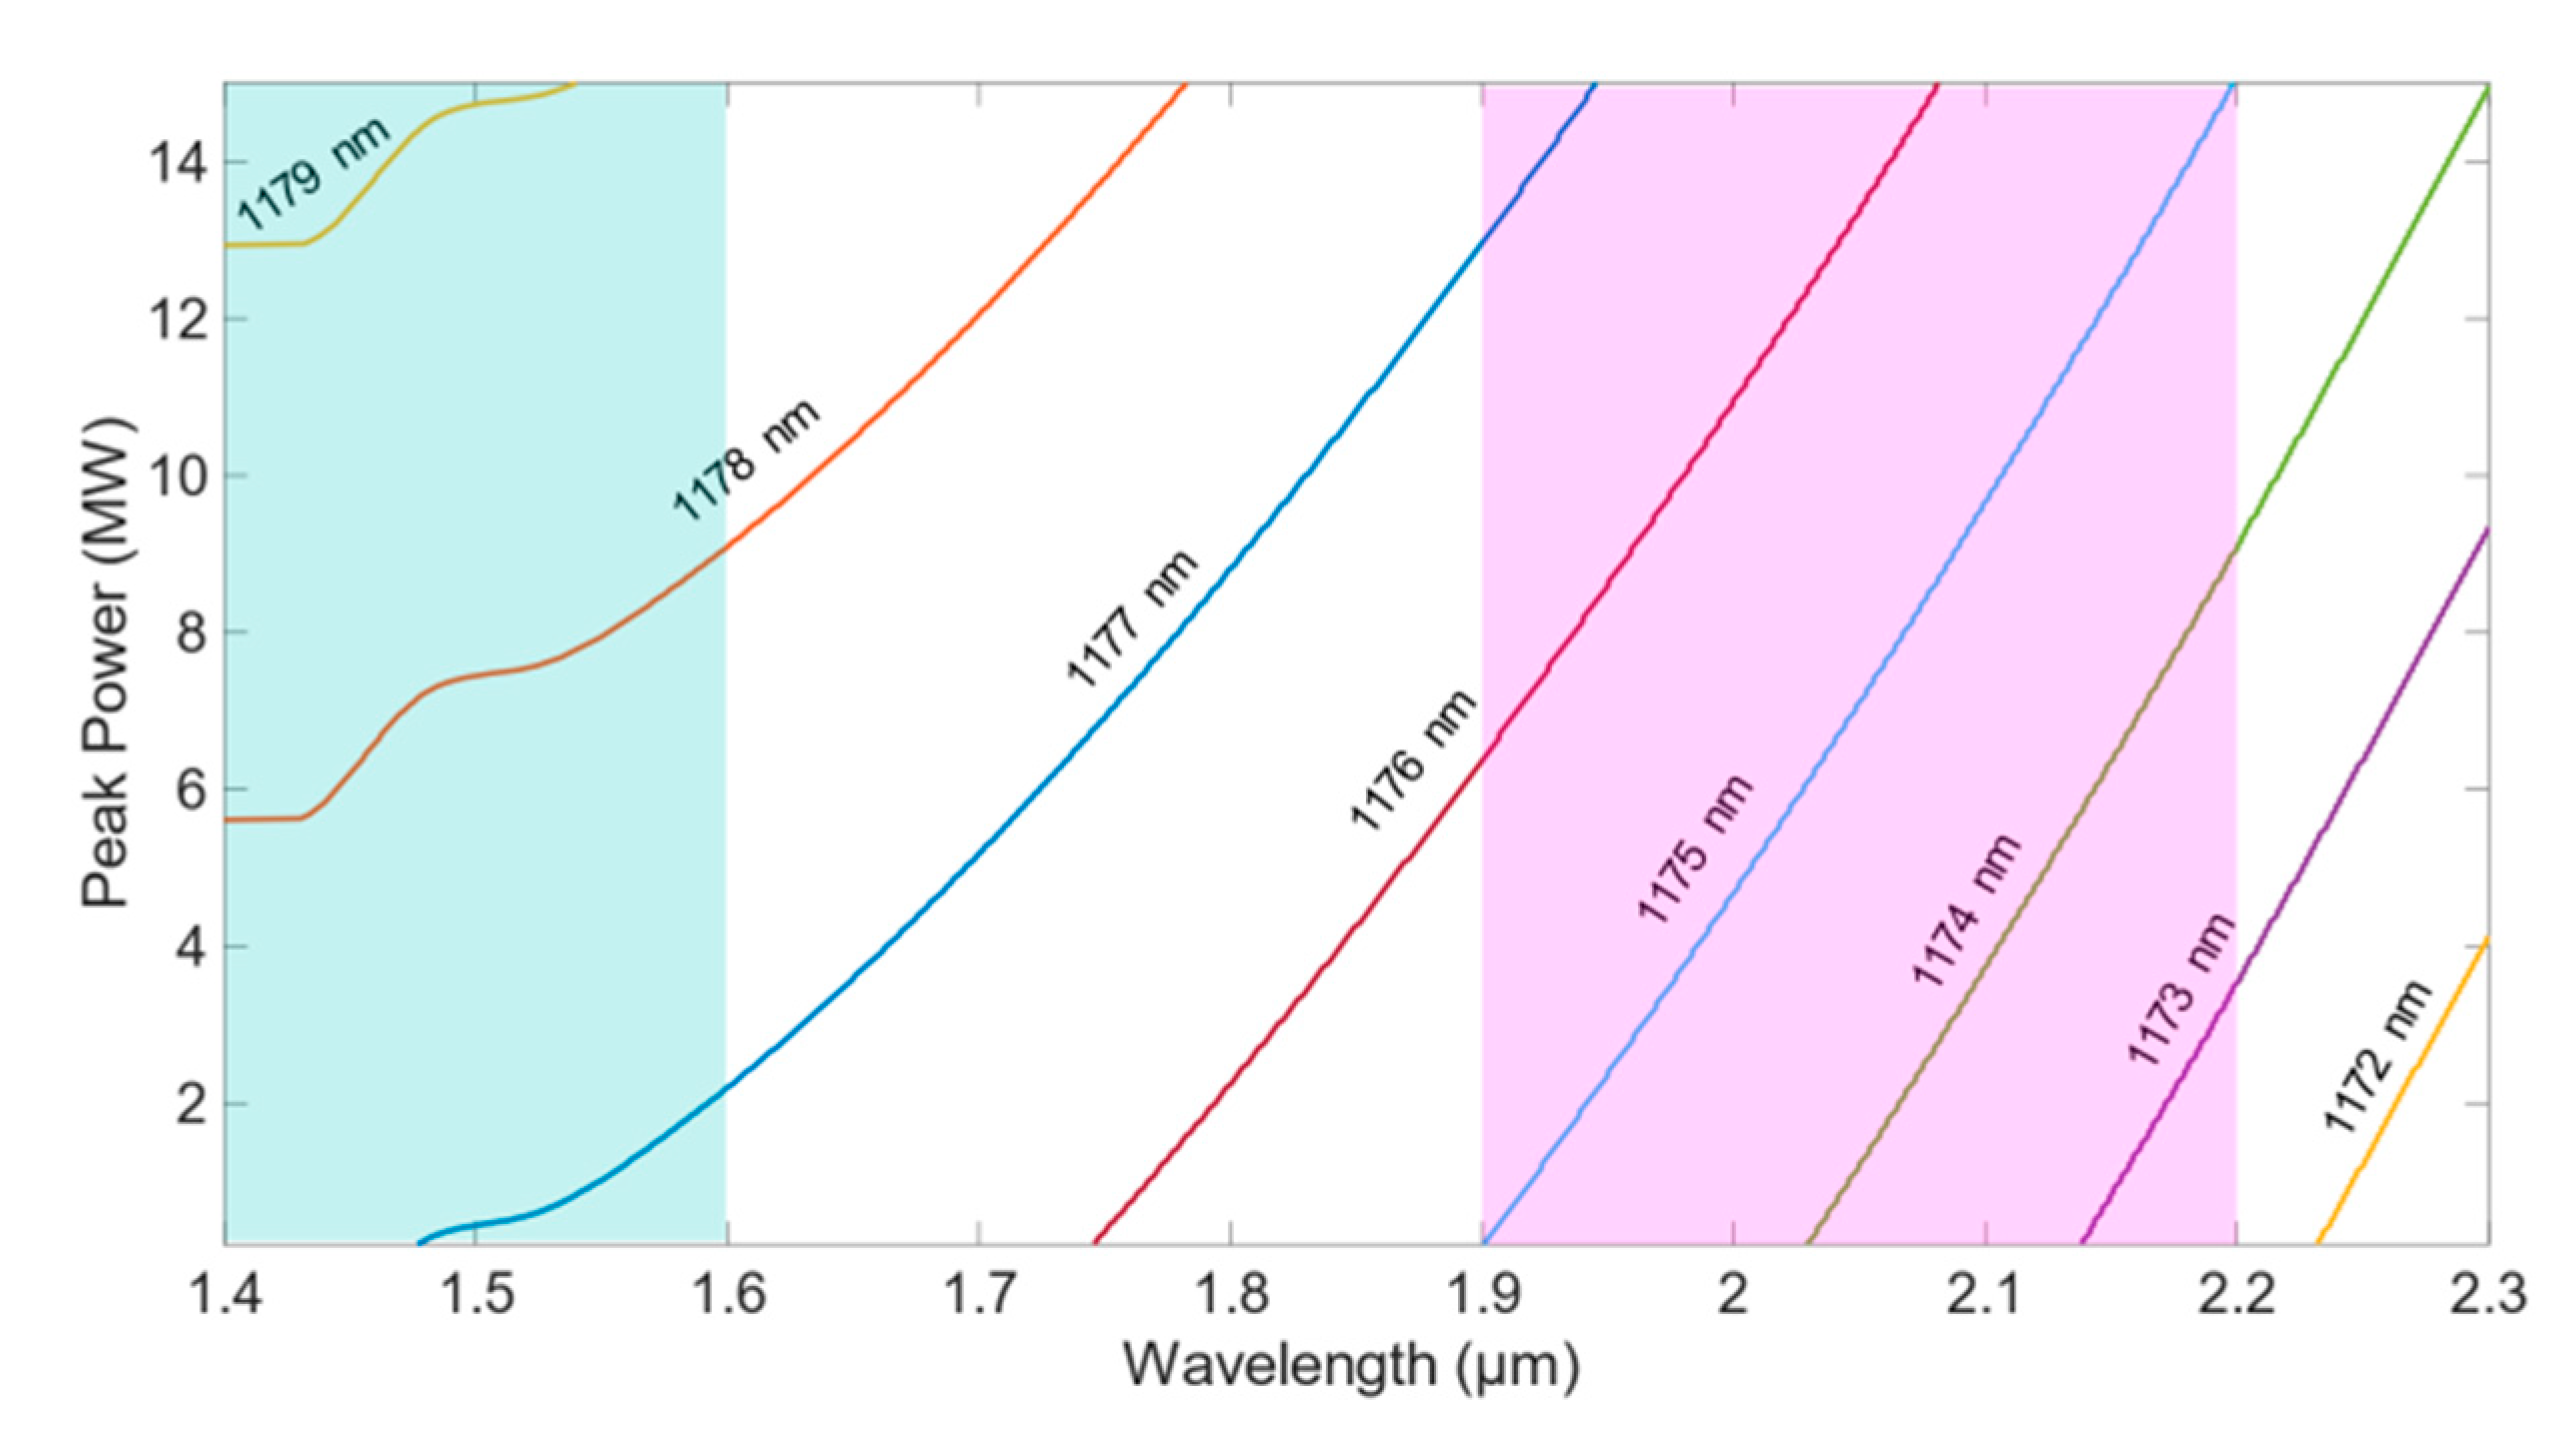
Due to the complex evolutionary dynamics in the presence of severe perturbation by resonant bands, the phase-matching conditions for the multiple radiation bands in the first transmission window, such as the 2 µm radiation, cannot be explicitly determined. We verify our previous assumption that these radiations are generated via DFWM processes from the pump photons in the wavelength range between 1170 and 1180 nm. We estimate the actual peak power of the soliton to be within 0.2 to 15 MW. Based on the relation given in Equation (6), we calculate the phase-matching points by scanning through different values of pump photon wavelengths and soliton peak powers within these specified ranges. Since there may be multiple phase-matching wavelengths due to the rapid variation in the dispersion near the resonances, we select only the phase-matching point with the longest wavelength. The results are plotted in Figure 10.
As we can see in Figure 10, the phase-matching wavelength increases with decreasing pump photon wavelength and increasing peak power P p . Since the pump is in the first resonant band where the dispersion varies rapidly, even a small difference in its wavelength results in a large shift in the phase-matching wavelength. As the pump moves to the longer wavelength, deeper into the first resonant band, the phase-matching wavelength changes more rapidly. The radiation located in the spectral region between 1.9 µm and 2.2 µm is highlighted in pink. Therefore, we can conclude; the pump that is responsible for the generation of the abovementioned DFWM-induced radiation bands is located between 1173 and 1177 nm, confirming our earlier assertion that the radiation at around 2 µm is generated via DFWM with the pump at around 1.17 µm. We verify that no other pump wavelengths can achieve the radiation at 2 µm via DFWM. We also observe some weaker radiations in the spectral region between 1.4 and 1.6 µm in both models as shown in Figure 8a,d. This is highlighted in cyan in Figure 10. Similarly, we can conclude that these radiations are also caused by DFWM, with the pump photon slightly longer at around 1177 to 1179 nm. As the pulse propagates, its spectrum continues to broaden towards the red side, expanding deeper into the first resonant band at around 1177 to 1179 nm and seed series of DFWM-induced phase matching radiations ranges between 1.4 and 1.6 µm. As the wavelength of the pump photon increases, the phase-matching wavelength shifts to a shorter wavelength. However, due to exponentially increasing loss and substantially reduced nonlinearity around the resonance, further spectral broadening into the longer wavelength is largely impeded and DFWM-induced conversion becomes inefficient. This also explains why the 2 µm radiation band appears earlier and the radiation bands with shorter wavelengths emerge later in the propagation with weaker intensities.
By comparing Figure 9a,b, we observe that the 2 µm radiation at z = 1.05 cm in the WDA model is weaker than that in the WIA model. On the contrary, the 1.68 µm radiation that appears at z = 1.65 cm in the WDA model is stronger than that in the WIA model. This is also shown in 
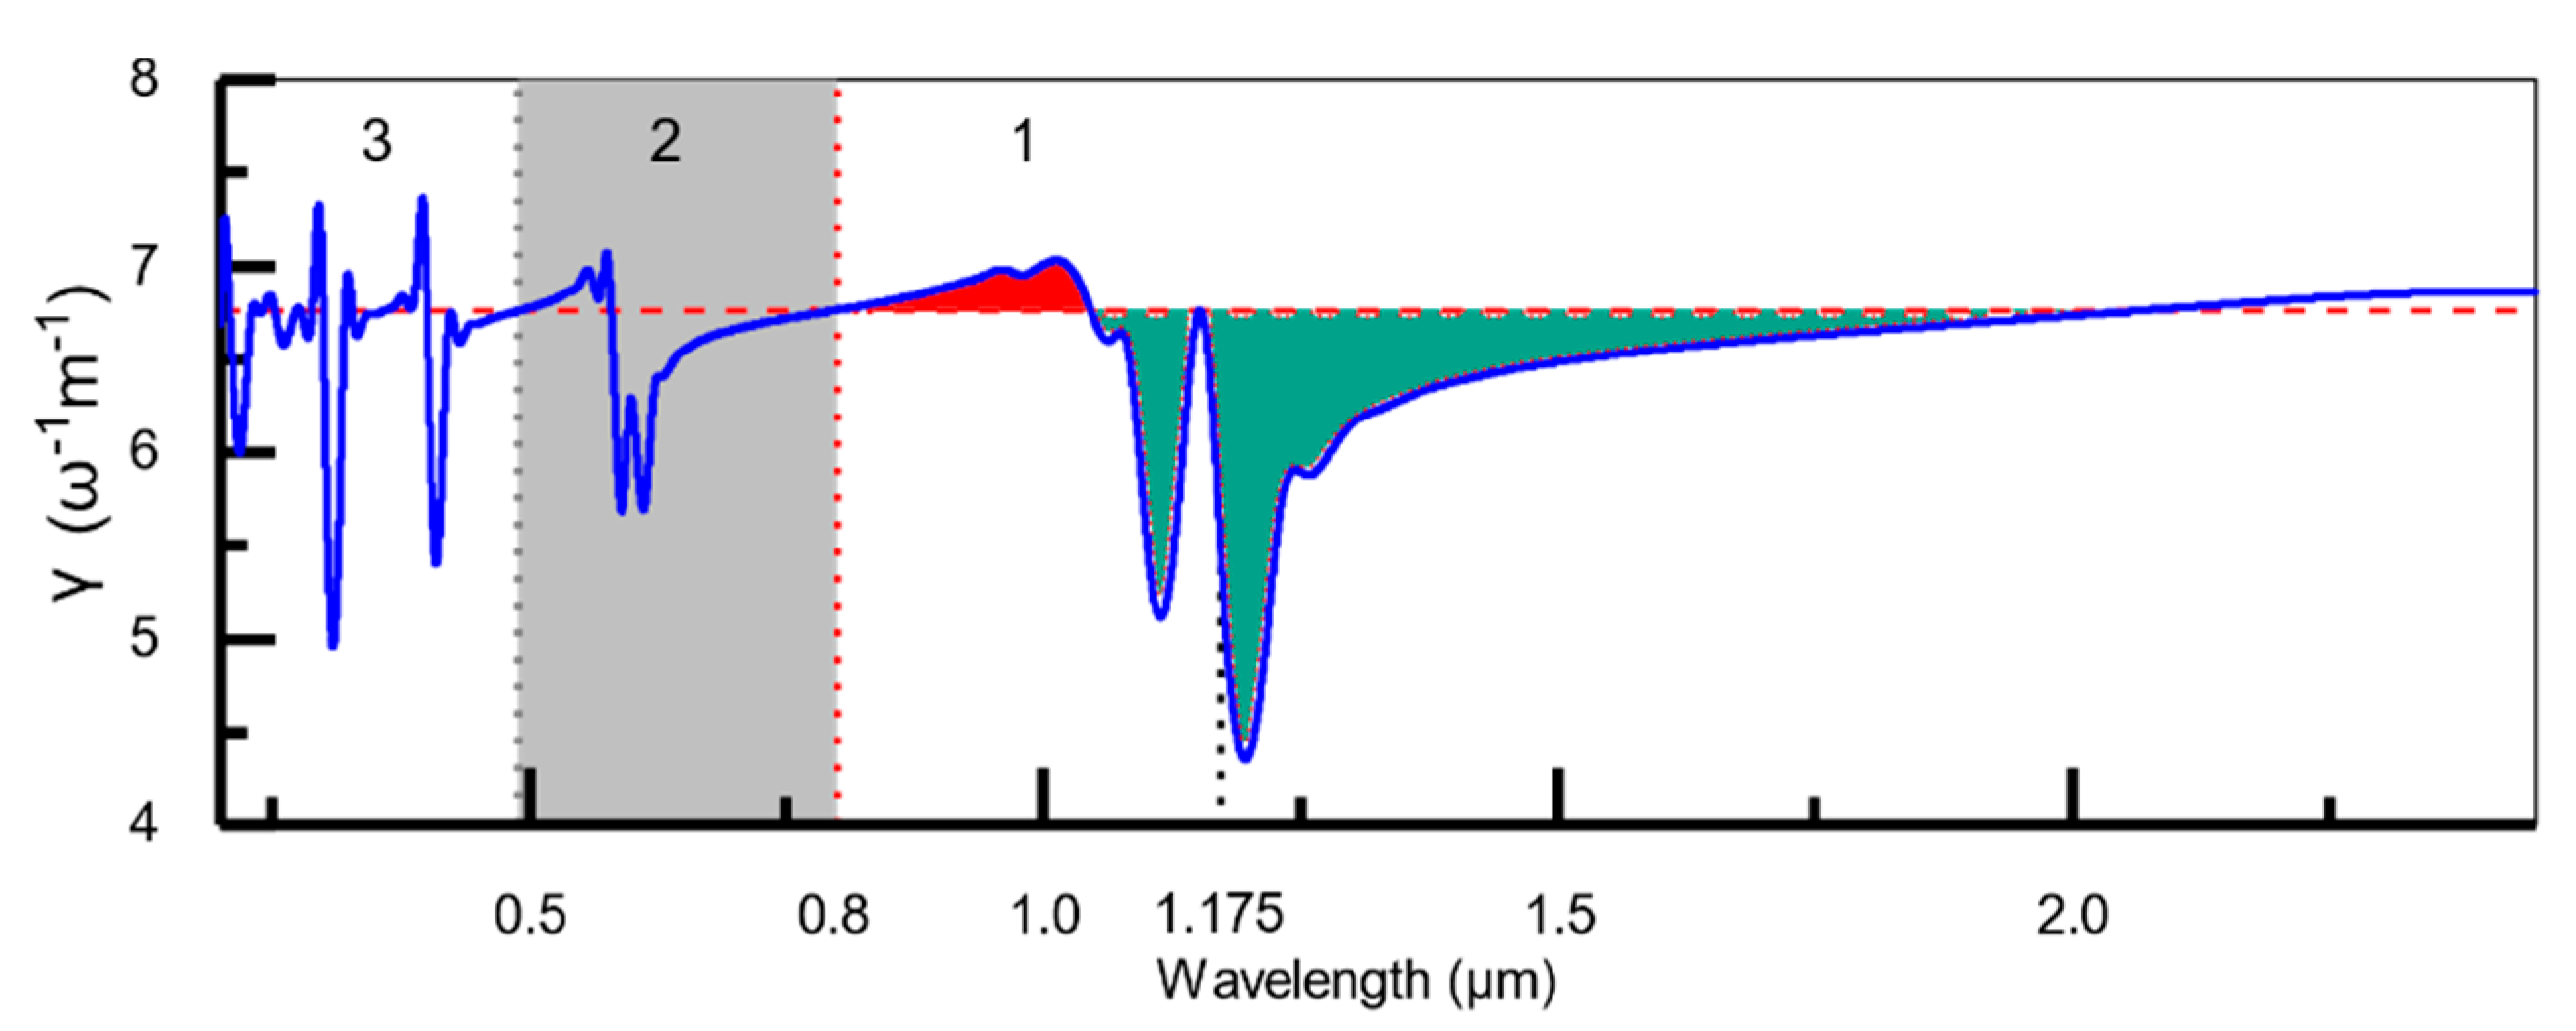
Figure 8a,d. We investigate the reason for the difference by looking at the nonlinear coefficient across the spectrum in Figure 11. Note that this is the same plot as shown in Figure 5, but with the constant nonlinear coefficient used in the WIA model evaluated at the new pump wavelength of 800 nm.
To facilitate our analysis, we separate the nonlinear coefficient profile into three sections as indicated in Figure 11. Each of the first two resonant bands sits in Section 1 and Section 2, respectively. The third and fourth resonant bands are in Section 3. In Section 1, the red (green) shaded area indicates the region where the nonlinear coefficient in the WDA model is higher (lower) than that in the WIA model. The solitons highlighted in Figure 8b,e are located in the red shaded region while the DFWM pump photons at around 1175 nm are in the green shaded region. Since the nonlinear coefficient at 1175 nm in the WDA model is below that of the WIA model as shown in Figure 11, there is a less efficient conversion of the pump to the signal and idler in the DFWM process, resulting in weaker radiation at 2 µm compared to that in the WIA model. This is evident from the spectrograms in the middle column of Figure 9a,b. The nonlinear coefficient at 889 nm, which the soliton is centered at in the WDA model, is higher than that perceived by the soliton in the WIA model. Hence, a larger amount of energy is transferred to the 1.68 µm band in the WDA model by the soliton through a more efficient DFWM process, as seen in the last column of Figure 9a,b.
Figure 12a–c shows the simulation results when the mode-area dispersion is assumed only in either Section 1, Section 2, or Section 3, respectively while keeping the coefficient constant with the value evaluated at 800 nm in the other Sections. This is to separately study the impact of mode-area dispersion for different resonant bands. We find that when we consider the mode-area dispersion only in Section 1, the spectral evolution is almost identical to that of the WIA model as shown in Figure 8a,d. From this, we can conclude that the mode-area dispersion in the third and fourth resonant bands has a negligible effect on the pulse propagation dynamics. This is because they are far from the pump wavelength at 800 nm and, therefore, have a negligible effect on the main pulse. The inclusion of the mode-area dispersion around the first or second resonant bands affects the pulse propagation dynamics in the first transmission window (above 1400 nm) and second transmission window (550–900 nm), as can be seen from the comparison between Figure 12a–c. Some of the notable differences lie in the first transmission window. While all three cases show relatively strong radiation at around 2 µm, other radiations in the wavelength between 1.3 to 1.6 µm are totally different. We attribute these differences to the change in DFWM phase-matching conditions and conversion efficiency when using different nonlinear coefficient profiles.
Figure 13a,b shows the output spectra of the 800 nm pump after propagating the 5-cm long xenon-filled AR-HCF with different pump energies for the WDA and WIA models, respectively. Similar to the case of pumping at 1430 nm, the differences between the WDA and WIA models are small at low energy levels (below 400 nJ). As the energy increases, the differences become more pronounced. The radiations in the first transmission window mediated by the DFWM process are completely different between the WDA and WIA models at all energy levels, indicating that the process is highly sensitive to the mode-area dispersion. This is expected since the spectral components in the first transmission window are induced by the pump photons in the vicinity of the first resonant band, where the mode-area undergoes a dramatic change in the WDA model.

4. Conclusions

In this work, we numerically investigate the effect of mode-area dispersion on pulse propagation dynamics in a xenon-filled AR-HCF. We study the cases of pumping at two different wavelengths, one at 1430 nm and the other at 800 nm, close to resonant bands, to understand how the dynamics differ when the pump is launched in different transmission windows in the AR-HCF. We compare the results obtained using two different models; one that takes into account the wavelength-dependent mode area, and the other that assumes a constant mode area evaluated at the pump wavelength. For the same set of simulation parameters, a strong dispersive wave is observed at 330 nm in the WDA model while this is not visible in the WIA model when the pump is at 1430 nm. We identify that the differences are coming from the nonlinear parameter perceived by the soliton that induces the dispersive wave. In the WDA model, the soliton experiences a smaller effective mode area and thus higher nonlinearity, which causes larger nonlinear phases shifts, moving the soliton to a longer wavelength further from the zero-dispersion wavelength. This suppresses the effect of higher-order dispersion and results in achieving a better pulse compression, which facilitates the spectral broadening that extends further into the ultraviolet region at 330 nm. This enables the onset of DW emission with the pump energy that is lower than what is required in the WIA model. When the pump is at 800 nm, the WDA and WIA models exhibit significantly different spectral outputs in the first transmission window. We identified that the radiation which appears at 1.68 µm in both models is generated through a DFWM process with the pump photon at 891 nm in the WDA model and 895 nm in the WIA model. The rest of the radiation bands in the first transmission window are mediated by DFWM processes with the pump photons in the first resonant region. The efficiency of the DFWM process and thus the strength of the DFWM-induced radiations is directly related to the nonlinear coefficient at the wavelength of the corresponding pump photons. In the WIA model, the nonlinear coefficient at the DFWM pump of 895 nm is underestimated while that in the first resonant band is overestimated with respect to the WDA model. Therefore, we observe lower intensity radiation at 1.68 µm and stronger radiation at 2 µm in the WIA model as compared to the WDA model. Our results suggest that the inclusion of mode-area dispersion is important when investigating ultrafast dynamics near the resonant bands of AR-HCF and at high pump energy levels, such as in the case of generating resonance-enhanced supercontinuum [9,10].

Author Contributions

Conceptualization, W.C.; methodology, W.C. and Y.W.; software, W.C., Y.W. and M.I.H.; validation, Y.W.; formal analysis, Y.W.; investigation, Y.W.; resources, W.C.; data curation, W.C. and Y.W.; writing—original draft preparation, Y.W.; writing—review and editing, W.C. and M.I.H.; visualization, Y.W.; supervision, W.C.; project administration, W.C.; funding acquisition, W.C. All authors have read and agreed to the published version of the manuscript.

Funding

This research was funded by the Ministry of Education—Singapore, AcRF Tier 1 RG135/20.

Institutional Review Board Statement

Not applicable.

Informed Consent Statement

Not applicable.

Data Availability Statement

Not applicable.

Conflicts of Interest

The authors declare no conflict of interest.

References

  1. Pryamikov, A.D.; Biriukov, A.S.; Kosolapov, A.F.; Plotnichenko, V.G.; Semjonov, S.L.; Dianov, E.M. Demonstration of a waveguide regime for a silica hollow-core microstructured optical fiber with a negative curvature of the core boundary in the spectral region > 35 μm. Opt. Express 2011, 19, 1441–1448. [Google Scholar] [CrossRef] [PubMed]
  2. Yu, F.; Wadsworth, W.J.; Knight, J. Low loss silica hollow core fibers for 3–4 μm spectral region. Opt. Express 2012, 20, 11153–11158. [Google Scholar] [CrossRef] [PubMed] [Green Version]
  3. Adamu, A.I.; Habib, S.; Petersen, C.R.; Lopez, J.E.A.; Zhou, B.; Schülzgen, A.; Bache, M.; Amezcua-Correa, R.; Bang, O.; Markos, C. Deep-UV to Mid-IR supercontinuum generation driven by Mid-IR ultrashort pulses in a gas-filled hollow-core fiber. Sci. Rep. 2019, 9, 4446. [Google Scholar] [CrossRef] [PubMed] [Green Version]
  4. Köttig, F.; Schade, D.; Koehler, J.; Russell, P.S.J.; Tani, F. Efficient single-cycle pulse compression of an ytterbium fiber laser at 10 MHz repetition rate. Opt. Express 2020, 28, 9099–9110. [Google Scholar] [CrossRef] [Green Version]
  5. Fu, J.; Chen, Y.; Huang, Z.; Yu, F.; Wu, D.; Pan, J.; Zhang, C.; Wang, D.; Pang, M.; Leng, Y. Photoionization-induced broadband dispersive wave generated in an AR-filled hollow-core photonic crystal fiber. Crystals 2021, 11, 180. [Google Scholar] [CrossRef]
  6. Abu Hassan, M.R.; Yu, F.; Wadsworth, W.; Knight, J. Cavity-based mid-IR fiber gas laser pumped by a diode laser. Optica 2016, 3, 218–221. [Google Scholar] [CrossRef]
  7. Russell, P.; Hoelzer, P.; Chang, W.; Abdolvand, A.; Travers, J. Hollow-core photonic crystal fibres for gas-based nonlinear optics. Nat. Photon. 2014, 8, 278–286. [Google Scholar] [CrossRef]
  8. Duguay, M.A.; Kokubun, Y.; Koch, T.L.; Pfeiffer, L. Antiresonant reflecting optical waveguides in SiO2-Si multilayer structures. Appl. Phys. Lett. 1986, 49, 13–15. [Google Scholar] [CrossRef] [Green Version]
  9. Sollapur, R.; Kartashov, D.; Zürch, M.; Hoffmann, A.; Grigorova, T.; Sauer, G.; Hartung, A.; Schwuchow, A.; Bierlich, J.; Kobelke, J.; et al. Resonance-enhanced multi-octave supercontinuum generation in antiresonant hollow-core fibers. Light. Sci. Appl. 2017, 6, e17124. [Google Scholar] [CrossRef] [PubMed] [Green Version]
  10. Qi, X.; Schaarschmidt, K.; Chemnitz, M.; Schmidt, M.A. Essentials of resonance-enhanced soliton-based supercontinuum generation. Opt. Express 2020, 28, 2557. [Google Scholar] [CrossRef] [PubMed]
  11. Gavara, T.; Hasan, I.; Abu Hassan, M.R.; Deng, A.; Chang, W. Band-edge mediated frequency down-conversion in a gas-filled anti-resonant hollow-core fiber. Opt. Lett. 2020, 45, 6815–6818. [Google Scholar] [CrossRef]
  12. Tani, F.; Köttig, F.; Novoa, D.; Keding, R.; Russell, P.S. Effect of anti-crossings with cladding resonances on ultrafast nonlinear dynamics in gas-filled photonic crystal fibers. Photon. Res. 2018, 6, 84–88. [Google Scholar] [CrossRef]
  13. Laegsgaard, J. Mode profile dispersion in the generalised nonlinear Schrödinger equation. Opt. Express 2007, 15, 16110–16123. [Google Scholar] [CrossRef]
  14. Vanvincq, O.; Kudlinski, A.; Bétourné, A.; Quiquempois, Y.; Bouwmans, G. Extreme deceleration of the soliton self-frequency shift by the third-order dispersion in solid-core photonic bandgap fibers. J. Opt. Soc. Am. B 2010, 27, 2328–2335. [Google Scholar] [CrossRef]
  15. Pureur, V.; Bétourné, A.; Bouwmans, G.; Bigot, L.; Kudlinski, A.; Delplace, K.; Le Rouge, A.; Quiquempois, Y.; Douay, M. Overview on solid core photonic bandgap fibers. Fiber Integr. Opt. 2009, 28, 27–50. [Google Scholar] [CrossRef]
  16. Travers, J.C.; Frosz, M.H.; Dudley, J.M. Nonlinear fibre optics overview. In Supercontinuum Generation in Optical Fibers; Dudley, J.M., Taylor, J.R., Eds.; Cambridge University Press: Cambridge, UK, 2010; pp. 32–51. [Google Scholar]
  17. Malitson, I.H. Interspecimen comparison of the refractive index of fused silica. J. Opt. Soc. Am. 1965, 55, 1205–1209. [Google Scholar] [CrossRef]
  18. Börzsönyi, A.; Heiner, Z.; Kalashnikov, M.P.; Kovács, A.P.; Osvay, K. Dispersion measurement of inert gases and gas mixtures at 800 nm. Appl. Opt. 2008, 47, 4856–4863. [Google Scholar] [CrossRef]
  19. Lehmeier, H.; Leupacher, W.; Penzkofer, A. Nonresonant third order hyperpolarizability of rare gases and N2 determined by third harmonic generation. Opt. Commun. 1985, 56, 67–72. [Google Scholar] [CrossRef] [Green Version]
  20. Hasan, I.; Akhmediev, N.; Chang, W. Empirical Formulae for Dispersion and Effective Mode Area in Hollow-Core Antiresonant Fibers. J. Light. Technol. 2018, 36, 4060–4065. Available online: http://jlt.osa.org/abstract.cfm?URI=jlt-36-18-4060 (accessed on 15 December 2019). [CrossRef]
  21. Husakou, A.V.; Herrmann, J. Supercontinuum generation of higher-order solitons by fission in photonic crystal fibers. Phys. Rev. Lett. 2001, 87, 203901. [Google Scholar] [CrossRef] [Green Version]
  22. Wai, A.; Menyuk, C.R.; Lee, Y.C.; Chen, H.H. Nonlinear pulse propagation in the neighborhood of the zero-dispersion wavelength of monomode optical fibers. Opt. Lett. 1986, 11, 464–466. [Google Scholar] [CrossRef]
  23. Wai, A.; Chen, H.H.; Lee, Y.C. Radiations by ‘‘solitons’’ at the zero group-dispersion wavelength of single-mode optical fibers. Phys. Rev. A 1990, 41, 426–439. [Google Scholar] [CrossRef]
  24. Karpman, V.I. Radiation by solitons due to higher-order dispersion. Phys. Rev. E 1993, 47, 2073–2082. [Google Scholar] [CrossRef]
  25. Agrawal, G. Nonlinear Fiber Optics, 4th ed.; Academic Press: Cambridge, MA, USA, 2007. [Google Scholar]
  26. Wan, Y.; Chang, W. Effect of decreasing pressure on soliton self-compression in higher-order modes of a gas-filled capillary. Opt. Express 2021, 29, 7070–7083. [Google Scholar] [CrossRef]
  27. Yang, Y.; Xu, Z.; Jiang, X.; He, Y.; Guo, X.; Zhang, Y.; Qiu, C.; Su, Y. High-efficiency and broadband four-wave mixing in a silicon-graphene strip waveguide with a windowed silica top layer. Photon Res. 2018, 6, 965–970. [Google Scholar] [CrossRef] [Green Version]
Figure 1. (a) Group-velocity dispersion (GVD) of the fundamental core mode calculated using the finite-element method (FEM) (blue line) when the anti-resonant hollow-core fiber (AR-HCF) is filled with 20 bar xenon. The red-dashed line is the GVD of the fundamental core mode in the dielectric capillary of the same core size. The confinement loss obtained from the FEM is shown in grey shade. (b) Effective mode area calculated using FEM. Inset shows the idealized cross-section of the AR-HCF. It has eight dielectric cladding tubes of diameter d = 7 µm and wall thickness t = 570 nm, surrounding the hollow core of diameter D = 20 µm.
Photonics 09 00025 g001
Figure 2. Output spectra for the wavelength-dependent area (WDA, black line) and wavelength-independent area (WIA, red line) models with the femtosecond pump at 1430 nm.
Photonics 09 00025 g002
Figure 3. First row: Spectral evolutions of a 1430 nm pump propagating in a 5 cm-long AR-HCF filled with 20 bar xenon calculated using (a) WDA and (d) WIA models. Second row: Spectra at z = 0.75 cm calculated using (b) WDA and (e) WIA models. The green highlighted band in each corresponds to a higher-order soliton with the duration and peak power as indicated in the inset. Last row: DW (blue) and DFWM (red) dephasings of the highlighted soliton for (c) WDA and (f) WIA models. PM: phase-matching.
Photonics 09 00025 g003
Figure 4. Simulated spectrograms at different positions in the fiber in (a) the WDA and (b) WIA models. They are obtained using the cross-correlation frequency-resolved optical gating technique with a Gaussian gate pulse of duration 35 fs. The yellow highlighted regions correspond to the cladding tube wall thickness-induced resonant bands of the AR-HCF.
Photonics 09 00025 g004
Figure 5. Nonlinear coefficient profile across the spectrum. Vertical red- and black-dotted lines indicate locations of the pump (1430 nm) and soliton in the WDA model, respectively. The horizontal red-dashed line is the nonlinear coefficient at 1430 nm. The red shaded area is the nonlinear coefficient where the soliton forms in the WDA model. The coefficient values are higher in this region than than assumed in the WIA model.
Photonics 09 00025 g005
Figure 6. Color density plots of the spectrum at the output of the 5-cm long AR-HCF with the 1430 nm pump at different pump pulse energies in the (a) WDA and (b) WIA models. The spectral intensity is normalized to the maximum in the WDA model.
Photonics 09 00025 g006
Figure 7. Output spectrum for the WDA (black line) and WIA (red line) models when the same system is pumped at 800 nm.
Photonics 09 00025 g007
Figure 8. Top row: Color density plots of the spectral evolutions of the 800 nm pump propagating in the 5 cm-long AR-HCF filled with 20 bar xenon. The simulation results are obtained with the (a) WDA and (d) WIA models. Middle row: The pulse spectra at z = 1.65 cm for the (b) WDA and (e) WIA models. The green highlighted parts correspond to higher-order solitons with the peak powers and FWHM duration as indicated in the insets. Bottom row: DW (blue) and DFWM (red) dephasing plots for the green highlighted pulse for the (c) WDA and (f) WIA models.
Photonics 09 00025 g008
Figure 9. Spectrograms at three different positions in the fiber were calculated using (a) WDA and (b) WIA models.
Photonics 09 00025 g009
Figure 10. DFWM-induced phase-matching wavelength (the longest idler wavelength) for varying peak power (0.2–15 MW) in the nonlinear correction term in Equation (6). The wavelength of the pump photon is indicated next to each line.
Photonics 09 00025 g010
Figure 11. Nonlinear coefficient versus wavelength. Vertical red- and black-dotted lines indicate the positions of the source wavelength (800 nm) and the pump wavelength for the DFWM (1.175 um), respectively. Section 1 includes the first resonant band, Section 2 includes the second resonant band, and Section 3 covers the third and fourth resonant bands. The vertical grey-dotted line marks another wavelength with the nonlinear coefficient value that is equal to that at the pump, which separates Section 2 and Section 3. The horizontal red-dashed line indicates the nonlinear coefficient evaluated at 800 nm. Red (green) shade marks the region in Section 3 where the nonlinear coefficient in the WDA model is higher (lower) than that assumed in the WIA model.
Photonics 09 00025 g011
Figure 12. (ac) show the spectral evolutions obtained with the mode-area dispersion included only in Section 1, Section 2 and Section 3, respectively, while the other sections are assumed to have a constant nonlinear coefficient evaluated at 800 nm.
Photonics 09 00025 g012
Figure 13. Output spectra when the system is pumped with an 800 nm pulse of different input energies in the (a) WDA and (b) WIA models. The plots are normalized to the maximum spectral intensity recorded in the WDA model.
Photonics 09 00025 g013
Publisher’s Note: MDPI stays neutral with regard to jurisdictional claims in published maps and institutional affiliations.

