Article

Accurate Imaging of Wide Beam Active Millimeter Wave Based on Angular Spectrum Theory and Simulation Verification

School of Electronics and Information Engineering, Harbin Institute of Technology, Harbin 150001, China
*
Author to whom correspondence should be addressed.
Photonics 2021, 8(9), 397; https://doi.org/10.3390/photonics8090397
Submission received: 19 August 2021 / Revised: 14 September 2021 / Accepted: 16 September 2021 / Published: 17 September 2021

Abstract

:
Due to the fact that a millimeter-wave (MMW) has a strong ability to penetrate clothing, MMW holographic imaging technology can conduct a non-contact inspection of the human body’s surface. In recent years, personnel surveillance systems utilizing MMW holographic imaging technology has achieved rapid progress. However, limited by MMW holographic imaging’s image quality, the existing imaging technology cannot accurately detect whether the human body carries hidden objects. Additionally, real-time inspection requirements cannot be practically satisfied, and the system cost is relatively high. In this paper, a reconstruction algorithm with enhanced imaging quality, which can solve the problem of spherical wave attenuation with distance, making imaging results more accurate. The sampling conditions and imaging resolution are simulated and analyzed, which verify the azimuth resolution. Furthermore, the antenna beam’s holographic imaging simulation is optimized, effectively improving the quality of the reconstructed image. The proposed scheme provides theoretical support for determining antenna step and scanning aperture size in engineering and have theoretical guiding significance for improving the image quality of millimeter-wave holography and reducing system cost.

1. Introduction

Millimeter-wave imaging has various advantages, including with no risk of ionizing radiation, strong penetrating power on clothing, high imaging resolution, etc. Millimeter-wave imaging can effectively detect metal or plastic guns, explosives and other threats that are hidden under people’s clothes [1], which is suitable to be utilized in human security. Therefore, the exploration of security equipment based on millimeter-wave technology has great potential applications in the future. In 2013, Sheen and his colleagues discussed the effect of a wide beam on resolution [2]. In 2015, Baccouche proposed the 12 transmitting and 12 receiving sparse array imaging system that works in 75–110 GHz; the holographic reconstruction algorithm relies on increasing the system bandwidth, which increases the system cost [3]. In 2015, Qiao presented an exact reconstruction formula for near-field three-dimensional (3D) planar millimeter-wave (MMW) holographic imaging based on scalar diffraction theory [4], the proposed reconstruction formula cannot avoid the propagation loss of the source for the near-field imaging configuration. In 2017, Yurduseven explored the concept in the context of millimeter-wave imaging, presenting the design and simulation of a single frequency (75 GHz), multistatic, holographic spotlight aperture integrated into a K-band (17.5–26.5 GHz) frequency-diverse imager [5]. However, obtaining full resolution images across a large field-of-view (FOV) can lead to slow reconstruction times and limits the system performance. In 2019, Amineh examined novel holographic techniques to gain super-resolution or quantitative images. The author also discussed the capabilities and limitations of holographic reconstruction techniques [6]. In 2021, Tan proposed a range algorithm for near-range 3D image reconstruction, where phase decoupling is achieved with 2D Stolt mapping [7]. However, there is no way to recover three-dimensional distribution less than the range resolution. The algorithm shown in [7] lacks the matched filter to effectively compensate its phase. Jing presented an image fusion method with a single-frequency imaging method [8], but this too cannot obtain the required resolutions. Furthermore, Qiao demonstrated the AMMW 3D scan real-time imaging mechanism by using beam control techniques and fast post-processing algorithms, but the imaging systems need the targets to keep still and hold a special posture while screening, limiting the throughput [9].
Existing imaging products have a weak ability to penetrate clothes, slow imaging speed, serious artifacts and also produce ionizing radiation to the human body. The traditional two-dimensional plane holographic algorithm based on spherical wave expansion ignores the attenuation of a spherical wave with distance. To solve these problems, this paper proposes a two-dimensional planar accurate holographic reconstruction algorithm based on angular spectrum theory, which solves the problem of spherical wave attenuation with distance. In this paper, the accurate reconstruction algorithm of millimeter-wave holographic imaging is used to verify the azimuth resolution. Point target simulation with different spacing is used to verify the resolution. Additionally, to simulate the plus sign graph, the simulation results can effectively verify the theoretical feasibility of the proposed algorithm. The main research contents include the following aspects: first, two-dimensional holographic algorithms based on spherical wave expansion are proposed; and second, two-dimensional exact holographic reconstructions based on angular spectrum theory are derived. The azimuth resolution is verified by simulation, and the best sampling plane range is determined. Based on the prior beam and imaging distance, the diffraction hologram and inversion reconstruction image of the metal target with a complex reflectivity of one are observed by using an extremely narrow beam, an ordinary beam and an ultra-wide beam, respectively. The main lobe of the antenna beam in the holographic simulation was optimized from 8.8° to 57.0°, effectively improving the reconstructed image quality. In the single sending and receiving mode, the reconstruction effect of the transmitting antenna with a wide-beam half-wave oscillator is better than that of a narrow-beam horn antenna, and the minimum relative error of reconstructed data is as low as 6%.
The proposed algorithm can determine the size of the optimal sampling plane, taking into account the image quality and operation time, and provide basic theoretical support for determining antenna stepping and scanning aperture in engineering. Meanwhile, this paper provides a theoretical basis for the optimization of a transmitting antenna beam and an obtained high resolution reconstruction image in the practical engineering application. The research on millimeter-wave accurate holographic reconstruction algorithms in this paper provides a theoretical support for applying millimeter-wave imaging systems in human security.

2. Accurate Millimeter-Wave Reconstruction Algorithm Based on Spherical Wave Expansion

The imaging system is a single transmitting and single receiving mode, which includes a transmitting antenna and a receiving antenna. The receiving antenna RX and transmitting antenna TX of the millimeter-wave direct holographic imaging system are placed next to each other, which is approximately considered to be in the same position. The transmitting antenna TX emits spherical waves to irradiate the imaging object, and each point on the object scatters millimeter-wave signals. Then, the scattered signals received by the receiving antenna will be the superposition of the scattered signals from various positions on the object surface.
The millimeter-wave signal from the transmitting antenna irradiates on the target object, each point on the object scatters millimeter-wave signals, which are then received by a receiving antenna, after scattering once, and move a step to the next position. Complete the horizontal and vertical scanning in turn, forming a scanning aperture.
The whole system only has one transmitter and one receiver, and both of them are in the same position, horizontal and vertical scanning is completed by mechanical movement; therefore, there is no interference between multiple transmitters or receivers opened at the same time. The scattering data (including field intensity and phase) received by the receiving antenna at each position can be substituted into the algorithm described in this paper to reconstruct the object image.
Millimeter-wave direct holographic imaging relies on heterodyne mixing technology, which measures complex signals containing amplitude and phase information rather than millimeter-wave intensity. The millimeter-wave signal from the millimeter-wave source is divided into two channels through the coupler, one of which is irradiated on the object through the transmitting antenna. The other signal is input to the I/Q modem as a reference signal.
The millimeter-wave signal scattered by the object is received by the receiving antenna and input to the I/Q demodulator as the measurement signal after passing through the power amplifier. The I/Q demodulator uses the reference signal to extract the phase of the measured signal. Without considering the signal amplitude, it is assumed that the millimeter-wave signal from the millimeter-wave source is cos ωt, where ω is the angular frequency of the millimeter-wave signal, and t is the time. The millimeter-wave signal received by the receiving antenna introduces the phase φ to be measured because it goes through the process of incident on the surface of the object and reflects back; therefore, the signal can be expressed as cos (ωt + φ).
Mixers mainly contain a multiplier and a band pass filter. The product of the two signals input to mixer one is calculated, and the real part I of the complex signal to be measured is obtained by the low pass filtering of the signal. The reference signal input to mixer two is first carried out in a 90 degrees phase shift, and the imaginary part Q of the complex signal to be measured can be obtained by low pass filtering. In actual measurement, the output signal of the I/Q demodulator also contains amplitude information, and the phase information can be directly extracted by using the above-mentioned measurement circuit for millimeter-wave direct holographic imaging, without the irradiation of the reference wave. This greatly simplifies the imaging device and facilitates the imaging of any field of view.
Firstly, taking single-frequency holography as an example, the millimeter-wave wavelength is λ, the wave number k = 2π/λ and the target complex reflectivity is f (x, y) [10,11]. Based on plane scanning, Rx is the omnidirectional antenna, transceiver antenna Tx, Rx are in the same position (x0, y0), the vertical distance between the target plane and the scanning plane is set as z0, the distance between the object point (x, y) and the transceiver antenna position (x0, y0) is as follows:
r = ( x x 0 ) 2 + ( y y 0 ) 2 + z 0 2
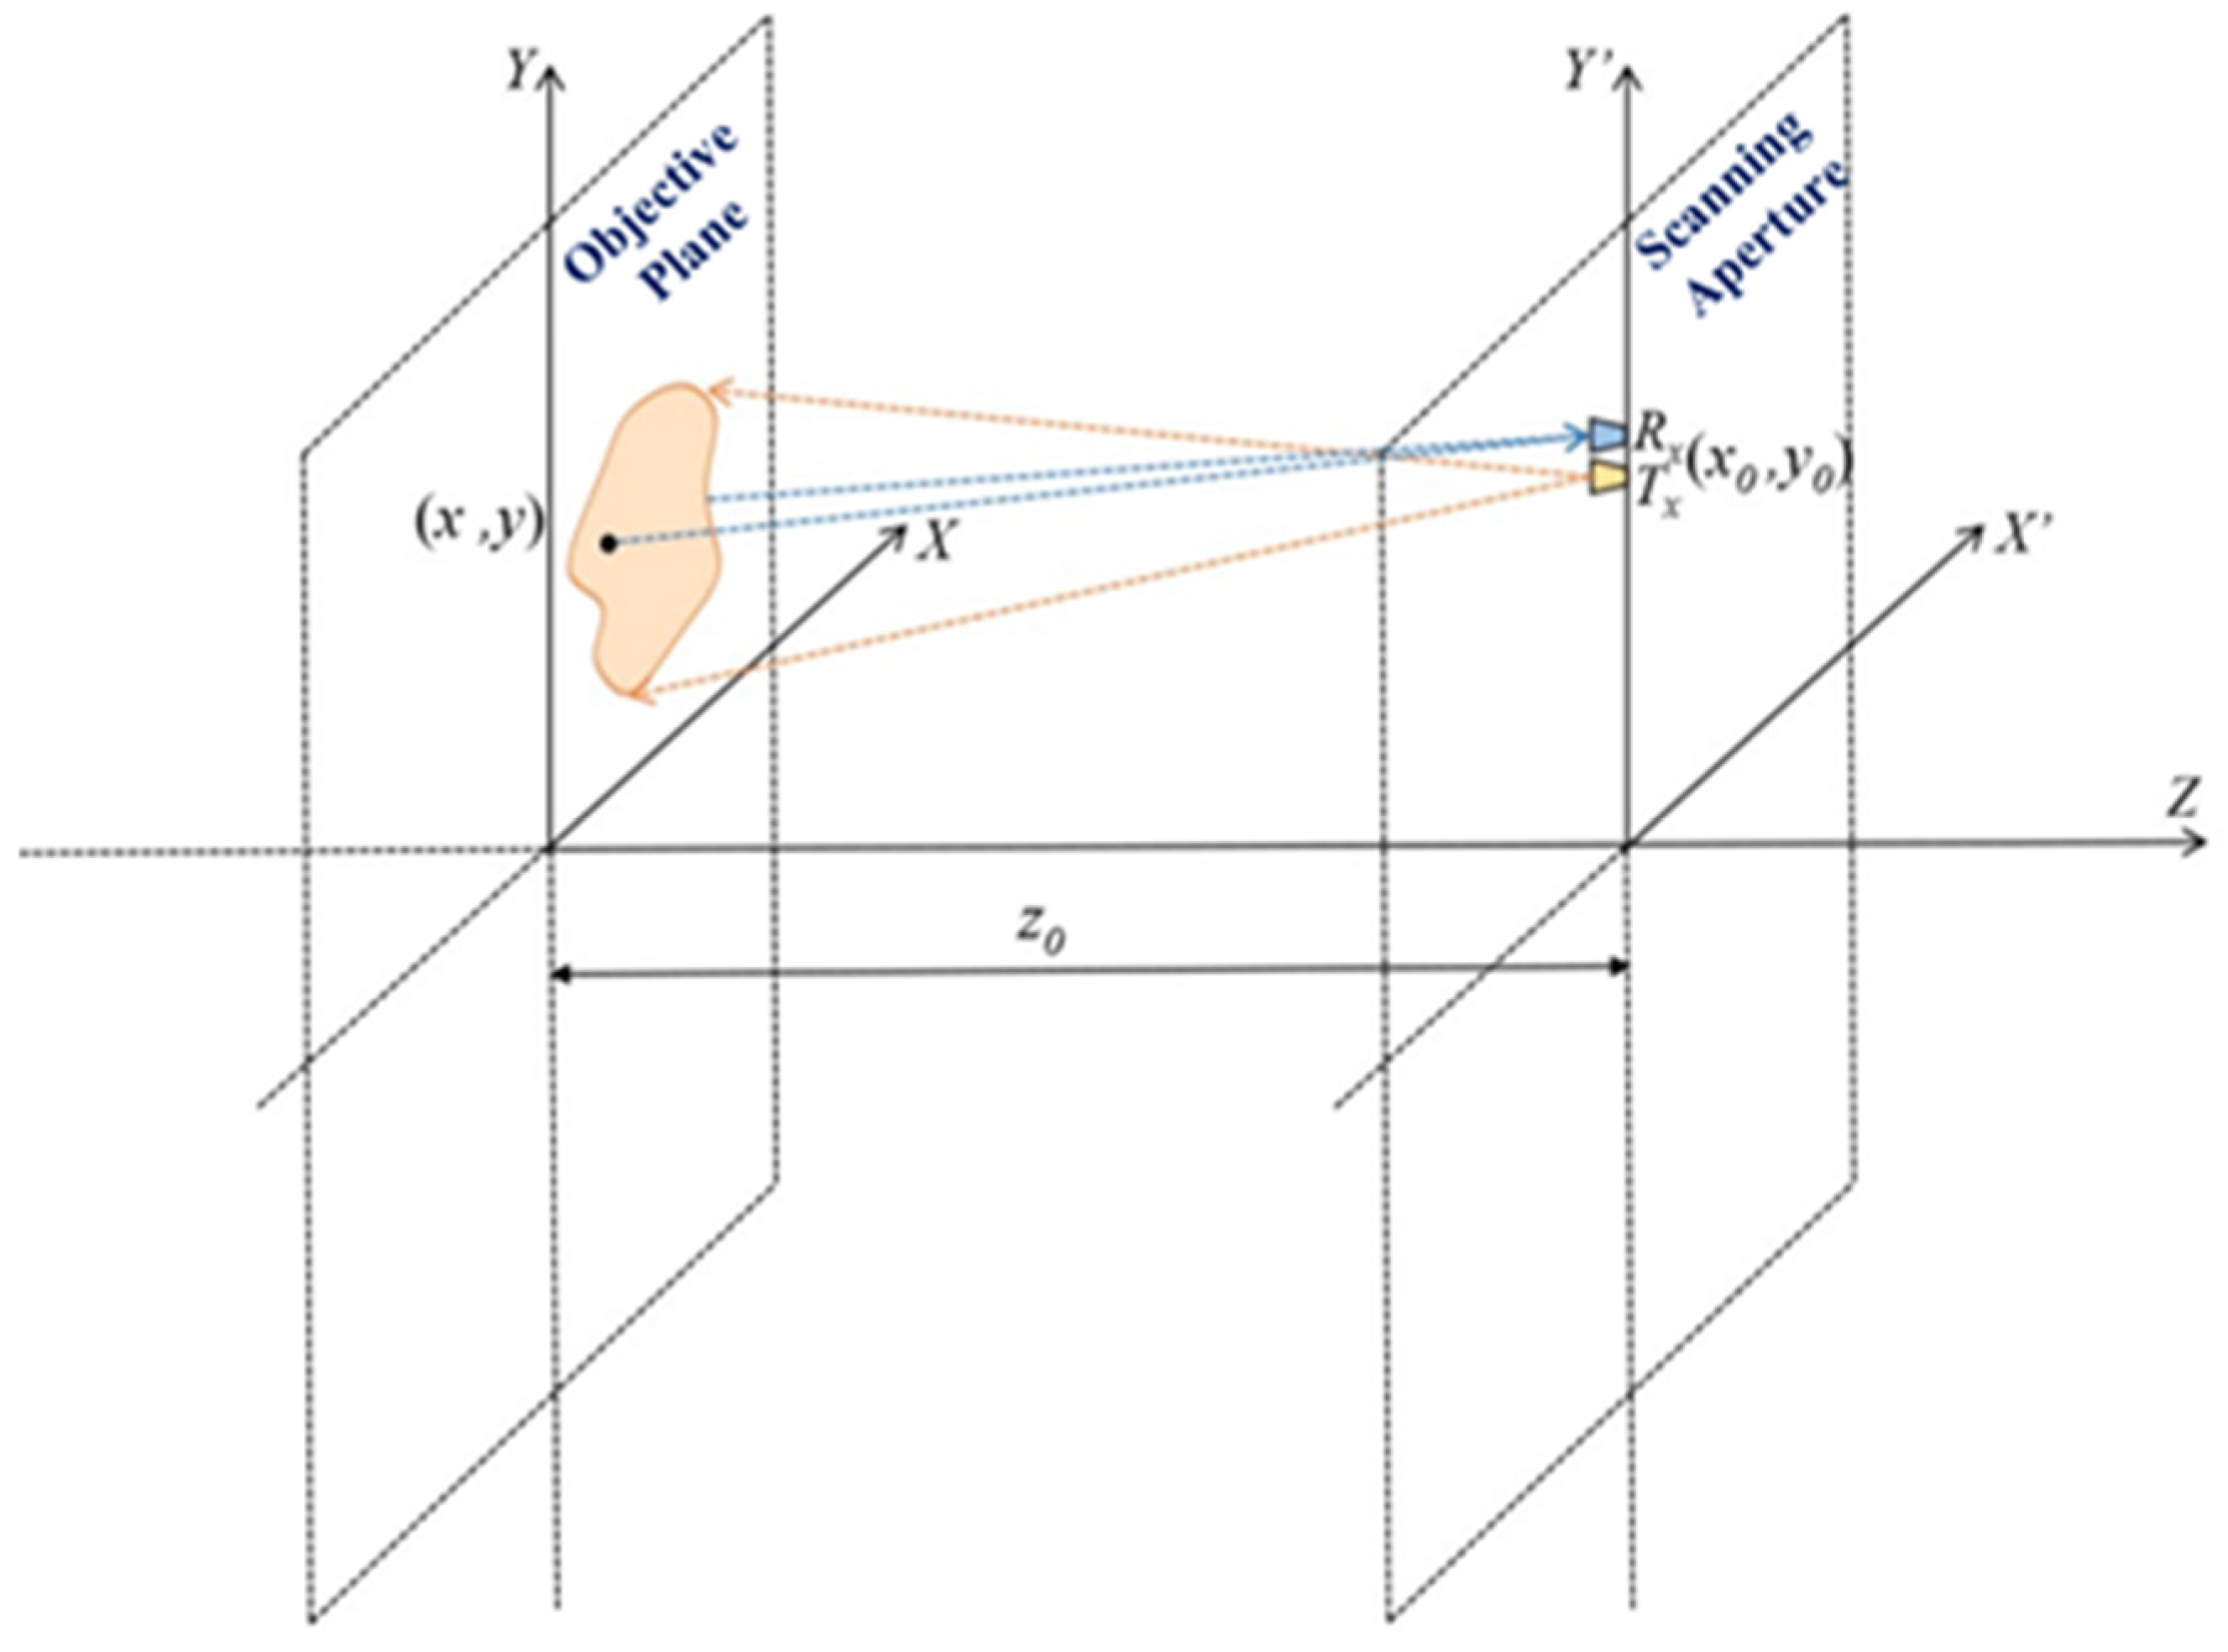
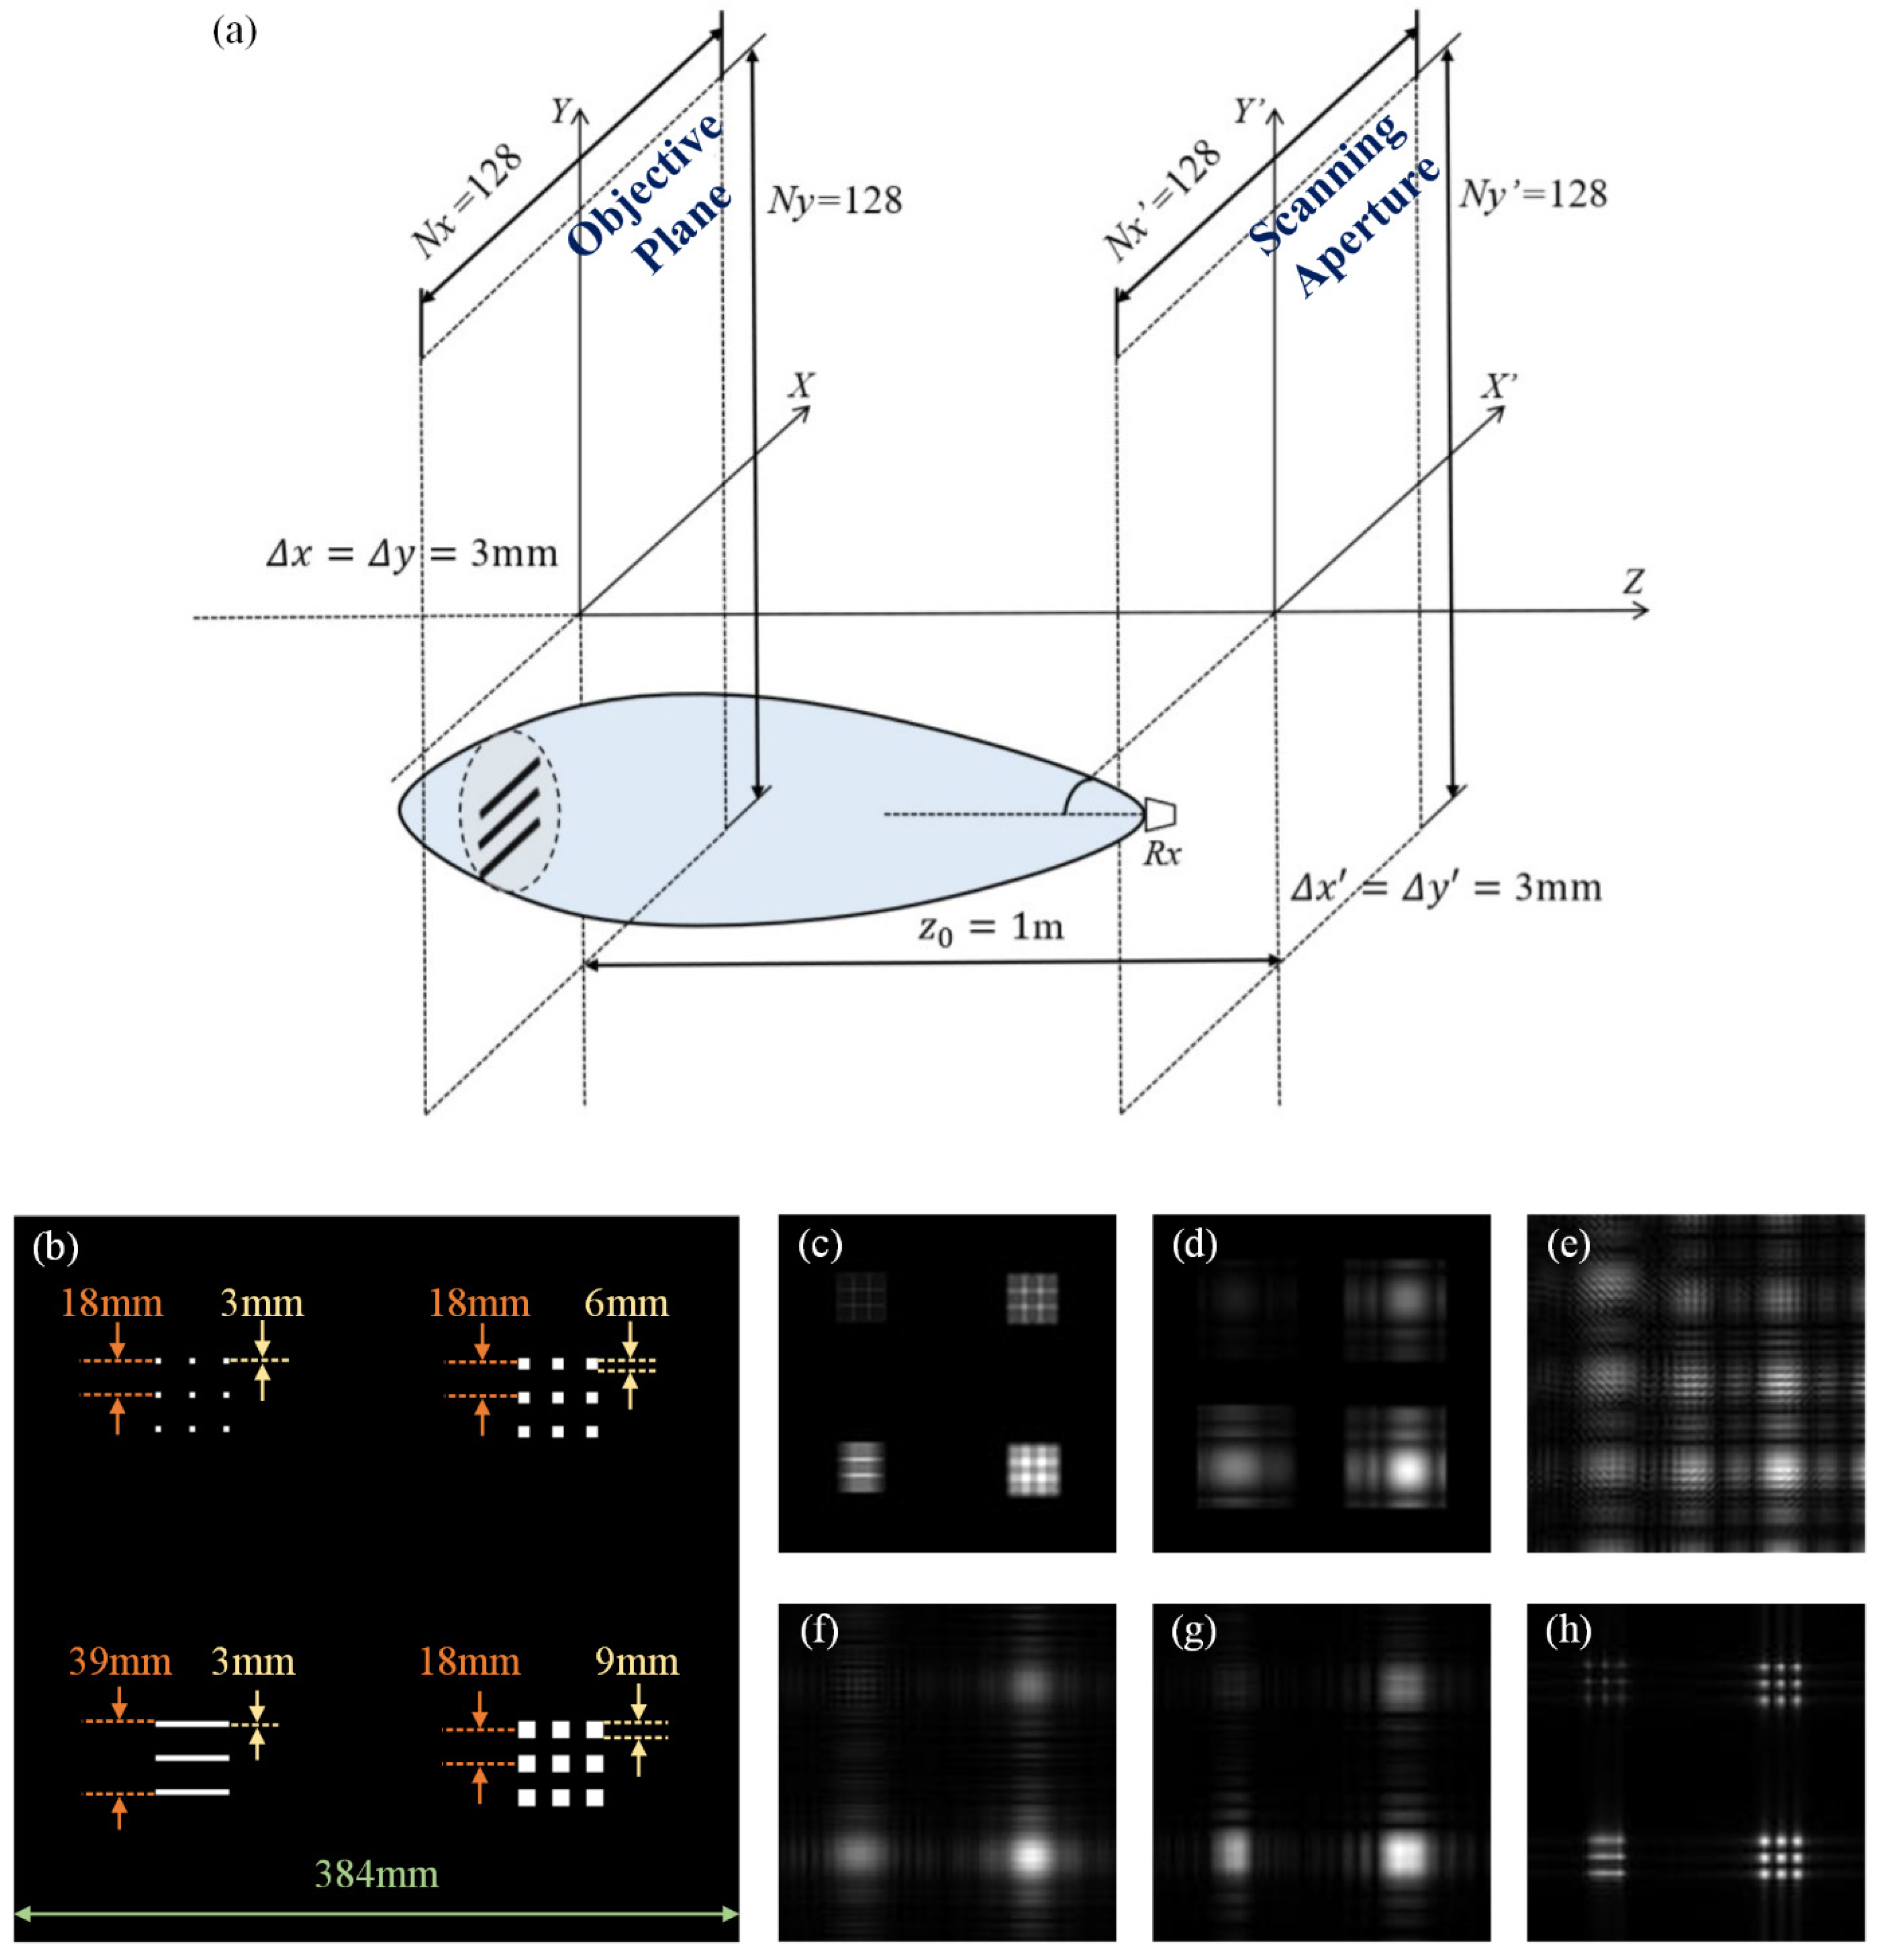
The two-dimensional imaging model is shown in Figure 1. The transmitting antenna TX emits a spherical wave exp(−jkr)/r (r is the distance) to irradiate on the imaging object, and each point on the object scatters millimeter-wave signals. Then, the scattered signals received by the receiving antenna will be the superposition of scattered signals from each position on the object surface. Under the assumption of the Born primary scattering approximation and isotropic scattering, the complex signal s (x0, y0) collected by heterodyne-mixing technology is the superposition of the scattered echo signals of all the sampling points in the target plane, which can be expressed as follows [12,13,14,15]:
s ( x 0 , y 0 ) = f ( x , y ) exp ( j 2 k r ) r 2 d x d y
where s (x0, y0) is the complex signal measured using heterodyne mixing technology. Ignoring the attenuation of the spherical wave with distance, the spherical wave is developed into a plane wave, and the Fourier transform is used here [16,17]. When the Fourier variables of x0 and y0 are denoted as kx0 and ky0, the complex signal s (x0, y0) can be described as follows:
s ( x 0 , y 0 ) [ f ( x , y ) exp ( j k x 0 j k y 0 ) d x d y ] exp ( j k x 0 x 0 + j k y 0 y 0 j k Z 0 Z 0 ) d k x 0 d k y 0
Through substituting kZ0 into (3), the reconstruction formula is obtained by the following:
f ( x , y ) = F T 2 D 1 [ F T 2 D [ s ( x 0 , y 0 ) ] exp ( j Z 0 4 k 2 k x 0 2 k y 0 2 ) ]
The distribution of “spatial spectrum” can be obtained by FT in space. If the light field distribution of the plane z = 0 is U0 (x, y, 0), the angular spectrum distribution of the light field U0 (x, y, 0) will be obtained through FT, and the expression is as follows:
A ( f x , f y , 0 ) = U ( x , y , 0 ) exp [ j 2 π ( x f x + y f y ) ] d x d y
Through IFT, the light field distribution at z = Z0 can be obtained as follows:
U z ( x , y , Z 0 ) = A z ( f x , f y , Z 0 ) exp [ j 2 π ( x f x + y f y ) ] d f x d f y
The angle spectral distribution of the target plane is obtained by using the known angle spectral distribution of the light field as follows:
U z ( x 0 , y 0 , Z 0 ) = A ( f x , f y ) exp ( j k Z 0 1 λ 2 f x 2 λ 2 f y 2 ) exp ( j 2 π ( f x x 0 + f y y 0 ) ) d f x d f y
Substitute Equation (2) in accordance with the angular spectrum propagation formula (7), when component k is simplified and substituted as kx = 2πfx, ky = 2πfy, the reconstruction formula is shown as follows:
f ( x , y ) = { 2 Z 0 j λ F T 2 D 1 { F T 2 D [ s ( x 0 , y 0 ) ] exp ( j Z 0 4 k 2 k x 2 k y 2 ) } }
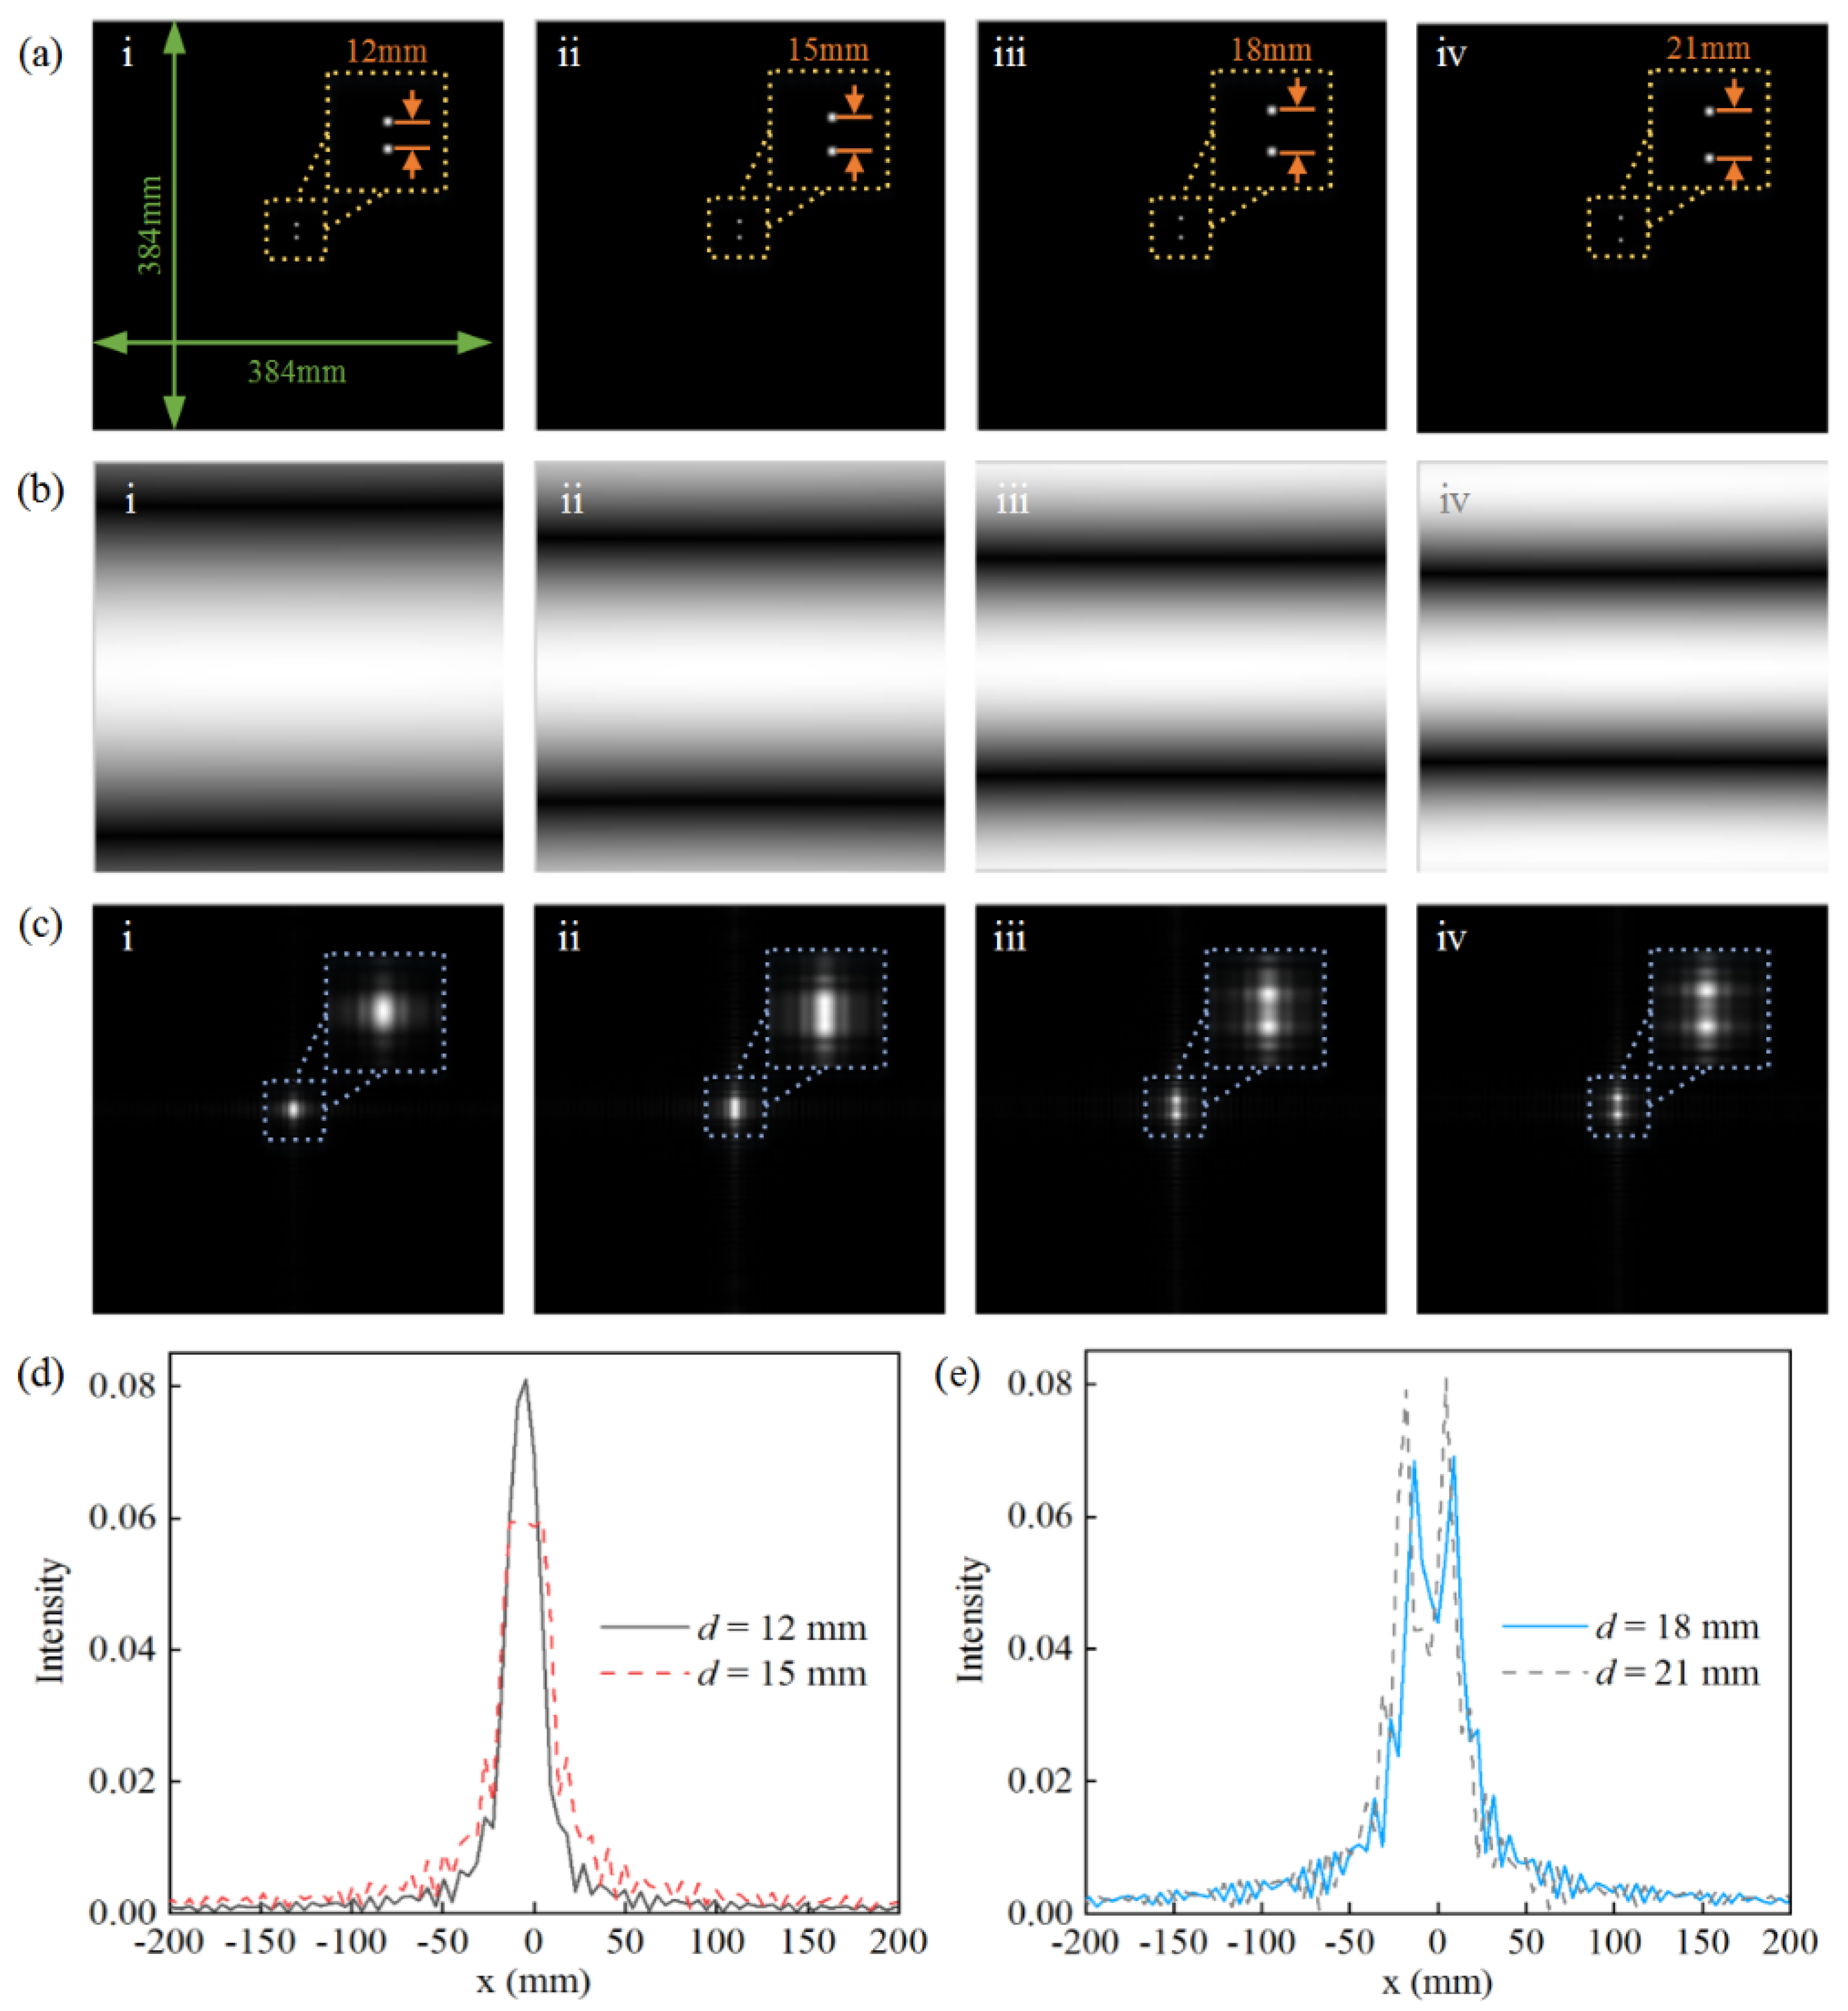
The image resolution reflects the quality of the reconstructed image. Millimeter-wave holographic imaging uses the basic principle of synthetic aperture radar (SAR) for reference. In order to meet the requirements of the security inspection imaging system, the focusing plane (imaging distance) of this paper is set as 3 m. The expression of azimuth resolution is related to the millimeter-wave wavelength, target distance and scanning aperture size [18], which is expressed as follows:
δ y = λ c z 0 2 L y
where δy is the Y-resolution, λc is the wavelength corresponding to the center frequency, z0 is the spacing between the target plane and the imaging plane and Ly is the aperture size of the antenna synthesis. It can be seen from Equation (9) that the resolution depends mainly on the synthetic aperture. The larger the aperture is, the stronger the resolution is.
The optimal sampling plane mentioned in this paper is determined by sampling points and scanning aperture size, the sampling range formula is as follows:
L p r = L 0 + λ z 0 2 Δ y
where Δy’ is the sampling interval and L0 is the horizontal dimension of the target. Lpr is the suggested value of the sampling plane side length. Lre is the size of the receiving plane. Lpr is obtained according to the highest frequency of the image, which can be approximately satisfied. However, when 
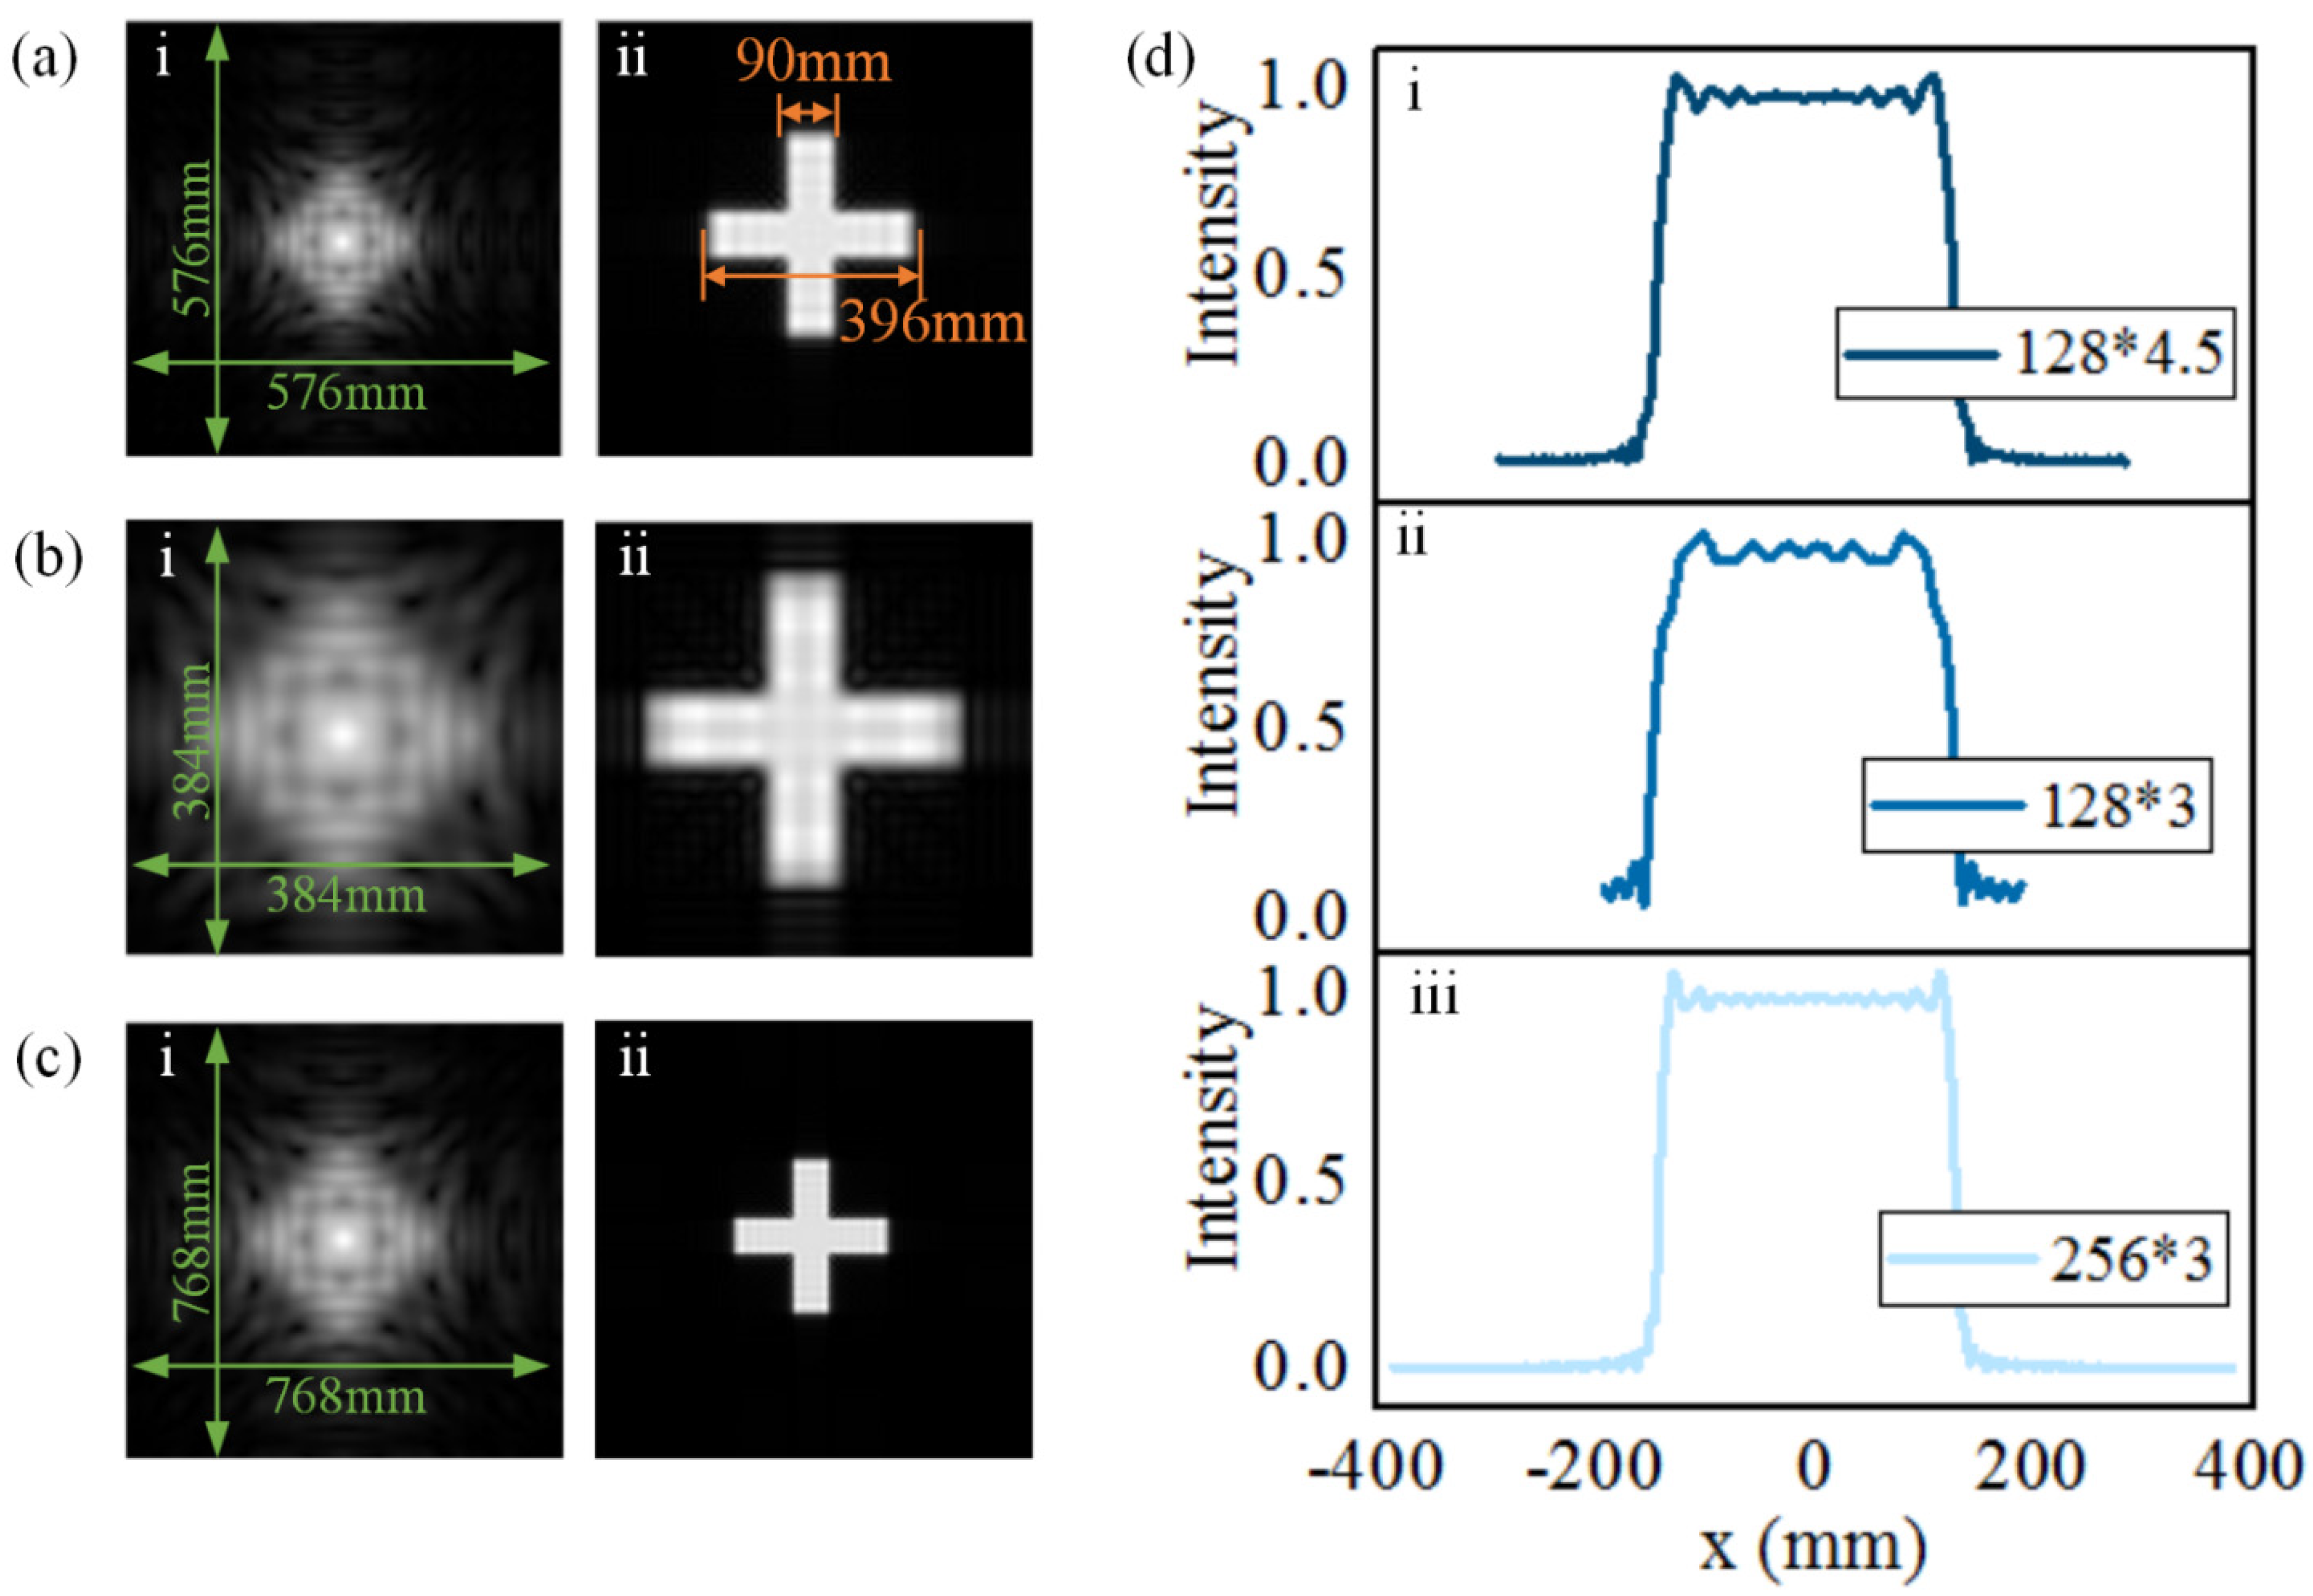
Lpr/Lre is too large, the receiving plane will be too small and a large number of high-frequency components will be lost in the reconstructed image, resulting in image blur. In this paper, the plus sign graphic simulation is used to obtain the optimal sampling plane, and the optimal focusing range of the system is jointly determined by the operating frequency of the system, the beam width of the antenna and the size of the scanning aperture. The imaging system proposed in this paper is mainly applied in the security check system; therefore, the imaging distance is set as 3 m. The operating frequency of the system, the beam width of the antenna and the size of the scanning aperture are also set according to this index.
In optics, Fresnel diffraction refers to the diffraction of light waves in the near field region. The Fresnel diffraction integral formula can be used to calculate the propagation of light waves in the near field region. The Fresnel diffraction reconstruction algorithm can extract the amplitude and phase information of the measured sample from a hologram and reconstruct the original object image in real time.
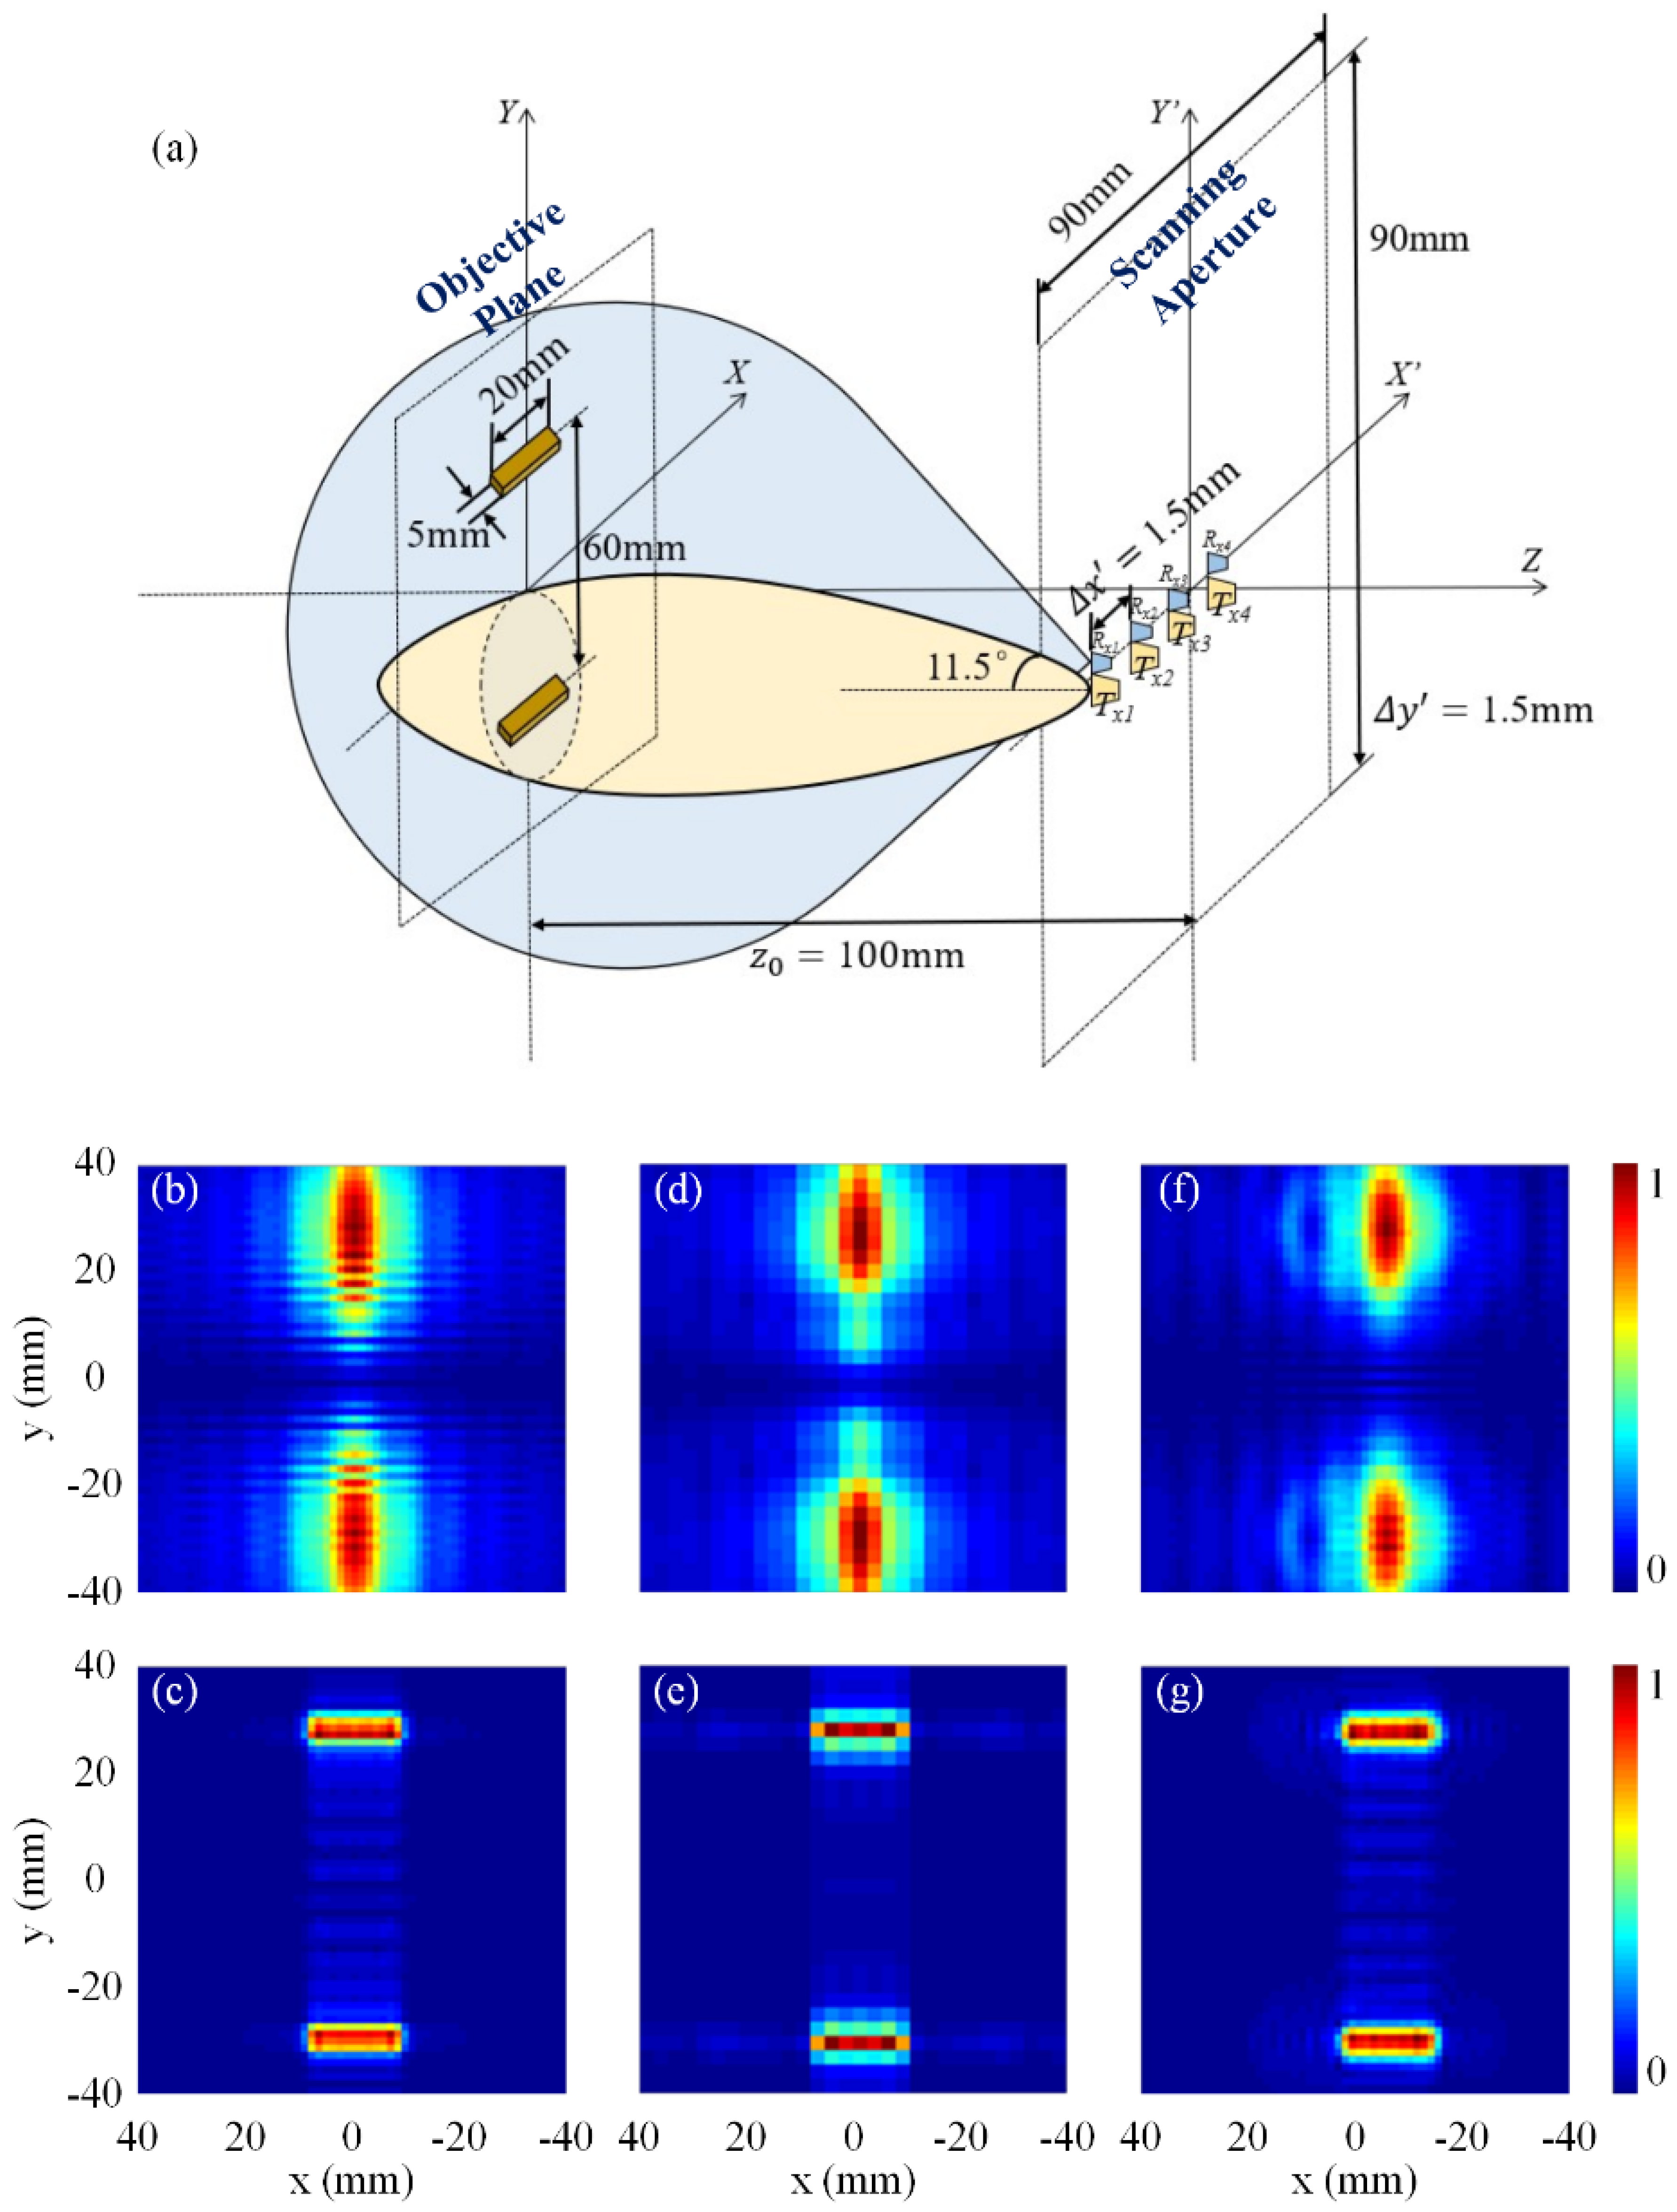
The antenna has a narrow beam and a weak diffraction effect. The reason is that the reflection and scattering intensity of the other lattice in the target image outside the beam is almost not received when the beam is very narrow. In millimeter-wave holography, when the half-power beam width is small, the beam sent by the antenna cannot cover the whole imaging object, and the object will not be irradiated by the beam of a large angle at all. Therefore, the resolution of synthetic aperture holographic imaging will be limited. When the beam of the receiving antenna is very narrow, the electromagnetic wave propagates in a straight line almost without diffraction. When the diffraction effect is weak, the Fresnel diffraction inversion is no longer suitable for imaging because the reconstructed image produced by the algorithm is not as sharp as the diffraction image. For wide-beam antennas, the direction pattern has little effect on the imaging effect and can often be ignored. In the actual millimeter-wave imaging system, the actual scene, the size of transceiver array unit and the spacing of unit center should be considered comprehensively. As the ideal extremely narrow beam and ultra-wide beam are difficult to achieve, the beam of the transmitting antenna is optimized in this paper to obtain the highest resolution and best millimeter-wave holographic inversion of the reconstruction image.

3. Results and Analysis

3.1. Point Target Simulation Verifies Resolution

In this simulation, the reconstructed image’s resolution is considered as the minimum distance that the system can distinguish the two points clearly. Here, two close point sources are taken as an example, the reconstruction algorithm is applied here to image the target. The point target simulation diagram is shown in Figure 2. The target points are set 15 mm apart from each other in the center, and the diameter of the points was 3 mm.
The simulation models are established and shown in Figure 2a. In order to verify that the reconstructed image could exactly distinguish the minimum distance between two points, the distances between the two-point targets were set as 12, 15, 18 and 21 mm, respectively, whose models are shown in (i), (ii), (iii) and (iv). The corresponding hologram images are calculated and shown in Figure 2b. Based on the proposed millimeter-wave holographic accurate reconstruction algorithm, the reconstruction imaging results of the different point-target models are shown in Figure 2c.
By comparing Figure 2(ci–civ), it can be found that when the distance between two-point targets is 12 mm, the two-point targets are difficult to distinguish. As the distance increases to 15 mm, the two-point targets can be exactly distinguished. When the distances are set as 18 and 21 mm, the reconstruction results of the point targets can be clearly observed. In order to make a further numerical analysis, the data along the longitudinal profile of the imaging target are abstracted, as the curves show in Figure 2d,e, exhibiting the clear tendency of the peak values. As shown in Figure 2d, when the distance between the two targets is 12 mm, there is only one peak in the curve, and it is impossible to distinguish the two targets. When the distance is 15 mm, there exists a flat peak curve, which means that the two strong peaks are very close together. Considering the surrounding image, it can be observed that the two points are closely parallel. When the distance is 18 or 21 mm, two separate peaks can be clearly seen in the contour line, indicating that the reconstruction results can be achieved with high quality. The resolution calculated using Equation (7) is 14.6 mm. In the experiment, when the distance between the two points is 15 mm, the point targets can be precisely distinguished. The theoretical results are consistent with the simulation results.

3.2. The Optimal Sampling Plane Simulation

The plus-model simulation is adopted to observe the internal fluctuation of the reconstructed image, and the reconstruction effect of the model is shown in Figure 3. The corresponding parameters of the model are shown in Table 1.
When we set N = 128, λ = 3.75 mm, z0 = 3 m, the condition of sampling interval can be calculated as Δ y 4.73   mm . In order to compare the influence produced by different sampling intervals, here we choose 3 and 4.5 mm as the sampling intervals in the simulations, and the corresponding results are shown in Figure 3a,b. According to the calculation formula, 4.5 mm is the best sampling interval. The corresponding hologram result is shown in Figure 3(ai), and the reconstructed result shown in Figure 3(aii). It can be seen that the image of the plus model is successfully proposed.
Figure 3b presents the hologram and reconstruction results with a 3-millimeter sampling interval. It can be seen that, although the 3-millimeter sampling interval meets the requirements of ∆y’, the scanning aperture is too small to reconstruct the imaging with high quality, where the reconstructed image is blurred, and the edge of the plus sign pattern appears obvious strip artifact.
It can be considered as that, when the antenna aperture and target plane are the same size, the received data would be incomplete due to the divergence characteristics of wave propagating, where the high frequency information would be lost.
Comparing Figure 3a,b, it can be seen that when the dimension of the model is fixed, the size of the detected plane would be changed with the variable sampling intervals. Under the same size, the reconstruction result with a sampling interval of 4.5 mm is better than the reconstruction result with a sampling interval of 3 mm.
Furthermore, in order to compare the influence of different sampling numbers on the imaging results, the sampling interval is set as 3 mm, while the number of sampling points is 256. The corresponding hologram and reconstructed imaging are shown in Figure 3c. Comparing the results in Figure 3(bii,cii) it can be seen that when the sampling points are increased, the reconstructed imaging is clearer. It is attributed to that with a larger imaging plane, as the receiving antenna can obtain more high-frequency components to solve the edge blur. This experiment provides theoretical support for determining the antenna step and scanning aperture in an engineering situation. Figure 3d is the imaging intensity of the longitudinal profile line in the corresponding reconstructed image.
It can be observed from comparing Figure 3(di,dii) that, when the aperture size is small, the edge of the curve peak becomes rounded, meaning that the reconstruction image edge is blurred. Figure 3(diii) illustrates the reconstruction effect with sampling condition 3 mm × 256, which is are the best results in the current simulation.

3.3. Line Pair Model Simulation

The actual electromagnetic waves radiated by the antenna are not ideal spherical waves, and their radiation characteristics are described by the antenna pattern. Antennas usually have a main lobe and a side lobe, and the width of the main lobe can be described by the half-power beam width. In millimeter-wave holography, when the half-power beam width is small, the beam sent by the antenna cannot cover the whole imaging object, and the object will not be irradiated by the beam of large angle at all. Therefore, the resolution of synthetic aperture holographic imaging will be limited. On the other hand, due to the existence of the main lobe and the sidelobe in the antenna direction diagram, the MMW image obtained under ideal conditions will be blurred. For wide-beam antennas, the pattern has little effect on the imaging effect and can often be ignored.
Line-pair simulation is conducted with the prior beam and imaging distance of the accurate holographic reconstruction algorithm. The influence of the beam width of the receiving antenna on the imaging results are analyzed and studied in Figure 4.
Figure 4a is the schematic diagram of the target line pair model with beam scanning. The simulation target is a line-pair model, in which the complex reflectivity of the target lattice and line pair is one, the center frequency is 80 GHz and the wavelength is 3.75 mm. The vertical distance between the target plane and the imaging plane is set as z0, the antenna half-angle is θb and the scanning radius r covered by the beam is obtained through the following calculation: r = z 0 tan θ b .
In this paper, the vertical distance between the target plane and the receiving antenna z0 = 1000 mm, and the beam width of the receiving antenna is set with three different beam widths, including the extremely narrow beam (the half-angle of the antenna θb = 0.73°), ordinary beam (the half-angle of the antenna θb = 4.42°) and ultra-wide beam (the omnidirectional antenna).
The model and detailed size labeling of the line-target are shown in Figure 4b. Three groups of dot matrices are set up in upper left corner, upper right corner and lower right corner. The width of each pixel in the image was set to 3 mm. The similarity of these three groups is that each unit point’s center interval is equal to six pixels, and the length is 18 mm. The difference lies in that the width of each unit point of these three groups is one-, two- and three-pixel points in turn, that is, the widths of the pixel points were 3, 6 and 9 mm, respectively. The line pair model is set up in the bottom left corner.
Figure 4c–e are holographic diffraction patterns with different beam widths. It can be observed that, with the increase in the antenna beam width, the diffraction pattern becomes less clear, and the diffraction effect becomes stronger.
The holographic diffraction Figure 4c is clearest when the very narrow beam is applied. When the receiving antenna beam is extremely narrow, the electromagnetic wave propagates approximately in a straight line, there is almost no diffraction, and the diffraction pattern is the closest to the original target image. The reason for this result is that when the receiving antenna uses a very narrow beam, there is almost no reflection and scattering intensity of the other lattice in the target image outside the received beam.
In Figure 4d, it is found that when the receiving antenna is a general beam, the electromagnetic wave follows the Fresnel diffraction theorem. The antenna gain is higher in the main lobe with an obvious diffraction phenomenon. For the part beyond the antenna’s main lobe, the diffraction of the target becomes weak due to the low gain. Figure 4e shows the reconstructed results with the receiving antenna as an omnidirectional antenna, where all the pixel intensity of the target plane is the superposition of the distance and the phase. It presents a very strong diffraction phenomenon, and the wide beam scanning covers the horizontal and vertical direction of the target, reducing the interference caused by specular reflection. Figure 4f–h are the corresponding reconstruction patterns. It can be found that the definition of the holographic diffraction image with an extremely narrow beam is even higher than the reconstructed image calculated using the inversion algorism. Fresnel diffraction inversion is no longer suitable for computational holographic imaging because of the weak diffraction effect, which means that the image reconstructed using the algorithm is not as sharp as the diffraction image. In practice, such a very narrow antenna beam is extremely difficult to achieve in engineering and physical production.
It can be found from Figure 4g that when the half angle of the antenna is 4.22° (general beam), although the electromagnetic wave follows the Fresnel diffraction theorem and the corresponding imaging result is slightly better than that in Figure 4f, it is still not ideal.
Comparing Figure 4f,g, the small units of three lattice groups can be clearly seen in Figure 4h, which is the best reconstruction result. Based on the calculation of the formula, the 3 dB half-power beam width of the receiving antenna is 57.01°, which can cover the whole target plane and meet the requirements of receiving each pixel point in the target plane. As it is difficult to realize the extremely narrow beam and ultra-wide beam that are ideal in practical applications, reconstruction images with the high-resolution quality can be obtained by rationally optimizing the beam of the transmitting antenna and controlling the beam width within a certain range.

3.4. FEKO Modeling and Simulation

The purpose of this simulation is to analyze the effects of holographic diffraction images and inversion reconstruction images under the conditions of different types of transmitting antennas and different beam widths, and to compare the quality of the reconstruction images of normal sampling and sparse sampling.
Transmitting antennas adopt a Y-polarized half-wave oscillator and an X-polarized horn antenna, respectively. The receiving antenna can be regarded as an omnidirectional antenna to obtain all the directional components of the electric field at the receiving antenna in the scene. The simulation diagram of the metal strip is shown in Figure 5a, where the metal strip’s length and width are set as 20 and 5 mm. The center frequency of the transmitting antenna is 94 GHz, and the wavelength is 3.19 mm. The step of the antenna is ∆x and the vertical distance between the target plane and the transmitting antenna is 100 mm. The imaging system adopts a single sending and single receiving mode, and the transmitting and receiving antennas are located in the same position. Figure 5b shows a metal band hologram image when the transmitting antenna is a dipole and the sampling interval is set as 1.5 mm, and the reconstruction imaging result in Figure 5c is calculated based on precise reconstruction algorithm of millimeter-wave holography. It can be seen that the reconstruction effect is in agreement with the pre-setting model. The simulated length and width of the reconstructed metal strip image are 18.5 and 5.3 mm, respectively. Compared to the pre-setting model size, the minimum error of the reconstructed image data is as low as 6%.
The corresponding hologram and reconstructed imaging results shown in Figure 5d,e are for when the transmitting antenna is still set as a dipole and the sampling interval is changed to 3 mm. Compared with the reconstruction images with sampling interval of one wavelength and half wavelength, the reconstruction results are obviously different. The width of the reconstructed metal strip in Figure 5e has a large distortion. This is because the sampling interval cannot meet the Nyquist sampling theorem, resulting in the array antenna’s step being too sparse to create an image with high quality.
Next, the reconstruction results based on the horn antenna with a half angle of 11.5° is discussed, and the sampling interval is set as 1.5 mm. The hologram and reconstruction results are shown in Figure 5f,g, respectively. It can be found that the diffraction effect of the hologram is improved, and the pattern of the corresponding reconstructed band is more consistent with the preset model.
By comparing the reconstruction results of the transmitting antenna with a narrow beam and a wide beam, the image reconstructed with a wide beam antenna can be clearer, while the edge of the reconstructed image with a narrow beam is blurrier. In contrast, increasing the antenna beam width and optimizing the sampling interval can effectively improve the quality of reconstructed images.

4. Discussion

To summarize, the two-dimensional plane holographic algorithm based on spherical wave expansion and the two-dimensional plane accurate holographic reconstruction algorithm based on angular spectrum theory are derived. The accurate holographic reconstruction algorithm is used to determine the resolution and the best sampling plane range. With the fixed prior beam and imaging distance, the diffraction hologram and inversion reconstruction image of the target line pair with a complex reflectivity of one can be observed under the extremely narrow beam, ordinary beam and ultra-wide beam. The antenna beam in holographic simulation is optimized. Additionally, in the single-shot and single-receive mode, the reconstruction effect of the transmitting antenna as a wide-beam half-wave oscillator is better than the narrow-beam horn antenna, and the minimum relative error of reconstruction data is as low as 6%. The methods and principles proposed in this paper provide theoretical support for determining the antenna step and scanning aperture size in engineering and have theoretical guiding significance for improving the image quality of millimeter-wave holography and reducing the system cost.

Author Contributions

Conceptualization, H.Z. (He Zhang); data curation, H.Z. (He Zhang); formal analysis, H.Z. (He Zhang); funding acquisition, J.Q.; investigation, H.Z. (Hua Zong); methodology, H.Z. (He Zhang) and H.Z. (Hua Zong); project administration, J.Q.; supervision, J.Q. All authors have read and agreed to the published version of the manuscript.

Funding

This research was funded by the National Natural Science Foundation of China (Grant No. 61731007 and No. U1633202).

Institutional Review Board Statement

Not applicable.

Informed Consent Statement

Not applicable.

Data Availability Statement

Data can be obtained from the authors with the permission.

Conflicts of Interest

The authors declare no conflict of interest.

References

  1. Sheen, D.M.; McMakin, D.L.; Hall, T.E. Three-dimensional millimeter-wave imaging for concealed weapon detection. IEEE Trans. Microw. Theory Tech. 2001, 49, 1581–1592. [Google Scholar] [CrossRef]
  2. Sheen, D.M.; Fernandes, J.L.; Tedeschi, J.R.; McMakin, D.L.; Jones, A.M.; Lechelt, W.M.; Severtsen, R.H. Wide-bandwidth, wide-beamwidth, high-resolution, millimeter-wave imaging for concealed weapon detection. In Passive and Active Millimeter-Wave Imaging; International Society for Optics and Photonics: Baltimore, MD, USA, 2013; Volume 8715, p. 871509. [Google Scholar]
  3. Baccouche, B.; Keil, A.; Kahl, M.; Bolivar, P.H.; Loeffler, T.; Jonuscheit, J.; Friederich, F. A sparse array based sub-terahertz imaging system for volume inspection. In Proceedings of the European Microwave Conference, Paris, France, 7–10 September 2015; pp. 438–441. [Google Scholar]
  4. Qiao, L.; Wang, Y.; Zhao, Z.; Chen, Z. Exact reconstruction for nearfield three-dimensional planar millimeter-wave holographic imaging. J. Infrared Millim. Terahertz Waves 2015, 36, 1221–1236. [Google Scholar] [CrossRef]
  5. Yurduseven, O.; Marks, D.L.; Fromenteze, T.; Gollub, J.N.; Smith, D.R. Millimeter-wave spotlight imager using dynamic holographic metasurface antennas. Opt. Express 2017, 25, 18230–18249. [Google Scholar] [CrossRef]
  6. Amineh, R.K.; Nikolova, N.K.; Ravan, M. Real-Time Three-Dimensional Imaging of Dielectric Bodies Using Microwave/Millimeter Wave Holography; John Wiley & Sons: Hoboken, NJ, USA, 2019. [Google Scholar]
  7. Tan, K.; Chen, X.D. Precise Near-Range 3-D Image Reconstruction Based on MIMO Circular Synthetic Aperture Rada. IEEE Trans. Microw. Theory Tech. 2021, 69, 2651–2661. [Google Scholar] [CrossRef]
  8. Jing, H.D.; Li, S.Y.; Cui, X.X. Near-Field Single-Frequency Millimeter-Wave 3-D Imaging via Multifocus Image Fusion. IEEE Antennas Wirel. Propag. Lett. 2021, 20, 298–302. [Google Scholar] [CrossRef]
  9. Yu, Y.; Qiao, L.; Wang, Y.; Zhao, Z. Active millimeter wave three-dimensional scan real-time imaging mechanism with a line antenna array. arXiv 2021, arXiv:2102.04878. [Google Scholar]
  10. Gao, J.; Deng, B.; Qin, Y.; Wang, H.; Li, X. An efficient algorithm for MIMO cylindrical millimeter-wave holographic 3-D imaging. IEEE Trans. Microw. Theory Tech. 2018, 66, 5065–5074. [Google Scholar] [CrossRef]
  11. Wang, Z.; Guo, Q.; Tian, X.; Chang, T.; Cui, H.-L. Near-Field 3-D Millimeter-Wave Imaging Using MIMO RMA With Range Compensation. IEEE Trans. Microw. Theory Tech. 2019, 67, 1157–1166. [Google Scholar] [CrossRef]
  12. Ghasr, M.T.; Kharkovsky, S.; Bohnert, R.; Hirst, B.; Zoughi, R. 30 GHz Linear High-Resolution and Rapid Millimeter Wave Imaging System for NDE. IEEE Trans. Antennas Propag. 2013, 61, 4733–4740. [Google Scholar] [CrossRef]
  13. Cooper, K.B.; Dengler, R.J.; Chattopadhyay, G.; Schlecht, E.; Gill, J.; Skalare, A.; Mehdi, I.; Siegel, P.H. A High-Resolution Imaging Radar at 580 GHz. IEEE Microw. Wirel. Compon. Lett. 2008, 18, 64–66. [Google Scholar] [CrossRef]
  14. Chattopadhyay, G.; Cooper, K.B. 670 GHz FMCW Radar for Imaging and Science Applications. In Proceedings of the International Conference on Electromagnetics in Advanced Applications, Verona, Italy, 11–15 September 2017; p. 506. [Google Scholar]
  15. Garcia-Jomaso, Y.A.; Hernandez-Roa, D.L. Sub-wavelength continuous THz imaging system based on interferometric detection. Opt. Express 2021, 29, 19120–19125. [Google Scholar] [CrossRef] [PubMed]
  16. Hillger, P.; Grzyb, J.; Jain, R. Terahertz Imaging and Sensing Applications with Silicon-Based Technologies. IEEE Trans. Terahertz Sci. Technol. 2019, 9, 1–19. [Google Scholar] [CrossRef]
  17. Sun, Z.; Li, C.; Gao, X.; Fang, G. Minimum-Entropy-Based Adaptive Focusing Algorithm for Image Reconstruction of Terahertz Single-Frequency Holography With Improved Depth of Focus. IEEE Trans. Geosci. Remote Sens. 2015, 53, 519–526. [Google Scholar]
  18. Wang, F.F.; Deng, B.; Yang, Q. A Fast 3D Near Range Imaging Algorithm for a Scanning Sparse MIMO Array in the Millimeter Band. Sensors 2020, 20, 4701. [Google Scholar] [CrossRef] [PubMed]
Figure 1. Schematic diagram of millimeter-wave plane scanning. Rx is the omnidirectional antenna. The transmitting antenna Tx and the receiving antenna Rx are at the same position. The vertical distance between the target plane and the scanning plane is z0.
Photonics 08 00397 g001
Figure 2. Point target holographic imaging results, (a) is the model with the spacing between two points of 12, 15, 18 and 21 mm, (b) is the hologram corresponding to each model in (a), (c) is the reconstruction imaging of point target corresponding to each model in (a). In (d) and (e), curves are drawn with a column of data of the imaging target’s longitudinal profile to observe the resolution effect of the point target at different distances.
Photonics 08 00397 g002
Figure 3. Holograms and reconstructions of the plus model. (a) (i) is the hologram when the sampling interval is 4.5 mm and the sampling points are 128. (b) (i) is the hologram when the sampling interval is 3 mm and the sampling points are 128. (c) (i) is the hologram when the sampling interval is 3 mm and the sampling points is 256. (aiicii) are the corresponding reconstructed images, and (d) (iiii) is the imaging intensity of the longitudinal profile line in the corresponding reconstructed image.
Photonics 08 00397 g003
Figure 4. Simulation results of the line-model. (a) is the line simulation diagram. The distance between the transmitting and receiving plane is 1 m. The target plane is a square the same size as the imaging plane. The sampling points are 128 × 128, the sampling interval of the antenna array, the length and width of the scanning aperture are both 384 mm, (b) is the line-pair target model and detailed dimension marking. (ce) are the holographic diffraction patterns of an extremely narrow beam, ordinary beam and ultra-wide beam, respectively, and (fh) are the corresponding reconstruction patterns.
Photonics 08 00397 g004
Figure 5. Simulation results of metal strip model. The scanning schematic diagram of receiving and transmitting antenna is shown in (a). The transmitting antenna adopts a half-wave dipole antenna with a working frequency of 94 GHz and the length of the antenna’s single arm is λ/4. The polarization mode of the antenna is Y polarization. (b,c) are hologram and reconstructed image of the metal strip when the transmitting antenna is a half-wave pole, and the sampling interval is 1.5 mm. (d,e) are hologram and reconstructed images when the transmitting antenna is a dipole, and the sampling interval is 3 mm. (f,g) are hologram and reconstructed images when the transmitting antenna is a horn antenna of 11.5° half angle and the sampling interval is 1.5 mm.
Photonics 08 00397 g005
Table 1. Plus-graphic simulation parameters.
Parameter NameParameter ValueParameter NameParameter Value
Center frequency80 GHzHorizontal bar pixels20~108
Wavelength3.75 mmHorizontal bar vertical pixel point54~74
Imaging distance3 mThe length and width of the bar264 mm × 60 mm
Pixels of the original image128 × 128Actual sampling points128 × 128
Pixel interval3 mm × 3 mmActual sampling interval4.5 mm × 4.5 mm
Publisher’s Note: MDPI stays neutral with regard to jurisdictional claims in published maps and institutional affiliations.

