Communication

Study on Aberration Correction of Adaptive Optics Based on Convolutional Neural Network

Key Laboratory of Optoelectronic Devices and Systems, Center for Biomedical Optics and Photonics (CBOP), College of Physics and Optoelectronic Engineering, Shenzhen University, Shenzhen 518060, China
*
Author to whom correspondence should be addressed.
Photonics 2021, 8(9), 377; https://doi.org/10.3390/photonics8090377
Submission received: 8 August 2021 / Revised: 3 September 2021 / Accepted: 7 September 2021 / Published: 8 September 2021
(This article belongs to the Special Issue Adaptive Optics for Biological Imaging)

Abstract

:
The existence of aberrations has always been an important limiting factor in the imaging field. Especially in optical microscopy imaging, the accumulated aberration of the optical system and the biological samples distorts the wavefront on the focal plane, thereby reducing the imaging resolution. Here, we propose an adaptive optical aberration correction method based on convolutional neural network. By establishing the relationship between the Zernike polynomial and the distorted wavefront, with the help of the fast calculation advantage of an artificial intelligence neural network, the distorted wavefront information can be output in a short time for the reconstruction of the wavefront to achieve the purpose of improving imaging resolution. Experimental results show that this method can effectively compensate the aberrations introduced by the system, agarose and HeLa cells. After correcting, the point spread function restored the doughnut-shape, and the resolution of the HeLa cell image increased about 20%.

1. Introduction

Adaptive optics (AO) was first proposed in astronomy to solve the problem of wavefront distortion caused by atmospheric turbulence in the observation of stars [1], using the wavefront corrector to compensate for the detected distortion wavefront in real time. Similarly, in optical microscopy imaging systems, signal light accumulates aberrations after passing through optical systems and biological samples, resulting in a decrease in the image resolution and signal-to-noise ratio. Therefore, adaptive optics has also been introduced into microscopy imaging technology [2] to address optical aberrations in the system and samples. According to the presence or absence of wavefront detectors, aberration correction methods are divided into two categories: aberration correction with wavefront detection and aberration correction without wavefront detection. In aberration correction with wavefront detection systems, fluorescent beads or fluorophore signals are generally used as guide stars to measure distorted wavefronts with wavefront detectors and then perform aberration compensation. In 2010, Azucena et al. used fluorescent microspheres seeded in the embryo as a guide star and corrected the aberrations measured by the Shack–Hartmann wavefront sensor [3,4]. Reinig et al. used a wavefront detector and deformable mirror to correct wavefront aberrations in mouse brains and improved the quality and signal-to-noise ratio of images [5]. Wang et al. recovered diffraction-limited imaging over large volumes (>240 mm per side) in the zebrafish brain by a descanned, laser-induced guide star and direct wavefront sensing [6]. In aberration correction without a wavefront detector system, wavefront measurement and aberration compensation are performed through iterative calculation to optimize a certain index of the image without a wavefront detector. The coherent optical adaptive technique [7], genetic algorithm [8] and hill-climbing algorithm [9] are all aberration corrected technologies without wavefront detection that correct aberrations by maximizing the image brightness and improve the signal-to-noise ratio and resolution of the images to a certain extent. Using other parameters as evaluation indicators, which is also a branch of aberration correction without wavefront detection, Débarre et al. increased the contrast and quality of images of a mouse intestine and embryo, and the process induced little photobleaching [10]. Ji et al. successfully restored the diffraction-limited resolution at a depth of 450 μm in the mouse cortex by dividing the pupil into multiple regions, calculating the wavefront slope in each region and reconstructing the wavefront [11].
Although AO with a wavefront detector has the advantages of fast speed and high accuracy, it increases the complexity of the optics system and the cost, and the method based on fluorescence guide stars involves complicated biological operations and damages the sample. AO without a wavefront detector is simple and low in cost, but its correction time is longer due to multiple iterative calculations and is prone to photobleaching, which restricts imaging in fluorescent samples to a certain extent. However, machine learning algorithms have solved these problems. As early as 1997, Montera et al. used a neural network to predict the measurement slope of wavefront sensors and compared them with the results of classic statistical-based methods to prove the advantages of neural networks [12]. Rivenson et al. used a single image taken with a standard optical microscope without the need for extra hardware or user-specified postprocessing, taking on average ~0.69 s to output an improved image by deep learning [13]. Turpin et al. used a neural network to establish the functional relationship between transmitted and reflected speckle patterns to correct the wavefront [14]. Khonina S.N. et al. studied a new type of wavefront aberration sensor, and at the same time used a neural network to recognition the type of wavefront aberrations [15,16]. Similarly, based on Zernike polynomial reconstruction, deep learning has improved the resolution and intensity of images in aberration correction of two-dimensional scattering samples [17] and three-dimensional beads [18]. Although the above methods have advantages in speed and accuracy, the methods [19,20,21,22] based on convolutional neural networks have also encountered difficulties in practicality. Some methods [19,20] used simulated synthetic data to train the network and directly output the aberration functions for aberration compensation while ignoring the collection of ground truth data from the microscope. Others [21,22] focused on the analysis of the data and the accuracy of the results and lacked the application of biological samples in microscopy imaging. Therefore, the practical applicability of these methods in microscopy experiments is still doubtful.
In this paper, we collect data from experiments for convolutional neural network training and compensate for the aberrations in microscopy. It is worth noting that in the shape-based evaluation strategy, the doughnut-shaped beam is not only more effective than complex patterns but also more sensitive to aberrations than simple Gaussian beams, so it is used to carry aberration information. Furthermore, in stimulated emission depletion (STED) super-resolution microscopy, the doughnut-shaped depletion beam is used to superimpose on the excitation beam to achieve super-resolution imaging, and the quality of the doughnut-shaped beam has a direct impact on the resolution of STED [23,24,25,26]. Therefore, correcting the aberrations in the donut-shaped beam can help improve the resolution of STED super-resolution imaging. Our self-created convolutional neural network can automatically extract the characteristic information of the input distorted spot image and establish a connection with the aberration fitted by the Zernike polynomial. After training, the Zernike polynomial coefficients can be output in a very short time for the reconstruction of the wavefront phase to compensate for aberrations. Based on this method, we corrected the system aberration, agarose aberration and HeLa cell aberration to verify the correction effect and practicability of this method in the experiments.

2. Methods

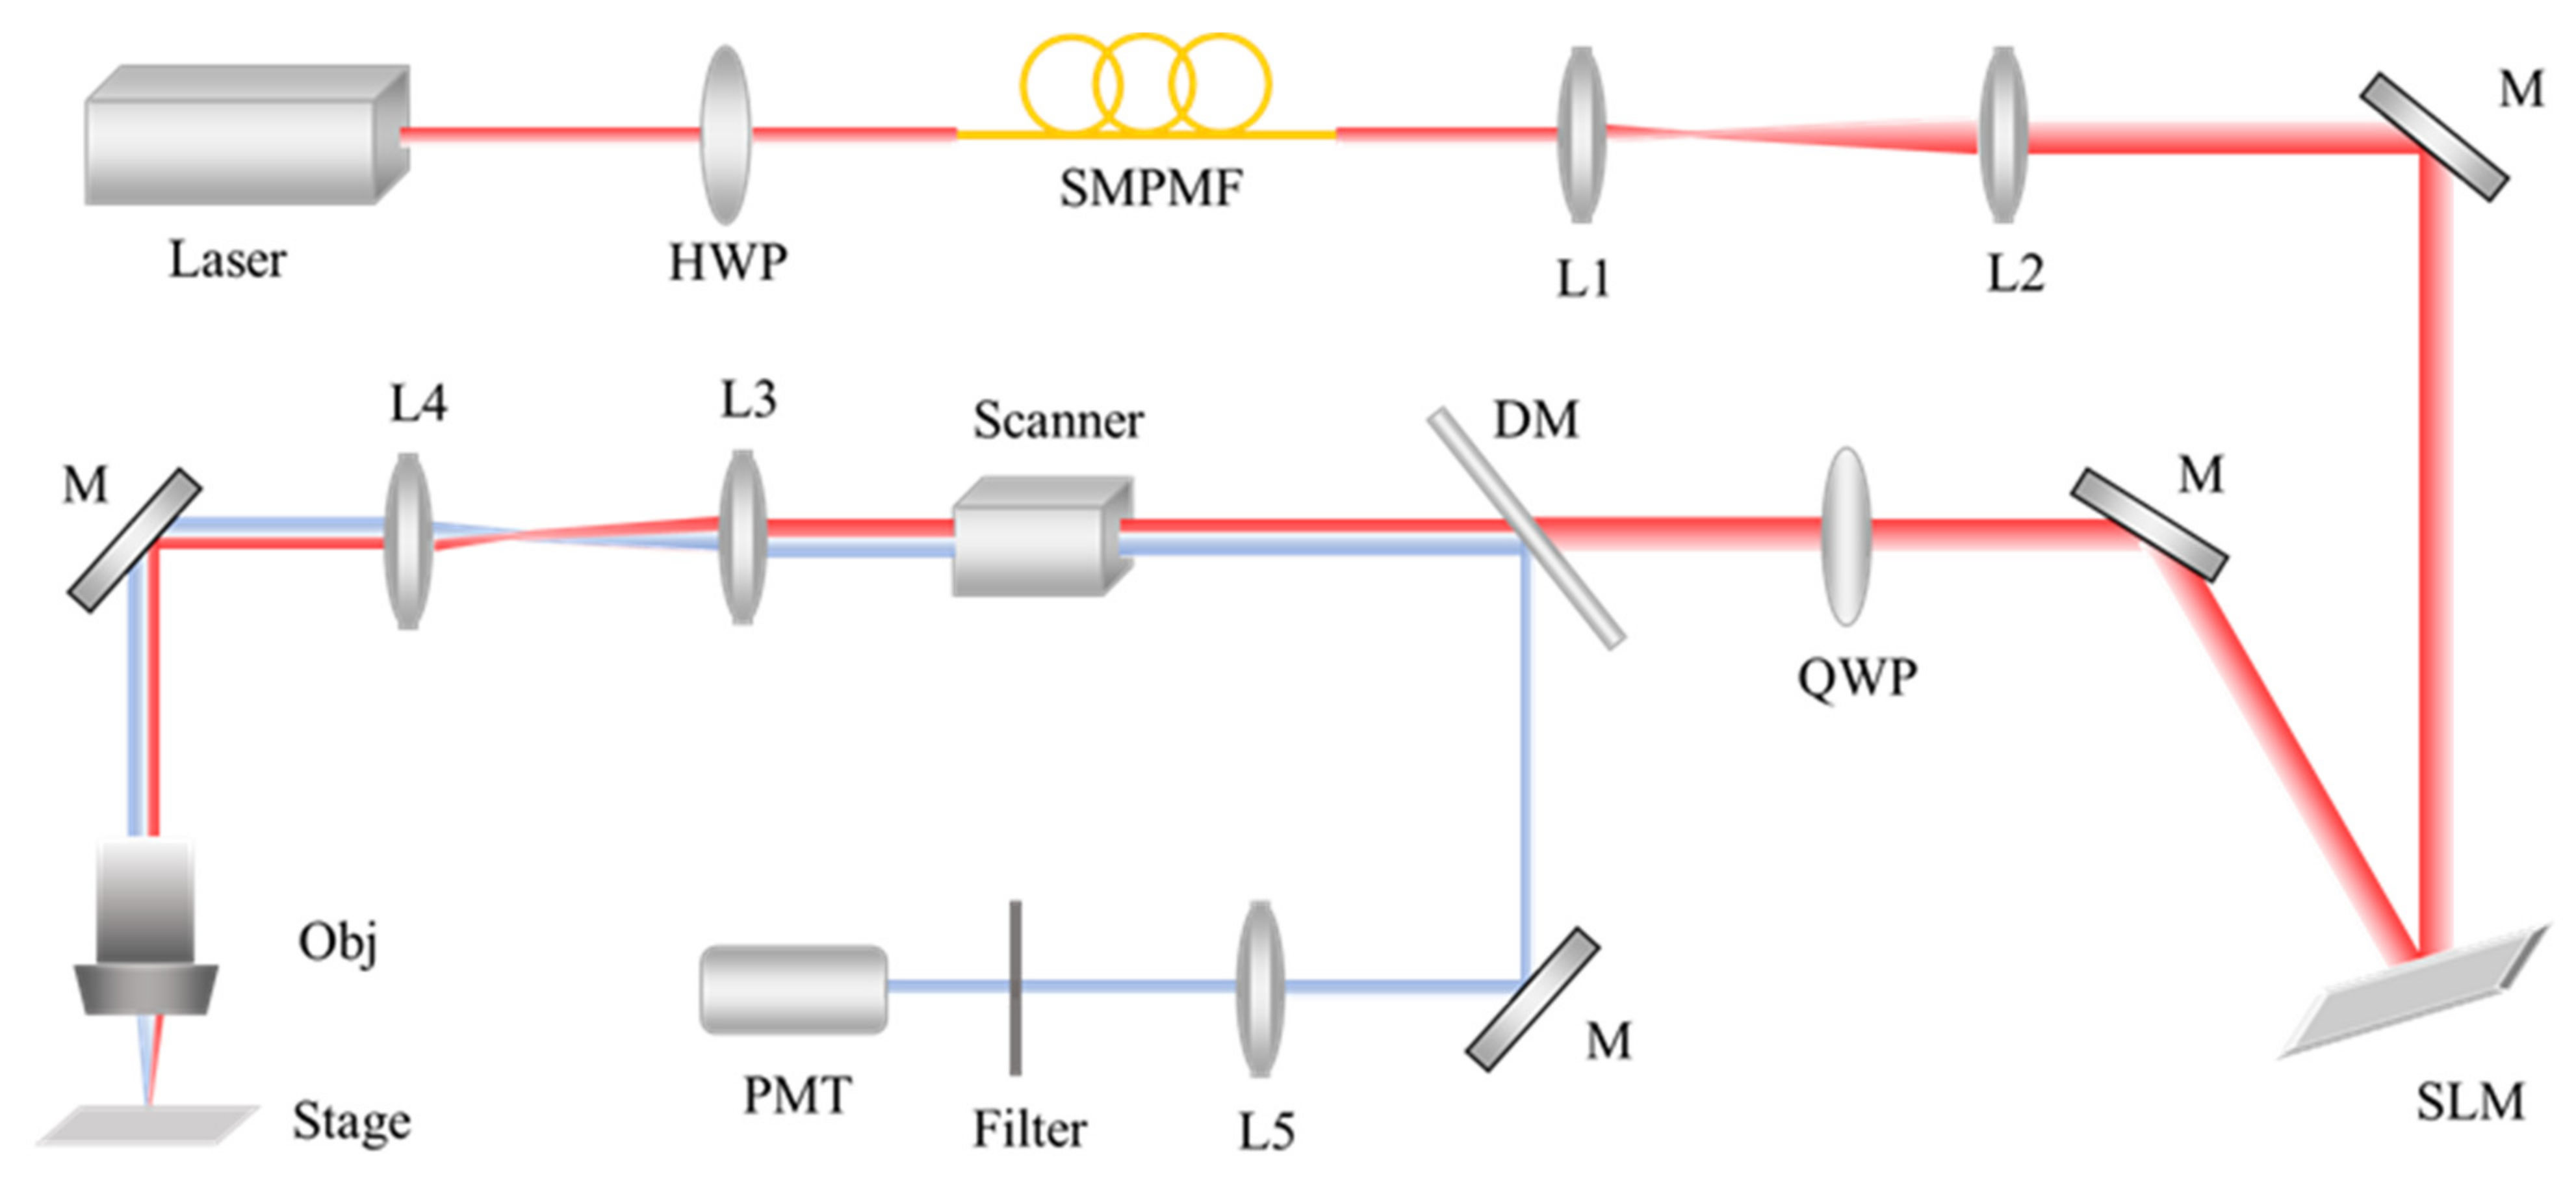
2.1. Experimental Setup

Figure 1 shows the experimental setup for adaptive optics aberration compensation based on a convolutional neural network, in which a mode-locked Ti–sapphire laser (Chameleon Ultra II, Coherent, Santa Clara, CA, USA) with a wavelength of 780 nm was used as the light source. A half-wave plate (Thorlabs, Newton, NJ, USA) is used to control the polarization direction of the laser and to adjust the power of light before entering the fiber. The single mode polarization maintaining fiber (DH-FP780-FC-1) is used to eliminate the influence of stray light and shape the beam spot. Then, the light is expanded by a pair of lenses to fit the spatial light modulator (SLM, PLUTO-NIR-011, HOLOEYE Photonics AG, Berlin, Germany), which has two functions: one is used to generate doughnut-shape beam, and the other is to load the compensation aberration calculated by the “neural network” algorithm to realize the aberration correction in the system. The collimated beam is modulated by the SLM with a spiral phase, which converts the Gaussian beam to a doughnut-shaped beam. After a reflector mirror, a quarter wave plate (Thorlabs, Newton, NJ, USA) converted the doughnut-shaped beam to right-hand circular polarization for better light field distribution. A pair of galvanometer scanning mirrors (6210H, Cambridge Technology Inc. Cambridge, MA, USA) was controlled by ScanImage (HHMI/Janelia Farm, Ashburn, VA, USA) and used to scan the beam across the sample, and an oil-immersion objective (HCX PL APO, 100×/1.40–0.70 OIL, Leica, Wetzlar, Germany) was used to focus the laser beams on the sample and collect the fluorescence signal. The fluorescence signal was separated from the excitation light path by a dichroic mirror (DM, transmission: 720–1200 nm, reflection: 350–720 nm) and then focused into a photomultiplier tube (PMT, H7422–40, Hamamatsu Photonics, Japan) by a lens (L5: 125 mm). A filter between the PMT and the lens is used to remove the residual excitation light and stray light. A charge-coupled device (CCD) is used to collect data for constructing images. The photograph of the experimental setup please see the Figure S1.
Aberration, that is, wavefront phase distortion, can be expressed as a set of phase matrices, which are generally decomposed into a set of linear combinations of orthogonal polynomials. Each term in the polynomials is called a wavefront mode in wavefront analysis. The Zernike polynomials are the most widely used aberration description basis functions in the field of adaptive optics. Zernike polynomials are composed of an infinite number of polynomials, which are continuous and orthogonal within the unit circle. In the aberration simulation experiment, it can be expressed by the terms of the Zernike polynomial or any combination of any terms. The Zernike polynomial polar coordinate form is often used to fit wavefront aberrations:
φ ρ , θ = i = 1 n a i Z i ρ , θ
Here, φ ρ , θ is the phase distribution on the pupil plane, n is the highest order of the Zernike polynomial (up to 15 terms in our experiment), Z i and a i represent the i-th polynomial and its coefficients, respectively, ρ is the polar radius, and θ is the polar angle. The first three modes of aberrations are often ignored. Thus, the first of the Zernike polynomials is the piston phase, which represents the overall displacement of the wavefront and does not affect the imaging quality; the second and third represent the tip and tilt of the wavefront in the x and y directions, respectively, and these can be estimated rapidly using centroiding algorithms or other registration [27].

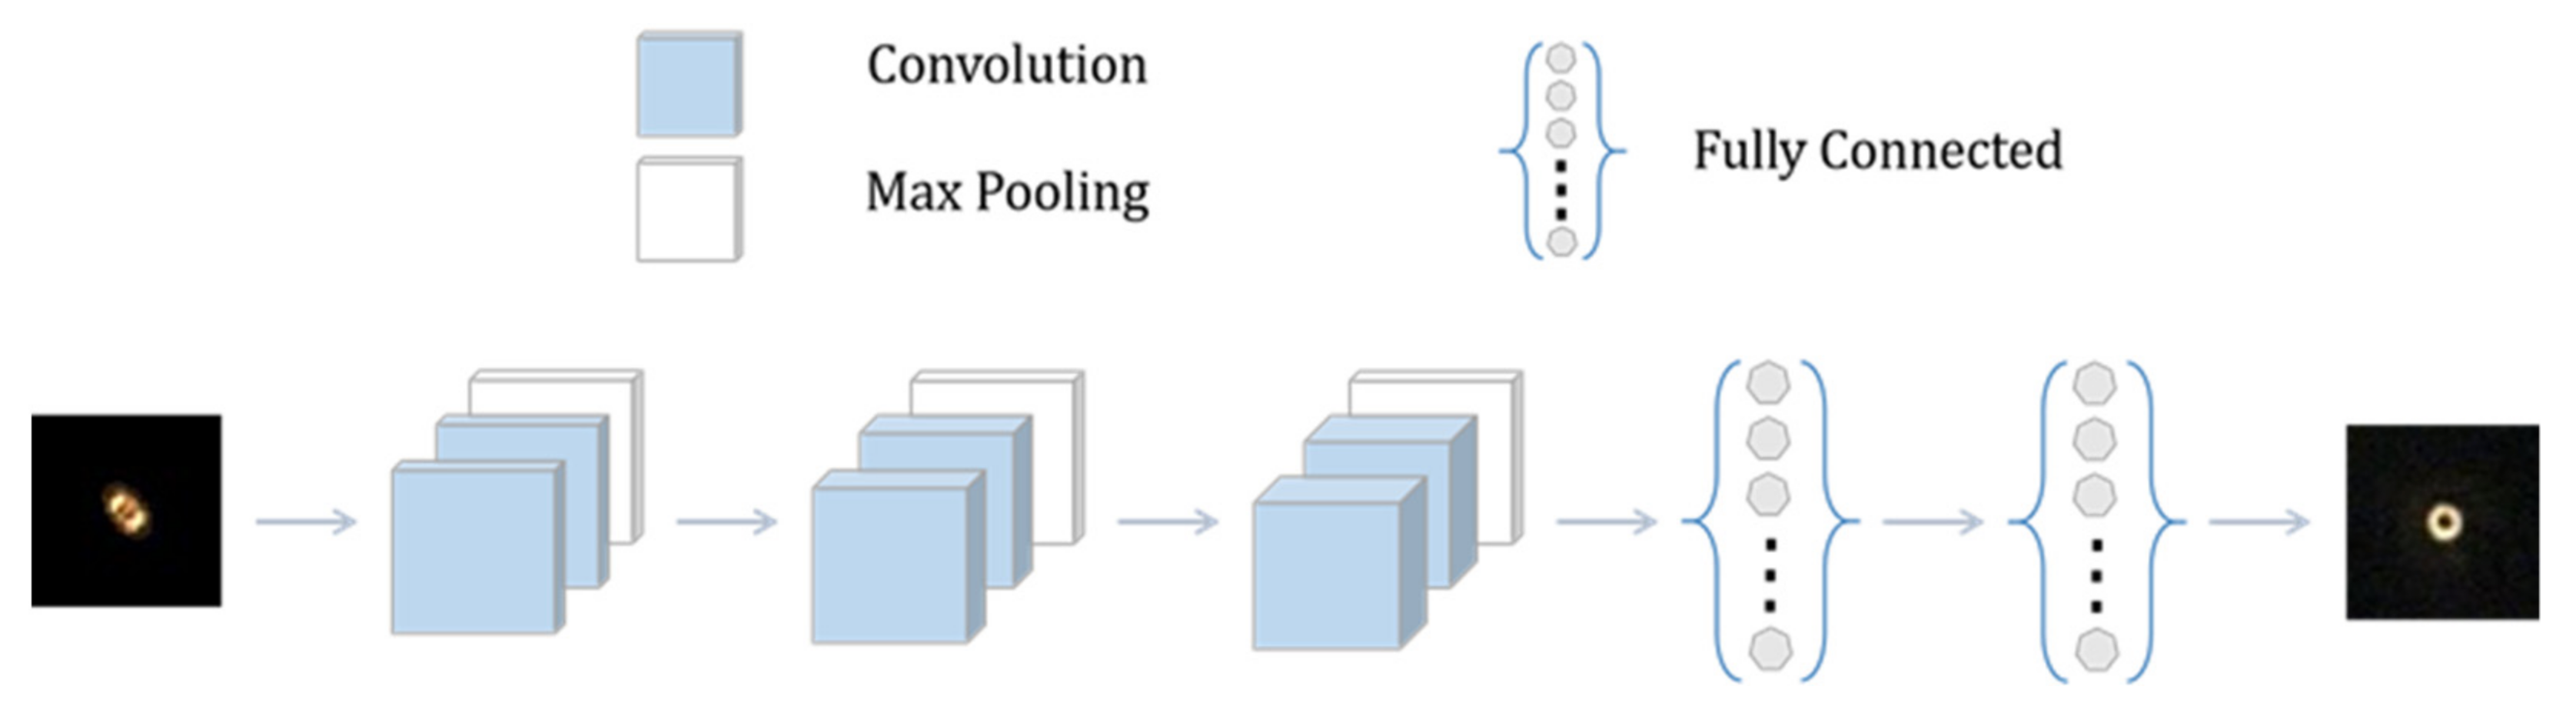
2.2. Convolutional Neural Network Structure

The structure of the convolutional neural network (CNN) is shown in Figure 2. The CNN starts with 3 parts, and each part contains two convolutional layers and a max pooling layer. The convolutional filters have 32, 64 and 128 kernels for each part, and the size of all convolution kernels is 3 × 3, which is used to extract image features. Each of the convolutional layers links an activation function named the rectified linear unit (ReLU), which causes the sparsity of the network and reduces the possibility of overfitting. The essence of pooling is sampling, which can be regarded as a special convolution process, and max pooling with a size of 2 × 2 can remove the maximum value in pooling size, which can effectively reduce the image feature parameters and perform dimensionality reduction. The dropout operation randomly discards some neurons with a probability of 0.3 to avoid overfitting. The last two fully connected layers can integrate the extracted features, run nonlinear transformations and output the predicted wavefront distortion Zernike coefficients for reconstruction.
We randomly generated 12,000 phase patterns with aberrations fitted by the Zernike polynomials and loaded them on the SLM and used the CCD camera to collect the images and establish the data set. The convolutional neural network was implemented in Keras with the TensorFlow backend and trained on a standard computer equipped with a Nvidia GeForce GTX 1070 GPU. After the training is completed, it takes approximately 33 ms to input a distortion PSF and then output the Zernike coefficients to reconstruct the phase patterns. If a better configuration is used, it takes less time. Furthermore, it should be noted that it is not necessary to retrain unless fundamental parameters of the experimental setup are changed, such as the numerical aperture or a major realignment. The images used for machine learning are all raw images without preprocessing. To improve the display effect of the images, the greyscale of all the images in the paper have been adjusted in the same way by Imaged J.

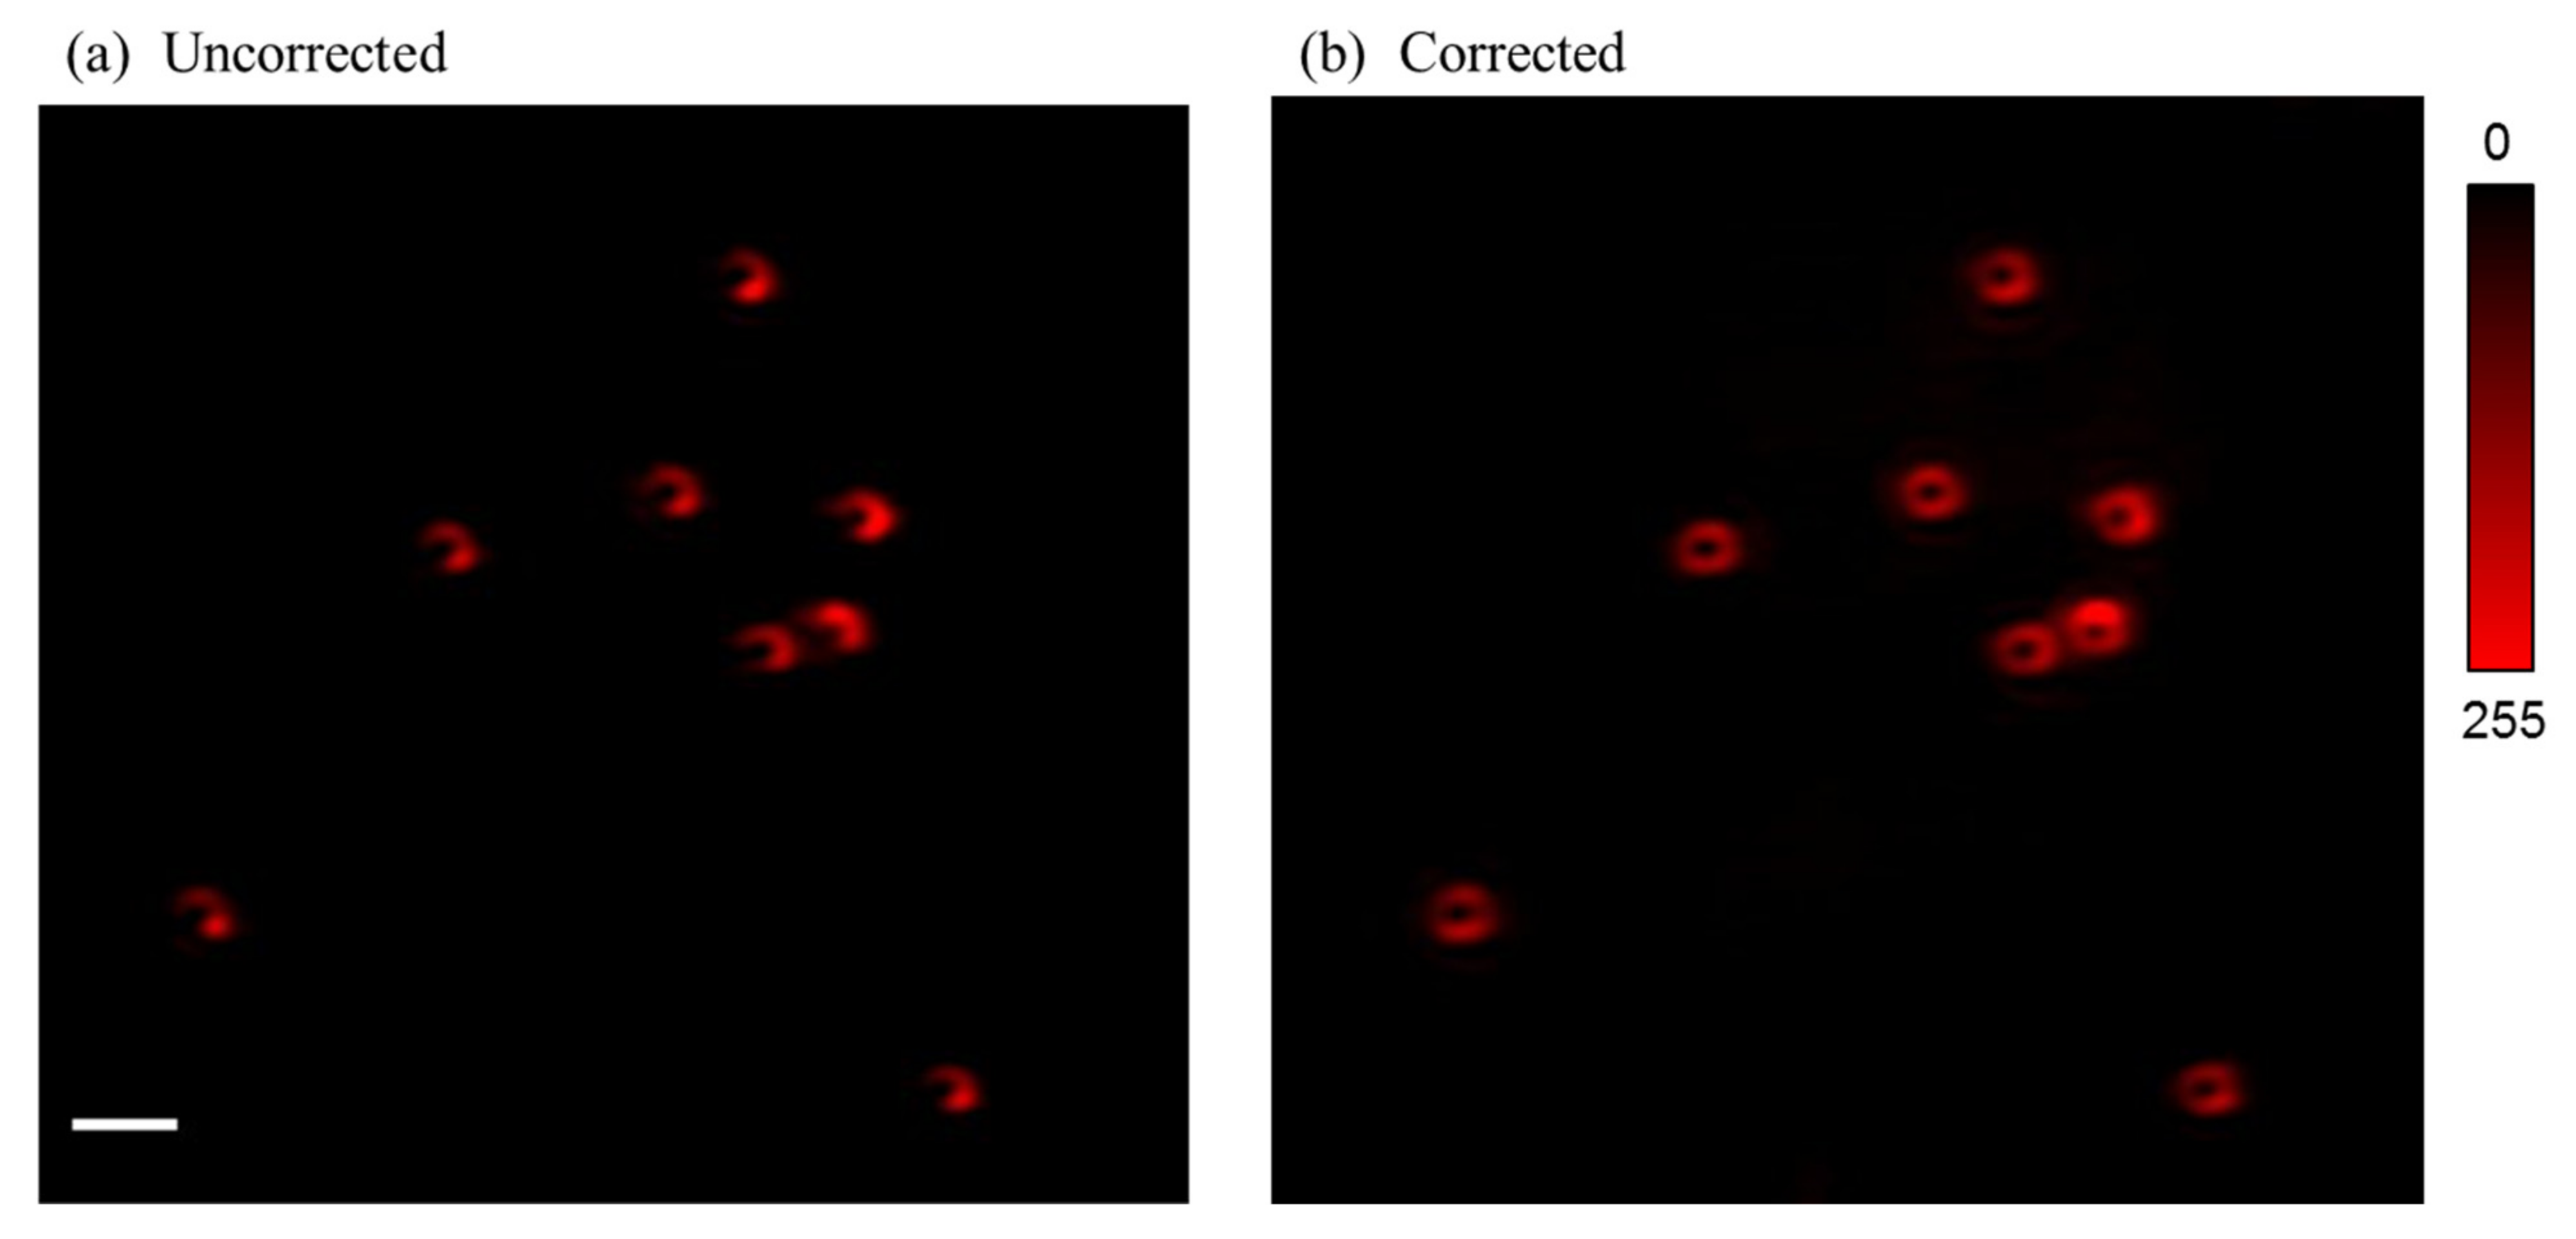
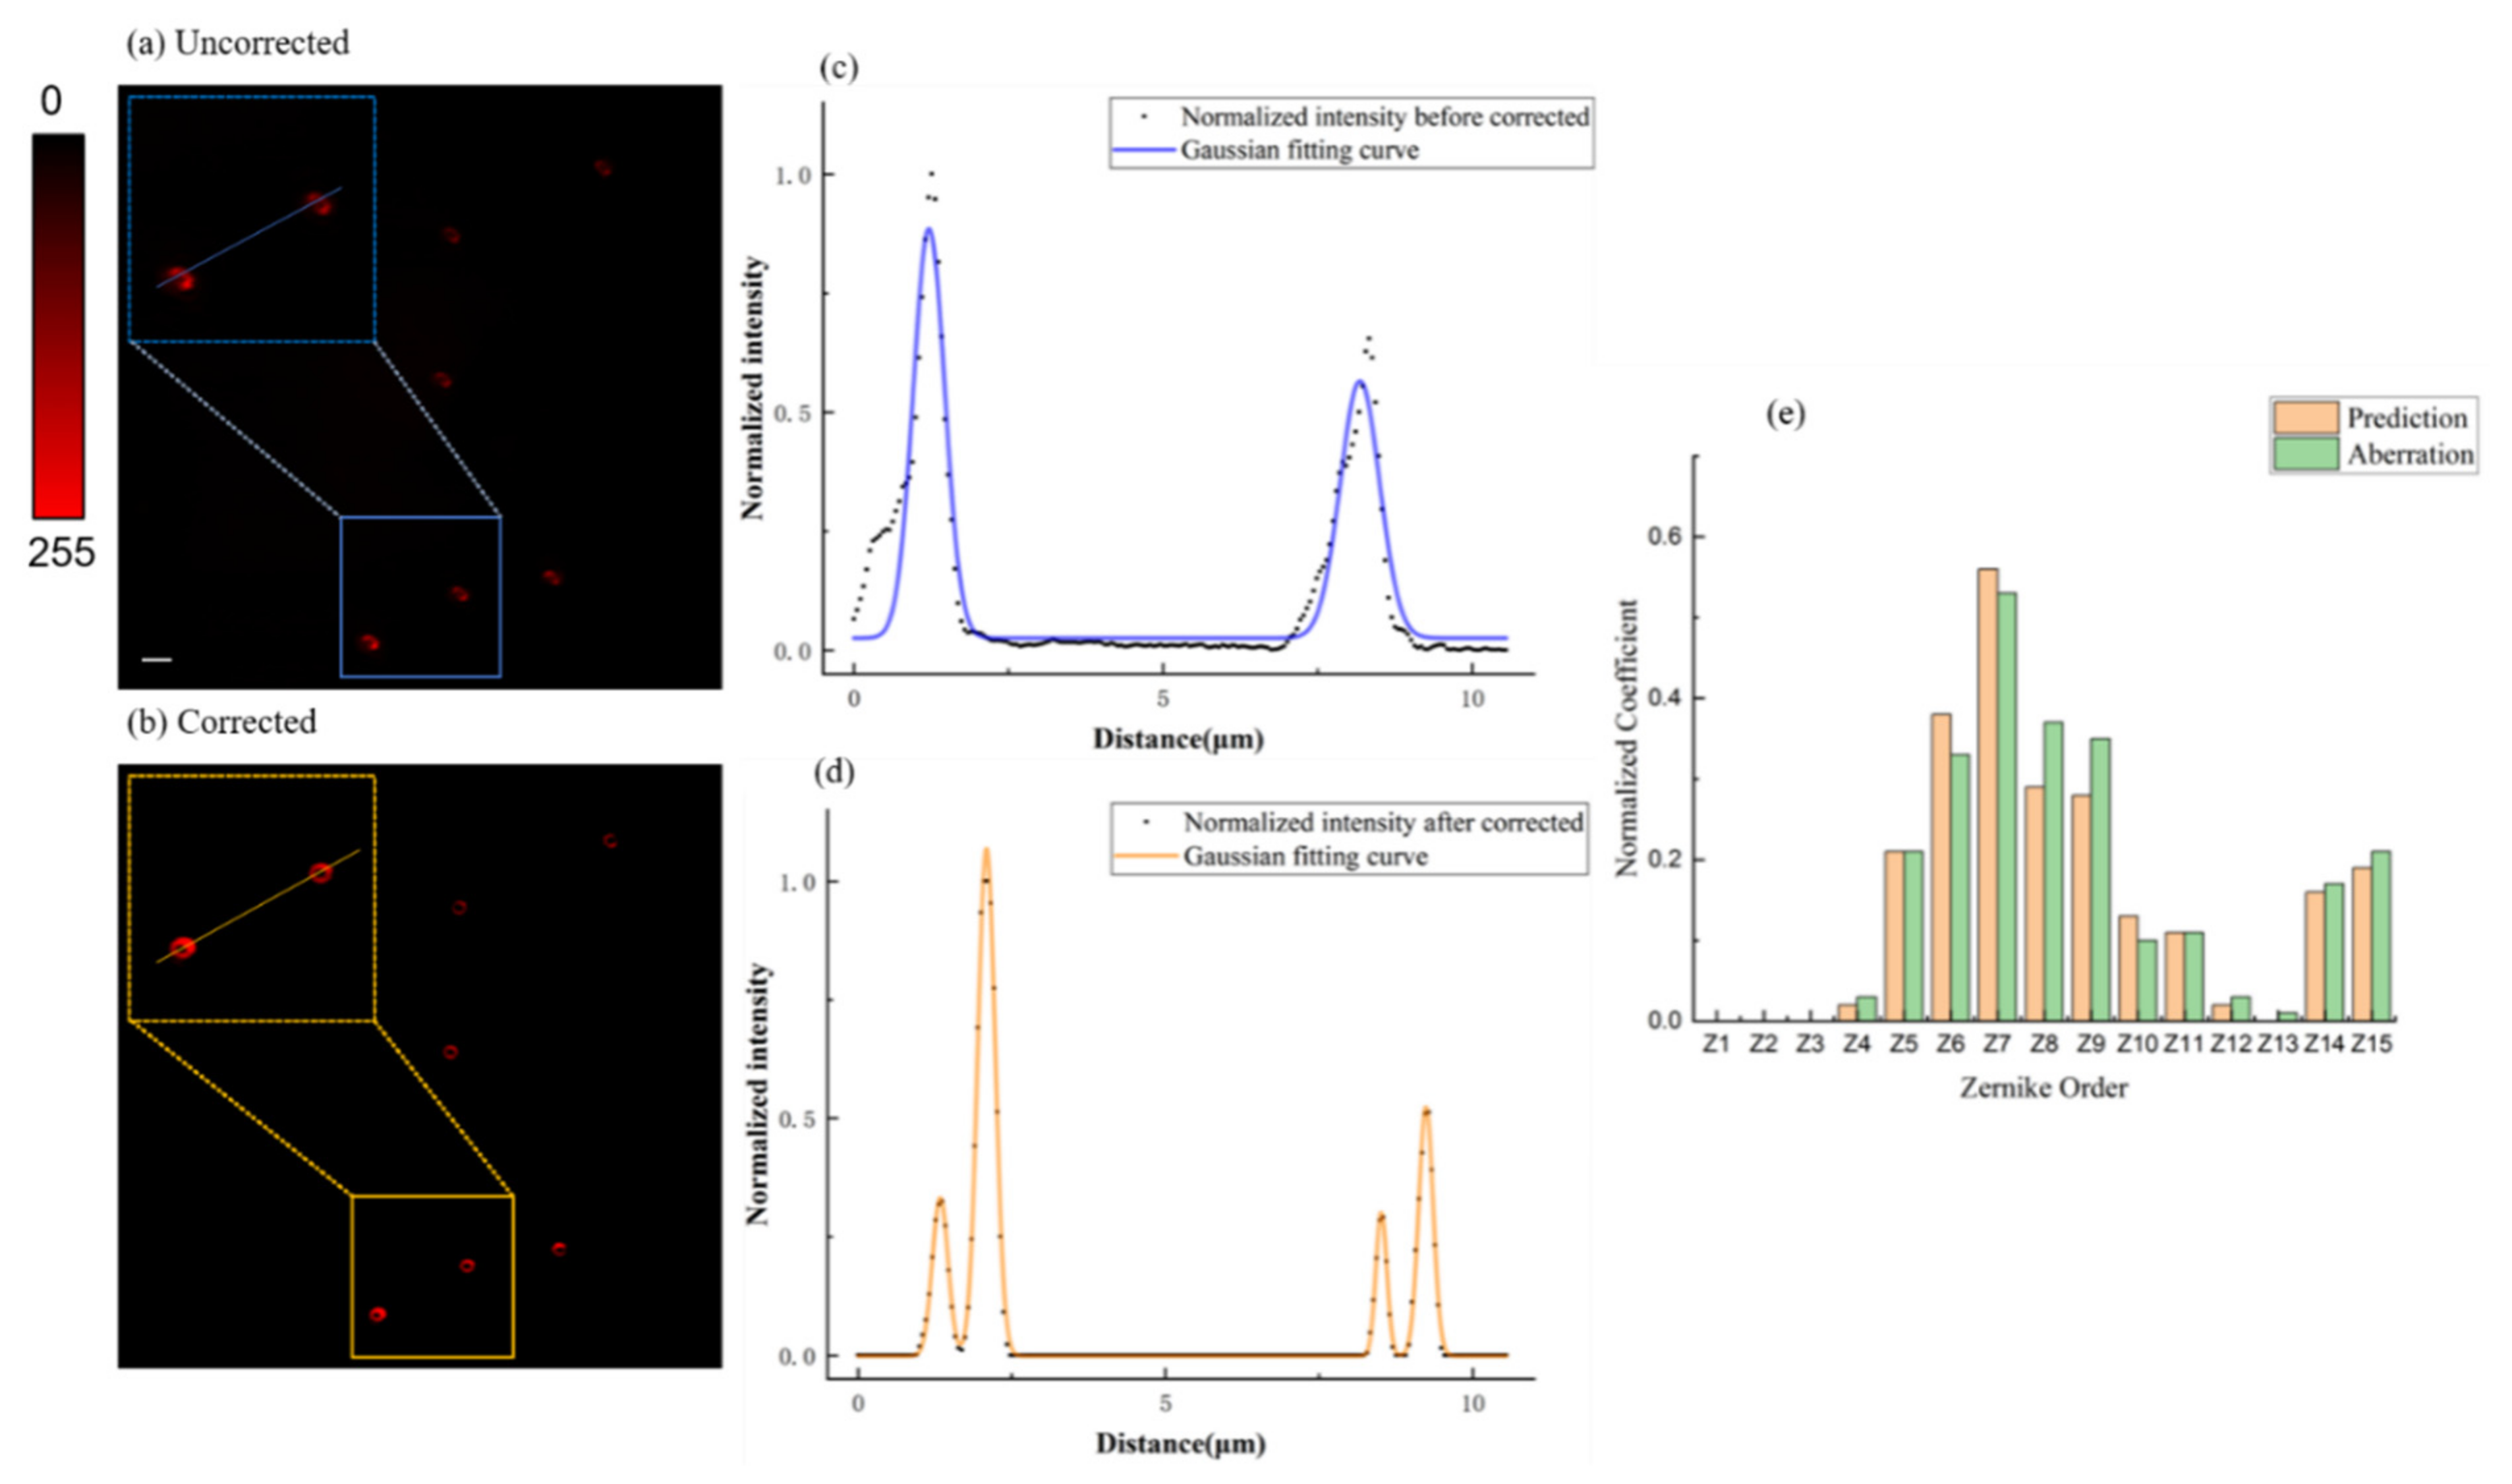
3. Results and Discussion

Due to the aberrations of the optical system and the sample, the doughnut-shaped beam cannot be focused on in the ideal state. First, we used aberration correction of adaptive optics based on a convolutional neural network to correct the aberrations introduced by the system. To verify the correction effect, we made gold nanoparticles as a sample. The steps were as follows: drop an appropriate amount of gold nanoparticle solution (200 nm in diameter, Fisher Scientific, Vantaa, Finland) to a coverslip, and encapsulate the coverslip on a microscope slide with mounting medium (97% 2,2′-thiodiethanol, TDE, Fisher Scientific, Vantaa, Finland). We compared the backscattering intensity PSFs of the gold nanoparticles before and after the aberration correction. It can be clearly found that the symmetry of the doughnut-shaped beam intensity distribution was improved after the aberration correction (Figure 3).
Then, we used random phase patterns with aberrations to examine the effectiveness of the convolutional neural network. Figure 4a,b shows the comparison before and after correction. Even if random and complicated aberrations have been added, our method still demonstrates its effectiveness. Moreover, both the image symmetry and strength in the corrected PSF had a significant improvement compared to those in the uncorrected PSF, which can be observed from the normalized intensity profiles along the lines in Figure 4c,d. The initial and predicted wavefront Zernike coefficients of the first 15 orders (ignoring the first to third) are shown in Figure 4e. We find that the predicted result is extremely close to the actual value, which further shows that our algorithm can effectively perform aberration correction.
Furthermore, we prepared an agarose sample for the simulation of biological tissues. The sample was prepared according to published protocols [8]. We imaged the 3D PSFs of 200 nm gold nanoparticles before and after the correction. As shown in Figure 5, the PSF improved well and were restored to a doughnut-shape after the correction. The intensity distribution symmetry of the doughnut-shaped beam was improved in the y–z plane after performing the correction.
To further demonstrate the capability of machine learning in correcting aberrations in biological samples, we used a method to observe the structures of microtubules in HeLa cells labeled with Alexa Fluor 488 (Abcam, ab150077). The scattering signal of the gold nanoparticles in HeLa cells was used as a guide for the convolutional neural network. Figure 6a,b shows images of tubulin structures in the HeLa cells labeled with Alexa Fluor 488. It can be clearly found that the resolution of the image has been restored after the aberration correction. By fitting the intensity profiles along the white arrows in the magnified images with a Gaussian function, two full-widths at half-maximum (FWHMs) can be obtained, 534 nm in the uncorrected image and 397 nm in the corrected image, and the resolution increased about 20%. Similarly, the intensity of the image is also improved after aberration correction, as shown in Figure 6c,d. It should be noted that due to the difference in the internal structure of biological cells, the refractive index distribution is uneven, and the aberrations in different regions are also different. To further improve the calibration effect, the sample can be calibrated by region. The more regions the sample is divided into, the better the calibration effect is. However, because the aberration of our sample itself is limited, only one calibration point can meet the demand.

4. Conclusions

Here, a distorted wavefront compensation approach based on a sensorless wavefront and a convolutional neural network is proposed. Because the doughnut-shaped beam carries aberration information more easily than other beams, the convolutional neural network can extract aberration information carried by the distorted doughnut-shaped beam automatically and establish a connection with the aberration fitted by the Zernike polynomial. The well-trained convolutional neural network can calculate the aberration information in a very short time and output the Zernike polynomial for wavefront reconstruction. We have corrected the aberrations induced by the system, agarose and HeLa cells through experiments. The results show that our method can effectively restore the shape of the doughnut shape and restore the original resolution of the image. However, there are still some questions, such as when facing the situation of a low signal-to-noise ratio, the convolutional neural network that relies on the shape strategy may appear to have reduced accuracy or failure when extracting aberration information. Using other image processing methods to increase the signal-to-noise ratio may improve the correction effect of our method. For biological imaging, the aberrations of different regions are different due to the difference in refractive index, and the method of using multiple regions and different guide stars to compensate aberrations and merge images can achieve a certain improvement in resolution and signal-to-noise ratio. Therefore, our method may have an important application prospect in STED super-resolution imaging.

Supplementary Materials

The following are available online at https://www.mdpi.com/article/10.3390/photonics8090377/s1. The supplementary material for the detailed description of the experimental setup, Figure S1: The photograph of the experimental setup.

Author Contributions

Conceptualization, W.Y.; software, L.W.; validation, Y.H.; investigation, J.L.; resources, W.Y.; writing—original draft preparation, J.L.; writing—review and editing, W.Y. and J.L.; visualization, Y.G.; supervision, Z.Y.; project administration, J.Q. All authors have read and agreed to the published version of the manuscript.

Funding

This work has been partially supported by the National Basic Research Program of China (2017YFA0700500); National Natural Science Foundation of China (61620106016, 61835009, 62005171, 61975127); Guangdong Natural Science Foundation (2019A1515110380, 2020A1515010679); Shenzhen International Cooperation Project (GJHZ20180928161811821); Shenzhen Basic Research Project (JCYJ20180305125304883).

Institutional Review Board Statement

Not applicable.

Informed Consent Statement

Not applicable.

Data Availability Statement

The data presented in this study are available on request from the corresponding author.

Conflicts of Interest

The authors declare no conflict of interest.

References

  1. Babcock, H.W. Adaptive optics revisited. Science 1990, 249, 253–257. [Google Scholar] [CrossRef]
  2. Booth, M.J. Adaptive optics in microscopy. Philos. Trans. R. Soc. A Math. Phys. Eng. Sci. 2007, 365, 2829–2843. [Google Scholar] [CrossRef] [PubMed]
  3. Azucena, O.; Crest, J.; Cao, J.; Sullivan, W.; Kner, P.; Gavel, D.; Dillon, D.; Olivier, S.; Kubby, J. Wavefront aberration measurements and corrections through thick tissue using fluorescent microsphere reference beacons. Opt. Express 2010, 18, 17521–17532. [Google Scholar] [CrossRef] [PubMed] [Green Version]
  4. Tao, X.; Norton, A.; Kissel, M.; Azucena, O.; Kubby, J. Adaptive optics two photon microscopy with direct wavefront sensing using autofluorescent guide-stars[C]//MEMS Adaptive Optics VIII. Int. Soc. Opt. Photonics 2014, 8978, 89780D. [Google Scholar]
  5. Reinig, M.R.; Novack, S.W.; Tao, X.; Ermini, F.; Bentolila, L.A.; Roberts, D.G.; MacKenzie-Graham, A.; Godshalk, S.E.; Raven, M.A.; Kubby, J. Adaptive optics microscopy enhances image quality in deep layers of CLARITY processed brains of YFP-H mice[C]//Clinical and Translational Neurophotonics; Neural Imaging and Sensing; and Optogenetics and Optical Manipulation. Int. Soc. Opt. Photonics 2016, 9690, 969008. [Google Scholar]
  6. Wang, K.; Milkie, D.E.; Saxena, A.; Engerer, P.; Misgeld, T.; Bronner, M.E.; Mumm, J.; Betzig, E. Rapid adaptive optical recovery of optimal resolution over large volumes. Nat. Methods 2014, 11, 625–628. [Google Scholar] [CrossRef] [Green Version]
  7. Yan, W.; Yang, Y.; Tan, Y.; Chen, X.; Li, Y.; Qu, J.; Ye, T. Coherent optical adaptive technique improves the spatial resolution of STED microscopy in thick samples. Photonics Res. 2017, 5, 176–181. [Google Scholar] [CrossRef] [Green Version]
  8. Wang, L.; Yan, W.; Li, R.; Weng, X.; Zhang, J.; Yang, Z.; Liu, L.; Ye, T.; Qu, J. Aberration correction for improving the image quality in STED microscopy using the genetic algorithm. Nanophotonics 2018, 7, 1971–1980. [Google Scholar] [CrossRef]
  9. Marsh, P.N.; Burns, D.; Girkin, J.M. Practical implementation of adaptive optics in multiphoton microscopy. Opt. Express 2003, 11, 1123–1130. [Google Scholar] [CrossRef]
  10. Débarre, D.; Botcherby, E.J.; Watanabe, T.; Srinivas, S.; Booth, M.J.; Wilson, T. Image-based adaptive optics for two-photon microscopy. Opt. Lett. 2009, 34, 2495–2497. [Google Scholar] [CrossRef] [Green Version]
  11. Ji, N.; Sato, T.R.; Betzig, E. Characterization and adaptive optical correction of aberrations during in vivo imaging in the mouse cortex. Proc. Natl. Acad. Sci. USA 2012, 109, 22–27. [Google Scholar] [CrossRef] [Green Version]
  12. Montera, D.A.; Welsh, B.M.; Roggemann, M.C.; Ruck, D.W. Prediction of wavefront sensor slope measurements with artificial neural networks. Appl. Opt. 1997, 36, 675–681. [Google Scholar] [CrossRef]
  13. Rivenson, Y.; Göröcs, Z.; Günaydin, H.; Zhang, Y.; Wang, H.; Ozcan, A. Deep learning microscopy. Optica 2017, 4, 1437–1443. [Google Scholar] [CrossRef] [Green Version]
  14. Turpin, A.; Vishniakou, I.; Seelig, J.D. Light scattering control in transmission and reflection with neural networks. Opt. Express 2018, 26, 30911–30929. [Google Scholar] [CrossRef]
  15. Rodin, I.A.; Khonina, S.N.; Serafimovich, P.G.; Popov, S.B. Recognition of wavefront aberrations types corresponding to single Zernike functions from the pattern of the point spread function in the focal plane using neural networks. Comput. Opt. 2020, 44, 923–930. [Google Scholar] [CrossRef]
  16. Khonina, S.N.; Karpeev, S.V.; Porfirev, A.P. Wavefront aberration sensor based on a multichannel difractive optical element. Sensors 2020, 20, 3850. [Google Scholar] [CrossRef]
  17. Vishniakou, I.; Seelig, J.D. Wavefront correction for adaptive optics with reflected light and deep neural networks. Opt. Express 2020, 28, 15459–15471. [Google Scholar] [CrossRef]
  18. Saha, D.; Schmidt, U.; Zhang, Q.; Barbotin, A.; Hu, Q.; Ji, N.; Booth, M.J.; Weigert, M.; Myers, E.W. Practical sensorless aberration estimation for 3D microscopy with deep learning. Opt. Express 2020, 28, 29044–29053. [Google Scholar] [CrossRef]
  19. Cumming, B.P.; Gu, M. Direct determination of aberration functions in microscopy by an artificial neural network. Opt. Express 2020, 28, 14511–14521. [Google Scholar] [CrossRef]
  20. Möckl, L.; Petrov, P.N.; Moerner, W.E. Accurate phase retrieval of complex 3D point spread functions with deep residual neural networks. Appl. Phys. Lett. 2019, 115, 251106. [Google Scholar] [CrossRef]
  21. Xin, Q.; Ju, G.; Zhang, C.; Xu, S. Object-independent image-based wavefront sensing approach using phase diversity images and deep learning. Opt. Express 2019, 27, 26102–26119. [Google Scholar] [CrossRef] [PubMed]
  22. Sinha, A.; Lee, J.; Li, S.; Barbastathis, G. Lensless computational imaging through deep learning. Optica 2017, 4, 1117–1125. [Google Scholar] [CrossRef] [Green Version]
  23. Jia-Lin, W.; Wei, Y.; Jia, Z.; Lu-Wei, W.; Zhi-Gang, Y.; Jun-Le, Q. New advances in the research of stimulated emission depletion super-resolution microscopy. Acta Phys. Sin. 2020, 69, 10. [Google Scholar]
  24. Wang, L.W.; Chen, Y.; Yan, W.; Weng, X.Y.; Yang, Z.G.; Ye, T.; Qu, J.L. Increasing fluorescence lifetime for resolution improvement in stimulated emission depletion nanoscopy. J. Biophotonics 2019, 12, e201800315. [Google Scholar] [CrossRef] [PubMed]
  25. Wang, J.; Wang, L.; Zhang, J.; Yang, Z.; Yan, W.; Qu, J. Improving the image quality in STED nanoscopy using frequency spectrum modulation. J. Biophotonics 2021, 14, e202000402. [Google Scholar] [CrossRef] [PubMed]
  26. Wang, J.; Zhang, J.; Wang, L.; Gao, X.; Shao, Y.; Liu, L.; Yang, Z.; Yan, W.; Qu, J. Dual-color STED super-resolution microscope using a single laser source. J. Biophotonics 2020, 13, e202000057. [Google Scholar] [CrossRef] [PubMed]
  27. Delabie, T.; De Schutter, J.; Vandenbussche, B. An Accurate and Efficient Gaussian Fit Centroiding Algorithm for Star Trackers. J. Astronaut. Sci. 2014, 61, 60–84. [Google Scholar] [CrossRef]
Figure 1. The schematic diagram of system light path. HWP, half-wave plate; SMPMF, single-mode polarization maintaining fiber; M, mirror; SLM, spatial light modulator; QWP, quarter-wave plate; DM, dichroic mirror; Obj, objective lens; Stage, motorized precision translation stage; PMT, photomultiplier tube; L1-L5, lenses. Please see the supporting information for the photograph of the experimental setup.
Photonics 08 00377 g001
Figure 2. Structure of convolutional neural network. The convolutional filter size is 3 × 3, and the filters have 32, 64 and 128 kernels. The max pooling size is 2 × 2, and the fully connected layer outputs 12 Zernike coefficients. The Adam algorithm is adopted to optimize the CNN with learning rate of 0.001.
Photonics 08 00377 g002
Figure 3. Correcting the aberration introduced by the system. Comparison of gold nanoparticle scattering PSF before (a) and after (b) the aberration correction illuminated by a doughnut-shaped beam. The scale bar is 2 μm.
Photonics 08 00377 g003
Figure 4. Scattering images of 200 nm diameter gold nanoparticles. The wavefront distortion introduced by random phase patterns. (a,b) PSF distribution with aberrations before and after the correction. (c,d) Normalized intensity profiles along the lines in (a,b). (e) Comparison of normalized coefficients of Zernike order between actual aberrations and predictions. The scale bar is 2 μm.
Photonics 08 00377 g004
Figure 5. Three-dimensional PSFs of 200 nm gold nanoparticles before and after the correction. (a) Uncorrected PSFs; (b) corrected PSFs. (c,d) Normalized intensity profiles along the arrow. The scale bar in the x–y plane is 500 nm and in the y–z plane is 1 μm.
Photonics 08 00377 g005
Figure 6. Correcting the biological aberration of HeLa cells. (a,b) Images of the tubulin structures in a HeLa cell labeled with Alexa Fluor 488 before and after correction. (c,d) Fluorescence intensity profiles marked by white arrows in (a,b). In addition, the scale bar is 2 μm.
Photonics 08 00377 g006
Publisher’s Note: MDPI stays neutral with regard to jurisdictional claims in published maps and institutional affiliations.

