1. Introduction
The fiber Fabry–Perot interferometer (FPI) has been widely used in many fields due to its stable interference fringes, easy demodulation, and compact structure [
1,
2,
3,
4]. In recent decades, fiber optic FPI sensors have been studied for their excellent performance benefits, such as low cost, fast response, anti-electromagnetic interference ability, and durability in harsh environments [
5,
6,
7,
8]. The structure of the fiber optic FPI sensor can be grouped into two categories: (i) an intrinsic Fabry–Perot interferometer (IFPI), where the light is reflected by the reflector inside the fiber, a typical example is how the IFPI can be formed by a pair of Bragg gratings separated by a small gap [
9], and (ii) an extrinsic Fabry–Perot interferometer (EFPI), where the light exits the fiber and propagates inside the external cavity. Such an external cavity can be made of polymer or an air cavity encapsulated by a diaphragm [
10,
11]. The development of science and technology puts forward higher requirements for the performance of sensors, such as the need for a high resolution for biomedical applications [
12]. Improving sensitivity is an effective way to realize high-resolution sensors [
13]. Therefore, it is of great significance to study how to improve the sensitivity of optical fiber sensors.
The Vernier effect was applied to Vernier calipers for the first time. By comparing the difference in the smallest resolution of two calipers, the detection resolution was improved. Recently, the Vernier effect has also been applied to the field of fiber optic sensors. Regarding the interference signal as the Vernier scale, the Vernier effect relies on the overlap between two interference signals with similar frequencies. The envelope of overlapping signals exhibits the ability to amplify wavelength shifts compared to an individual sensing interferometer.
In 2014, Zhang et al. proposed the application of the Vernier effect to optical fiber sensors for the first time. In this application, two hollow photonic crystal fiber (PCF) columns were used for the sensing FPI and the reference FPI, respectively, and were connected in series on the single-mode fiber (SMF). The sensitivity of the sensor structure to the axial strain and the magnetic field was amplified simultaneously [
14]. Since then, optical fiber sensors based on the Vernier effect have aroused widespread interest. Optical fiber sensors based on the Vernier effect can be categorized into two approaches: (i) Compact structures, which consists of two interferometers connected in series that interact with each other; however, the structure is relatively compact, such as that of cascaded FPIs [
15,
16,
17,
18,
19], Mach–Zehnder interferometers (MZI) [
20], Sagnac loops [
21], and hybrid cascaded configurations [
22]; and (ii) separated structures, which consists of two independent interferometers that are physically separated and do not interfere with each other, for example, the parallel combination of two interferometers of the same type [
23,
24,
25] or a mixed configuration of different types of interferometers [
26,
27]. The introduction of the optical Vernier effect using FPIs is quite popular, corresponding to almost half of the publications on this topic [
28].
In 2015, Quan et al. proposed an ultra-high sensitivity open-cavity FPI gas refractive index sensor based on PCF and the Vernier effect and using a compact probe configuration with a refractive index sensitivity of 30899 nm/RIU [
15]. However, a sensor probe with similar compact structure cannot completely ignore the reference interferometer in the application. A series configuration with physical separation seems to be a good solution to this problem [
13]. In 2021, Yi, G et al. reported a high-temperature sensor based on the parallel double FPI structure. This separate configuration prevents the reference interferometer from being affected by temperature [
29]. However, there are still some problems to be solved in the application of the Vernier effect. In practical applications, a large amplification factor causes the envelope to exceed the bandwidth of the device, which may become undetectable. Deng and D. N. Wang proposed the precise control the magnification by controlling the length of two FPIs so that the envelope is in the range of the light source [
30]. A. D. Gomes et al. innovatively proposed the concept of the harmonic Vernier effect, which further improved the sensitivity by tracking the nodes of the inner envelope [
18,
31]. In another report by the author, the use of a modal interference combined with extreme optical Vernier effects to produce a measurable envelope while maintaining extremely high magnification is proposed. This method demonstrated the ultra-sensitive fiber refraction with a sensitivity of 500 µm/RIU, and the calculated magnification was higher than 850 times that of normal magnification [
32]. Recently, people have also begun to consider signal processing methods to solve the envelope problem. Zuo et al. proposed the use of Hilbert–Huang transform to extract the square envelope of the Vernier for order calibration so that the measurement range is increased several times [
33]. However, the sensitivity of the sensor and the measurement range are always in competition. For the application of the Vernier effect, we still need to consider the sensitivity of a single sensor to design the magnification and measurement range.
In this paper, a cascaded interferometer structure of a tunable air cavity and a SiO2 cavity made only with commercial welding technology was proposed. First, the characteristic spectrum of the Vernier effect was obtained by simulating a theoretical model of the proposed device. The accordion phenomenon was then found by employing dynamics simulations to calculate the length of the air cavity. When the length of the air cavity gradually increases, the envelope of the reflection spectrum expands and contracts regularly. After that, we studied the relationship between the optical path length (OPL) ratio of two interferometers and the accordion phenomenon, and it is found that the Vernier effect can be stably generated in the ratio range of 0.67 to 1.5. Moreover, considering the limitations of the experimental equipment, a design method to increase the magnification factor of the Vernier effect as much as possible within the bandwidth of the experimental equipment was proposed and verified by the experiments. At the same time, the relationship between the sensor sensitivity and the measurement range can be flexibly adjusted. Our research results provide a reference for the practical application of the Vernier effect.
2. Device Fabrication and Theoretical Principle
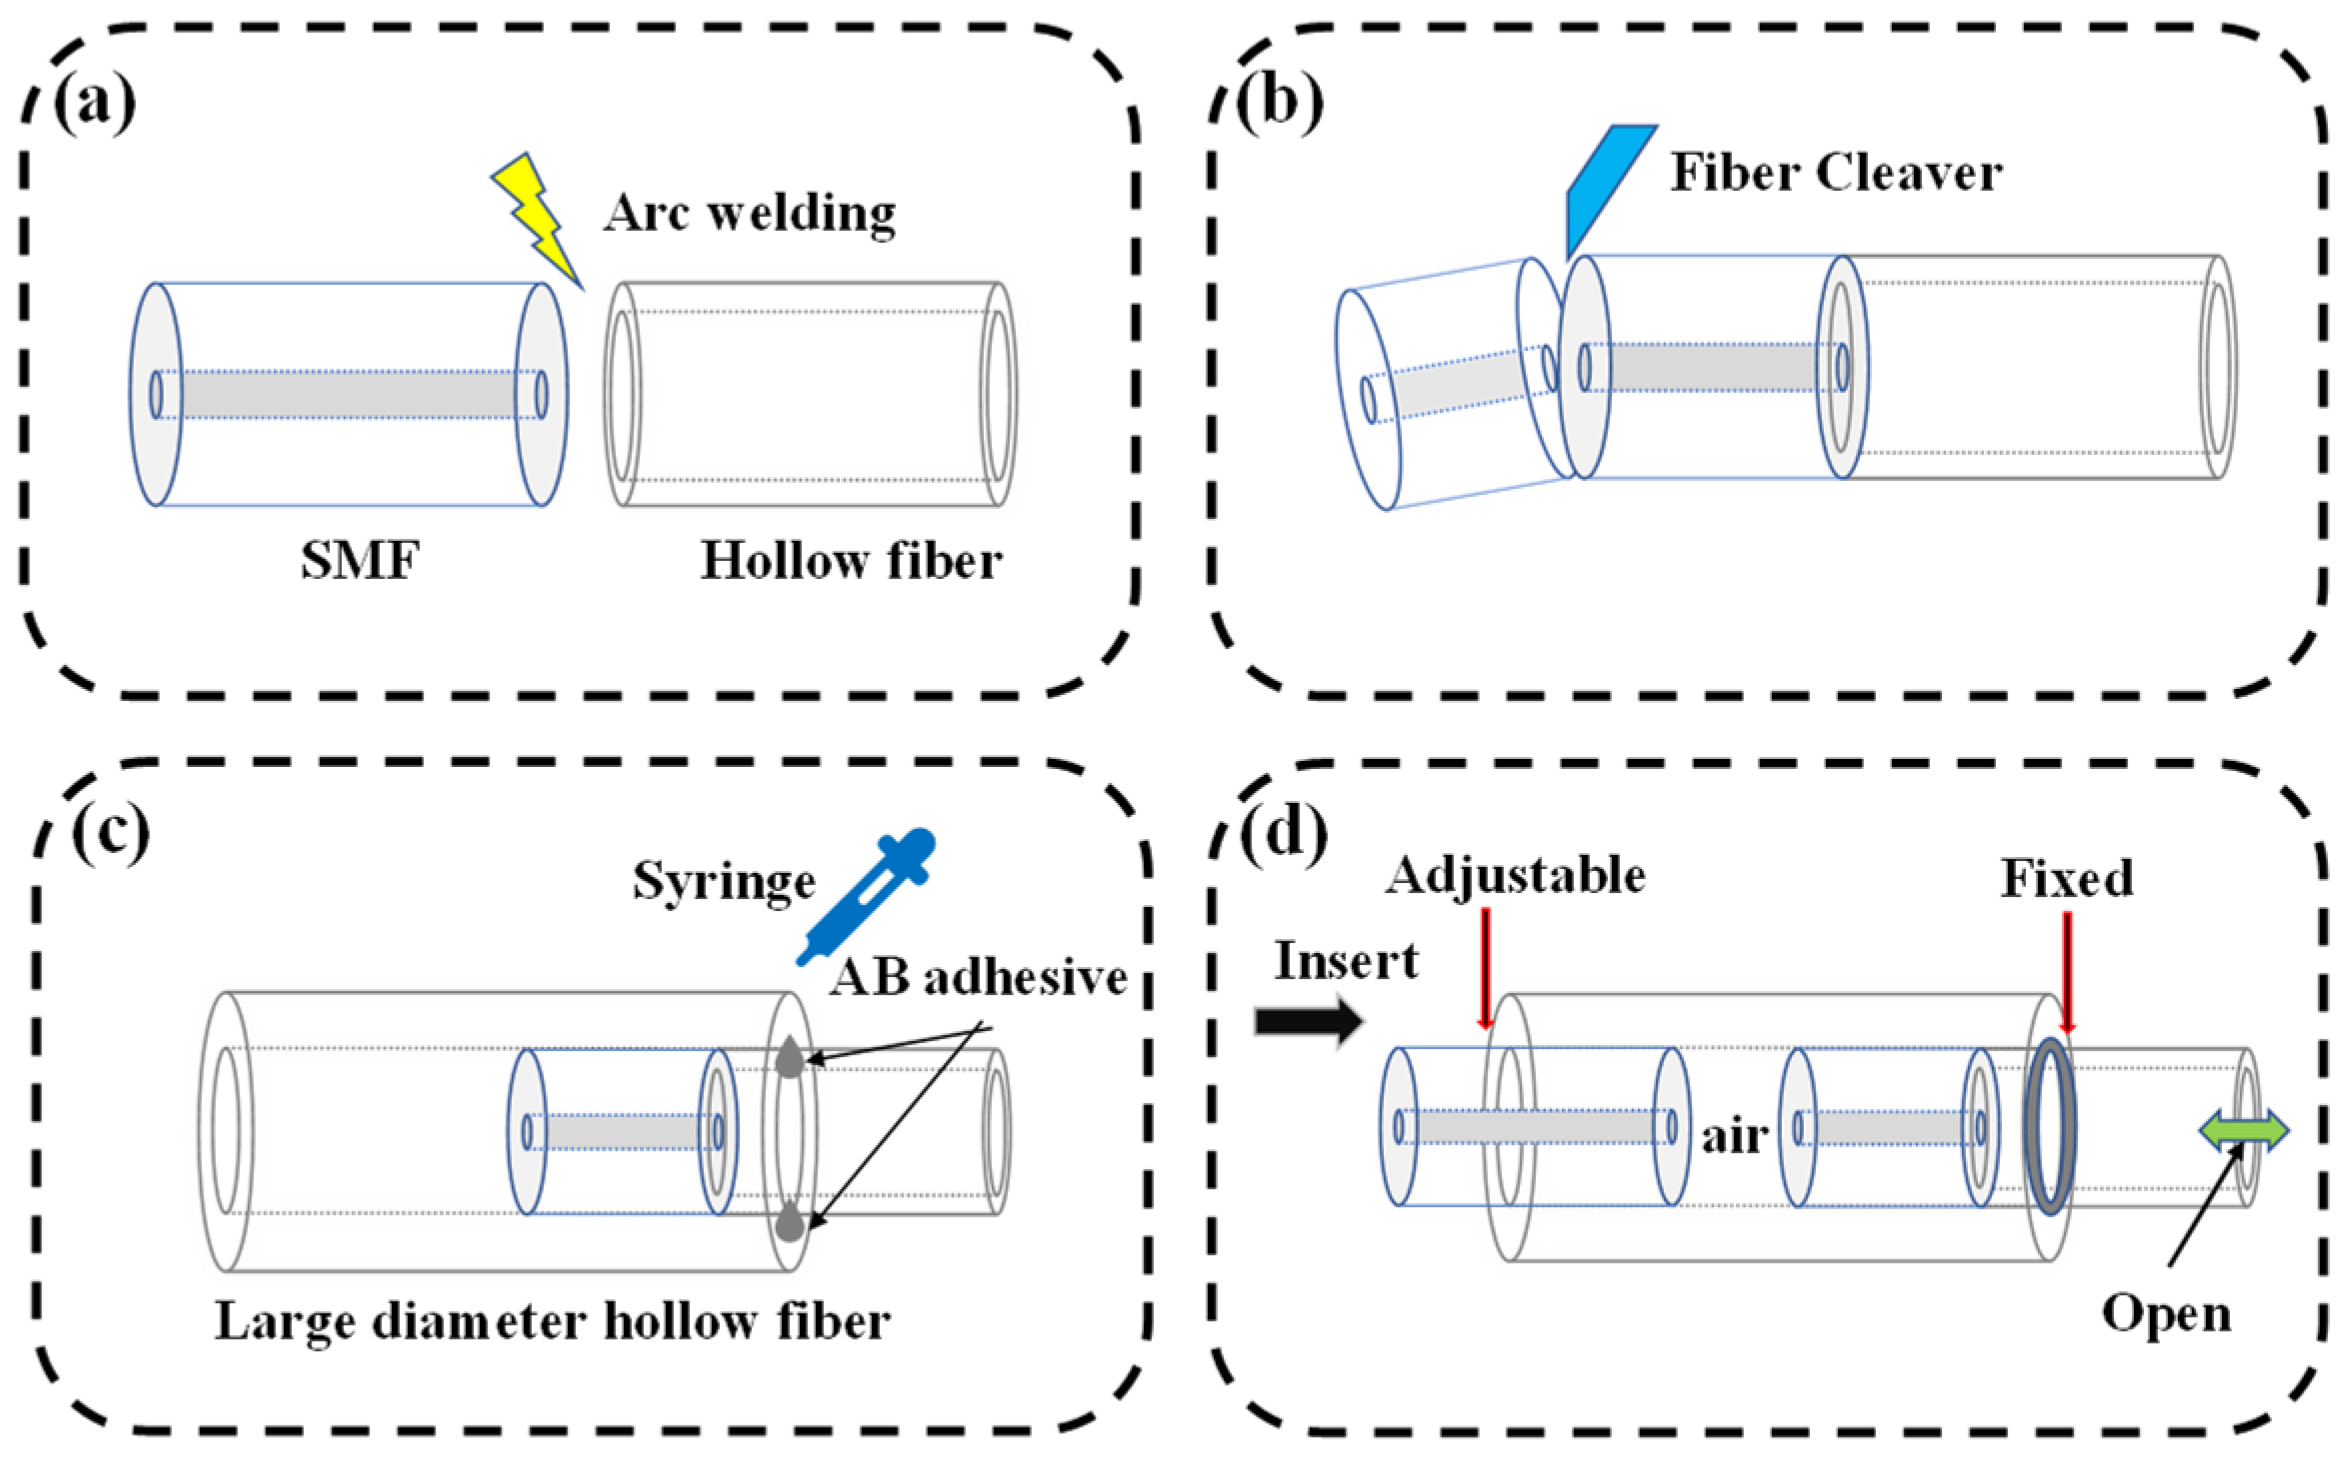
The fabrication process diagram of the proposed interferometer device is illustrated in
Figure 1. First, a section of SMF (Corning SMF28e+) and hollow fiber (HF, TSP075150, with a core diameter of 75 μm and a cladding diameter of 150 μm) was cleaved, and a commercial welding machine (Fujikura, Tokyo, Japan, 80C+) was then used to splice them together, as shown in
Figure 1a. In order to obtain a silica microcavity, as seen in
Figure 1b, the SMF was cleaved to obtain a SiO
2 cavity with a length of 200 μm. Second, as shown in
Figure 1c, a large diameter hollow fiber (LDHF, TSP0150375, with a core of 150 μm and a cladding diameter of 375 μm) with a length of 5 cm was prepared, the SiO
2 cavity was completely inserted into it with part of the HF outside, and the place of contact between the LDHF and the HF was fixed with AB adhesive. The excess HF at the end was removed after the AB adhesive solidified. Finally, the optical guide fiber was inserted from the other end of the LDHF without being fixed with adhesive, and an air cavity could be formed between the optical guide fiber and the end face of the SiO
2 cavity, as shown in
Figure 1d.
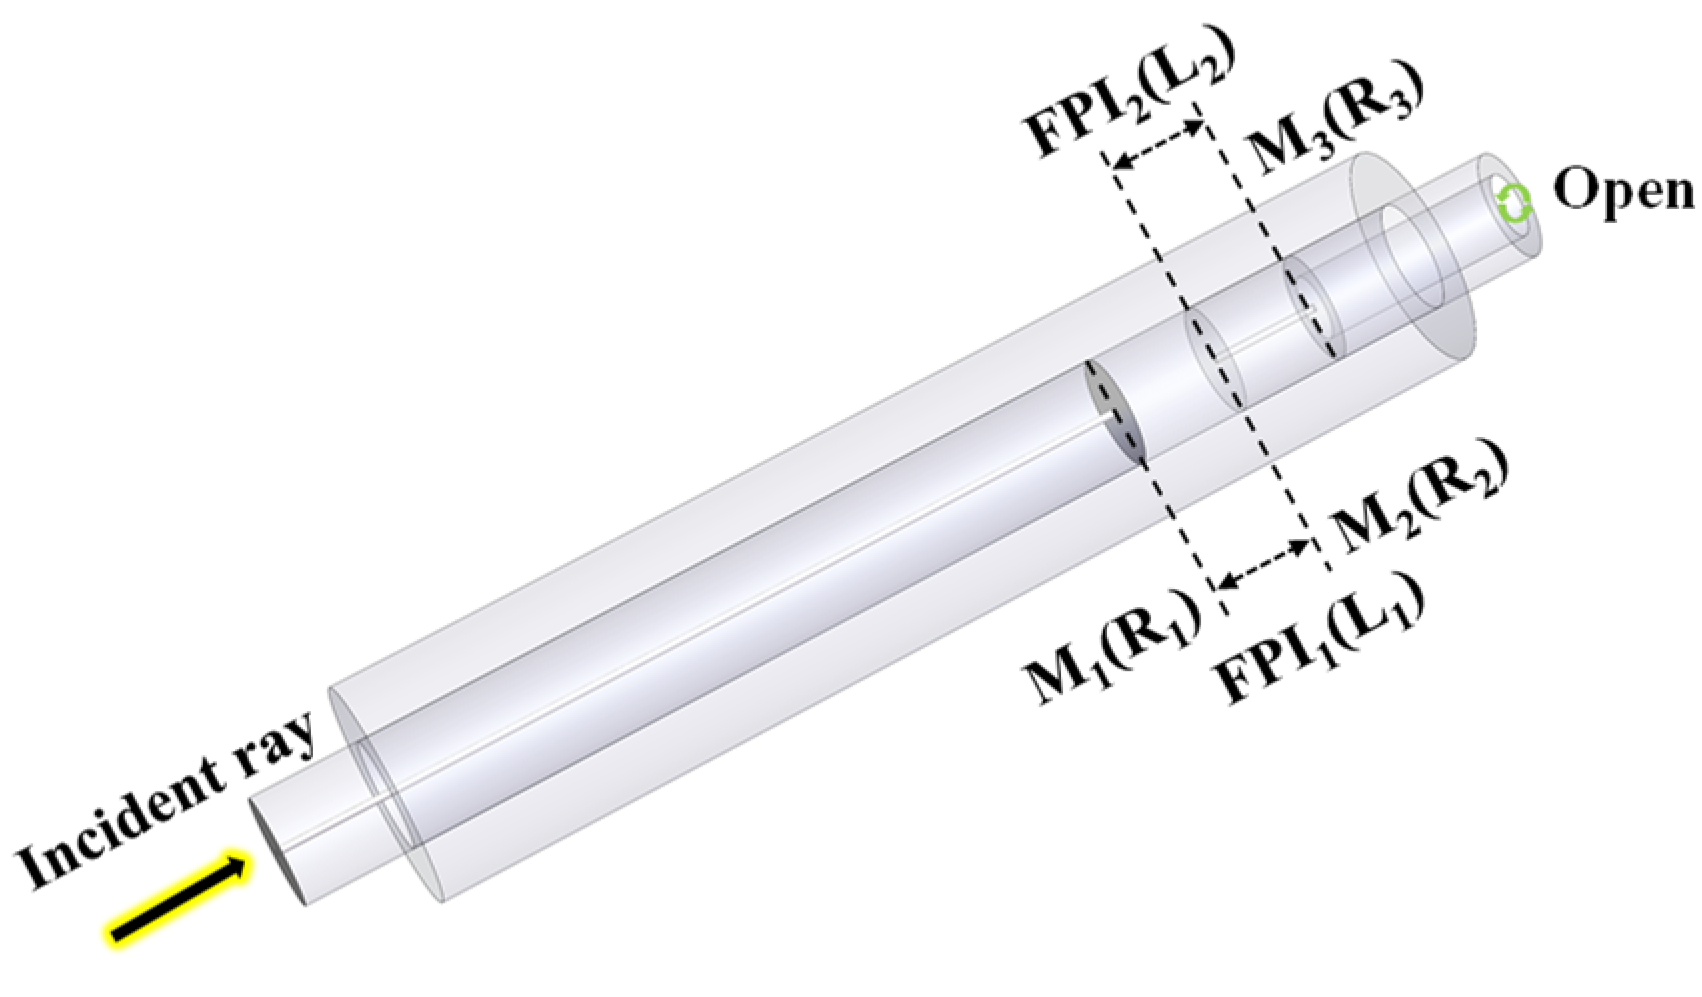
To analyze the principle of cascaded interferometer, we first defined the interface of the structure. The schematic diagram of the device is shown in
Figure 2. The Fresnel reflection was generated at the surface (M
1, M
2 and M
3) marked in
Figure 2, which is formed by the refractive index (RI) mismatch between different media. The first interferometer (FPI
1) consists of an air chamber located between the mirror interfaces M
1 and M
2, while the second interferometer (FPI
2) is an SiO
2 chamber located between the mirror interfaces M
2 and M
3. The light intensity reflectivity of the three interfaces is
R1,
R2, and
R3, which can be calculated by the Fresnel reflection equation as follows:
where
n1 and
n2 are the RI of air and SiO
2, respectively. According to Equation (1), the reflectivity of each interface was very small (less than 3.6%, the RI of SiO
2 and air at 1550 nm are, 1.4682 and 1, respectively), which can be treated as double-beam interference. Therefore, the reflected electric field
Er of the cascaded FPI can be expressed as follows [
34]:
where
Ei is the input electric field, a
1, a
2, b
1, and b
2 are the transmission loss factors at M
1 and M
2 and the loss factor of FPI
1 and FPI
2, respectively.
φ1 and
φ2 represent the phase difference of the FPI
1 and FPI
2, which can be calculated as
where
L1 and
L2 are the length of FPI
1 and FPI
2, respectively.
λ is the propagation light wavelength. Equation (3) shows that when the refractive index or the length of the interferometer changes, the corresponding phase will also change, so the OPL can be used as a reference for the phase change of the interferometer. The reflected intensity can be derived as
where
Ir is the total reflected light intensity, and
is the conjugate complex number of
Er. Half-wave loss occurs when light is reflected from a light-sparse medium to a light-dense medium. Since the RI of the FPI
1 in the proposed sensor is smaller than FPI
2, there is a half-wave loss at the M
2 interface. The total reflected intensity was corrected to be
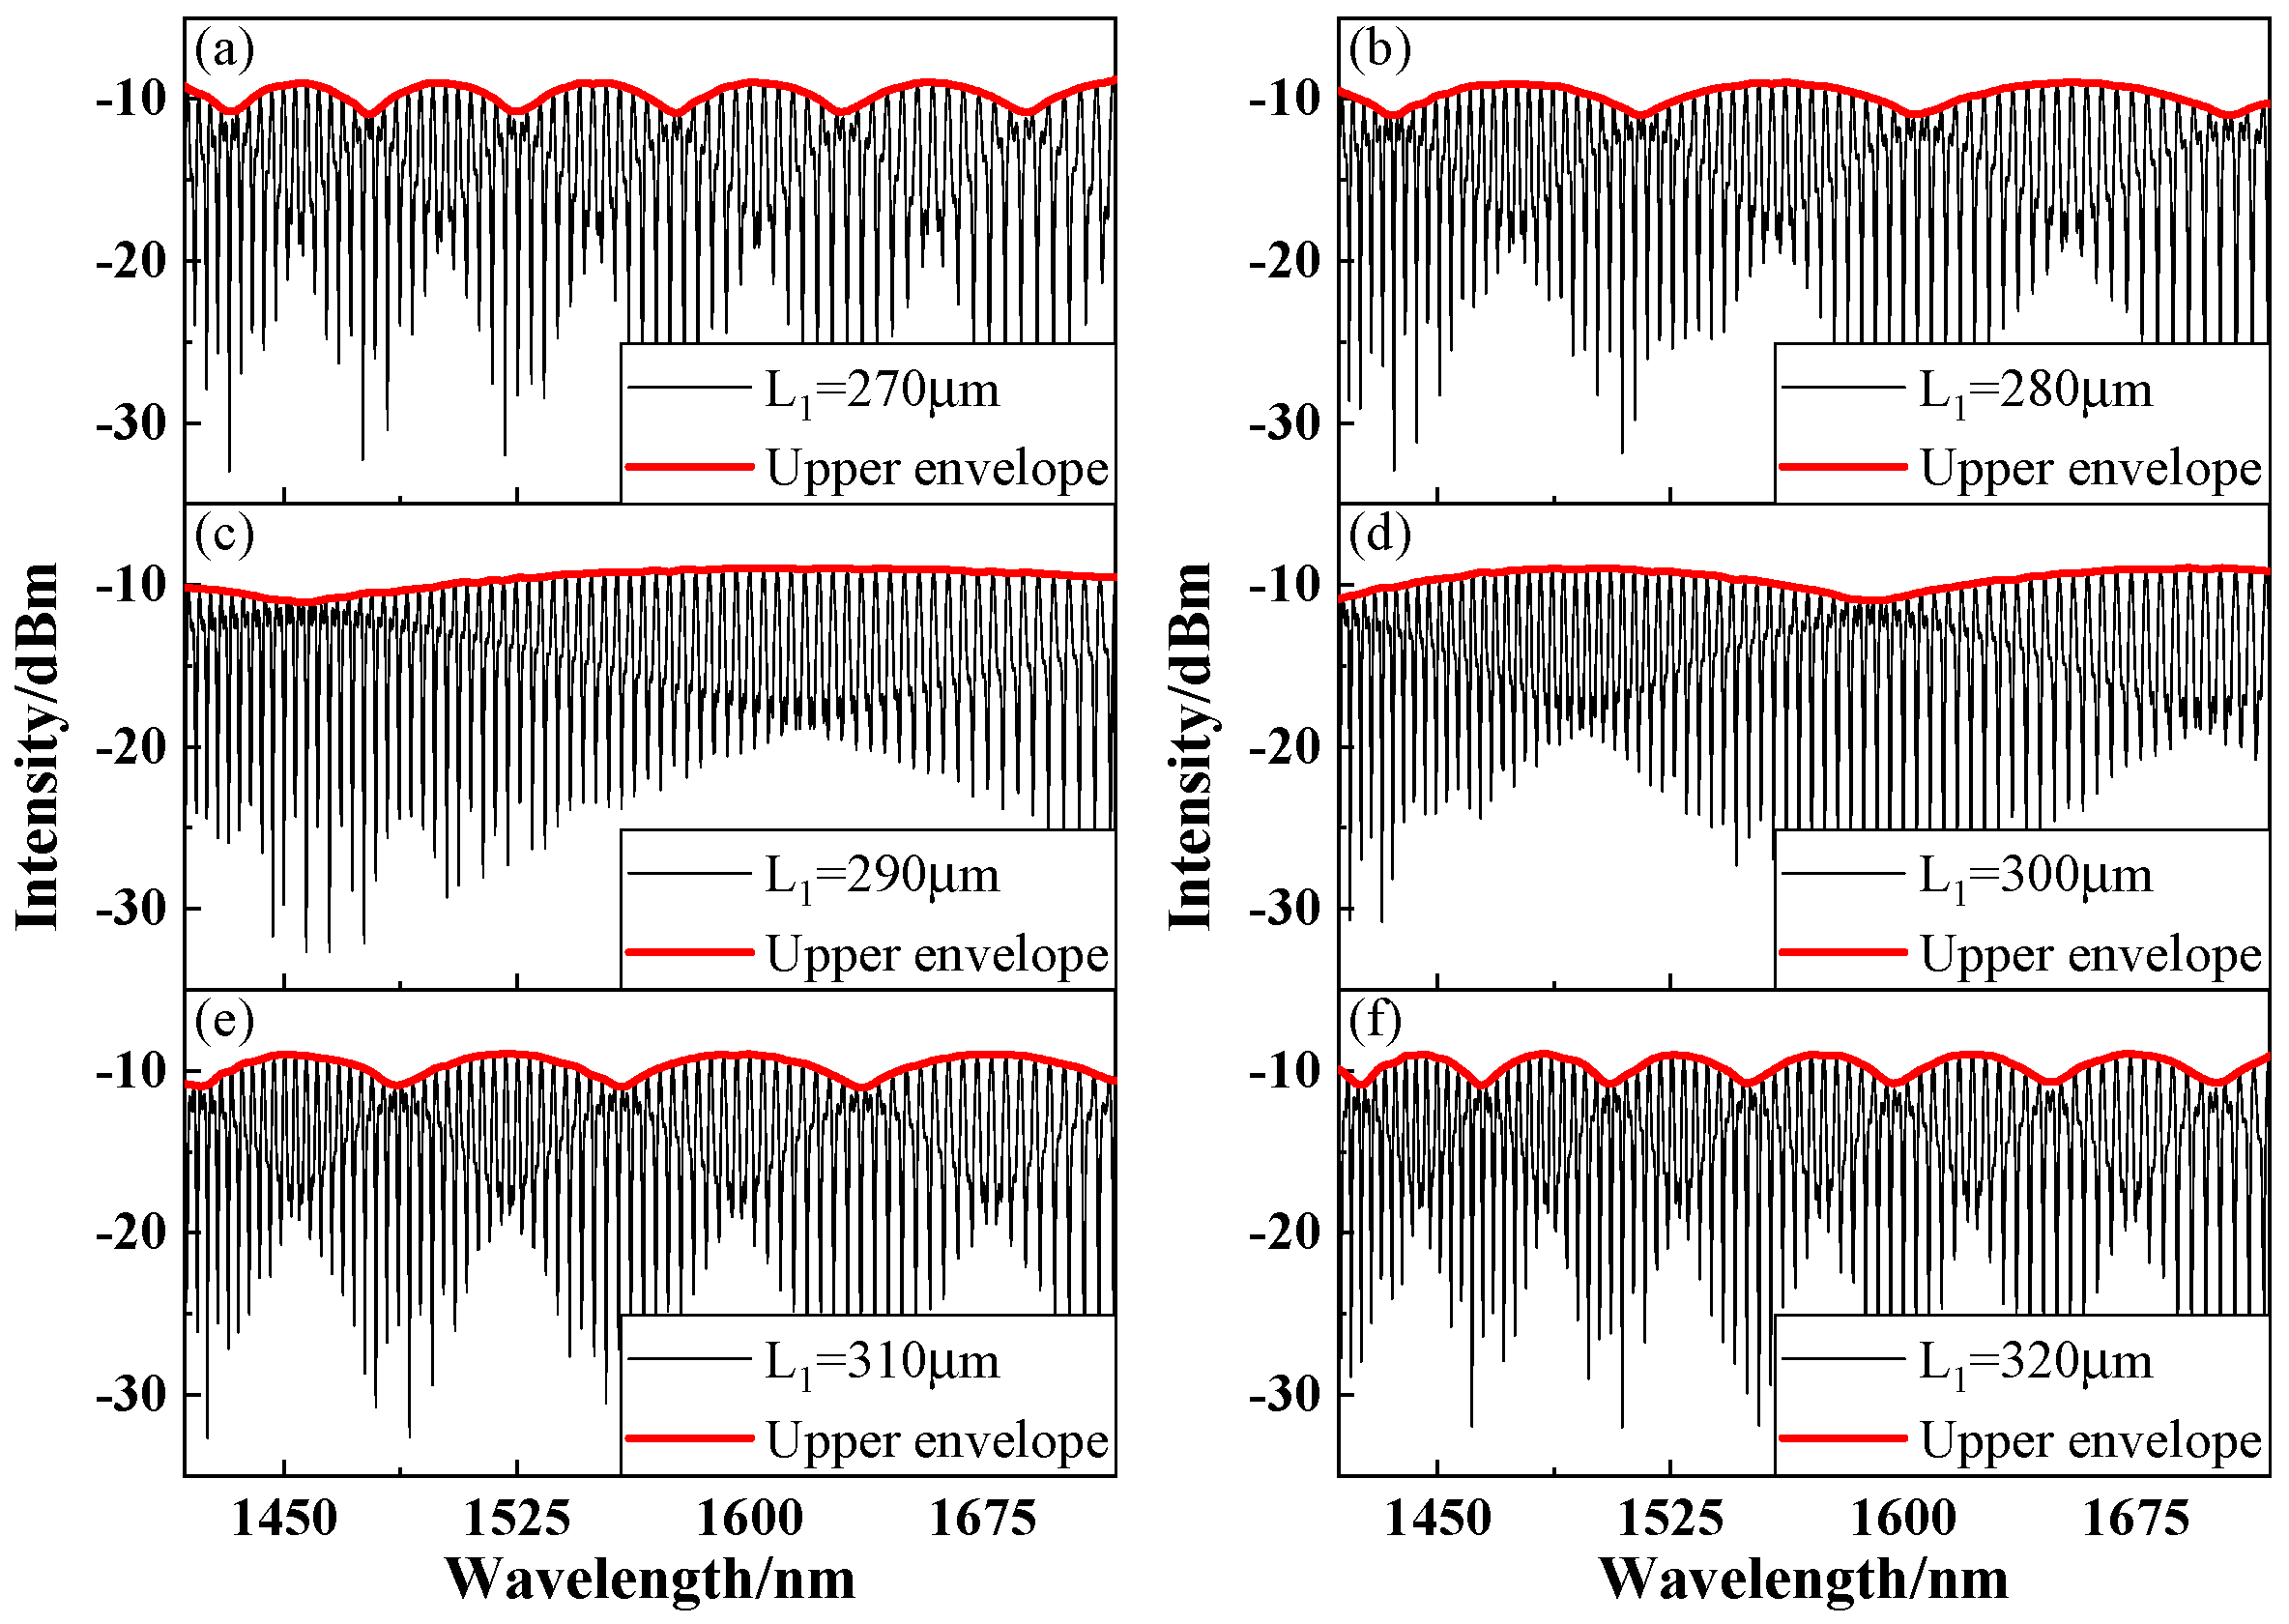
From Equation (5), one could find that the change of the total reflected light intensity is mainly determined by three cosine terms, so the change of phase is the dominant factor for the change of total reflected light intensity. To show the characteristic spectrum of the Vernier effect, we used Equation (5) to calculate the reflection spectra of the theoretical model.
The cavity length of FPI
1 was set from 270 μm to 320 μm (which makes the OPL of FPI
1 approximate to that of SiO
2) with a step size of 10 μm, and the cavity length of FPI
2 was 200 μm. The wavelength of the light source ranged from 1418 nm to 1718 nm, and the calculation parameters used in the simulation are summarized in
Table 1 [
35,
36].
The calculated reflection spectra are shown in
Figure 3. The upper envelope connected by the valleys of the high-frequency fringes can be observed in
Figure 3a–f, which is a typical feature of the Vernier effect. The Vernier envelope can be described by the FSR of FPI
1 and FPI
2 [
36]:
where
λm and
λm+1 are the adjacent peak wavelengths of the reflection spectrum and
FSRenvelope is the FSR of the envelope.
Figure 3a–c shows that
FSRenvelope expands as the length of the FPI
1 increases, while
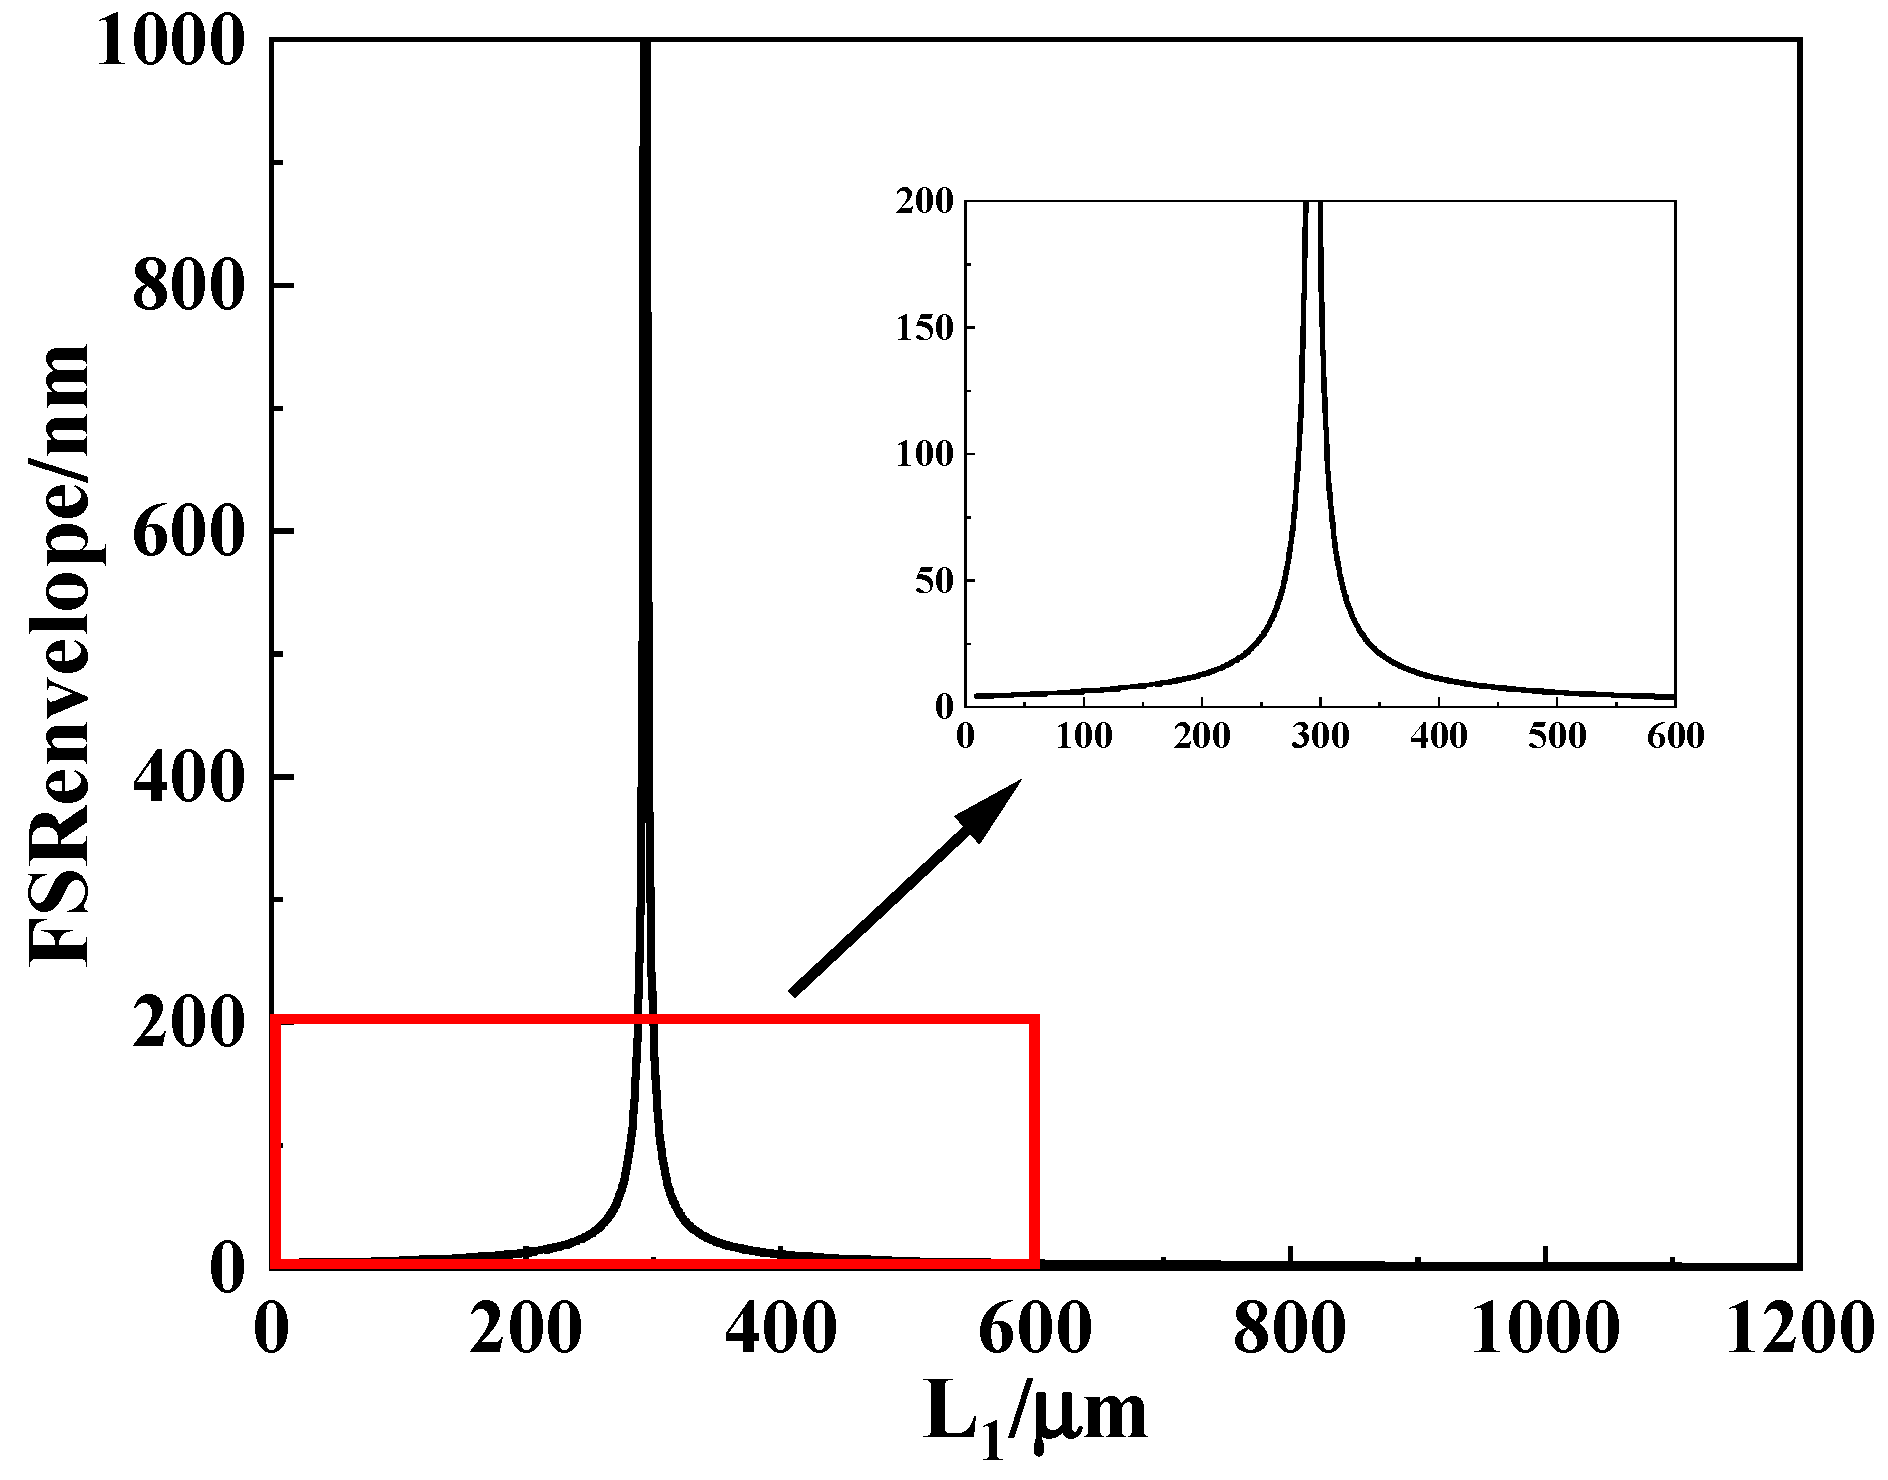
Figure 3d–f shows the opposite. Equations (6) and (7) describe the relationship between
L1 and
FSRenvelope, and it can be found that the envelope decays rapidly around 295 μm, as shown in
Figure 4.
We guessed that the trend of this change has boundaries. To find the boundary conditions of the change of the Vernier effect, the length of FPI
1 was set in the range between 10 μm and 1200 μm with a step of 0.1 μm, and the length of FPI
2 was set to 169 μm. The other parameters were the same. For the convenience of comparison, the ratio of
OPL1 to
OPL2 is defined as
With
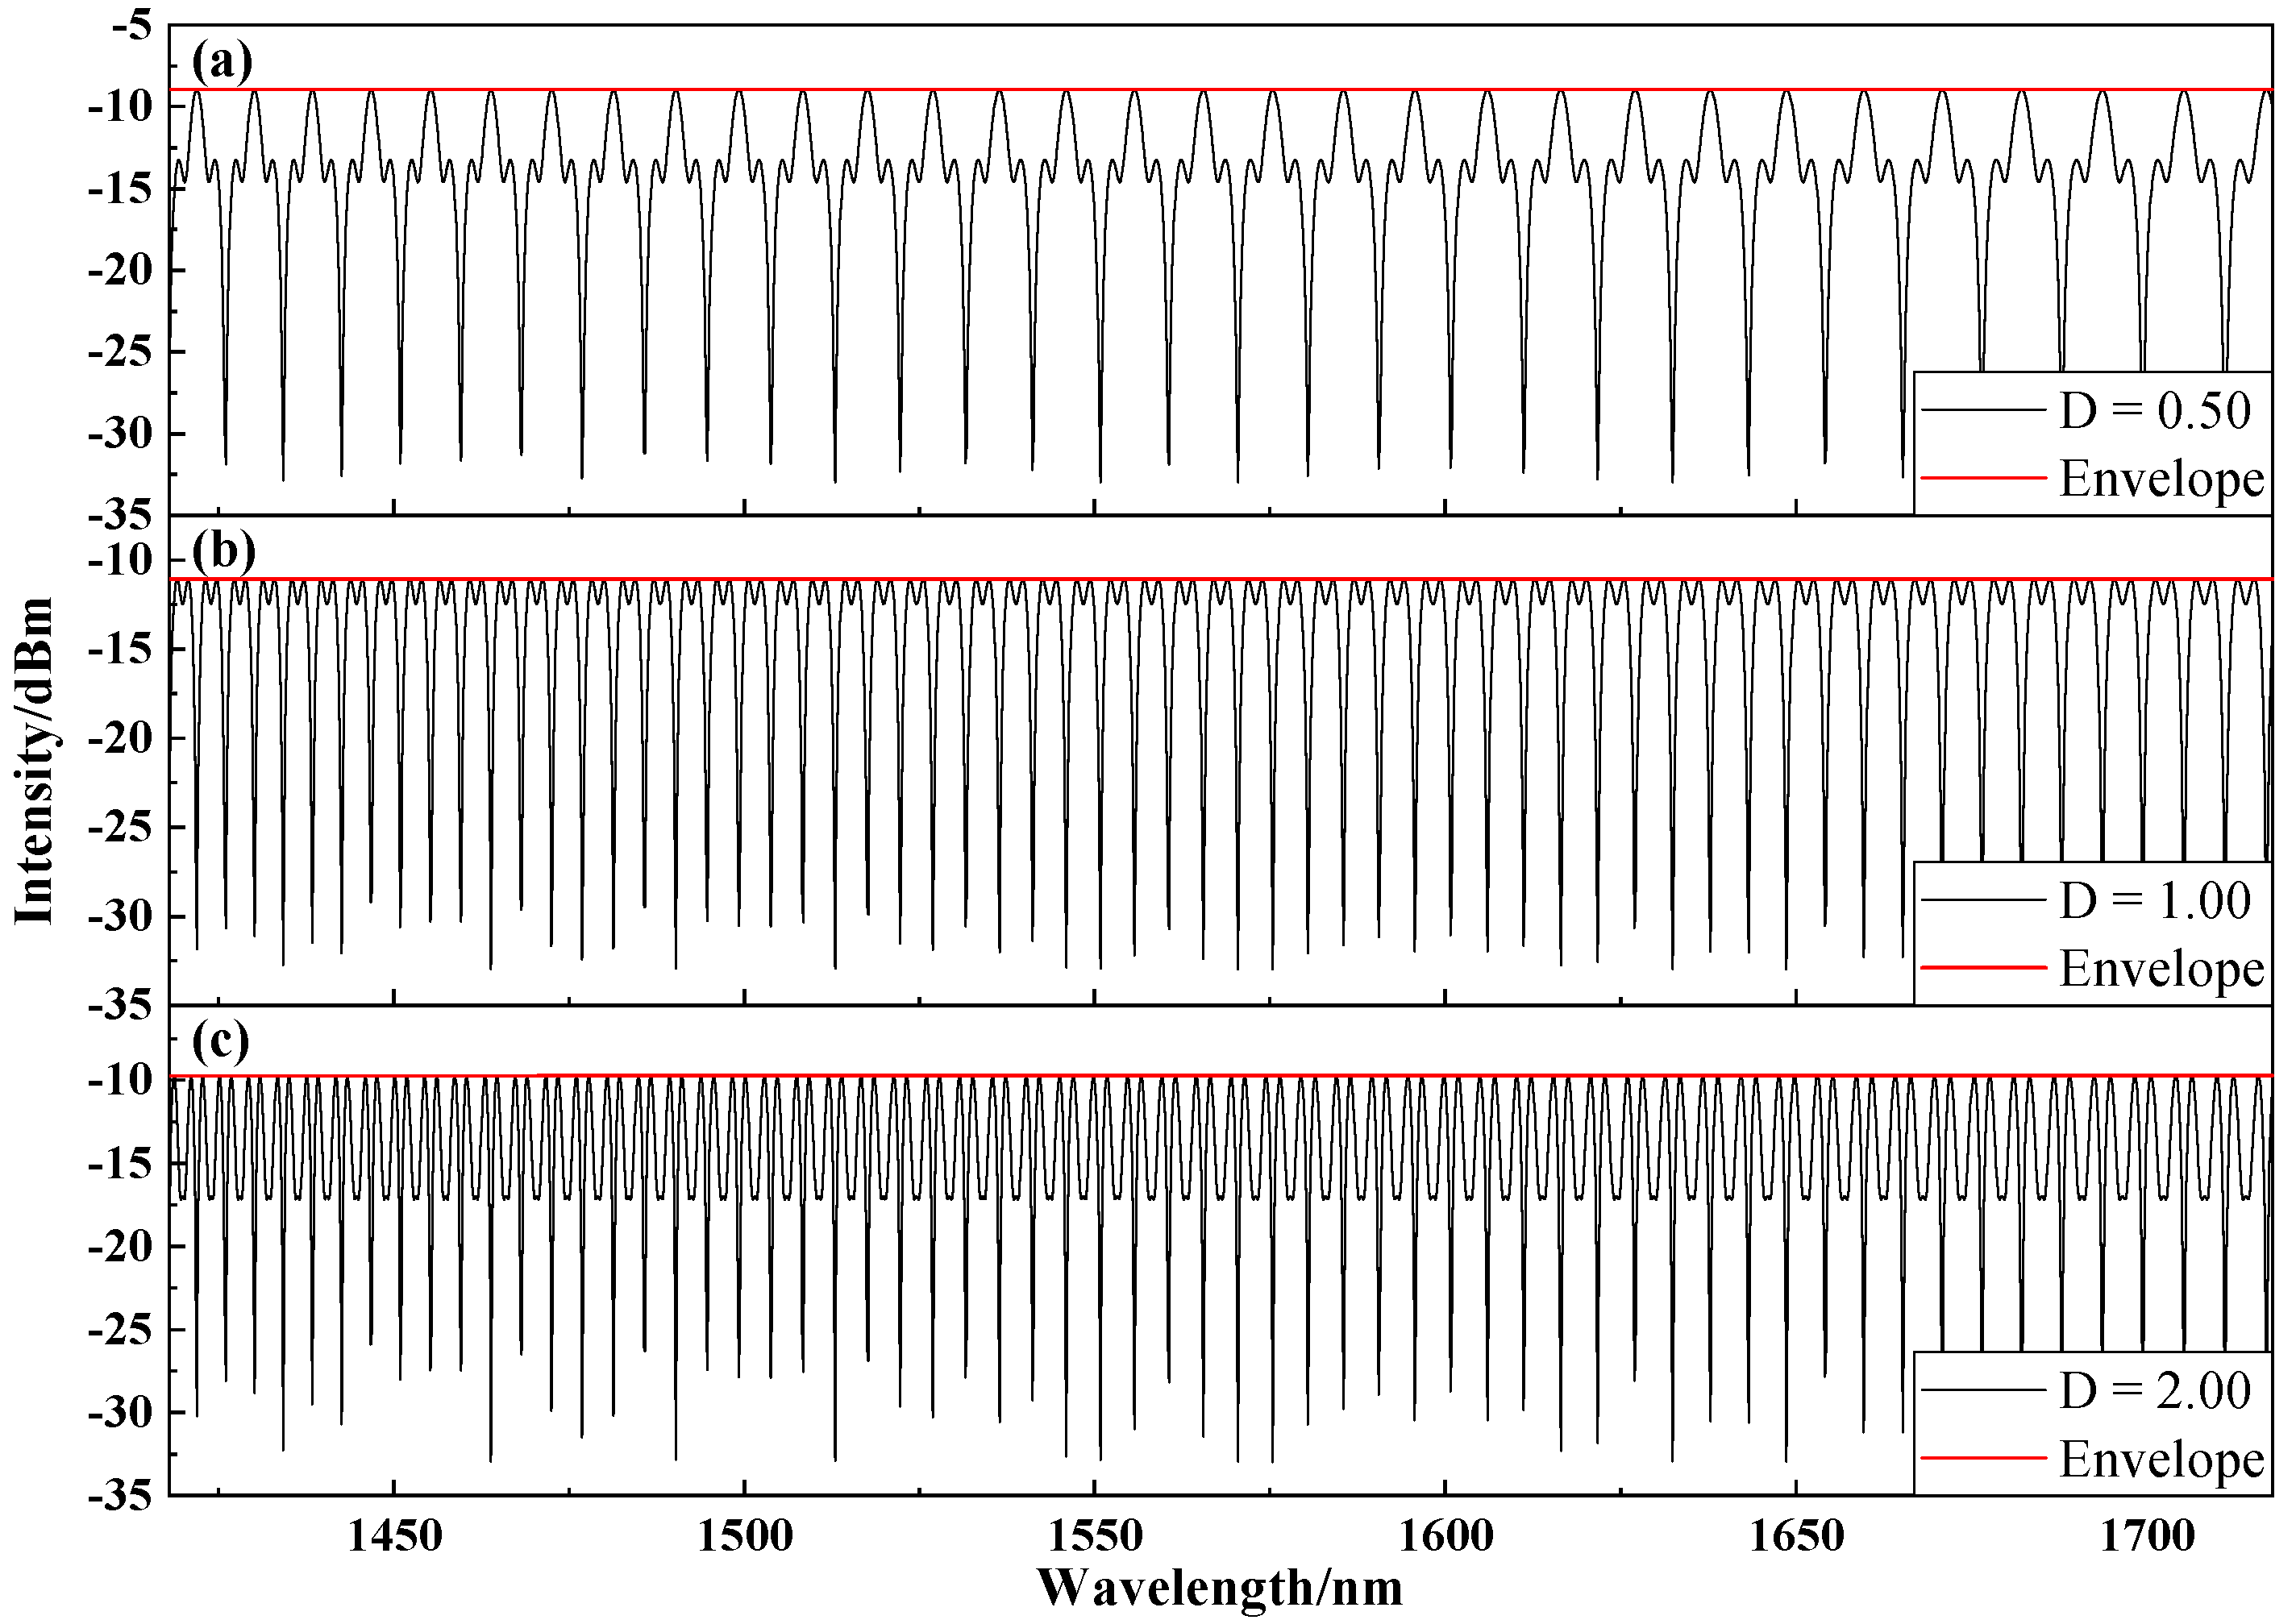
L1 increasing from 10 μm to 1200 μm, the continuous changes of the simulated reflectance spectrum and
D are recorded. The difference from the description in
Figure 4 is that we discovered a peculiar phenomenon in the continuous changing spectrum. As
L1 increases, the envelope of the spectrum will be repeatedly compressed and stretched, similar to a musician playing accordion; thus, we called it the accordion phenomenon. The
D values of several reflection spectra in the stretched state are recorded as shown in
Figure 5. Among them, as shown in
Figure 5b,
D = 1 means that the frequencies of the two interferometers are completely equal, and the corresponding envelope is stretched infinitely. The same situation appears in
Figure 5a,c, and their common feature is that the envelope is fully stretched, which means that they cannot be tracked. Moreover, in the adjacent stretched state, the envelope of the spectrum has undergone compression and expansion stages, which indicates that these changes have turning points. Therefore, the effective range of the Vernier effect can be found from these turning points during the accordion phenomenon.
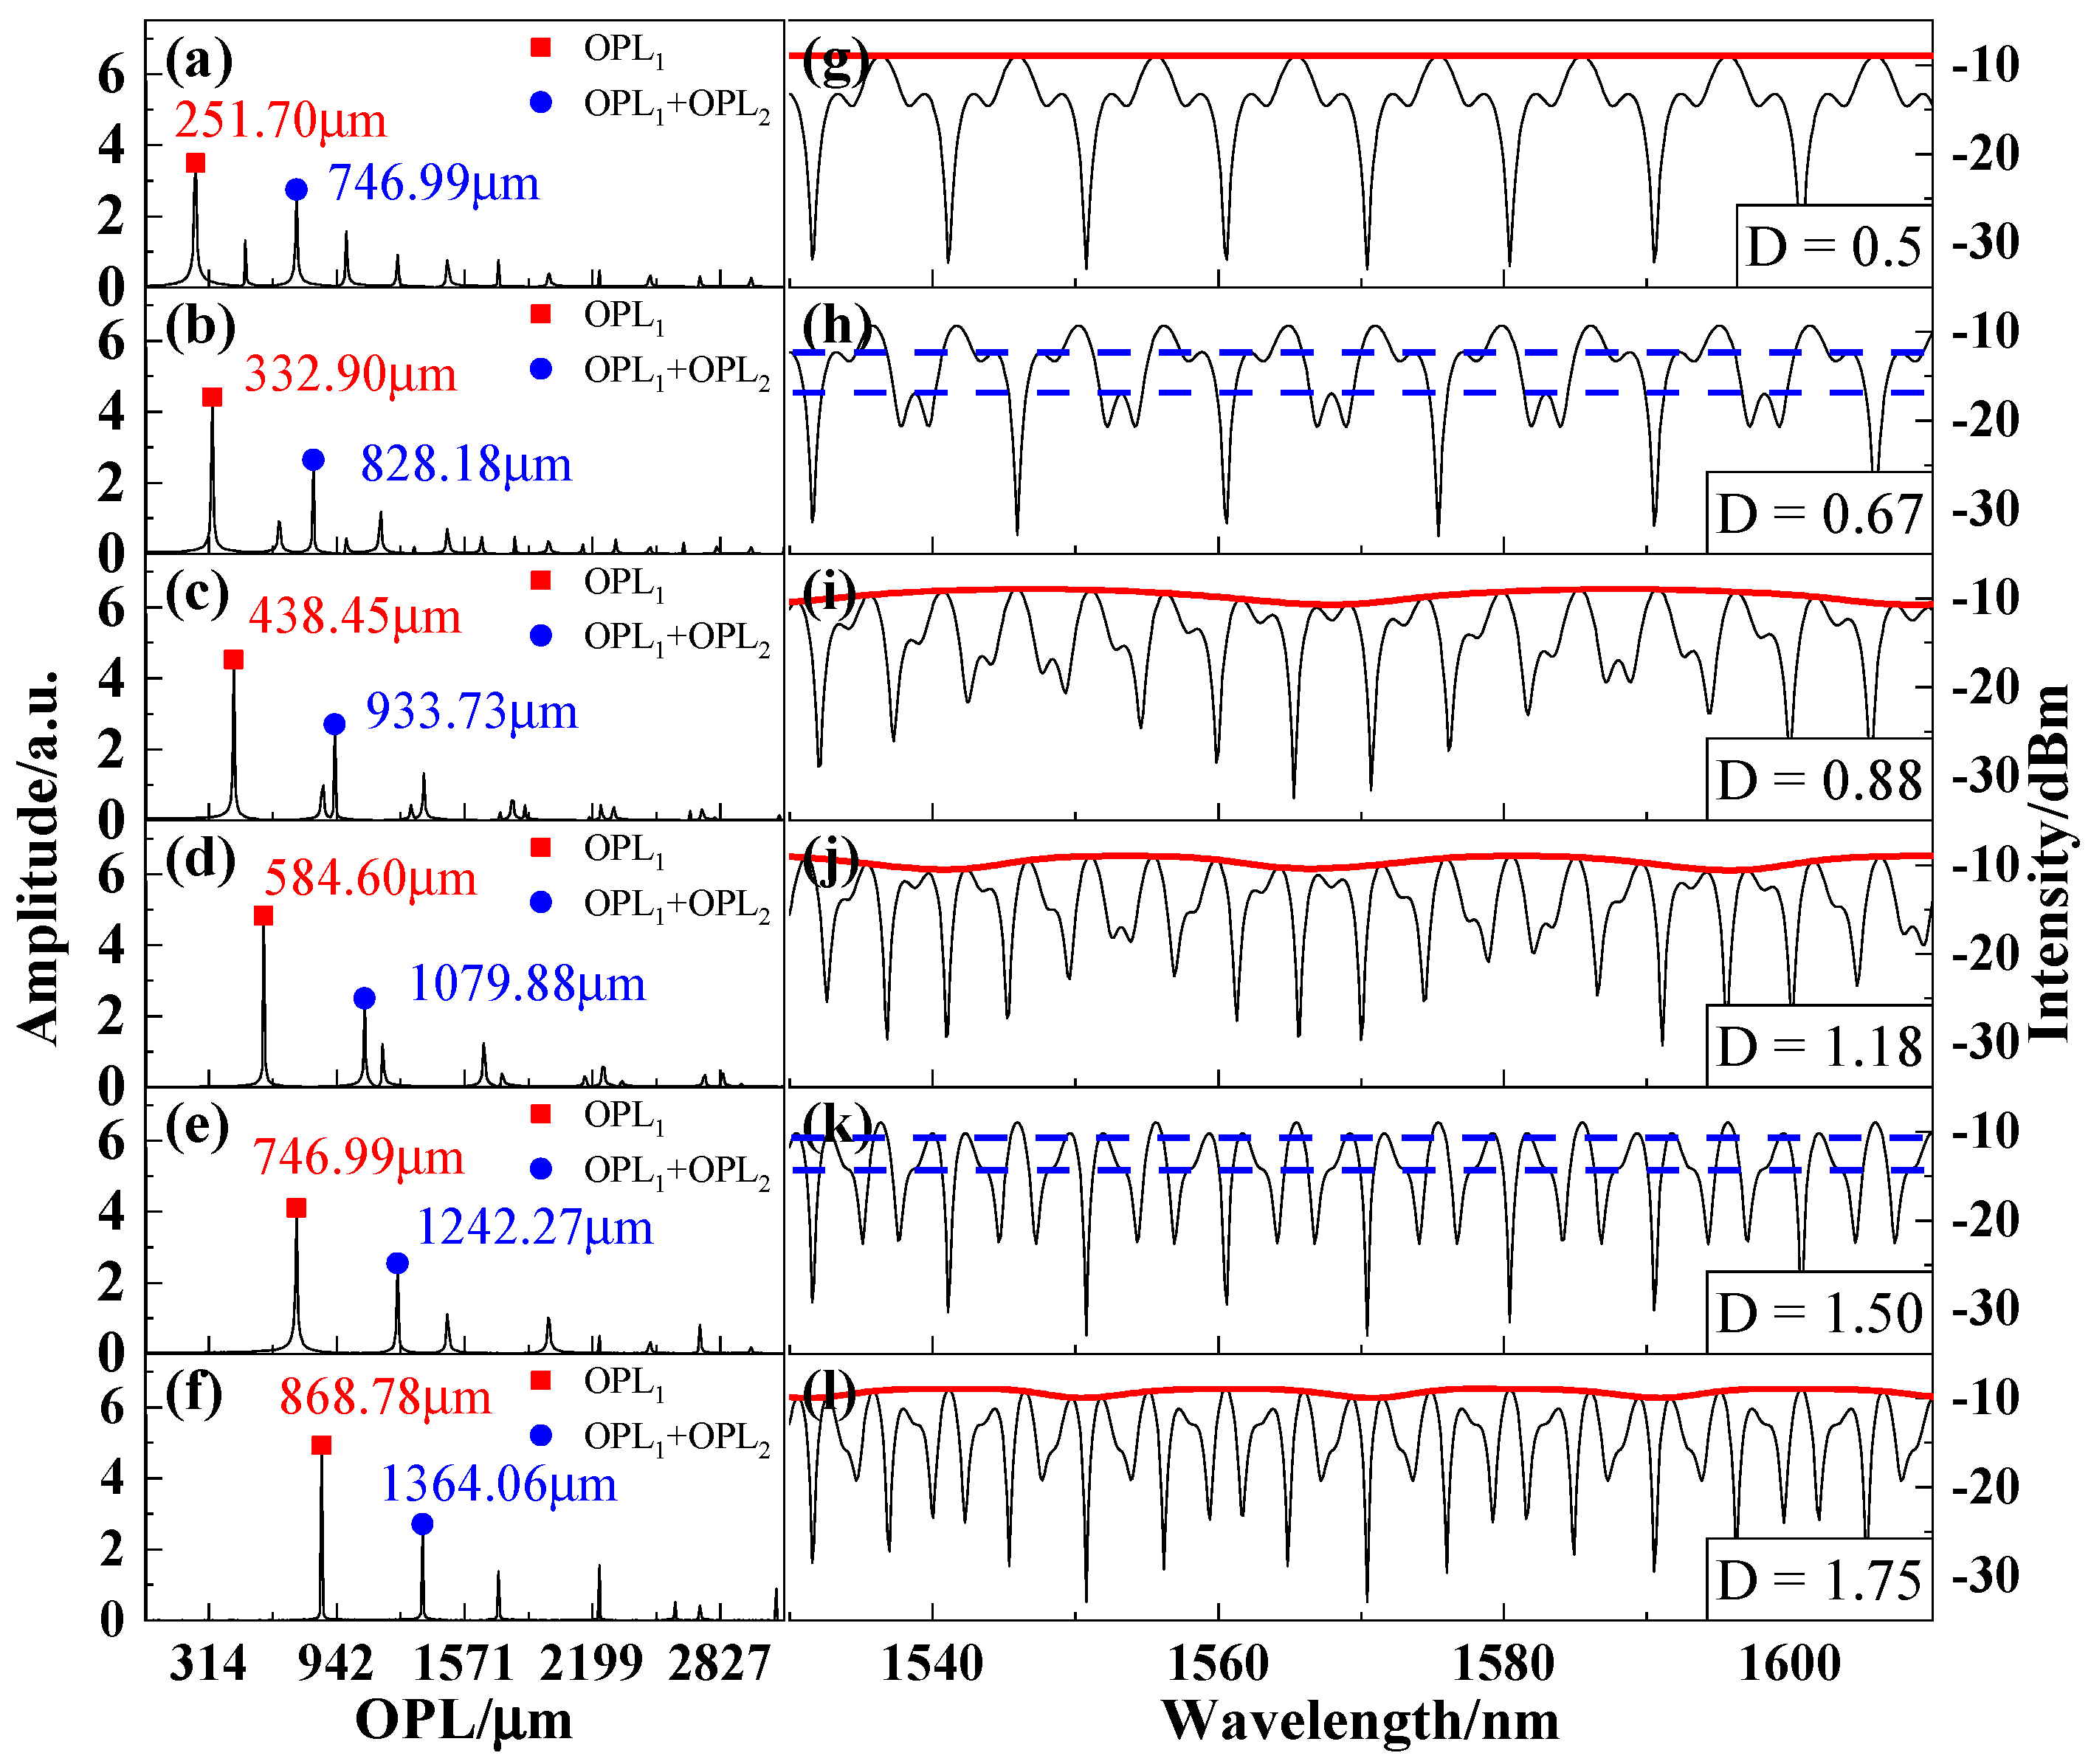
The generant condition of the Vernier effect is that the frequencies of the two interferometers are close enough, so we chose a ratio near
D = 1 for simulation, as shown in
Figure 6.
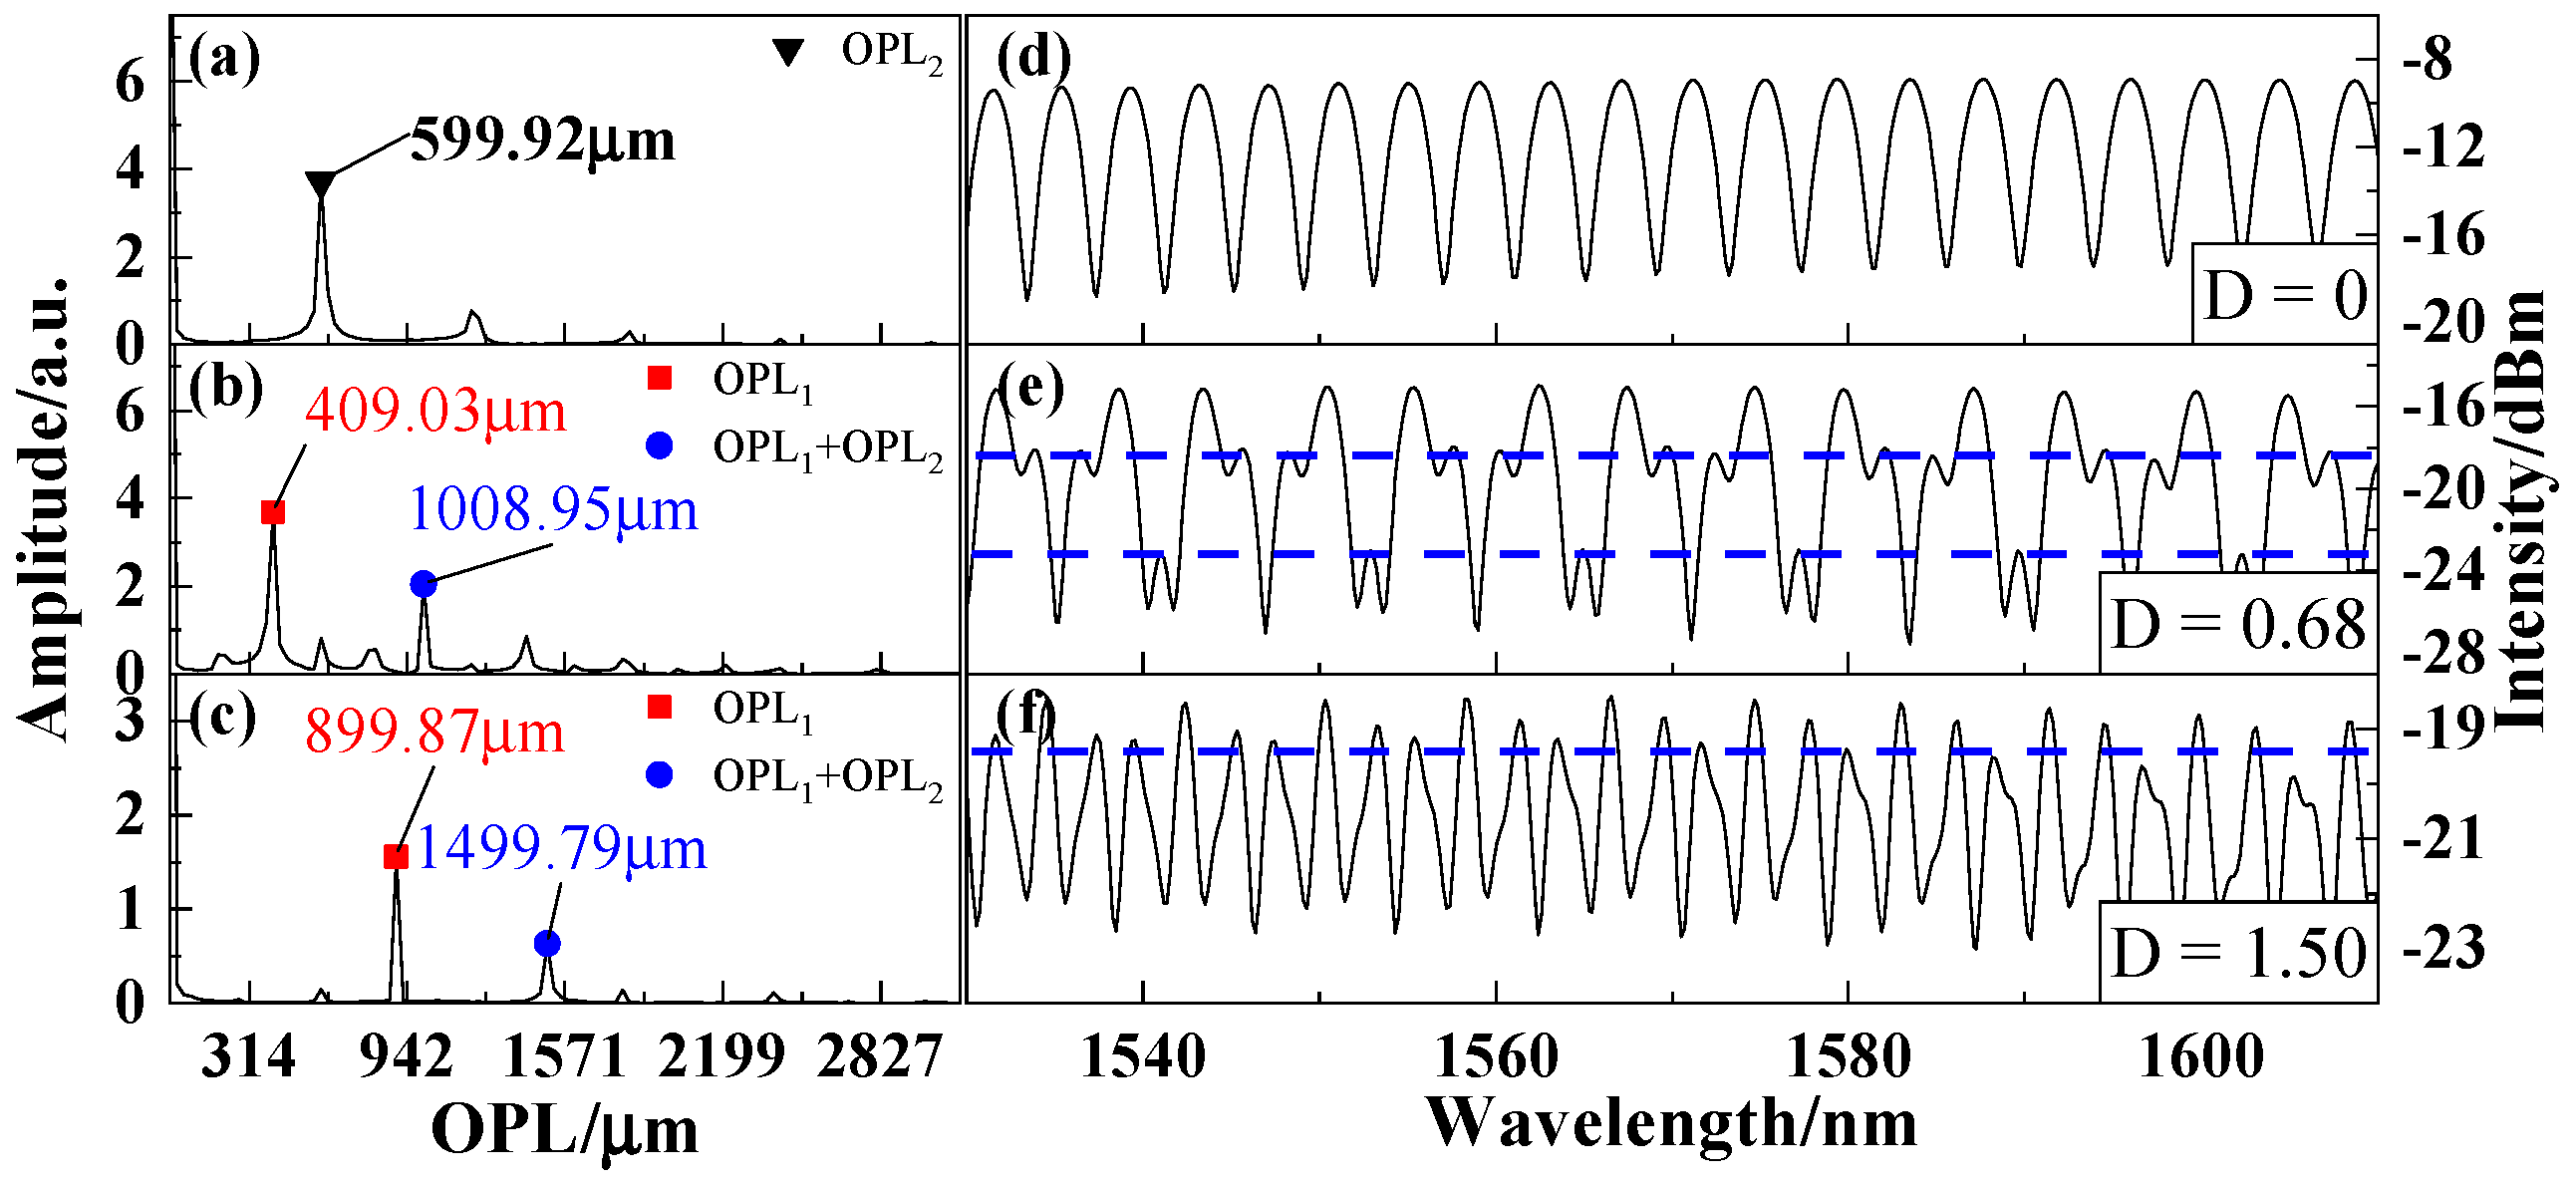
Figure 6g,l shows the reflectance spectra at different ratio
D.
Figure 6a–f shows the fast Fourier transform (FFT) of the corresponding reflectance spectra, where the red dot represents the OPL of the FPI
1, and the blue dot represents the sum of the OPL of the two interferometers. With
L1 changing, the simulated signal and its frequency change synchronously.
Figure 6g is the spectrum in the stretched state, and the corresponding FFT is shown in
Figure 6a, so we can calculate that the frequency of FPI
2 is twice that of FPI
1. In other words, when
D is 0.5, twice the frequency of FPI
1 resonates with that of FPI
2. When
D increases from 0.5 to 0.67, the envelope of the reflection spectrum is continuously compressed from the stretched state until it is as it is shown in
Figure 6h. In contrast, when
D increases from 0.67 to 1, the envelope continues to expand until
D = 1 (refer to
Figure 5b). Additionally, the envelope then starts the next stage of compression and expansion.
Figure 6i,j shows samples taken during the expansion stage and the compression stage near
D = 1, respectively, and the red envelope represents the typical characteristics of the Vernier effect. It can be seen that the change trend of the envelope near
D = 0.67 (here is an approximate value, the exact value is two-thirds) is opposite, so it is an inflection point. Meanwhile, we can find another inflection point at
D = 1.5 in the next cycle of envelope change. As shown in
Figure 6h,k, their common feature is that the spectrum exhibits periodicity and the inner envelope formed by the blue discontinuous line connecting the secondary peaks are all in a stretched state. The reason for the appearance of these inflection point features can be explained as follows: in
Figure 6b, three times the FPI
1 frequency and two times the FPI
2 frequency are equal (the frequency multiple in
Figure 6e is the opposite), so resonance occurs between them. Here, we verified our conjecture that the boundary of the envelope change exists through simulation.
According to the turning point obtained from the simulation, we can use the Vernier effect in the effective range
D from 0.67 to 1.5. However, in practical applications, we need to try our best to make the spectra envelope of the Vernier effect within the observable range of the device. If the maximum bandwidth supported by the device is expressed as
Wspan, the Vernier envelope needs to meet the following equation:
The appropriate ratio
D can be selected according to the device bandwidth
Wspan to produce the Vernier effect. In addition, the sensitivity is also a very important issue for sensing applications. The magnification
M of the Vernier effect on the sensitivity of the sensor can be calculated as
where
Ssensing is the sensitivity of the sensing probe, and
N is the number of measuring points with step length as the unit sensitivity (generally, in order to fit the measurement results well,
N needs to be no less than 5). According to Equation (10), the
D value of the maximum magnification Vernier effect supported by the device is calculated as
Therefore, we can accurately design the interferometer to generate the Vernier effect, and the sensitivity of the sensor can also be enhanced. The following three steps explain how this method works:
- (1)
Parameter acquisition: the material and length parameters of the sensing interferometer are designed according to the requirements and its OPL, and Ssensing can be measured through sensing experiments. The appropriate Wspan can then be selected depending on the equipment conditions. To obtain a more accurate linear fit, the number of sampling points per unit sensitivity N is generally set to 5.
- (2)
Parameter comparison: by substituting the parameters (Wspan, N, Ssensing) obtained in step (1) into Equation (11), the ratio D of the reference interferometer to the sensing interferometer can be calculated. If the D is between 0.67 and 1.5, it is within the effective range of the Vernier effect. In addition, the inequality of equation (9) must be satisfied to ensure that the envelope can be observed within the bandwidth of the device. Otherwise, we must choose a nearby value that satisfies the condition.
- (3)
The production of the reference interferometer: the OPL of the reference interferometer can be calculated by substituting the D obtained in step 2 into Equation (8). Therefore, we can freely choose the material and length parameters of the reference interferometer for production.
Finally, we can obtain the reflection spectrum with the Vernier effect within the bandwidth of the experimental equipment, and the amplification factor is also as increased as much as possible.
3. Experiments and Discussion
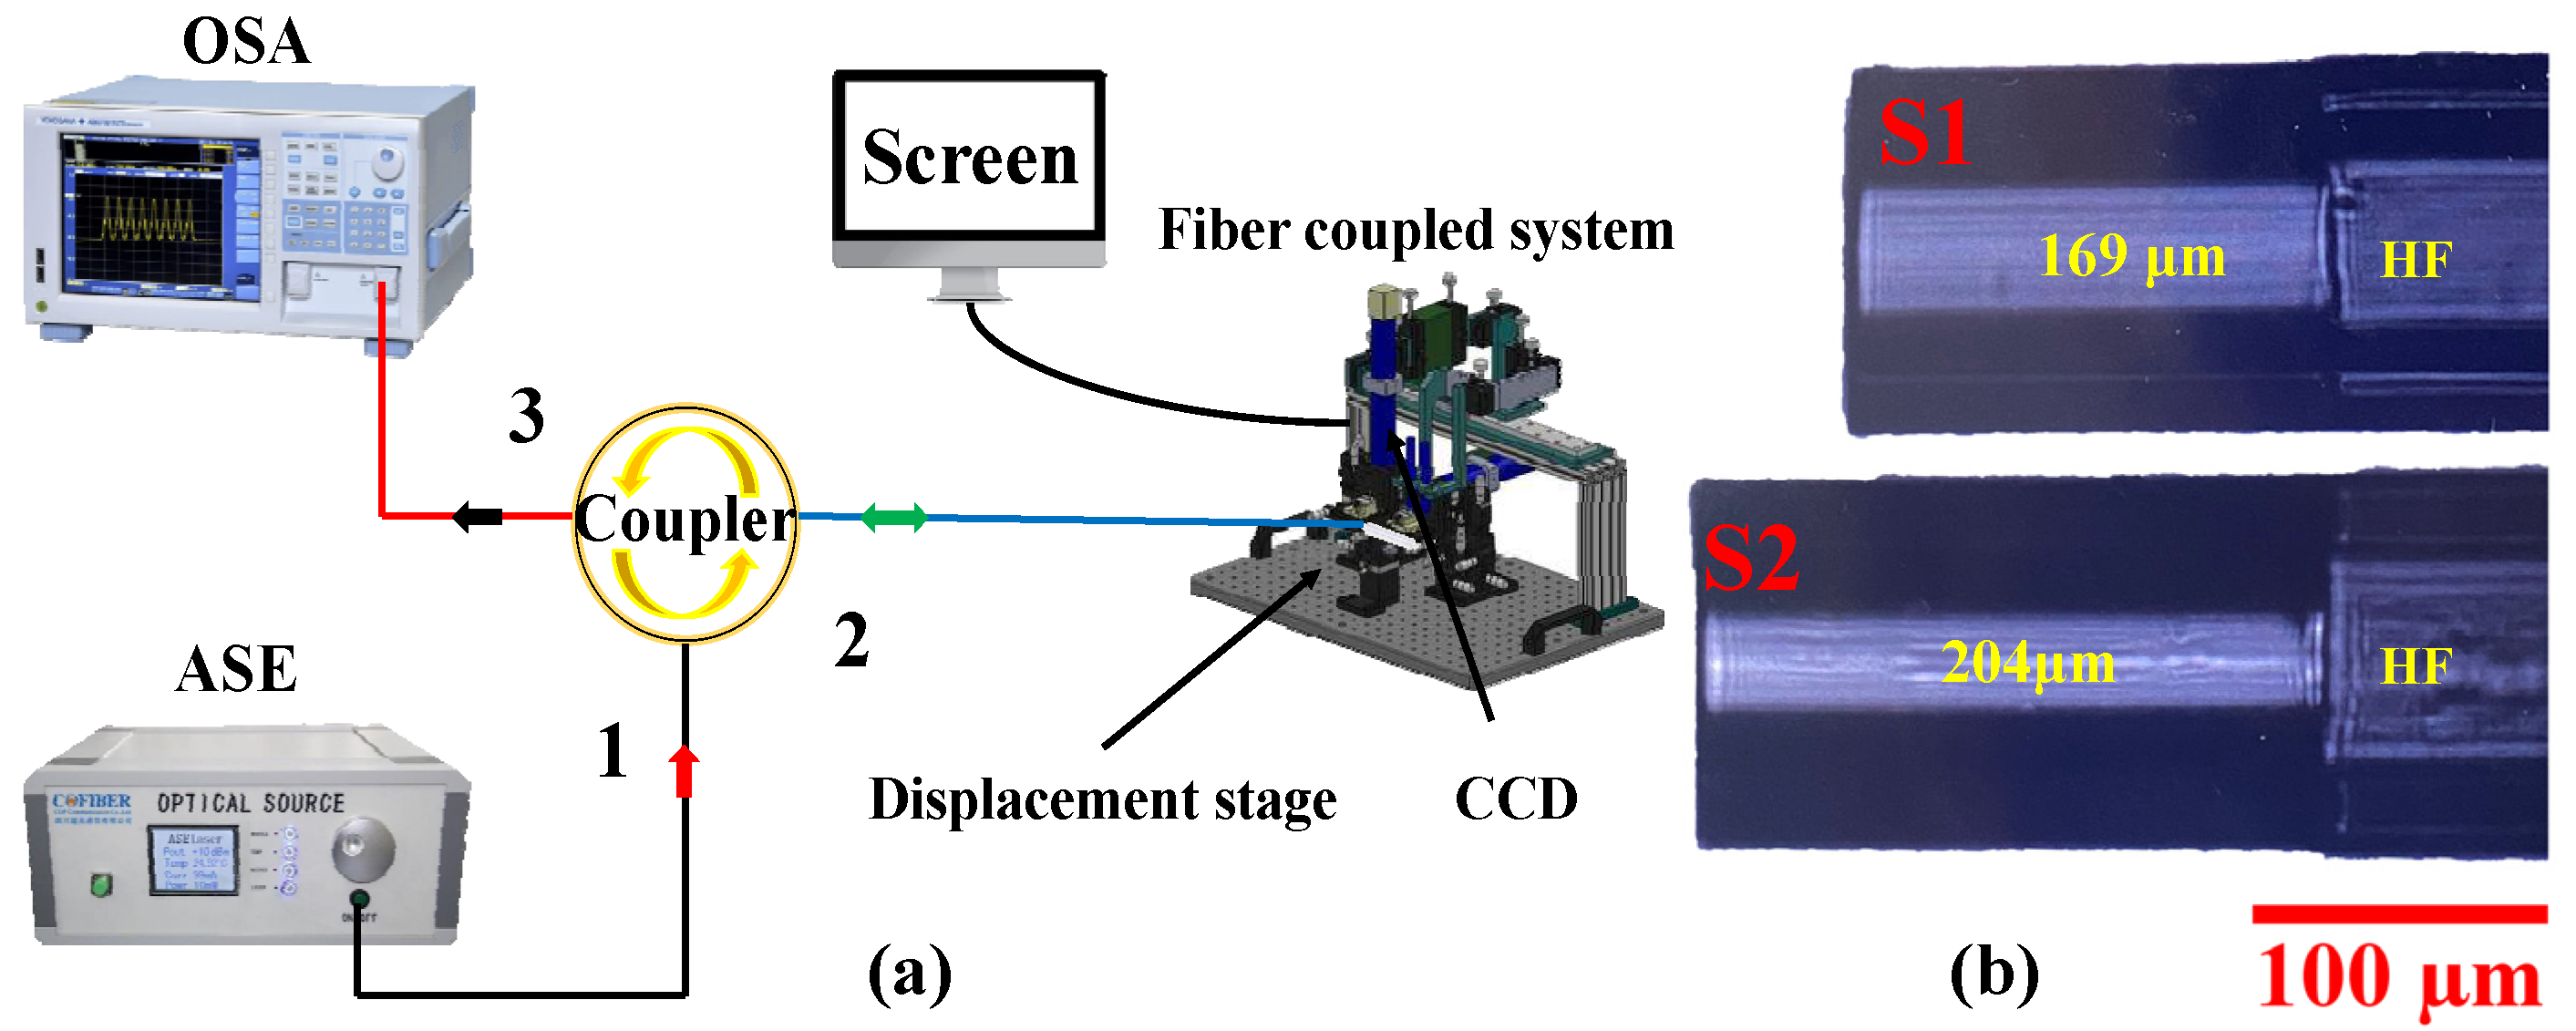
The device shown in
Figure 7a was used to verify the inflection point of the accordion phenomenon in the simulation. An amplified spontaneous emission (ASE, with a wavelength ranging from 1525 nm to 1605 nm) broadband light source supplies light to the proposed interferometer via a circulator, and the reflected light is then collected by an optical spectrum analyzer (OSA, MS9740A with a resolution of 0.1 nm). In the experiment, two samples with different lengths are fabricated, as shown in
Figure 7b. The probe is fixed on the optical fiber coupling platform, on which the length of the air chamber can be adjusted, and the computer display screen can assist us in inserting the light guide fiber into the LDHF.
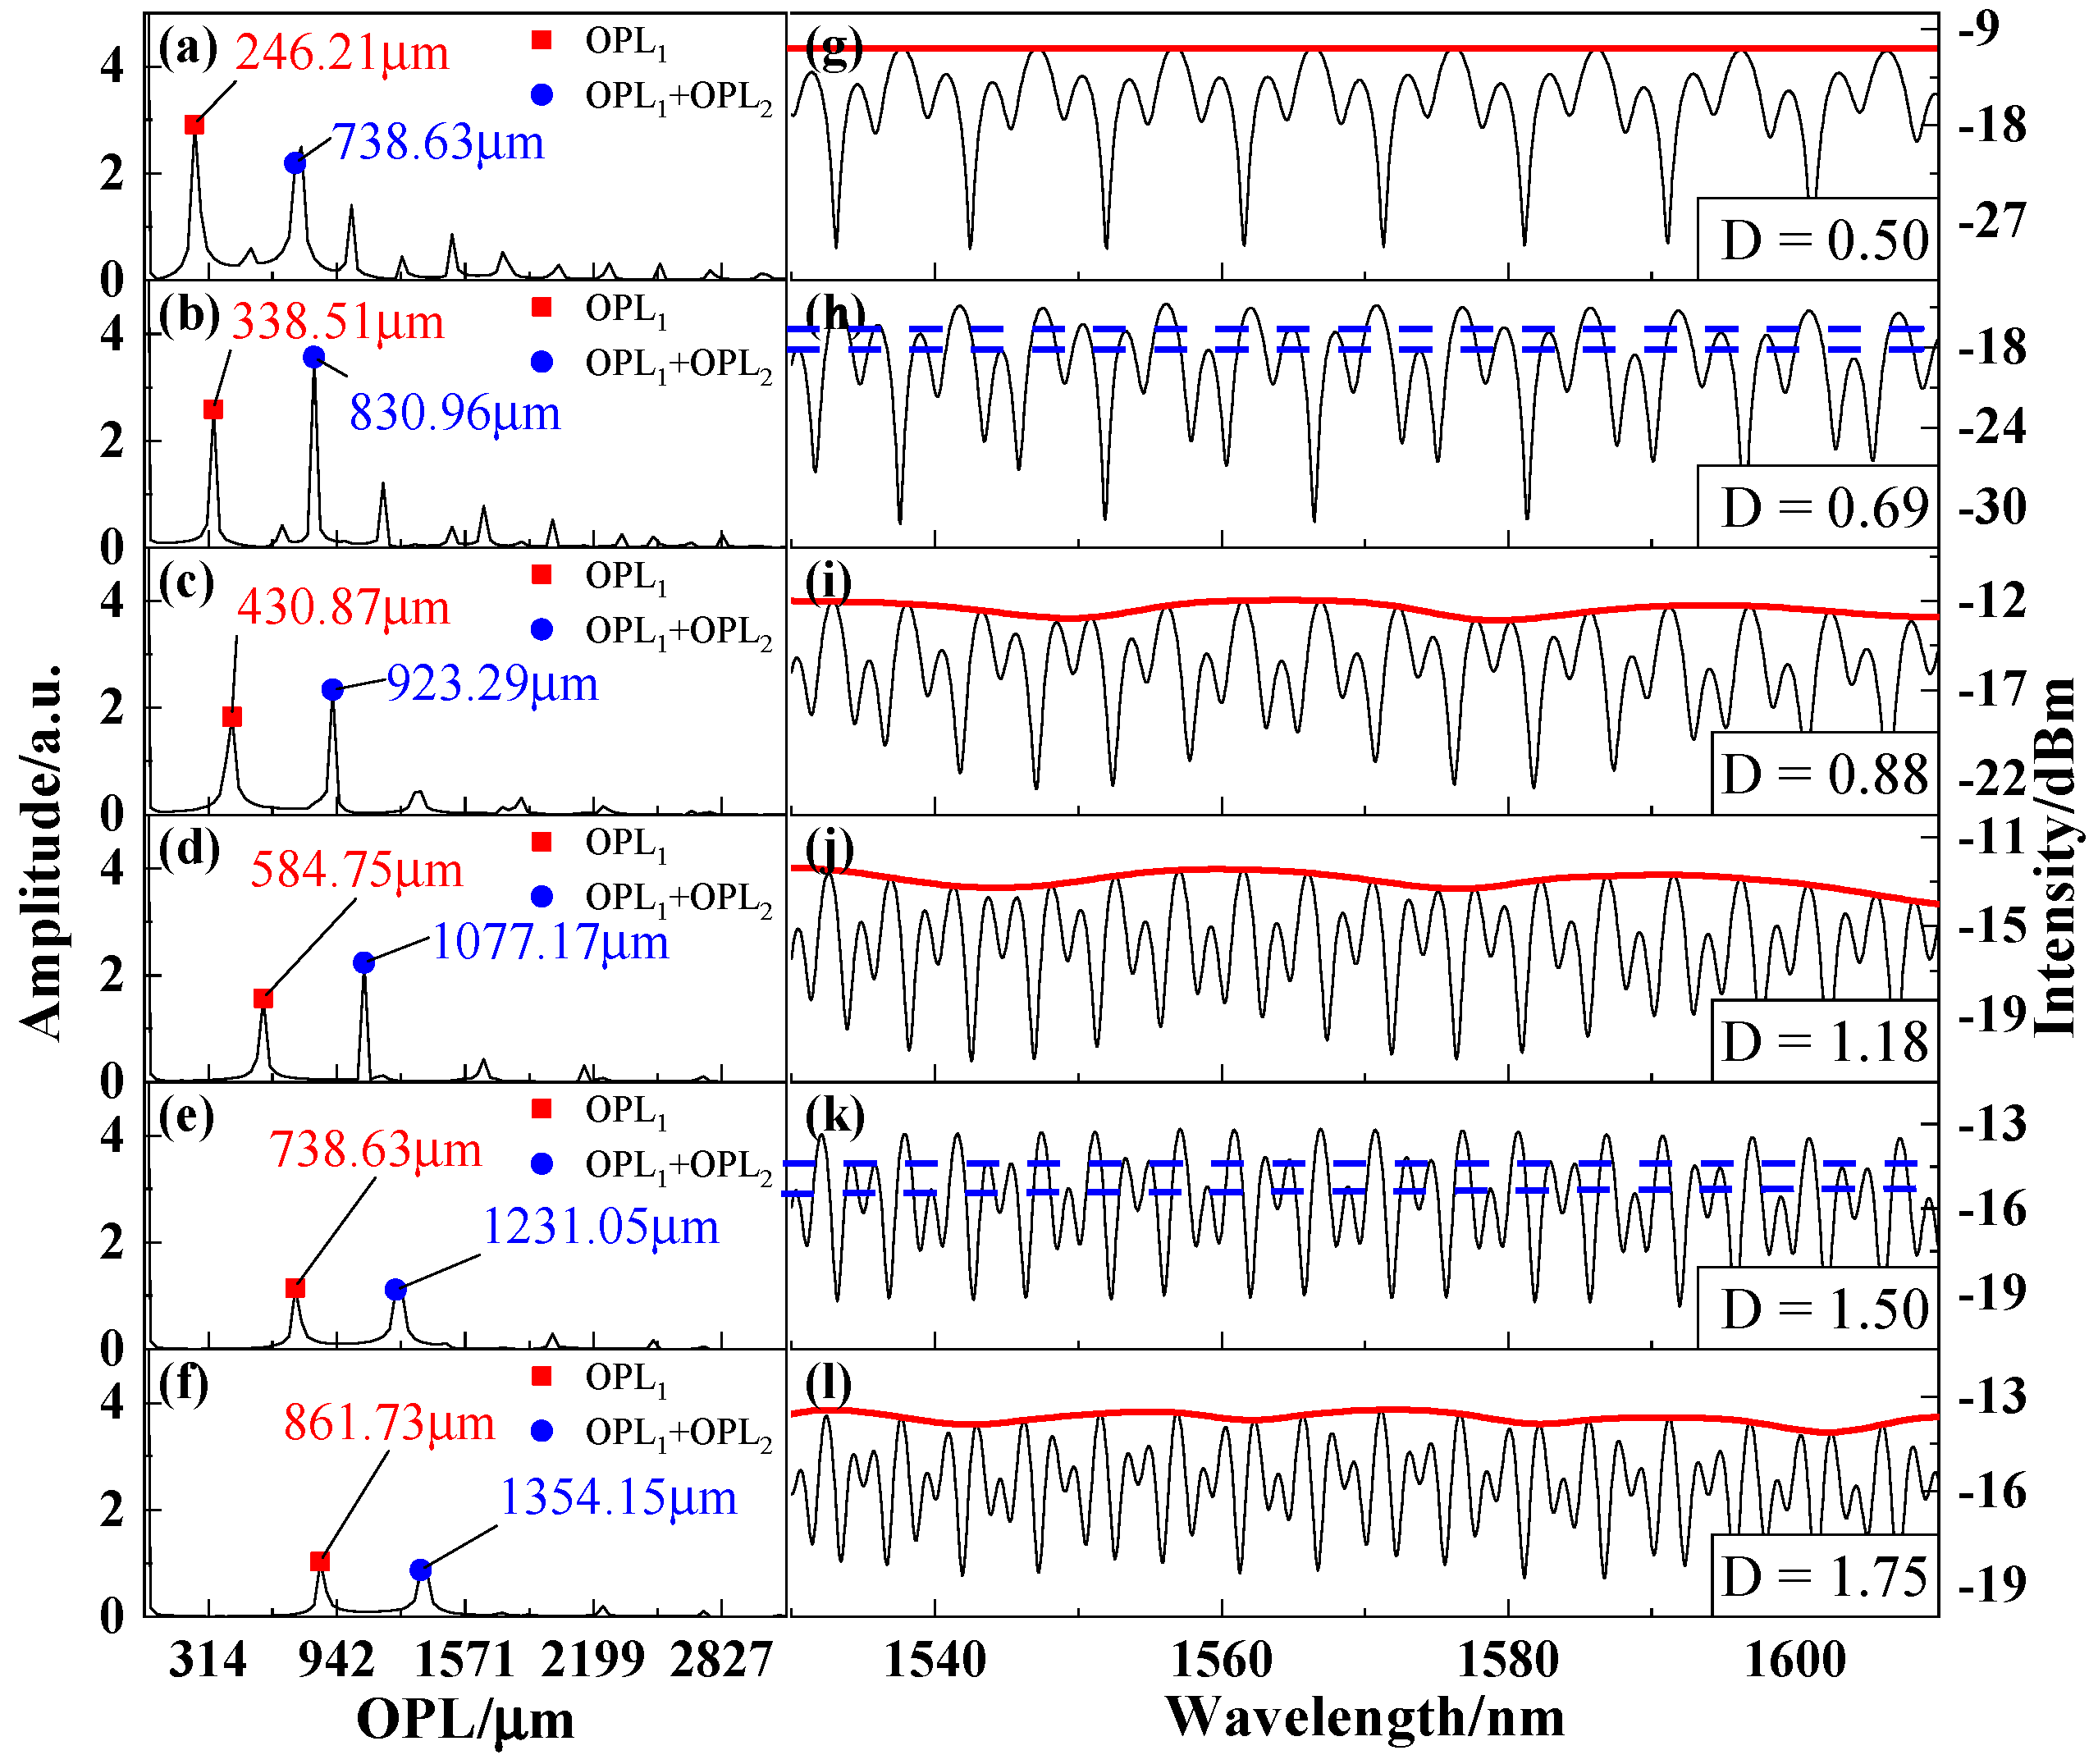
Sample S1, which had a length of 169 μm, was inserted into the LDHF, and the length of the air cavity was adjusted with a step size of 1 μm. At the same time, the real-time spectral changes could be observed on the OSA.
Figure 8 presents the reflected intensity spectra for the Vernier effect together with the corresponding FFT.
Figure 8g shows the measured reflectance spectrum from when the OPL ratio between interferometers was 0.5, which can be calculated from
Figure 8a. The red dots in
Figure 8a–f represent the OPL of the air cavity, and the blue dots represent the sum of the OPL of the air cavity and the silica cavity. Therefore, the ratio
D corresponding to the spectrum can be calculated.
Figure 8h,k represent the inflection point measured by the experiment, which are similar to the simulation in
Figure 6h,k. In order to prove the reliability of the experimental results, sample S2, which had a length of 204 μm, was used to repeat the experiment. As a result, we also found the inflections seen in
Figure 9. Among them,
Figure 9d represents the interference spectrum of S2 when air cavity length is 0, and the images in
Figure 9e,f are the inflection points of sample S2. There are some differences in the reflection intensity between the experimental spectrum and the simulation spectrum, which is mainly caused by the loss in the transmission process and the fluctuations in the power of the light source. Nevertheless, the change trend of the interference signal was still the same. In addition, the longer the length of the cavity, the more peaks in the spectrum, which easily leads to the loss of peak information. As shown in
Figure 9f, some secondary peaks have almost disappeared. The turning points calculated in the experiment have slight errors, which are caused by the low resolution of the FFT and the accumulation displacement platform errors.
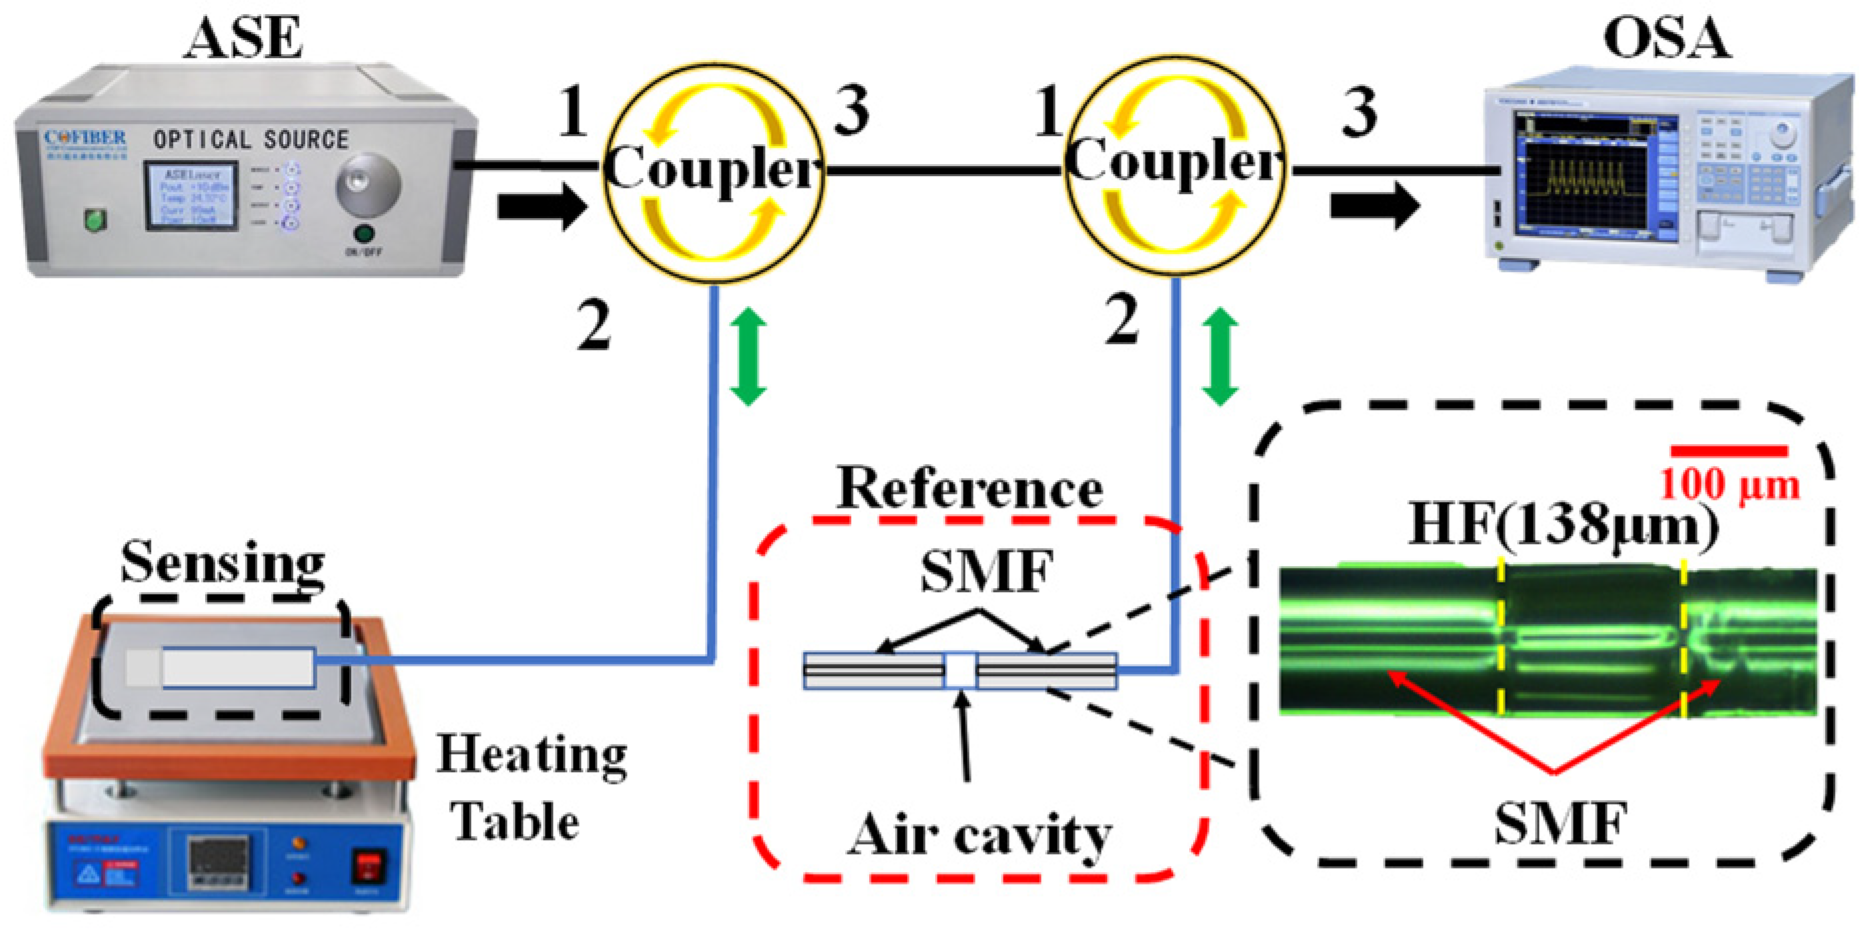
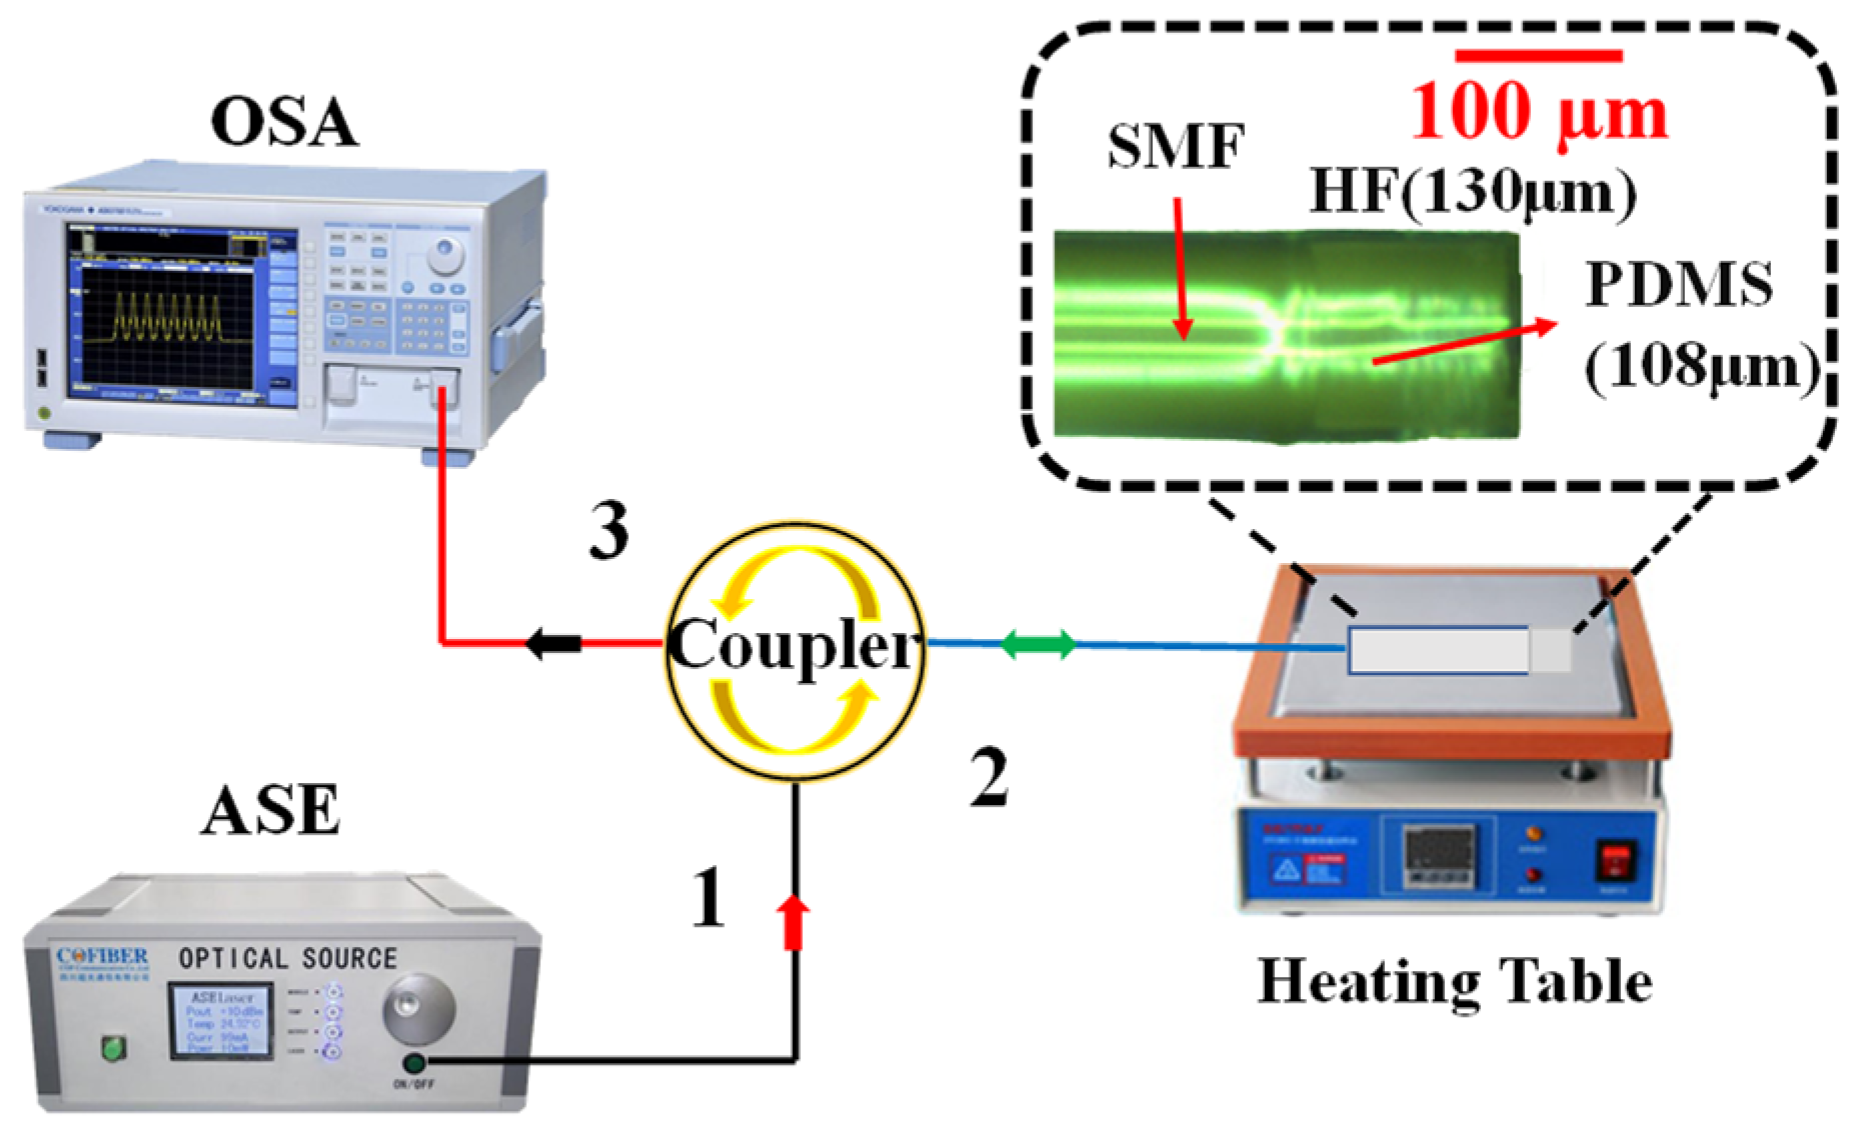
To further validate the properties of our proposed method, a poly (dimethylsiloxane) (PDMS)-filled FPI temperature sensor probe was fabricated and tested. The microscopic image and experimental setup for temperature are illustrated in
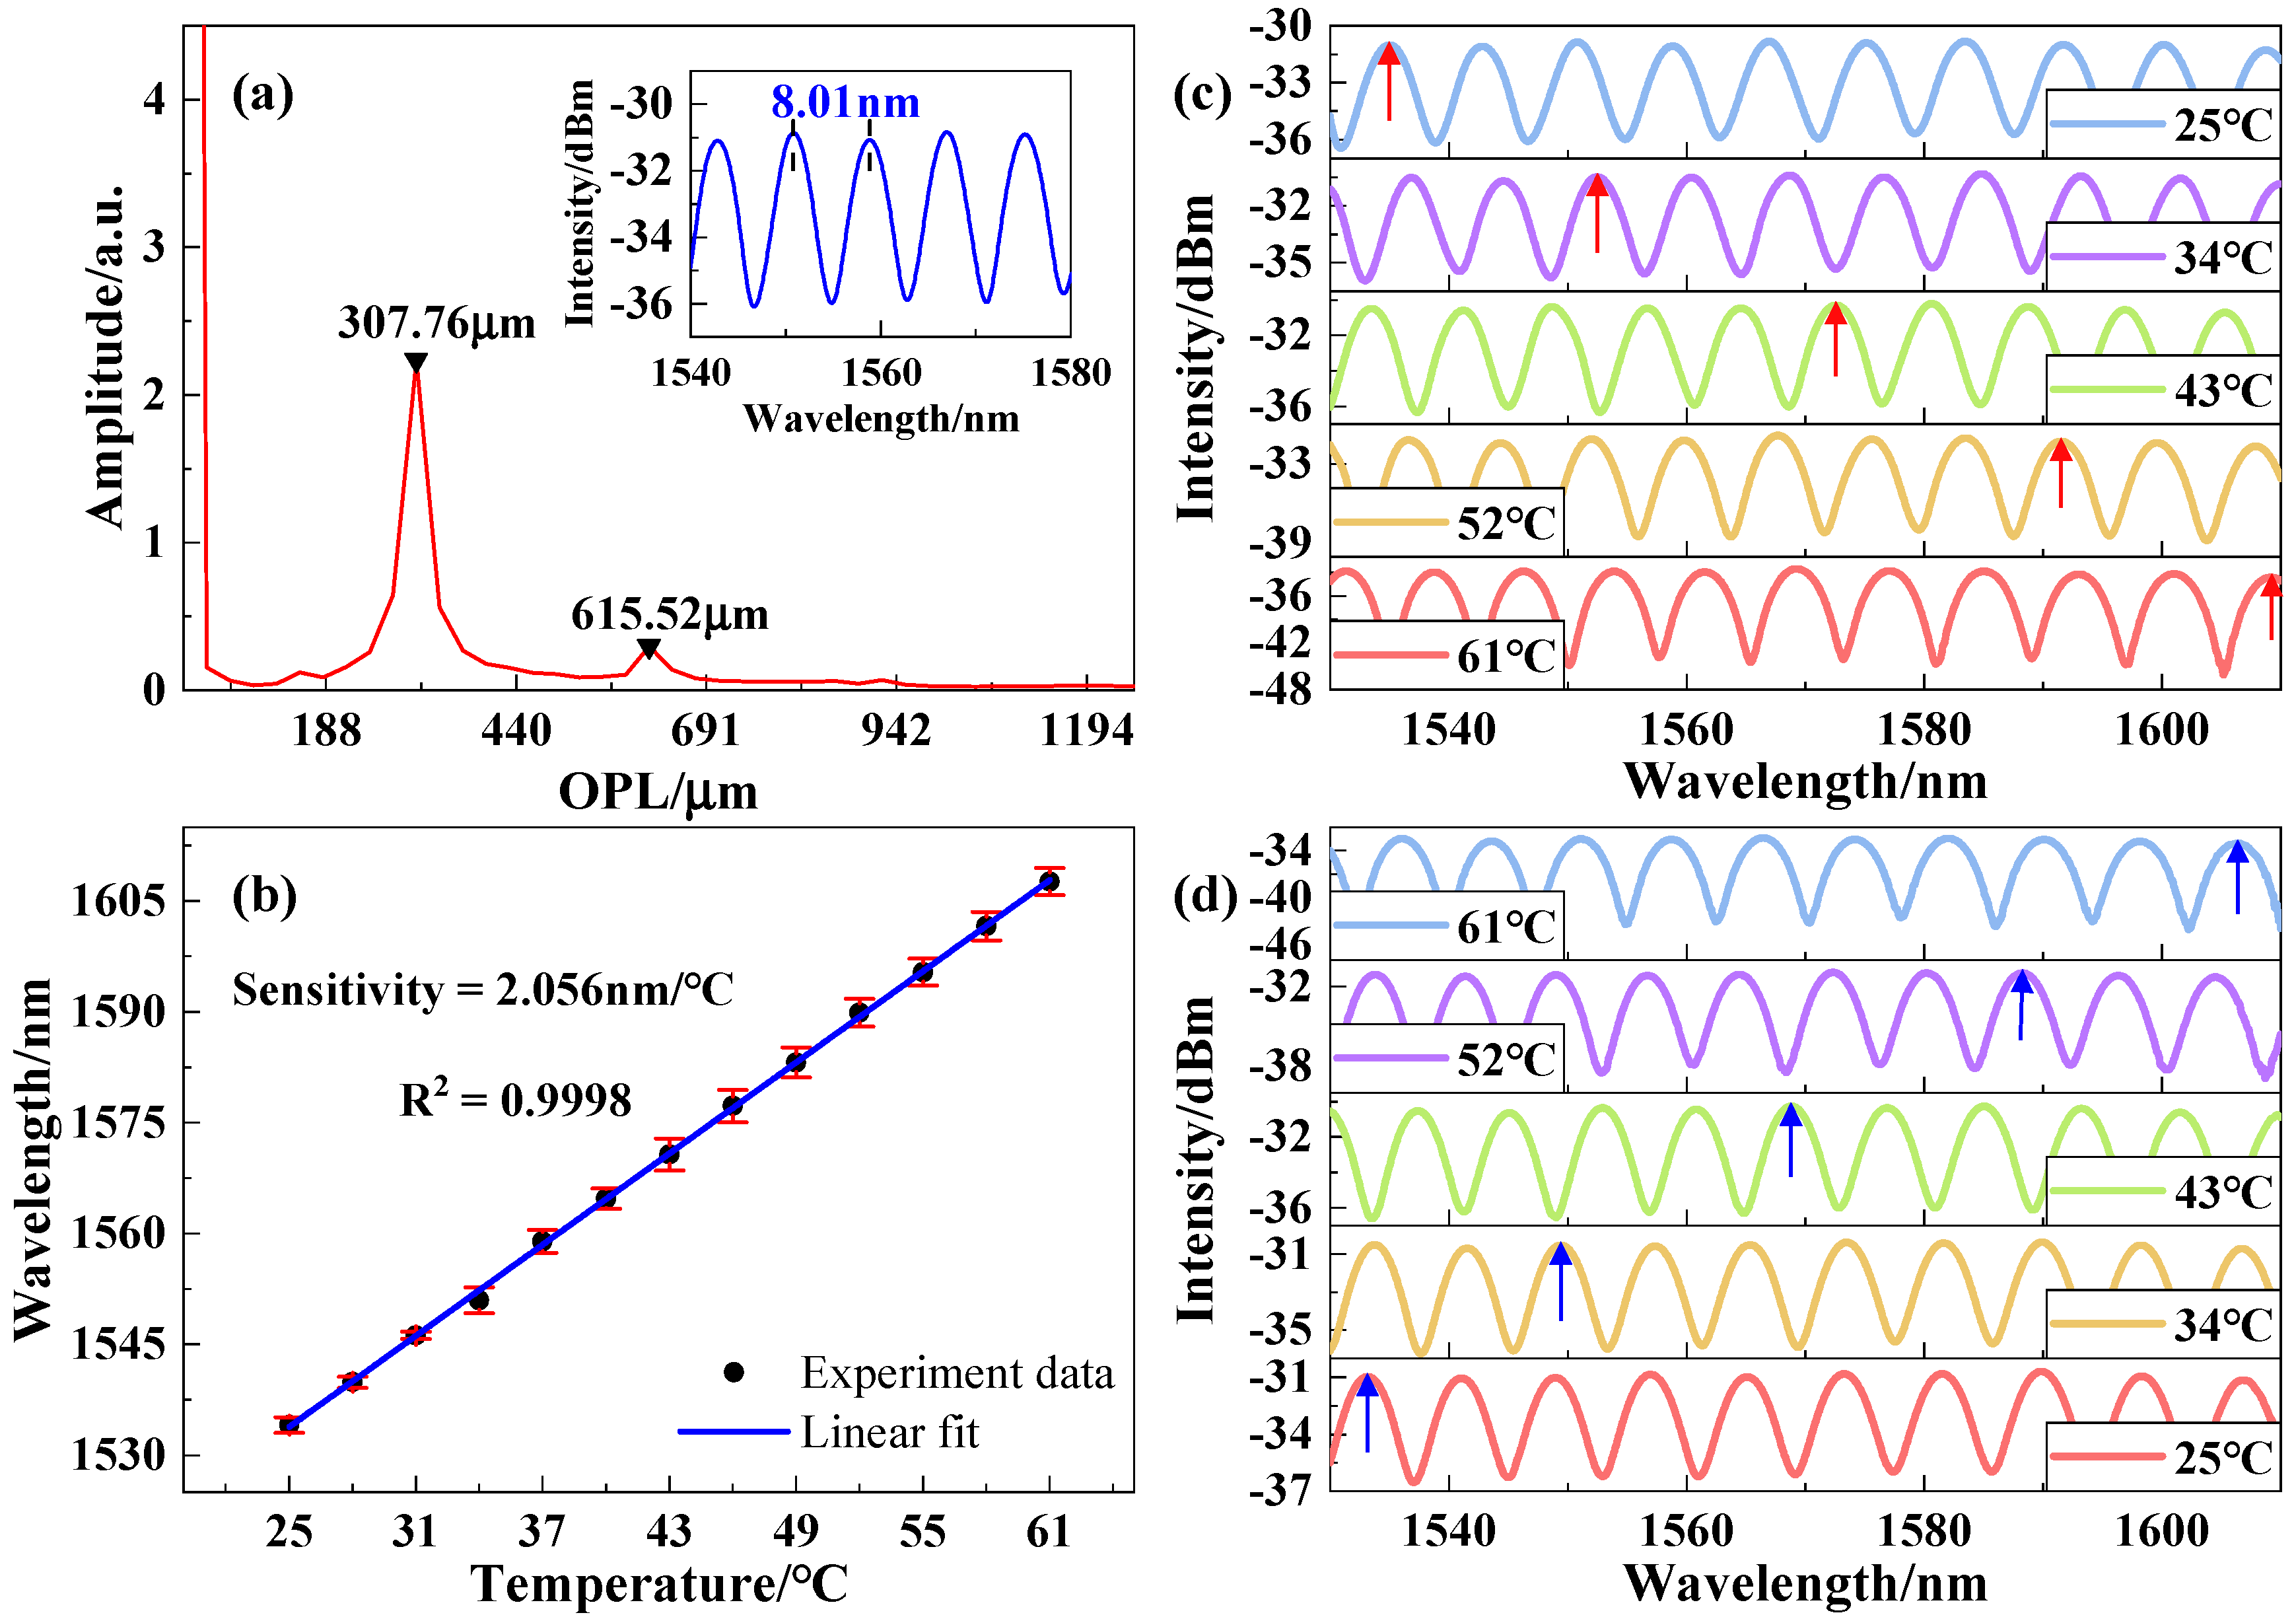
Figure 10. The sensing probe was fabricated by splicing a SMF with HF filled with PDMS, where the length of HF was 130 μm and the thickness of the PDMS was 108 μm. The PDMS was composed of a mixture of Sylgard 184-A and the hardener Sylgard 184-B in a ratio of 10:1. The FPI structure filled with PDMS was baked on a heating table (with an accuracy of 0.1 °C) at 80 °C for 3 h to complete the sensor. The measured reflection spectrum of the sensor and its FFT spectrum at 25 °C are shown in
Figure 11a, and its FSR and OPL were 8.01 nm and 307.76 μm, respectively. In the experiment, the heating platform was adjusted from 25 to 65 °C and from 65 to 25 °C, respectively, collecting data at 3 °C intervals.
Figure 11c,d displays the reflection spectrum of the temperature response of the sensor. The peak with a wavelength of 1534 nm moves to longer wavelengths as the temperature rises, while the cooling process moves to shorter wavelengths, where the total wavelengths shift from 25 to 61 °C is about 74 nm. The experiment was repeated for two cycles, and the average response of the probe along with error bars are shown in
Figure 11b. The linear fit temperature sensitivity of the sensor is 2.056 nm/°C and maintains a good linearity of 99.98%.
In order to generate the Vernier effect, we need to design the reference cavity. Therefore, the parameters (Wspan = 80 nm, N = 5 (1 °C), Ssensing = 2.056 nm/°C) can be substituted into Equation (11) to calculate the ratio D as 1.103 and 0.897, respectively. The comparison shows that the D is close to the inequality (D ≥ 1.1 and D ≤ 0.9), which can be solved by Equation (9). Therefore, the parameters of the reference interferometer can be selected according to Equation (8). Here D = 0.9 was selected as the configuration parameters of the reference interferometer. To facilitate the calculation, air is used as the material RI of the reference interferometer.
In the system configuration of the Vernier effect, the parallel configuration scheme was applied to prove the universality of our proposed method. The schematic diagram of the experimental system and the micrograph of the reference interferometer are shown in
Figure 12. The difference from the system scheme in
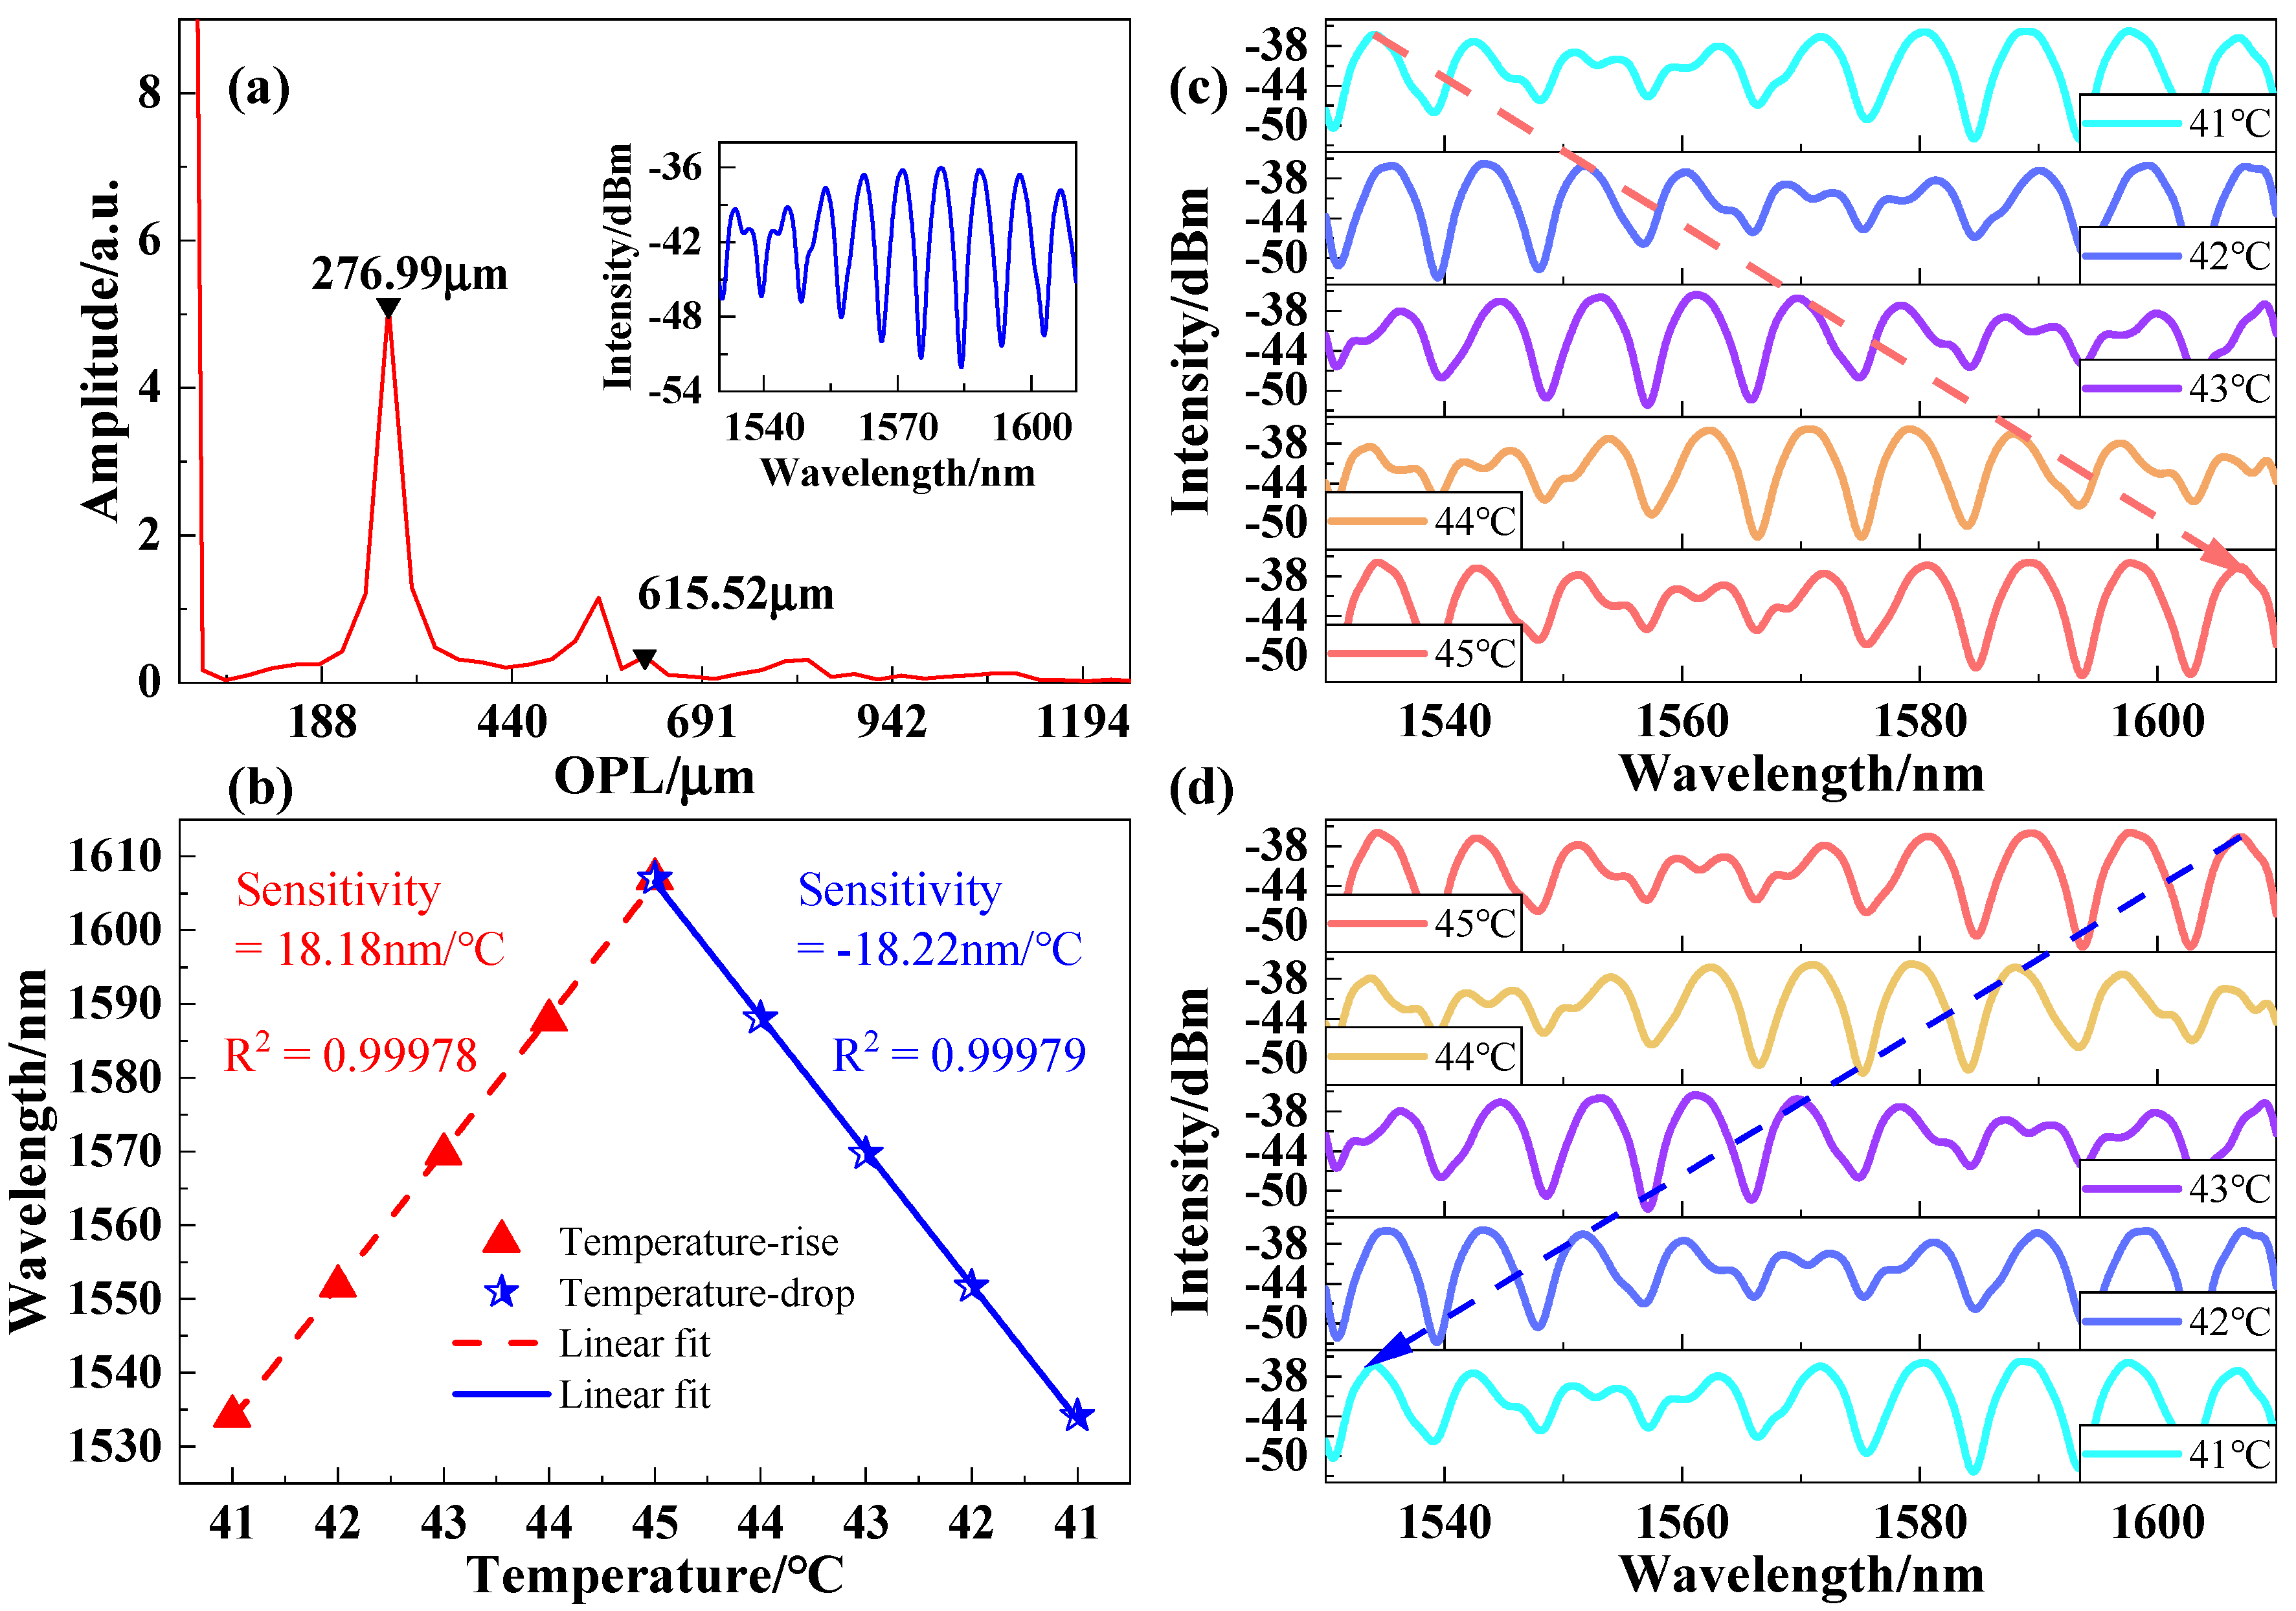
Figure 10 is that we have added a ring coupler to obtain the reference interferometer signal. The reference interferometer is composed of an HF with a length of 138 μm sandwiched by two SMFs. The total measured reflection spectrum of the sensor and its FFT spectrum at 25 °C are shown in
Figure 13a, and the OPL of the reference FPI is 276.99 μm and the double frequencies of sensing FPI is 615.52 μm. Therefore, the ratio
D can be calculated by Equation (8) to be 0.9, which is consistent with the designed value.
The temperature characteristics of the combination of the reference and the sensing FPI are tested by placing the sensors on a heating table with a temperature range from 41 °C to 45 °C. To clearly compare the interference spectra under different temperature,
Figure 13c,d shows the total reflectance spectra based on Vernier effect when the temperature rises and drops. The red discontinuous line represents the wavelength red shift as the temperature increases, and the blue discontinuous line represents the blue shift of the wavelength during the cooling process. To investigate the sensing characteristics of this sensor, the linear fitting results of the heating and cooling processes are demonstrated in
Figure 13b. The linear fitting sensitivity of the heating process is 18.18 nm/°C, and the linearity is 0.99978. In the temperature cooling process, the sensitivity is −18.22 nm/°C and the linearity is 0.99979. This shows that the sensor has good repeatability. The sensitivity of the cooling process with better linearity was selected as a reference. Thus, the sensitivity is enhanced 8.86 times, more than the single sensor without Vernier effect, which is largely consistent with the theory (
M = 9.72).
In this work, we studied the conditions for generating the Vernier effect and its applications in practice. Consistent with previous studies of Vernier effect [
28,
37], the envelope of the Vernier effect is regenerated when the OPL of the interferometer changes proportionally. However, we found that there is a regular expansion and contraction of the envelope during the regeneration process, which means that there is a turning point in the trend of change. Using this phenomenon, we demonstrated the effective range of the Vernier effect determined by inflection points, which provides a reference range for the generation of the Vernier effect.
In addition, in practical applications, when the envelope of the Vernier effect exceeds the bandwidth of the device, the sensing signal cannot be monitored. The researchers proposed controlling the length of the interferometer with the design of the magnification to solve this problem [
30]. However, if the sensitivity of the sensing probe is too high, the offset of the envelope will still be unmeasured. Therefore, within the effective range of the Vernier effect, we proposed a practical design method, considering the sensitivity of the sensing probe and the bandwidth of the device, which ensures that we can generate and track the Vernier signal. The experiment proves that the temperature sensing performance of the sensor made using the proposed method, which demonstrates a sensitivity of –18.22 nm/°C and an excellent linear fit in the range of 41–45 °C. The sensing performance of the proposed FPI temperature probe was compared with the recently proposed FPI temperature fiber sensors, as shown in
Table 2. The temperature sensitivity of the proposed sensor is the highest when compared to other sensors. Among them, compared to the sensor proposed in [
4,
8,
38], the sensor we proposed has higher sensitivity and occupies a smaller bandwidth. The measurement range of the proposed sensor is smaller than the sensor proposed in [
4,
38,
39], but we can change the design parameters to expand the measurement range, and this is at the expense of sensitivity.
To further improve the sensitivity of the Vernier effect, a light source with a larger bandwidth and a higher resolution device are required. However, a larger magnification means that the frequencies between the interferometers are close enough, which requires the accurate production of the corresponding reference sensor. However, all of these factors come at a huge cost. The combination with new technology is a way to improve the Vernier effect. For example, an effective way to improve the detection range of the Vernier effect is to use signal processing technology to expand the envelope periodically [
33]. The development of higher sensitivity also can be combined with new modes, such as the use of a low-mode interferometer to modulate the large envelope of the Vernier effect, which allows the excellent wavelength offset performance of the large envelope to be retained [
32].

 ,
, 


