1. Introduction
In the last decade, metal nanoparticles (NPs) have been at the center of significant research and development efforts due to their peculiar optical properties, arising from the unique interaction of their conduction electrons with electric fields. Such interaction is the well-known surface plasmon resonance (SPR) and is tightly dependent on the size and shape of the NPs, as well as their surrounding medium [
1]. In addition, noble metal anisotropic NPs, differently from the spherical ones, exhibit multiple surface plasmon resonances, mainly due to their shaped tips, which contribute to enhance the electric field by lightning rods effects, in turn resulting in a very high enhancement of metal optical properties [
2]. Potential breakthrough applications have been found for such kinds of materials in a wide range of fields, including sensing, biology, electronics, and catalysis [
3,
4,
5].
Recently, the attention has also focused on optoelectronic and photonic applications, due to their excellent third-order nonlinear optical (NLO) properties, in terms of a large third-order nonlinear susceptibility, an ultrafast relaxation time, the suitable modulation depth, and the saturation intensity of the noble metal NPs. Their plasmonic-driven NLO properties make them excellent saturable absorbers, which are the key elements of passively Q-switched or mode-locked pulsed lasers [
6,
7,
8,
9,
10].
Third-order NLO properties have been previously studied in plasmonic gold and silver nanomaterials [
11,
12,
13,
14,
15]. However, no systematic investigation has been made on materials according to their size and shape, with SPR spanning a wide spectral range in the visible and NIR. In previous works [
8,
9], we demonstrated the generation of dual-wavelength Q-switched and mode-locked pulses in Yb-doped all-fiber lasers at 1 μm by using Ag nanoplates (NPTs)-based SA, for achieving stable and low-cost pulsed lasers that could be used for spectroscopy and ultrafast photonics. Here, taking these results into account, we have broadened the study of the nonlinear response of Ag NPTs, investigating materials having an SPR that spans across the visible range and beyond. Using the z-scan method, we have, thus, investigated NLO properties both close and far from the laser excitation (532 nm). The origin of the effective absorptive nonlinearity is discussed based on combined nonlinear absorption in NPTs, nonlinear scattering, and changes in the nonlinear refractive index triggered by NPT-mediated light absorption. In view of further potential applications, including biomedical diagnostics and therapy, the high selectiveness of the SPR of Ag NPTs, as well as their corresponding optical nonlinearities, can be strongly significant for laser-induced biomedical photothermal processes. In this direction, several efforts have been conducted to study the energy absorption mechanisms in metallic spherical NPs, but an in-depth description of the nonlinear optical absorption mechanism for Ag NPTs has not yet been carried out. Furthermore, previous reports on Ag nanoparticles generally focused on the nonlinear characteristics of the materials excited by a laser wavelength near the resonance absorption peak. Here, we characterized the NLO response of Ag NPT colloids, prepared using an optimized seed-mediated growth method, and characterized by the SPR changing from 485 to 925 nm, thus covering the full visible spectrum and a small portion of the near IR.
2. Materials and Methods
Ag NPTs are synthesized by the well-known seed-mediated growth method [
16]. Briefly, spherical Ag nanoparticles, or seeds, are obtained by a reduction of Ag
+ (in solution as AgNO
3) by NaBH
4 in presence of trisodium citrate as stabilizer under stirring and cooling. After that, to grow seeds into NPTs, a set volume of the seed’s solution is added to a solution containing further citrate, hydrazine, and further AgNO
3. The volume of seed’s solution regulates the final size of the NPTs and, thus, the plasmon resonance position.
Optical absorption measurements were performed using a Cary 60 UV–Vis spectrophotometer by Agilent Technologies. Scanning Electron Microscopy (SEM) images were acquired by a ZEISS SUPRA 55 VP FE-SEM system. Atomic Force Microscopy (AFM) images were acquired using a Witech Alpha 300 RS instrument, while Scanning Transmission Electron Microscopy (STEM) images were obtained using a Zeiss-Gemini 2 electron microscope, operating at an acceleration voltage 30 kV, and a working distance of 4 mm.
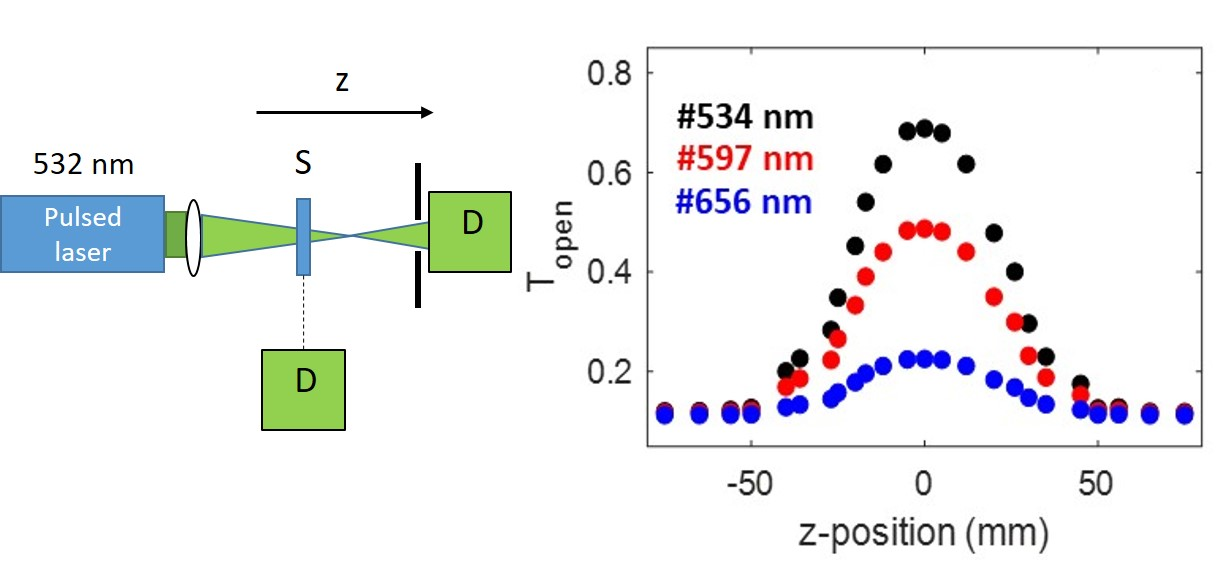
The z-scan technique, which was discovered by Bahae et al. [
17], is the most widely used method for indirectly measuring NLO properties. In this technique, the spatial distortion caused by a Gaussian beam’s profile in the far-field zone mostly during movement of a sample around the focusing of laser beam focus is investigated. In this work, NLO properties were determined using a pulsed Nd:YAG laser (532 nm wavelength, 5 ns pulse duration, 10 Hz repetition rate). The repetition rate of the laser was 10 Hz, which was low enough to avoid thermal effect [
18] and 1-cm-thick sample cuvette was moved along the focused beam. The incident laser beam was divided by a beam splitter into the following two portions: 20% of the reflected beam is sent to a first detector (D1) and represents the input signal, while the remaining 80%, focused by a 300-mm lens into the quartz cuvette, represents the transmitted power, which is measured by a second detector (D2). Moreover, the scattered light was simultaneously collected by a third detector (D3) mounted at 90° with respect to the laser propagation direction (
Figure 1a). The optical limiting (OL) threshold data were collected by the dual power meter performing nonlinear transmittance measurements as a function of the input fluence (
Figure 1b). After that, we determined the non-linear refractive index
n2, the non-linear absorption coefficient
β, and the 90° scattering efficiency
S in the open and closed aperture configurations. These measurements were carried out keeping the laser fluence constant at 0.5 J cm
−2 in the focal region and by moving the sample along the axis of the incident beam (i.e., z-direction) with respect to the focal point. Really, each z position corresponds to an input fluence of
, where
Ein is the input laser pulse energy [
19]. The transmittance was calculated by dividing the energy through the sample by that of the input sample. In the closed aperture configuration, a finite aperture (
d = 500 μm) was placed 300 mm away from the focal point (
Figure 1a). The experimental set-up was standardized using toluene, which yielded
n2 = 6.2 × 10
−7 cm
2/GW and a negligibly small value of
β = 2.5 × 10
−3 cm/GW corresponding to Re{
χ(3)} = 3.5 × 10
−14 esu and Im{
χ(3)} = 8.8 × 10
−16 esu, respectively.
3. Results and Discussion
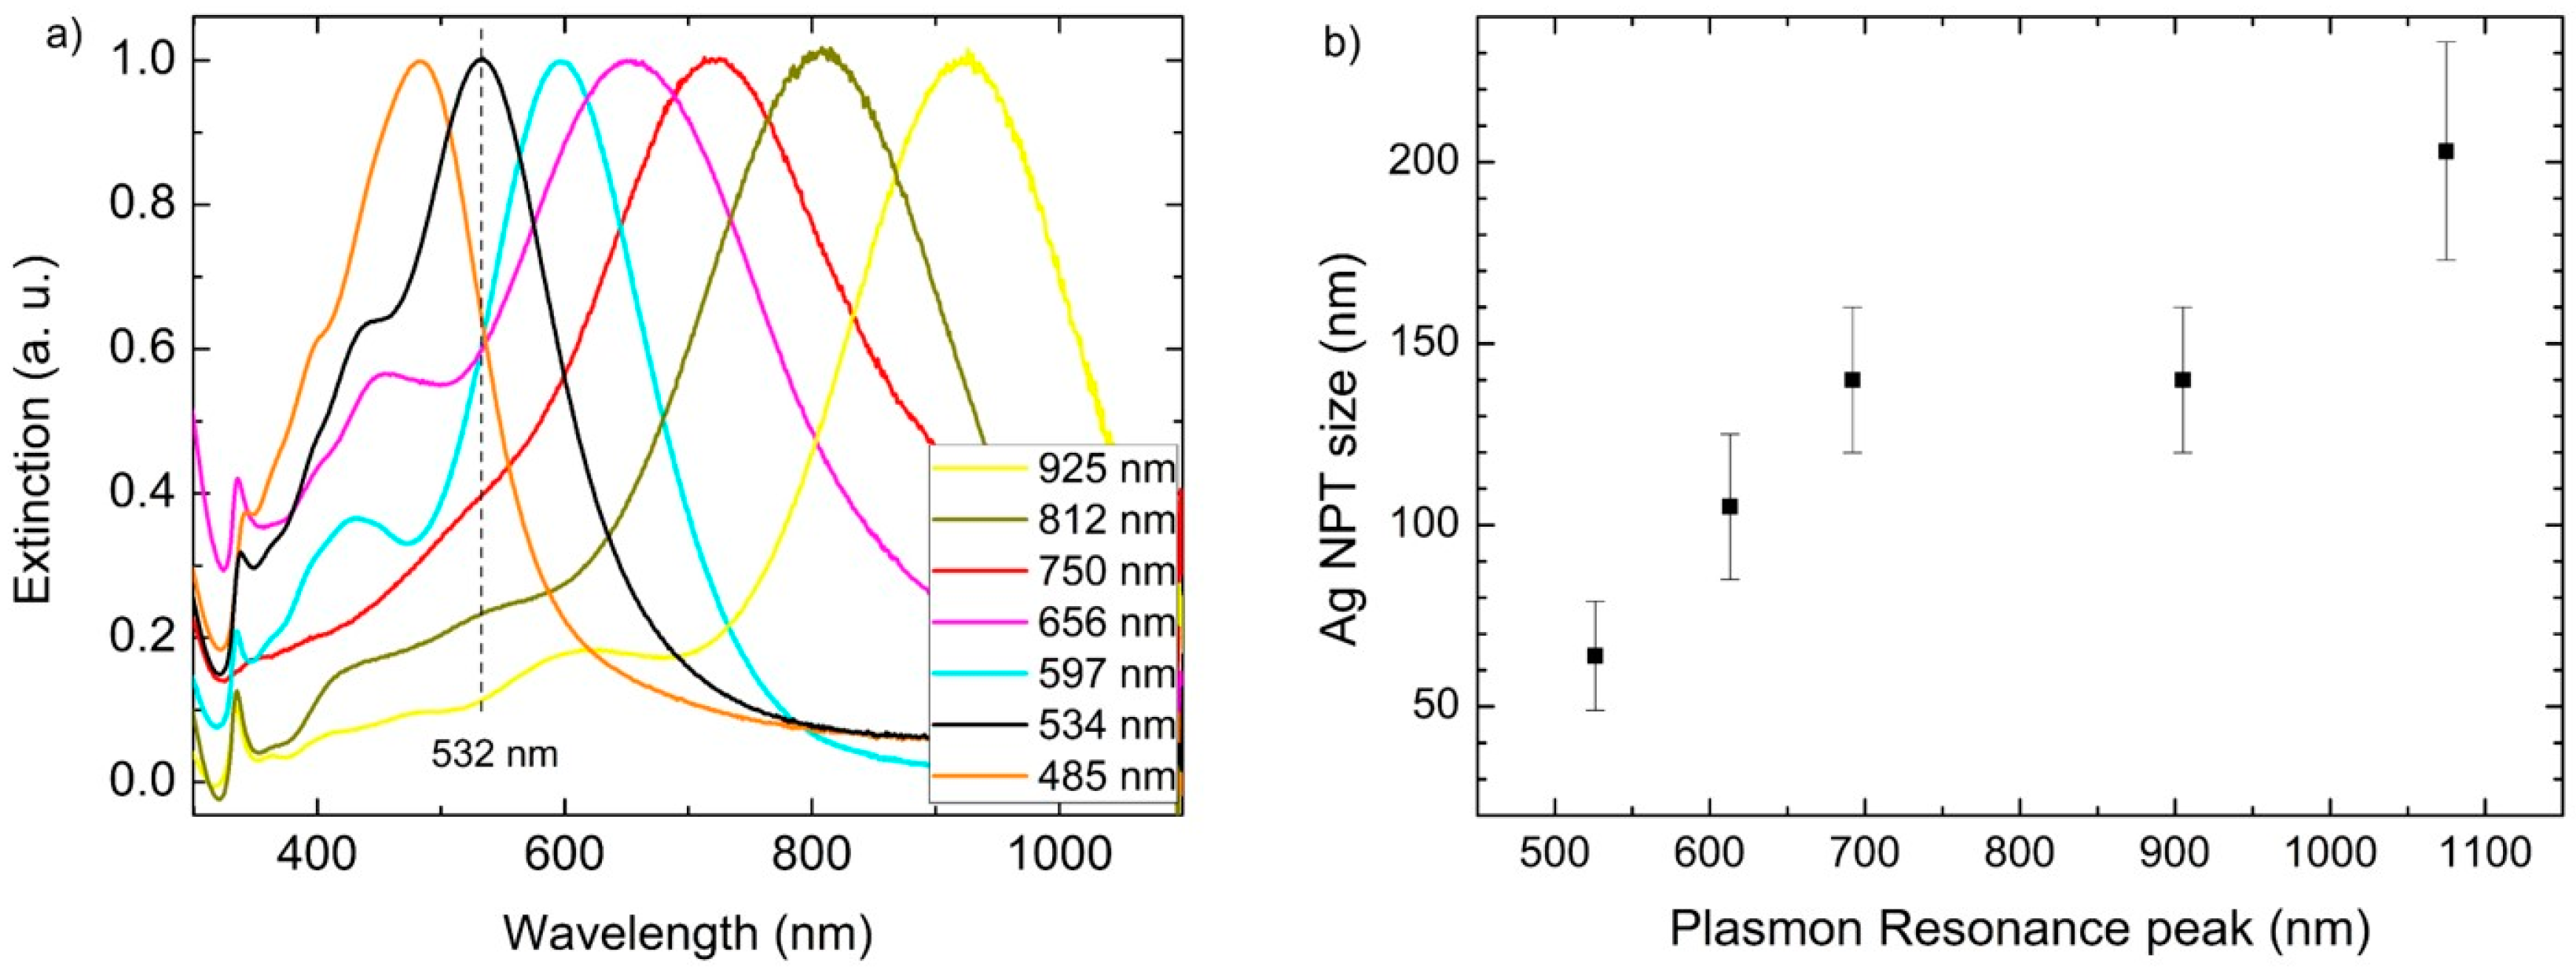
We prepared a wide range of Ag NPT solutions with SPR from 485 to 925 nm, thus covering the full visible spectrum and a small portion of the near IR.
Figure 2a shows the extinction spectra of such solutions. Each spectrum exhibits one main feature, the in-plane dipole plasmonic mode, the position of which we will use to identify the sample (e.g., sample #485 nm). The other important feature appearing in all the spectra is the out-of-plane quadrupole mode at 335 nm, which is distinctive for anisotropic Ag nanoparticles [
20]. Other features that appear in some of the spectra are the in-plane quadrupole and the out-of-plane dipole modes below 400 nm [
21].
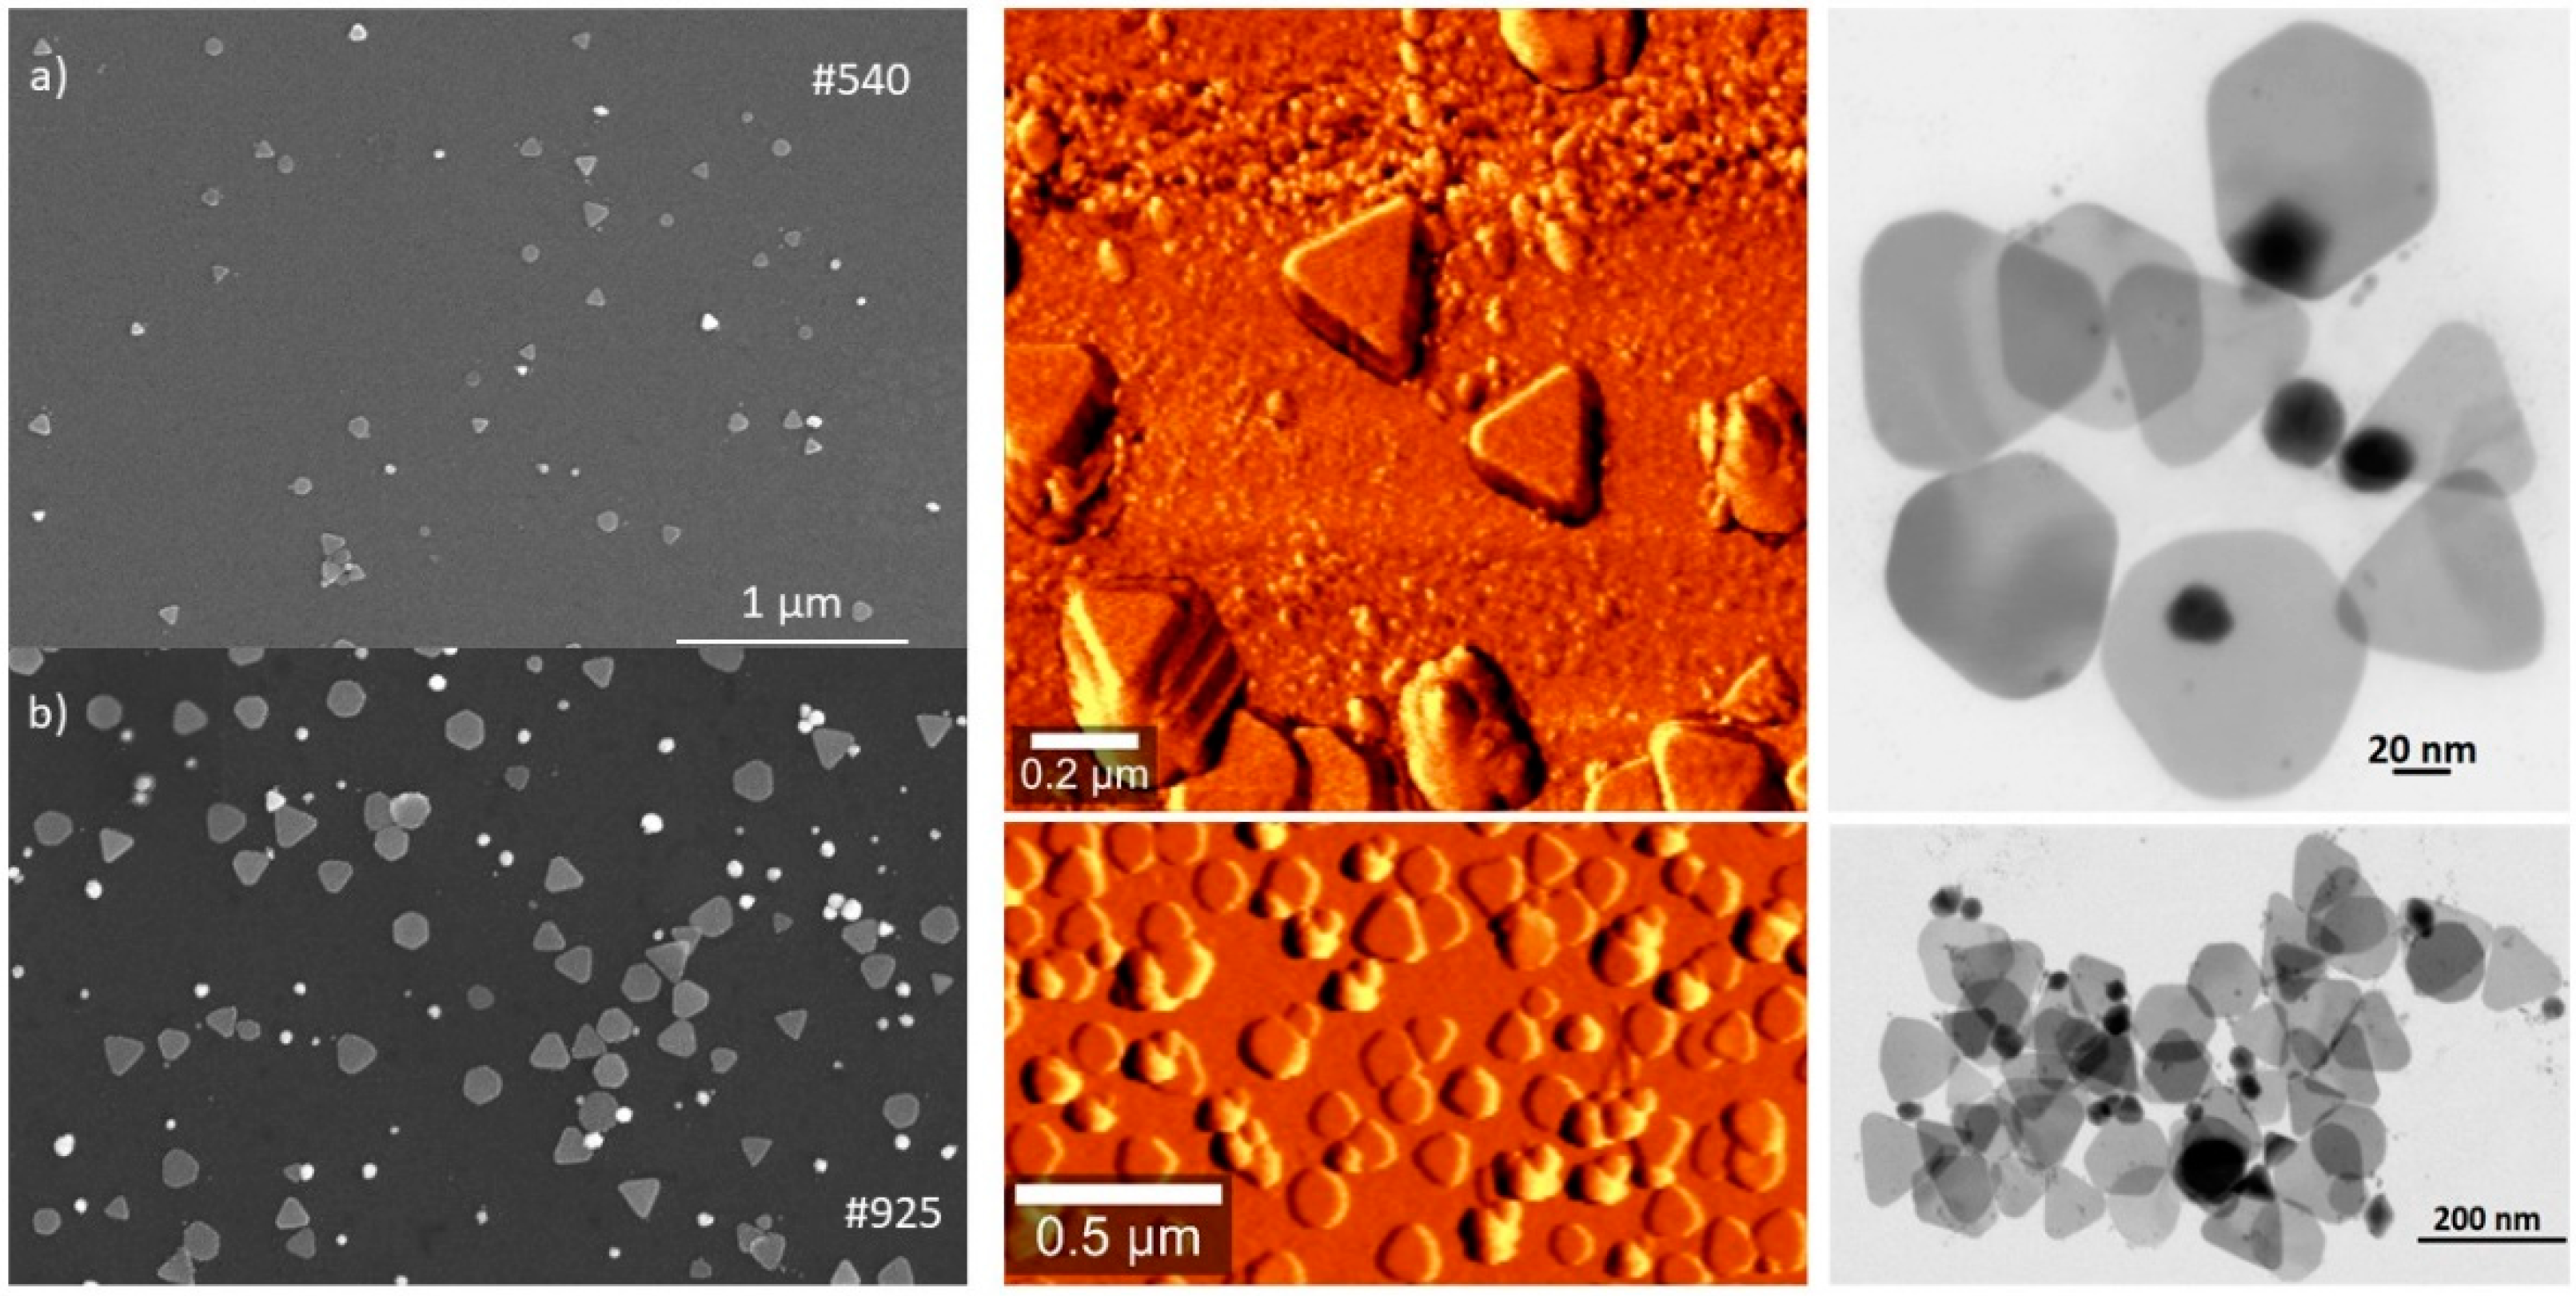
Figure 3 shows representative SEM, AFM, and STEM images of the samples #534 and #925 nm. NPTs have a mainly triangular shape, with the tips truncated or rounded. Hexagonal and round NPTs are also present in the mixture. For sample #534 nm, the NPT size is in the range 70–90 nm, while the NPT size is in the 120–160 nm range for sample #925 nm. A direct proportionality between SPR and NPT size was observed (
Figure 2b).
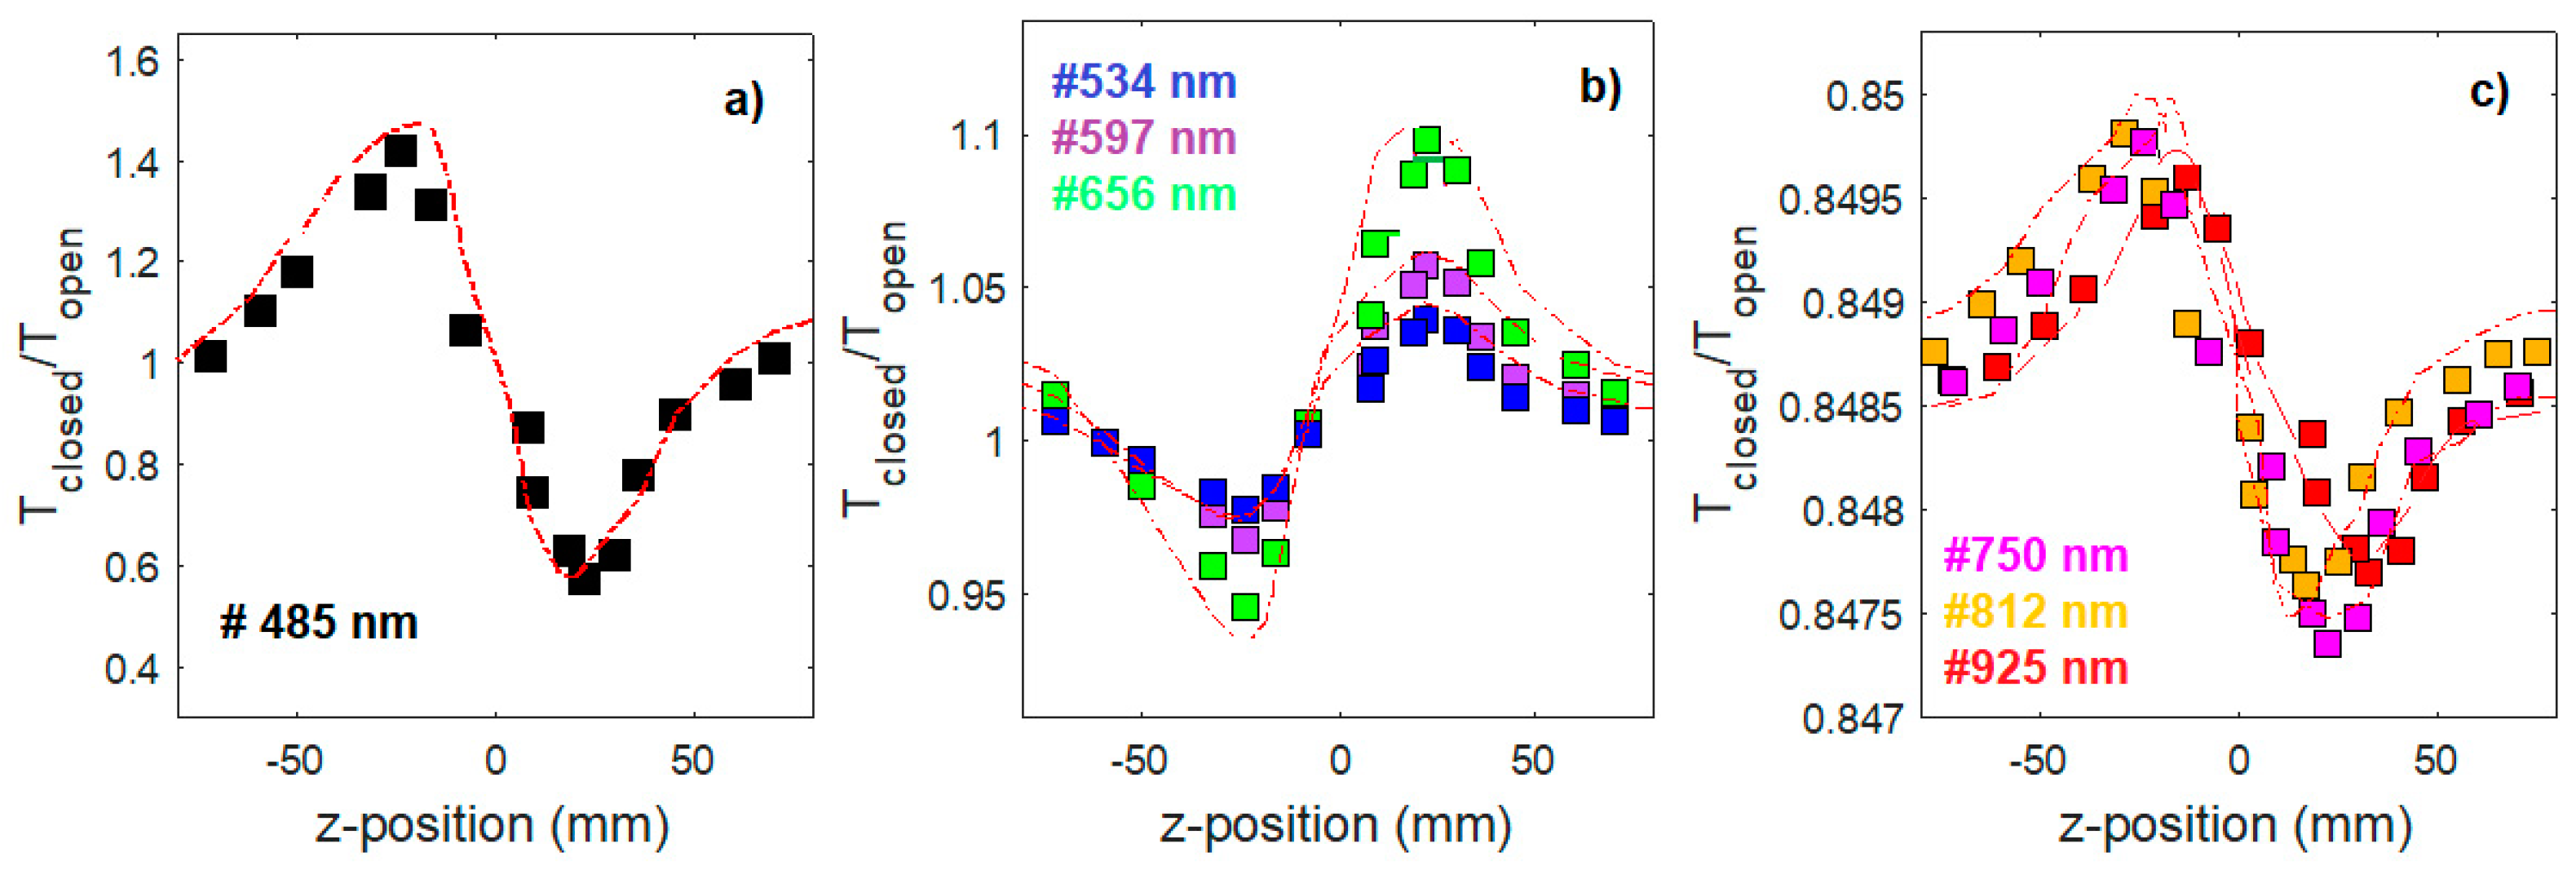
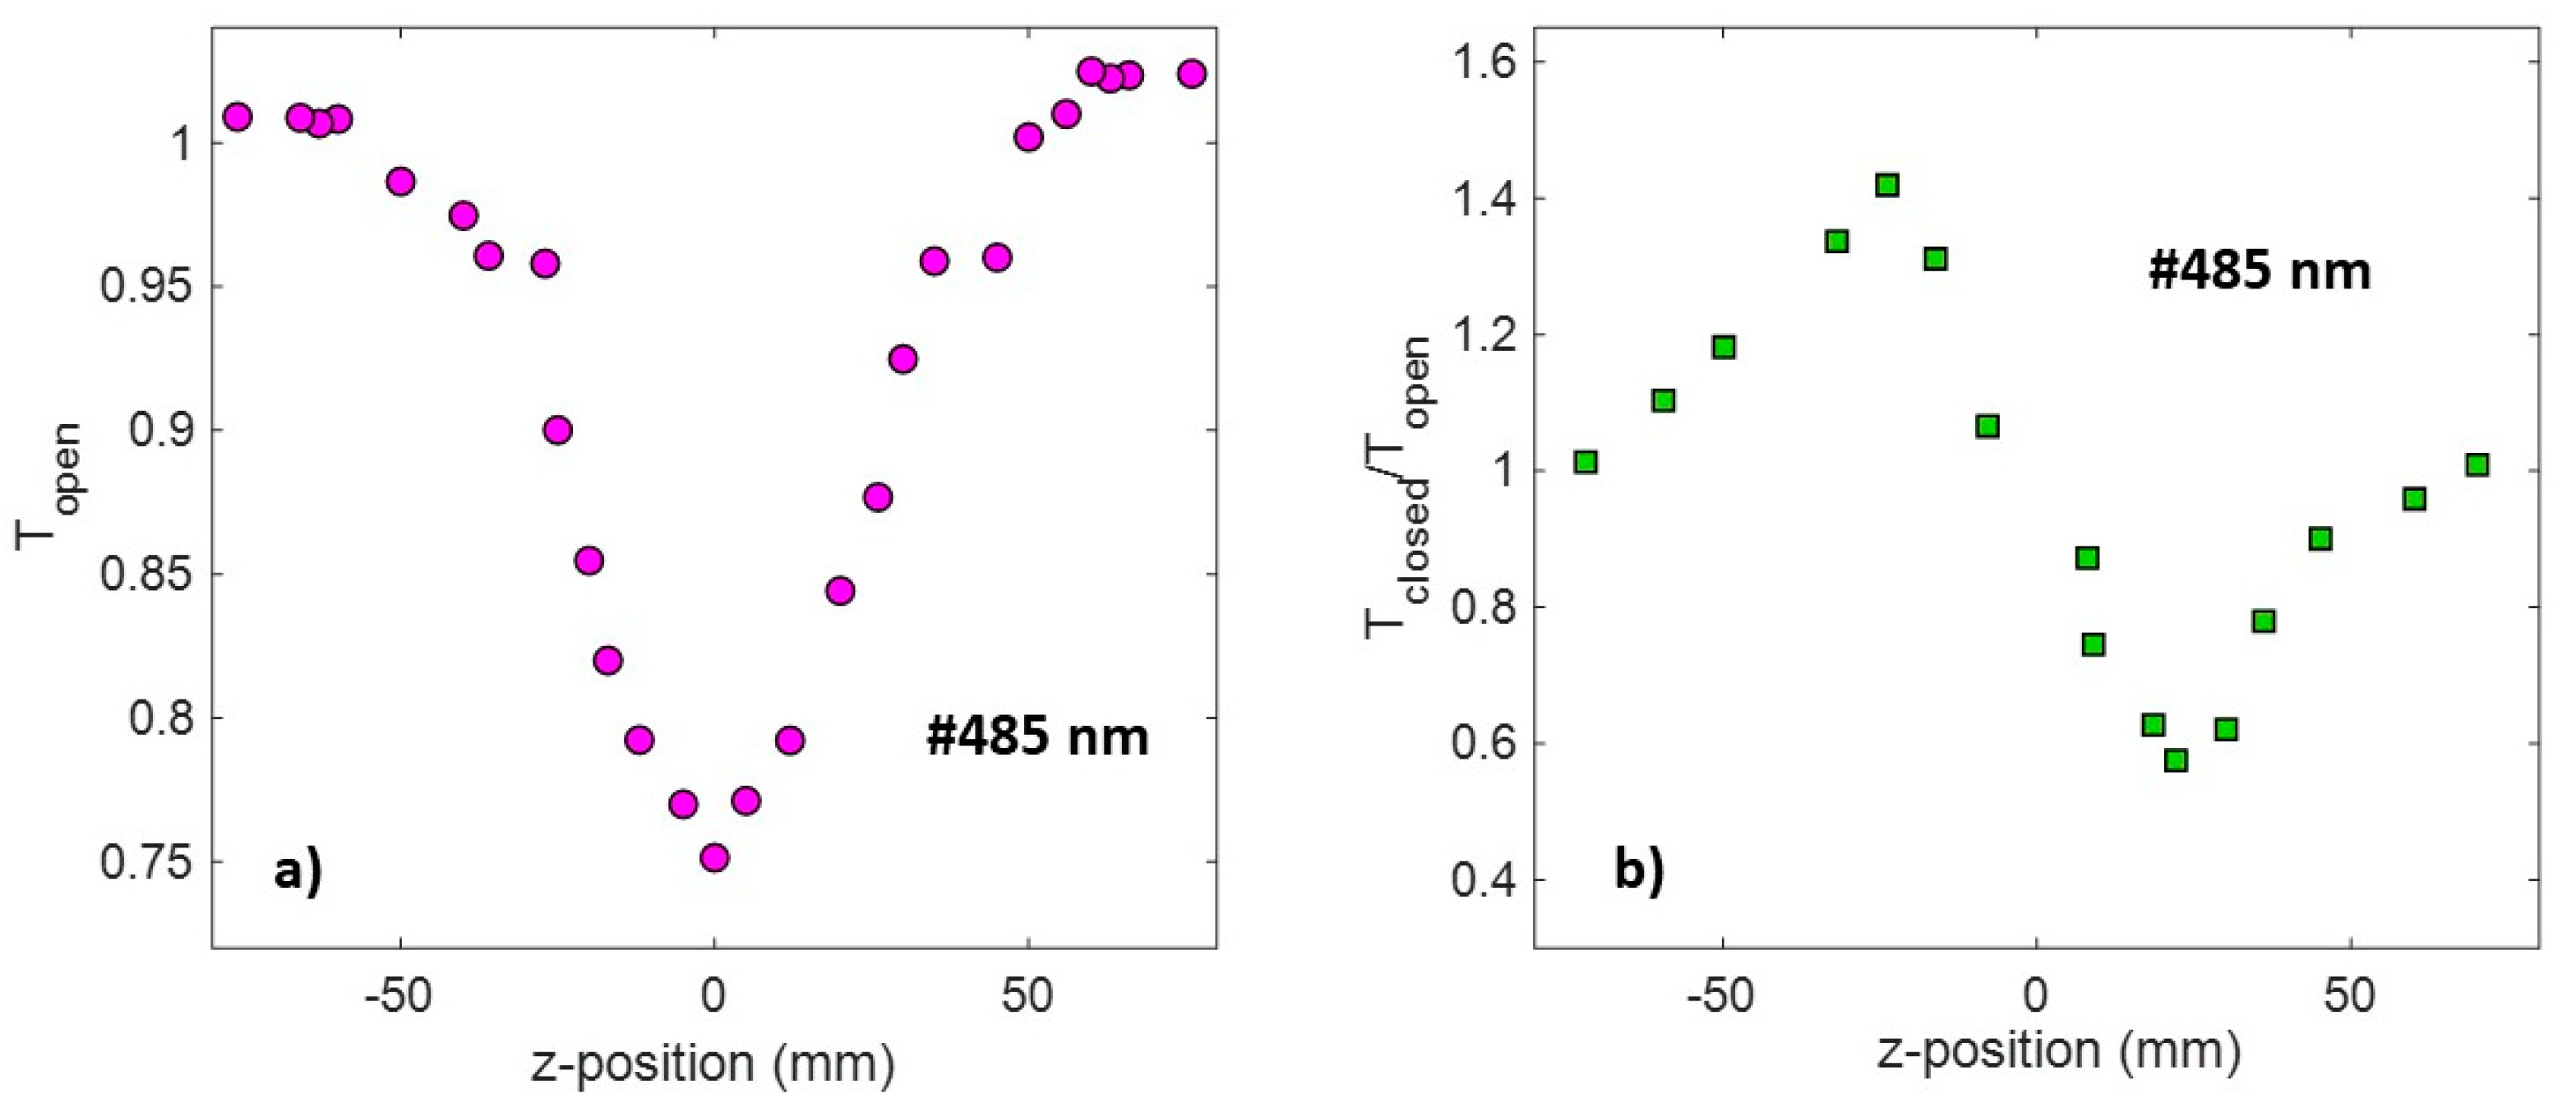
The open transmittance curve of the sample #485 nm (those with the SPR peak centered at 485 nm) shows a symmetrical minimum in the focus region (see
Figure 4a). This behavior implies that the mechanism that mainly determines its OL response is the nonlinear absorption mechanism (the dip is a feature characteristic of a reverse saturable absorption mechanism). First, the nearly symmetrical profile with respect to the focal point satisfies the following condition: Δ
Zp−v ∼ 1.7·
z0 where
z0 =
kw02/2 is the diffraction length of the beam,
k = 2π/λ is the wave vector,
w0 is the beam waist radius, and k is the laser wavelength. The occurrence of the above value confirms the presence of cubic nonlinearity and a small phase distortion. Furthermore, a prefocal transmittance maximum (peak) followed by a post-focal transmittance minimum (valley) is observed in the closed/open feature (see
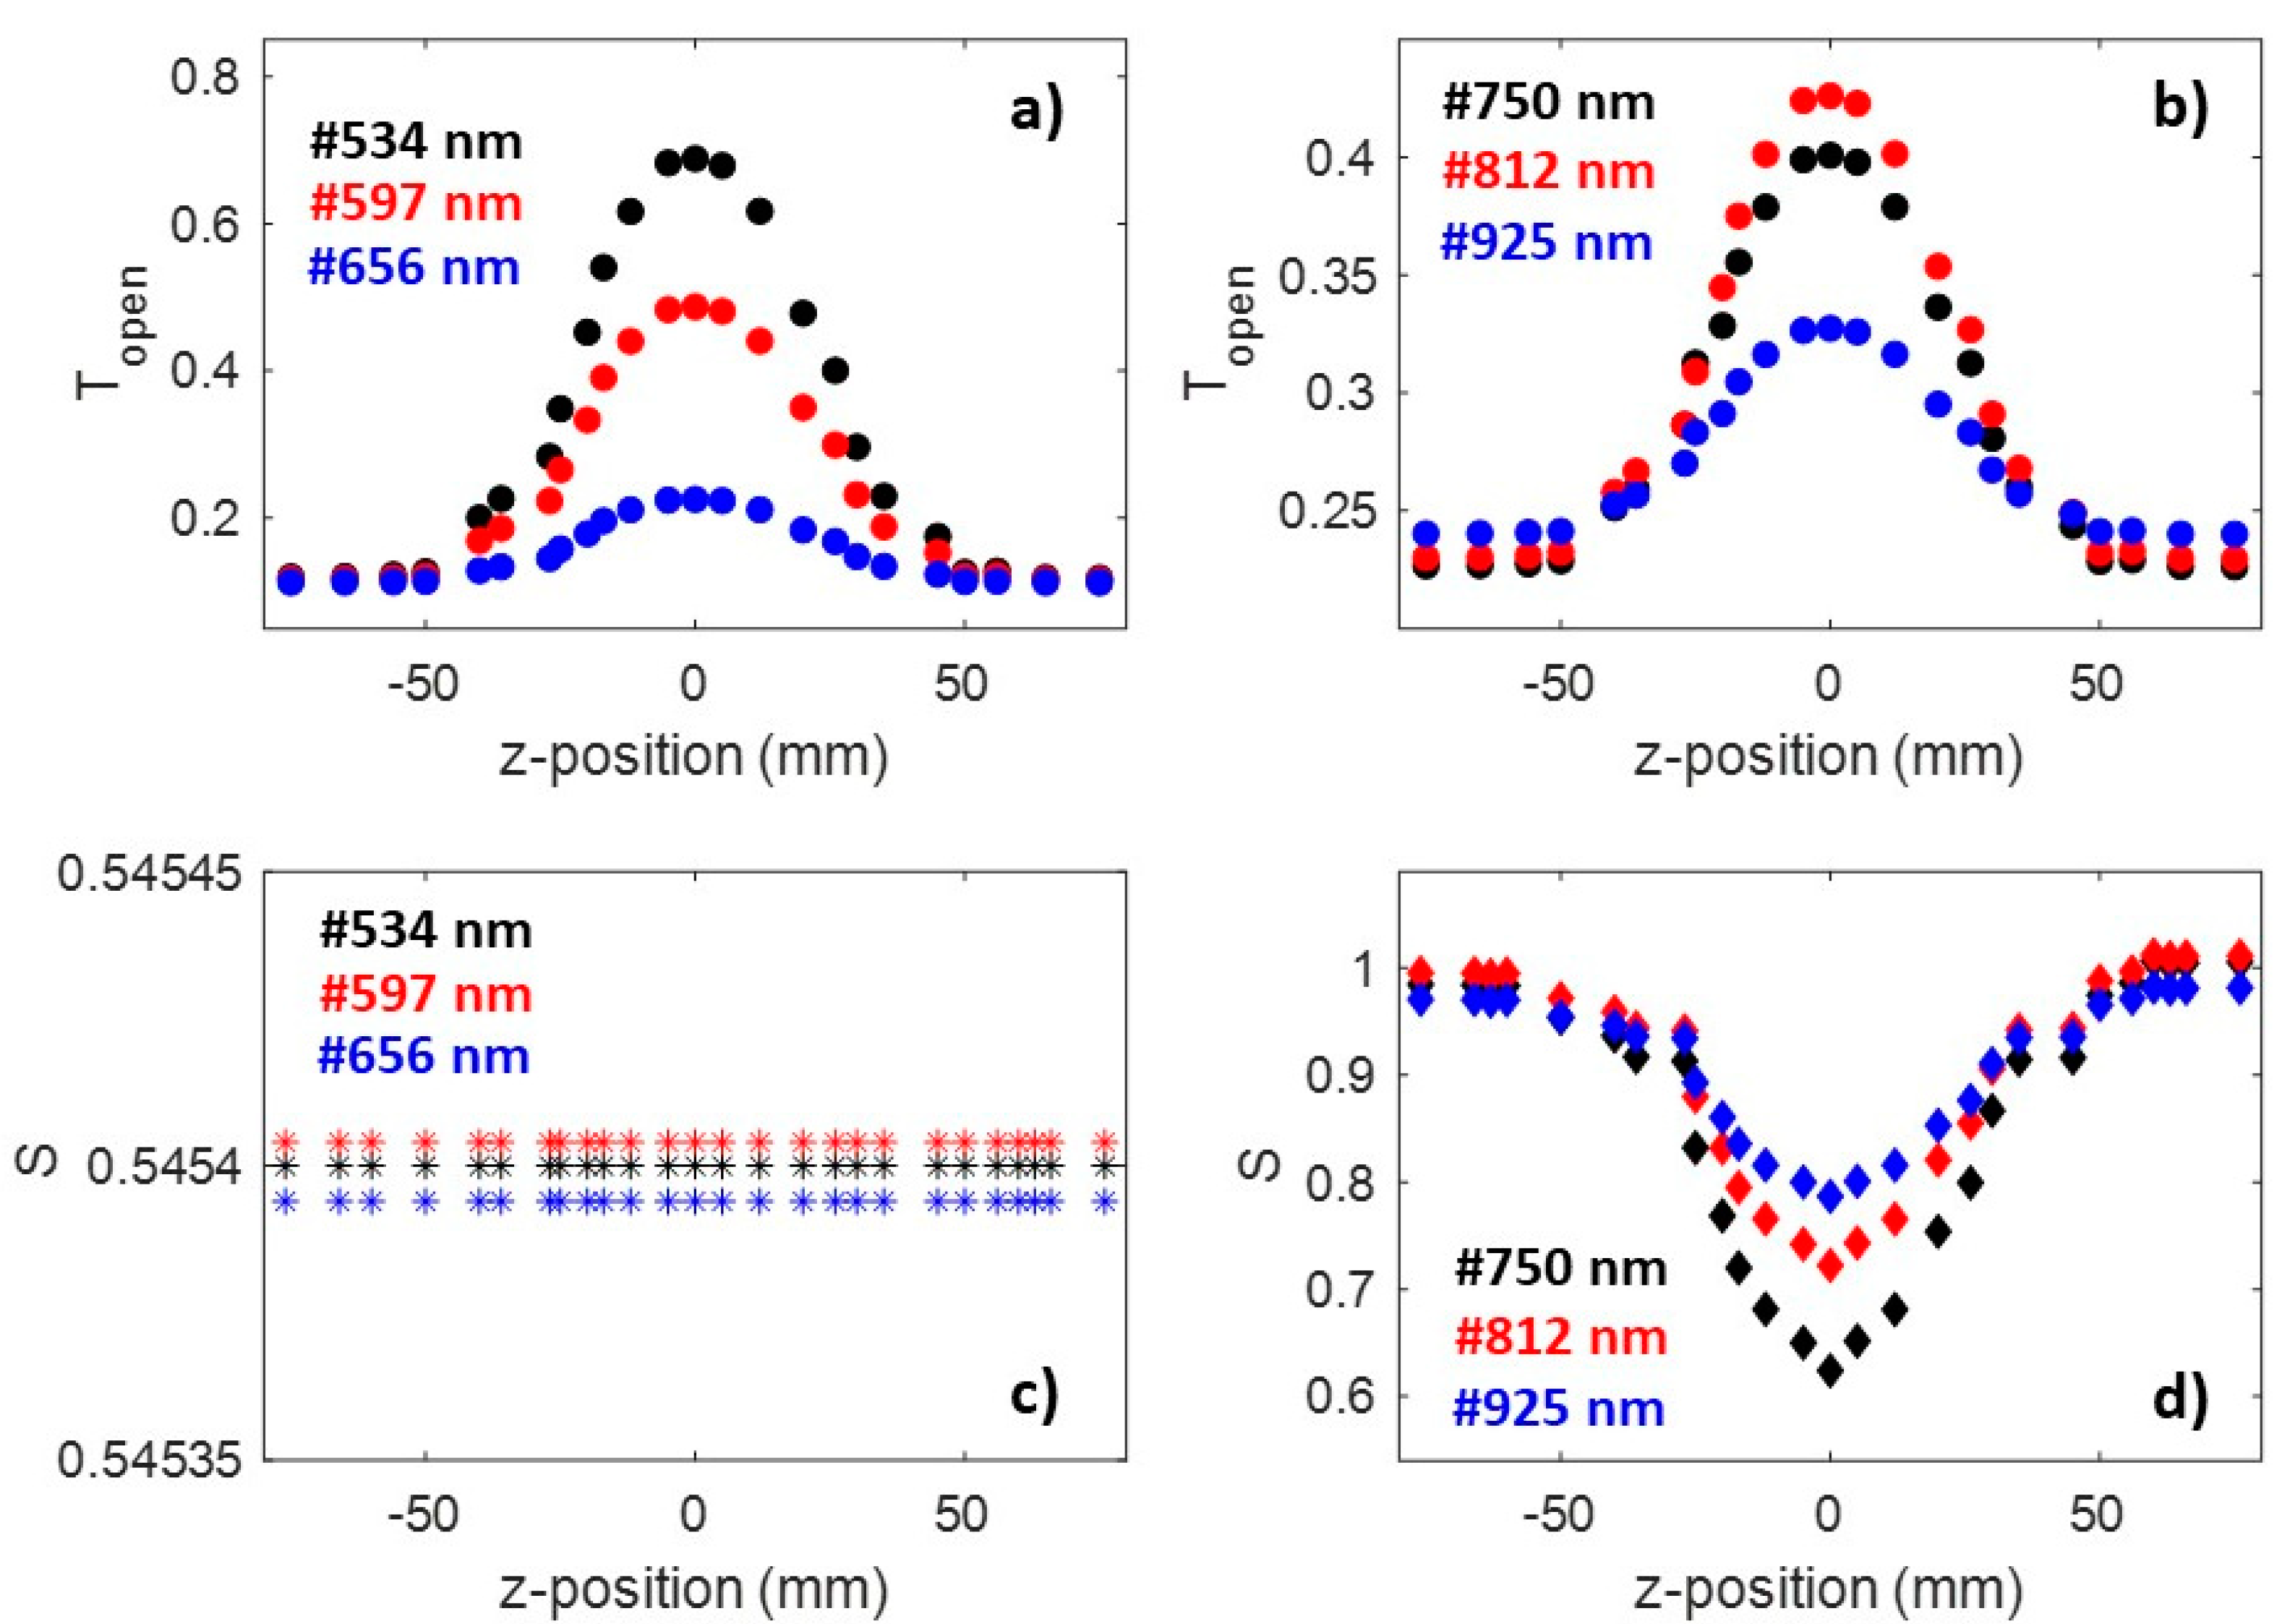
Figure 4b). The observed closed/open feature indicates a self-defocusing effect, as expected for most of the dispersive materials, and is mainly a signature of negative refractive nonlinearity. No scattering signal has been collected (not shown); hence, the nature of the OL response is effectively determined by the change of the refractive index. Then, z-scan experiments have been carried out on Ag samples with a SPR just above 500 nm (namely samples #534, #597, #656 nm), in resonance with the laser excitation (532 nm). As shown in
Figure 5a, the signal collected along the beam propagation direction (open configuration) is characterized by an increased transmittance symmetrical peak near the focus position (z = 0). This behavior implies that the mechanism that mainly determines the OL response is the Saturable Absorption (SA) one. In this case, the scattering contribution is also absent (
Figure 5c), while the refractive index change contributes to determining the nature of the OL response (
Figure 6b). However, the closed/open aperture features are different from those observed in all the other samples (
Figure 6). In this case, a prefocal transmittance minimum (valley) is followed by a post focal transmittance maximum (peak), indicating a positive sign of the refractive index change (
Figure 6b).
For the samples #750, #812, and #925nm, the scattering signal decreases in the focus region, showing a dip that reaches a minimum value around 0.6 (
Figure 5d), while the signal collected along the beam propagation direction (open configuration) is characterized by an increased transmittance symmetrical peak (
Figure 5b) near the focus position (z = 0). These trends indicate that the reduced scattering contribution affects the transmittance increase and, ultimately, the OL response of these samples. Moreover, a change of the refractive index is found (
Figure 6c).
A quantitative evaluation of NLO parameters was carried out according to the following theoretical considerations. The total absorption coefficient is described by the following relation [
22]:
where
α0,
I,
Is, and
β are the linear absorption coefficient, laser intensity, saturation intensity, and nonlinear absorption coefficient, respectively. The laser intensity is defined as follows:
where
I0 is the laser intensity at the focus. Hence, Equation (1) can be rewritten as follows:
The normalized transmittance is, thus, defined as follows:
where
and
Leff expresses the effective length.
The relation between absorption and transmission is also expressed by the following relation:
therefore, the normalized transmission can be expressed by the following equation:
This latter equation is used to fit the experimental data, where
α0 = 0.0458 m
−1 and
Leff = 0.01 m. Then, from the fitting parameters, we estimated the nonlinear absorption coefficient
β, the nonlinear refractive index
n2, the third order nonlinear susceptibility χ
(3), and, therefore, the molecular second-order hyperpolarizability
Γ could be measured using the following formulas [
17]:
where
Nc is the molecular number density in cm
3 and
L4 is the correction Lorentz local field-factor, approximated using [(
n02+2)/3]
4 for isotropic liquid media.
The transmittance is given by the following:
S = 1 − exp[(−2
ra2)/(
w02)] where
ra denotes the beam radius at the aperture in the linear regime and
w0 is the beam waist radius. With
β known, the z-scan with aperture
S < 1 can be used to determine the coefficient
n2. In this case, the closed/ open z-scan transmittance can be reproduced considering a geometry-independent normalized transmittance as follows:
where
x =
z/
z0 is the relative coordinate, ΔΦ is the parameter that determines the normalized transmission near the focal plane as a result of nonlinear refraction, ΔΦ =
kγI0Leff,
γ is the nonlinear refractive index, and
ρ =
β/2
kγ. Finally, knowing
β, the nonlinear scattering coefficient
αs was estimated, taking into account that the transmitted intensity through the sample is given by the following:
From the fitting results, the nonlinear absorption coefficient
β and
n2 values for sample #485 nm are found as follows: 1.2 × 10
−11 cm/W and −4.1 × 10
−18 cm
2/W, respectively. On the other hand, a negative
β sign is found for the samples #534, #597, and #656 nm and are equal to −1.9 × 10
−9 cm/W, −7.6 × 10
−10 cm/W, and −5.2 × 10
−11 cm/W. For these samples, the coefficient of nonlinear refraction was determined from the fitting to be of the order of 5.8 × 10
−18 cm
2/W. In all these sample, no significant scattering contribution was found. Finally, for the samples #750, #810, #925 nm, the scattering effects determine the NLO response. The estimated values of
αs range from 4.57 to 5.18 cm
−1. Moreover, for the samples #750, #810, and #925 nm (with an average size of 100 nm and an SPR band rather broadened than the other cases), a negative sign of
n2 was found, as in the sample #485 nm. The change of the sign of the refractive index could be due to NPT orientation, alignment and aggregation under the external highly intense electric field, used during the z-scan measurements, and/or to a “thermal lensing effect” at the focal point. In this latter case, the change in the refractive index usually follows the beam shape, thus forming a lens within the medium. However, on a nanosecond time scale, refractive-index variations that are due to the expansion of the medium generated by local heating (absorptive mode) or by compression that is due to the electromagnetic field of the laser beam (electrostrictive mode), described by the well-known acoustic-wave law [
23], are highly transient.
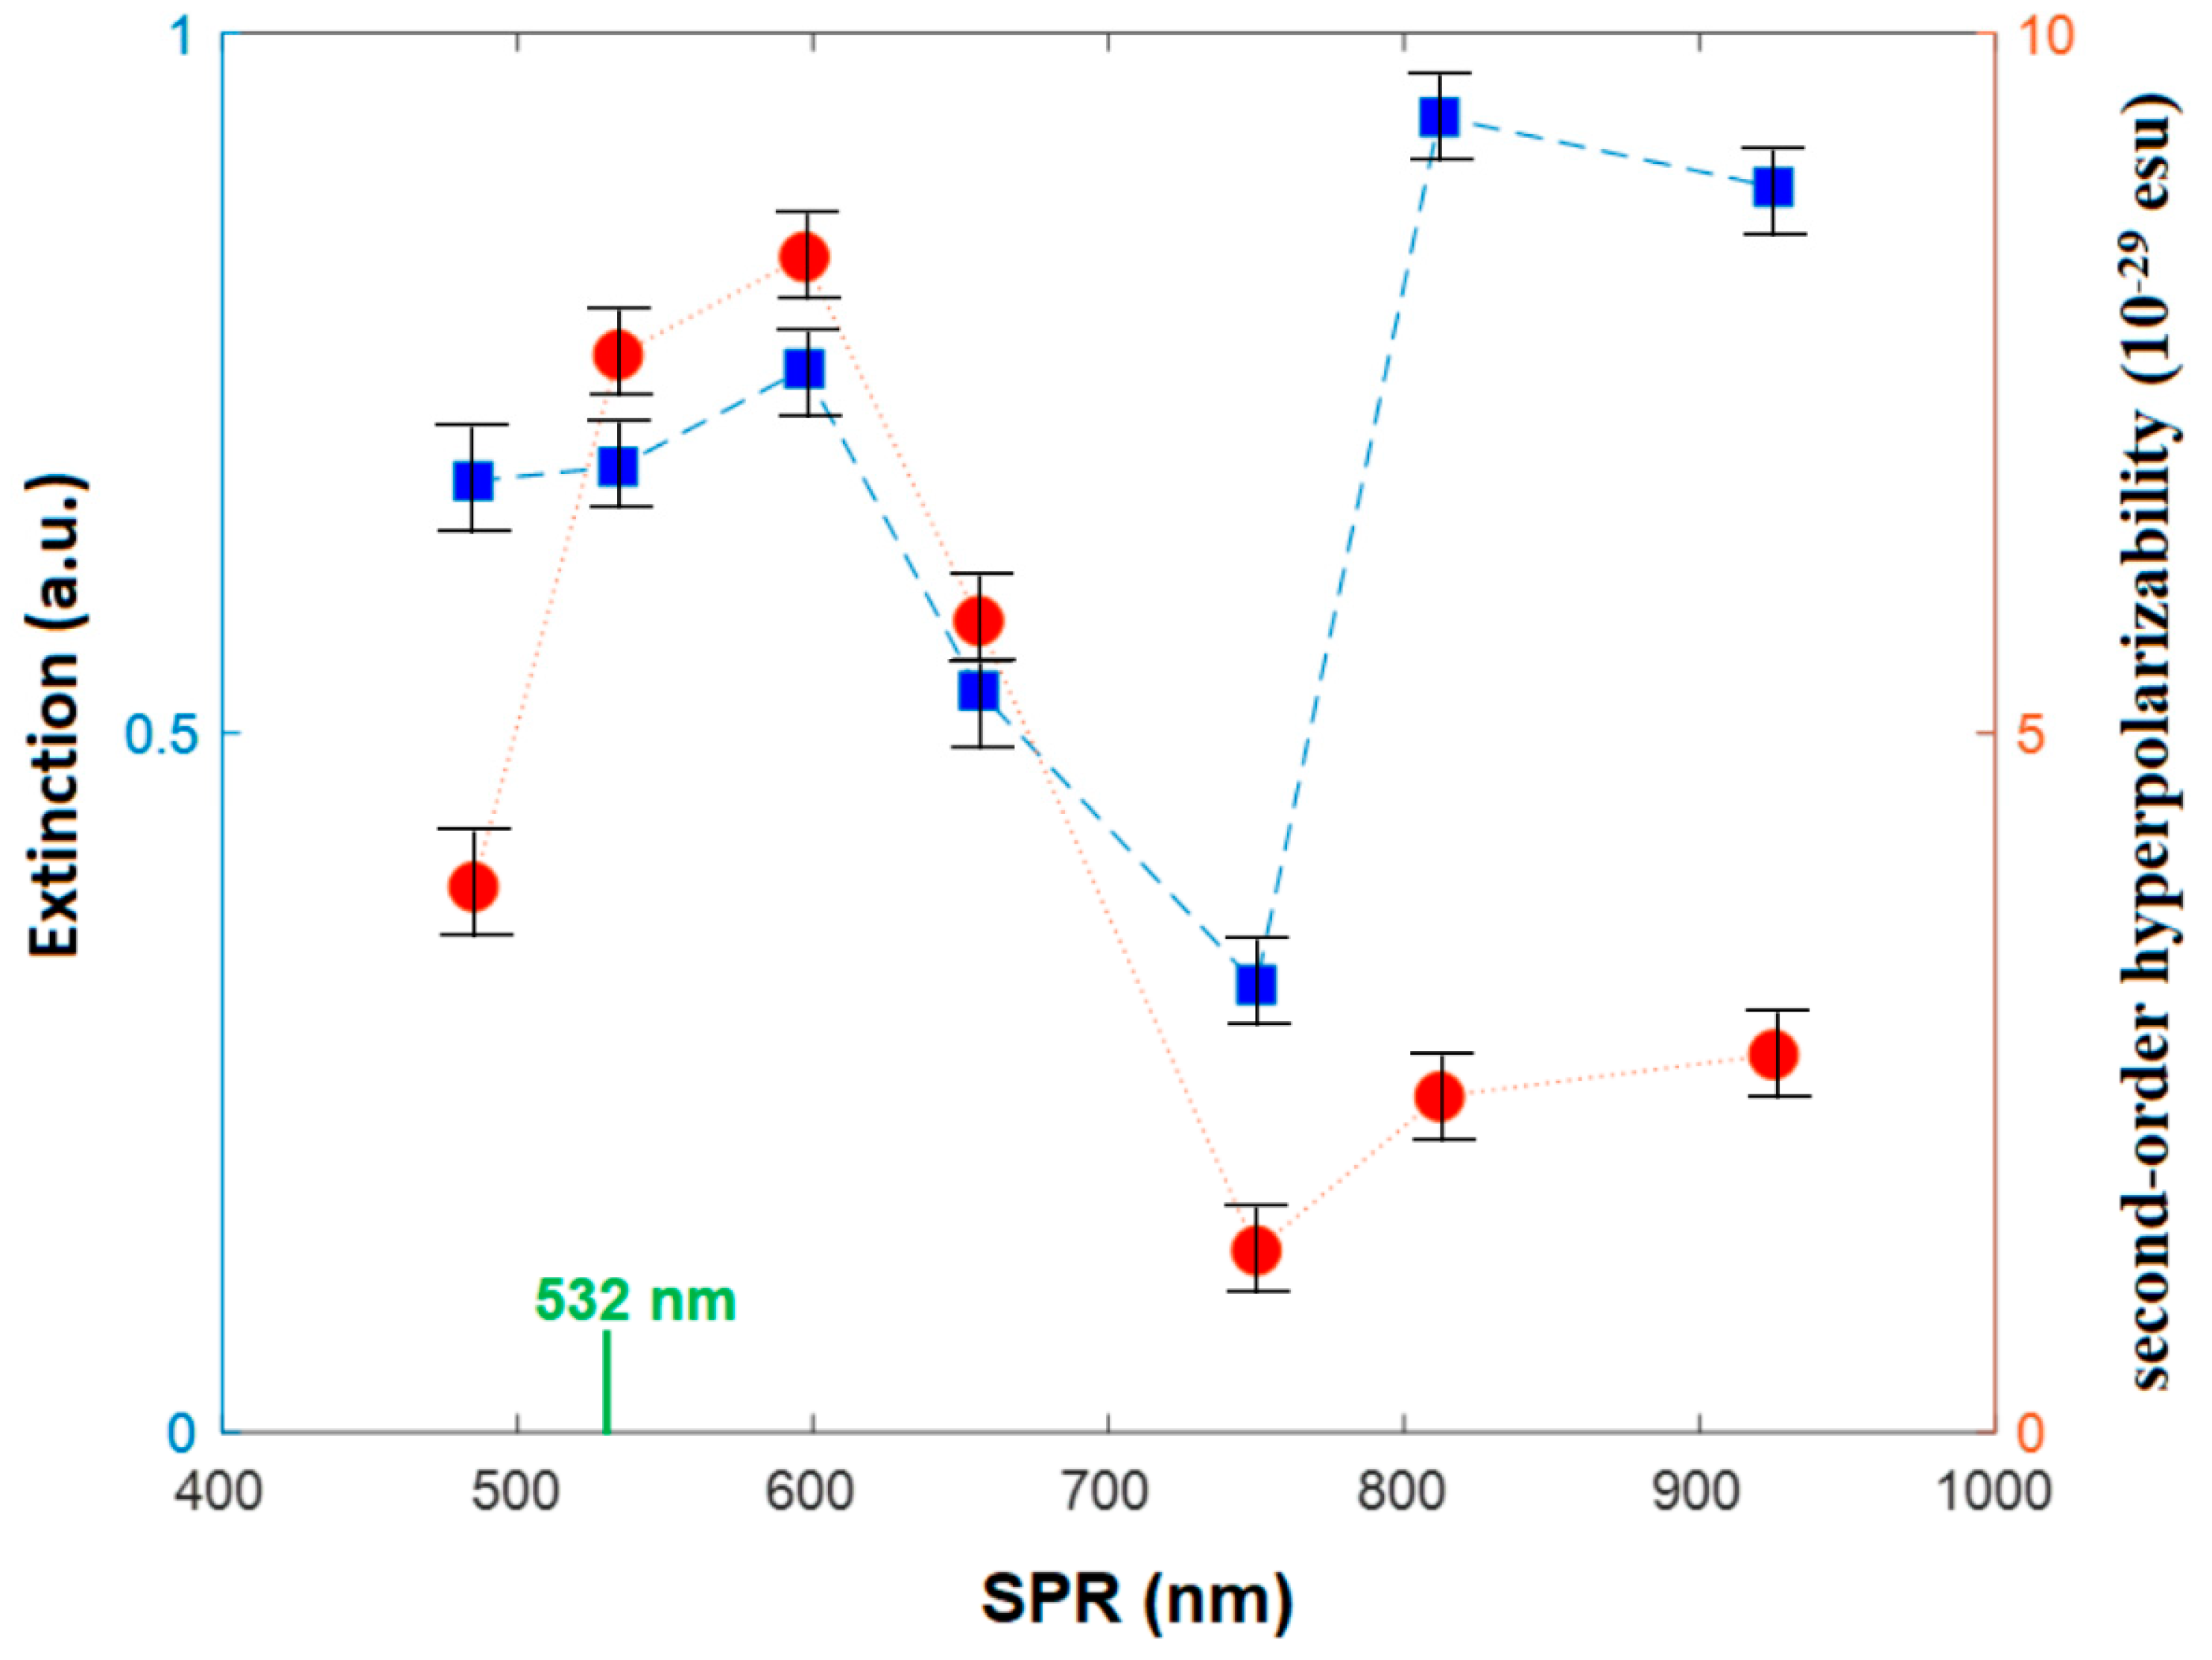
On the overall, a clear correlation between the SPR change and the OL trend has been observed. Specifically, when the samples show an SPR in resonance with the laser excitation used to perform z-scan measurements, an SA mechanism occurs while, far from the 532 nm excitation source, the refractive index change and/or the scattering effects contribute to the OL response. As shown in
Figure 7, the NLO response is SPR wavelength-dependent; as a function of SPR position, the molecular second-order hyperpolarizability
Γ rises going from the sample #485 nm up to sample #597 nm, to then decreases in the next two samples (#656–#750 nm) following the linear extinction efficiency. The molecular second-order hyperpolarizability
Γ (as well as the linear extinction values) slightly increases again in the samples with the SPR located at the highest wavelengths. Nevertheless, for these samples (#812–#925 nm), the
Γ values are significantly lower than those estimated for the samples (#534 and #597 nm) whose SPR is in resonance with the laser excitation used for the z-scan measurements (see
Figure 7). The wavelength-dependence of the optical nonlinear absorption in Au-Ag nanoparticles is already reported in reference [
24]. However, in our case, the scattering effects are also analyzed.
A possible interpretation of this behavior is that each of the nonlinear processes (SA, scattering, and self-focusing/defocusing) dominates in a different intensity range, resulting in an NLO response strongly affected by SPR parameters (intensity and position), which, in turn, depends on the NPT size and distribution. Specifically, a pronounced photoinduced NPT aggregation and reorientation could have taken place at a higher energy density (in the focal region). As already discussed in reference [
25], studying the NLO mechanisms of Ag@ZnO nanocolloids, the presence of a non-uniform field in the focal region, where there is a strong intensity gradient, facilitates the aggregation/trapping of the nanostructures and mainly induces the alignment of the asymmetrical particles [
26]. Again this explanation is in good agreement with what is reported in reference [
27], where the results of finite difference time-domain simulations have allowed the OL behavior of plasmonic nanostructures to be modelled as the result of an effective nonlinear extinction process, which is enhanced by the near-field plasmonic effects via the locally magnified electric fields. As described by Liberman et al. [
27], the combination of experimental results and simulations suggests that the enhanced OL in Au and Ag is consistent with, and, indeed, may result from, plasmonic effects. While nanourchins do possess a complex geometry, they offer flexibility in manipulating the position and the strength of plasmonic resonances via spine length manipulation. Furthermore, because of the multiplicity of the spines, urchins have an increased probability of favorable alignment with the incident electric fields, as compared to simpler shapes such as nanorods. In light of this, we are reasonably convinced that a similar explanation may apply to explain the activation of a “tuned” NLO mechanism with respect to others in well-defined SPR conditions for the NPTs we investigated. Ultimately, this evidence is certainly preliminary and must also be analyzed further with appropriate theoretical models. Nevertheless, the possibility of tuning the NLO mechanisms by acting on the plasmonic properties of NPTs is highly interesting and makes Ag NPTs promising agents, not only for photonics and OL applications but also for bio-imaging, to study the interactions between nanomaterials and live cells.


 ,
, 


