1. Introduction
The aim of 3D display technology is to reproduce the depth perception of surrounding world. An important feature that must be considered in this technology is the ability to reproduce image providing a complete 3D experience to the viewers [
1], i.e., full-parallax. Among several solutions that have been proposed in the last decades for developing 3D display technology, digital holography constitutes the best-known framework due to the ability of truly reconstructing the 3D wavefront [
2]. The possibility of complex wavefront reproduction makes digital holography popular choice in several areas as microscopy [
3], metrology [
4], non-destructive sensing [
5], security [
6], design of diffractive optical elements [
7]. In the realm of display technology, digital holography enables accurate reproduction of physiological cues [
8,
9], which is important for photorealistic 3-D images. However, digital holographic systems cannot capture scenes for wide-angle viewing display. With the development of computing technology, holograms can be registered without the necessity of a physical holographic setup. Computer-generated hologram (CGH) does not have limitations of physical systems [
10] such as optical aberrations, extension, noise, or sensitivity to vibrations. Nevertheless, CGHs have limitations for providing the truly 3D experience. The first limitation is related with the pixel pitch of the spatial light modulators (SLMs) that are used for displaying CGHs. To have a full-parallax, pixel pitches below one micrometer must be used. High-end SLM technologies can offer SLMs with pixel pitch up to 3.74 µm and 4K resolution. Devices in research stage have shown that the pixel pitch can be reduced up to one micrometer [
11,
12]. However, this type of technology is still developing. Fortunately, pixel pitch of an SLM can be reduced indirectly by employing optical systems [
13], which solves the problem of wide-angle view. The second limitation of CGHs is related to generation of the necessary visual cues for reconstructing photorealistic 3-D images, such as shading, occlusions, transparency, texture mapping, light reflectance properties [
14,
15,
16,
17,
18]. An important visual cue that any CGH technique must consider is occlusion because it provides information about perception of depth [
16]. Implementation of occlusion is a challenging task in CGH since the whole information of a 3D object is coded in 2D hologram. A large variety of occlusion algorithms have been designed depending on the employed CGH technique [
16,
17,
19,
20,
21,
22]. Propagation-based CGH techniques can apply occlusion culling of unseen regions [
13,
17,
21,
23,
24].
A popular approach for obtaining CGHs is employing point clouds of 3D objects. Each point in the cloud act as a point source that is well localized in space with a defined amplitude. Point sources emit a spherical wavefront that propagates to the hologram plane. Superposition of all propagated wavefronts generates the CGH [
25,
26,
27,
28]. However, occlusion processing for cloud point methods is not a simple task. There are several solutions that can solve this problem. For example, reference [
21] employs inter-wave-recording-plane light propagation and masks, which has proved to be efficient. Other researches use the stereogram holographic approach to cull hidden back points [
8,
29]. A simple technique, called spatial frequency index (SFI), is presented in reference [
29]. This approach calculates the instantaneous frequencies of the points with respect to the corresponding hologram tile. Instantaneous frequencies are group in sets of the same frequency, which provides the corresponding occlusion relation with the object points. Finally, the point in the set that is closer to the hologram plane is the only candidate to apport holographic information to the CGH. The SFI method can be understood as a phase added stereogram (PAS) algorithm [
30,
31,
32] that enables occlusion culling. However, the SFI strategy is time consuming, because it does not employ Fourier transformation (FT). Instead, it uses tables for grouping and selecting the proper frequencies, and what is more important, the size of the tiling is small.
All mentioned approaches enable occlusion culling of unseen areas. However, none of these techniques consider the wide projection angle. For example, propagation-based occlusion techniques are not optimal for CGHs with wide-angle, since they do not usually consider geometry where the object is much larger than the hologram [
25]. This geometrical feature is challenging for rigorous propagation algorithms that must be used. For point-occlusion based methods, the wide-angle problem is not considered. In this work, we propose a methodology for occlusion culling based on the Fourier type-PAS algorithm. Unlike the SFI strategy, our approach does not require tables for grouping the corresponding frequencies, and we provide the condition for selecting the sub-hologram tile size for carrying out proper occlusion culling. This allows reducing the processing time of the CGH. The proposed occlusion-PAS-based algorithm enables fast calculation of wide-angle CGHs with the removal of hidden surfaces, which has not been shown until now. The developed PAS method is tested for wide-angle CGH, i.e., small pixel pitch. Moreover, two propagation solutions are proposed for testing the accuracy and quality of the occlusion-based PAS algorithm. The first, based on the direct integration method [
33], quantifies quality of point reproduction of calculated CGH. The second, which is a generalization of the multi Fast Fourier Transform Angular Spectrum (MFFT-AS) method [
10], assesses the quality of the occlusion culling operation over a 3D object assembled of 24 million of point sources. Theoretical capabilities of our solutions are tested for proving accuracy of computations. Finally, the applicability of our occlusion culling method is carried out numerically and experimentally.
2. Synthetizing CGH with the PAS
A hologram
H is obtained as the result of measuring the intensity that results from the linear superposition of a diffracted object wavefield
O and a reference wavefield
R. The detected intensity can be mathematically expressed as follows
The hologram is a set of dark and bright fringes that encode amplitude and phase information of the object. When using a digital camera for registering H, a digital hologram (DH) is obtained. DH can be processed numerically for reconstructing the encoded object information. However, capturing of DHs requires interferometric systems that are sensitive to optical aberrations, environmental and mechanical vibrations, or noise.
With the development of computing technology, holograms can be registered without the necessity of a physical holographic setup. When synthetizing CGH, only the object wave field
O is calculated. Solutions for calculating this wavefield have been studied for more than three decades [
30,
34,
35,
36,
37]. The most popular approach consists in decomposing the 3D object into a set of illuminating point sources that are distributed in space. Each point source emits a spherical wavefront that propagates to the hologram plane. Superposition of all propagated wavefronts generate the CGH as follows
where
, (
xp,
yp,
zp) are the spatial position and
ap amplitudes of the point sources, respectively. Nevertheless, this solution is time consuming [
26,
28]. Efficient techniques based on propagation have been proposed for calculating
O [
21,
25,
36,
38,
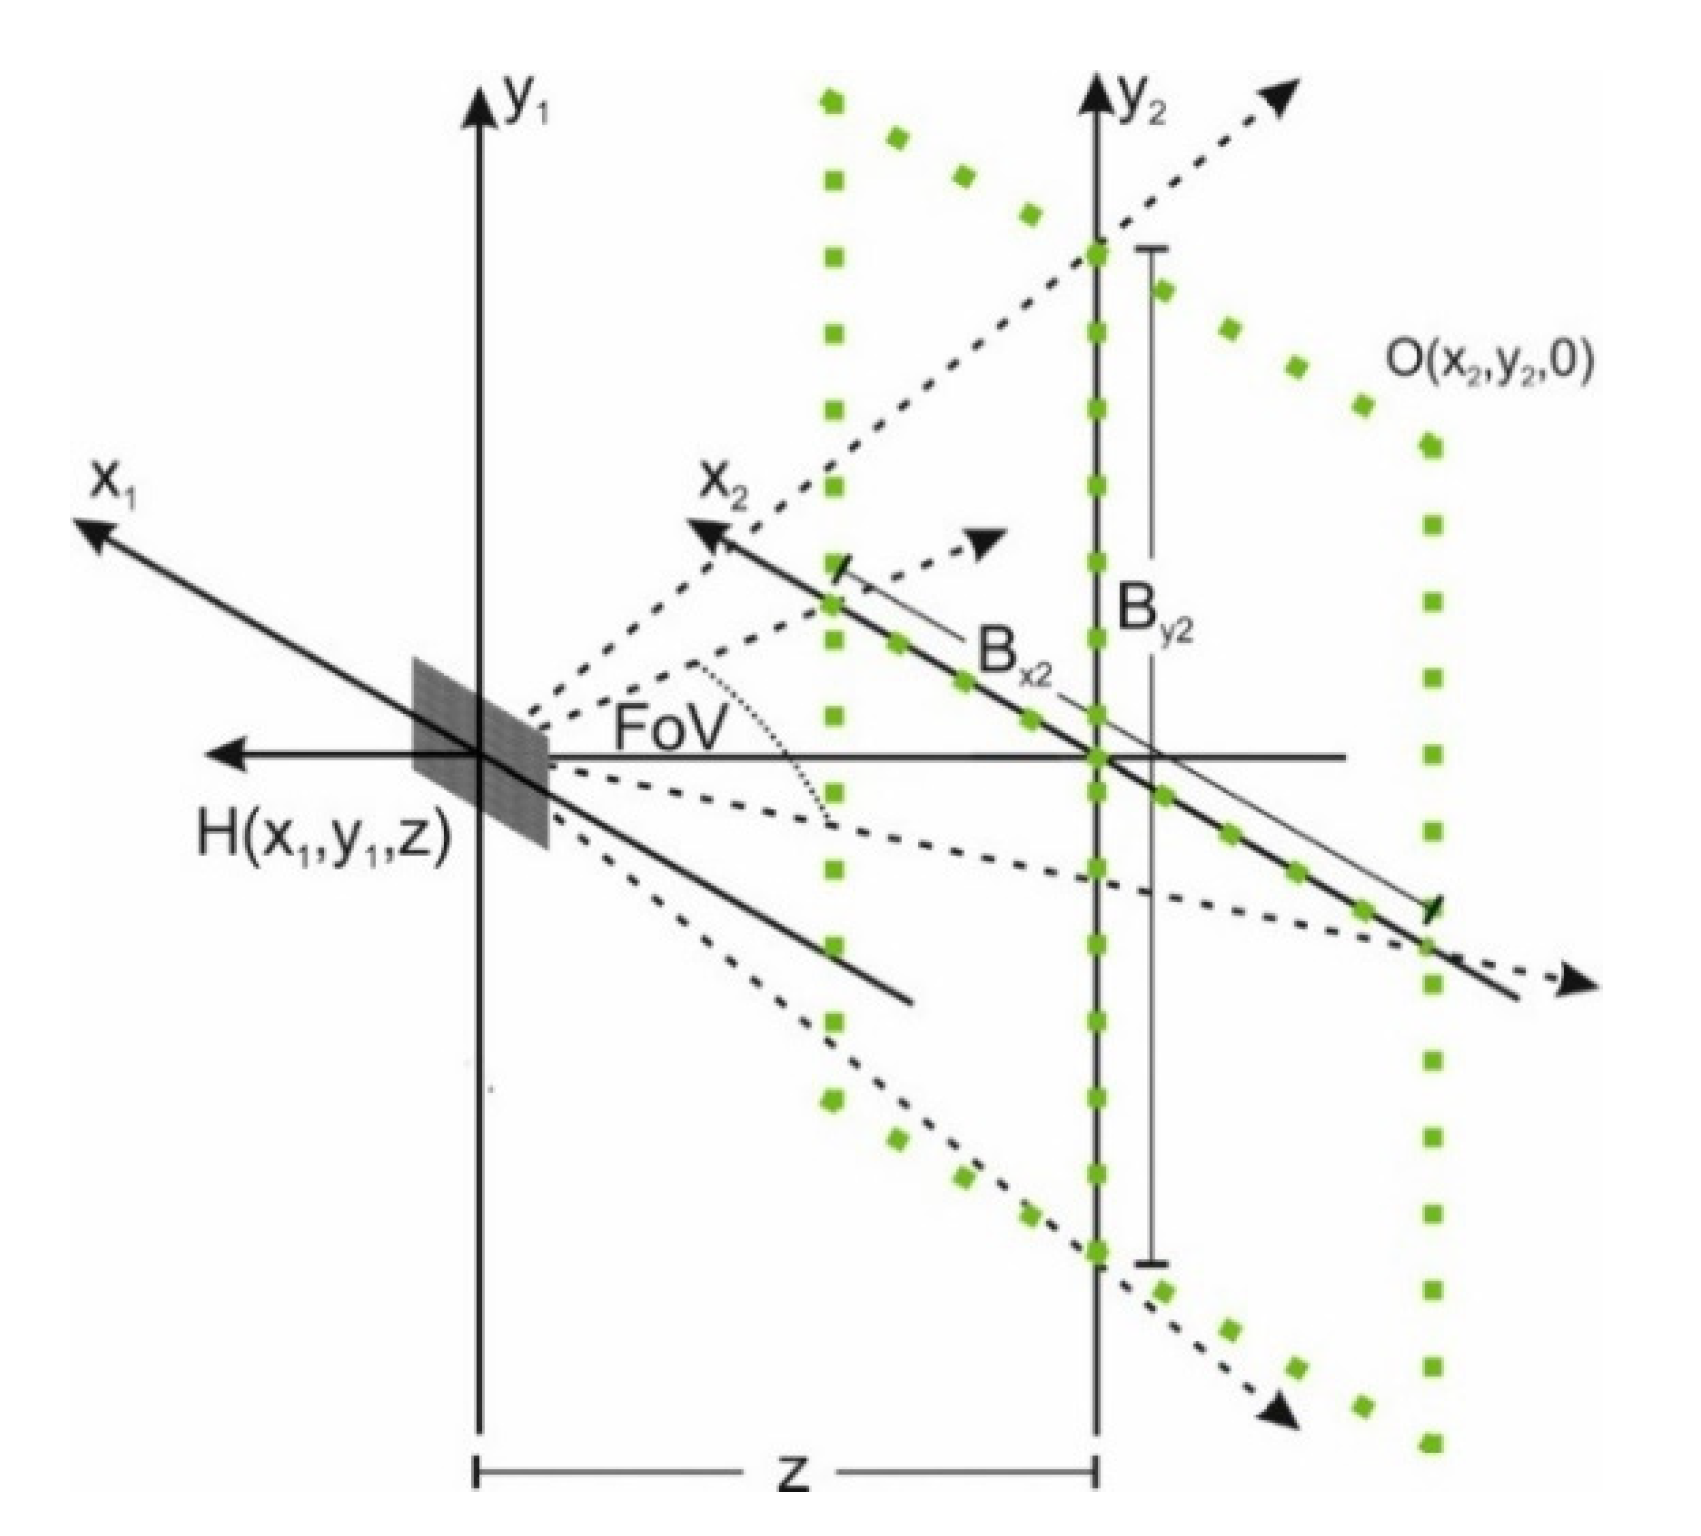
39]. With the aim to give the viewer a complete 3-D experience with full-parallax, wide-angle CGHs are required. The scheme of geometry for recording wide-angle CGHs is presented in
Figure 1. The distance between hologram plane (
x1,
y1) and object plane (
x2,
y2) is
z. Field of View (FoV) in a CGH is calculated as FoV = 2sin
−1 (λ/2Δ), where λ and Δ are the wavelength and pixel pitch of the hologram, respectively. Thus, wide-angle CGHs are obtained by employing small pixel pitch at the hologram plane. For example, for given λ = 0.64 µm and Δ = 0.62 µm the FoV ≈ 62°. Large FoV allows synthetizing CGHs of objects with spatial extension
Bx2 =
By2 = 2
z tan(FoV). These spatial extensions are much larger than the CGH size; for example, when using
z = 1000 mm,
Bx2 =
By2 = 1209 mm while an a 4K CGH (4120 × 2060) will have the dimensions
Bx1 = 2.6 mm and
By2 = 1.3 mm.
Unfortunately, propagation-based techniques are not an optimal approach for synthetizing CGHs of wide-angle, since they do not consider geometry, where the object is much larger than the hologram [
25]. This geometrical feature is challenging for rigorous propagation algorithms. Alternatives for efficient synthesis of CGHs are PAS-based solutions. These solutions do not have the restrictions of propagation-based methods since they consider the basic idea of summing point source responses at the hologram plane [
28,
31,
32]. The PAS algorithm divides the CGH into smaller segments of size
Ns ×
Ns. The number of segments within the CGH is
N ×
M, where
N is the number of segments in the horizontal direction and
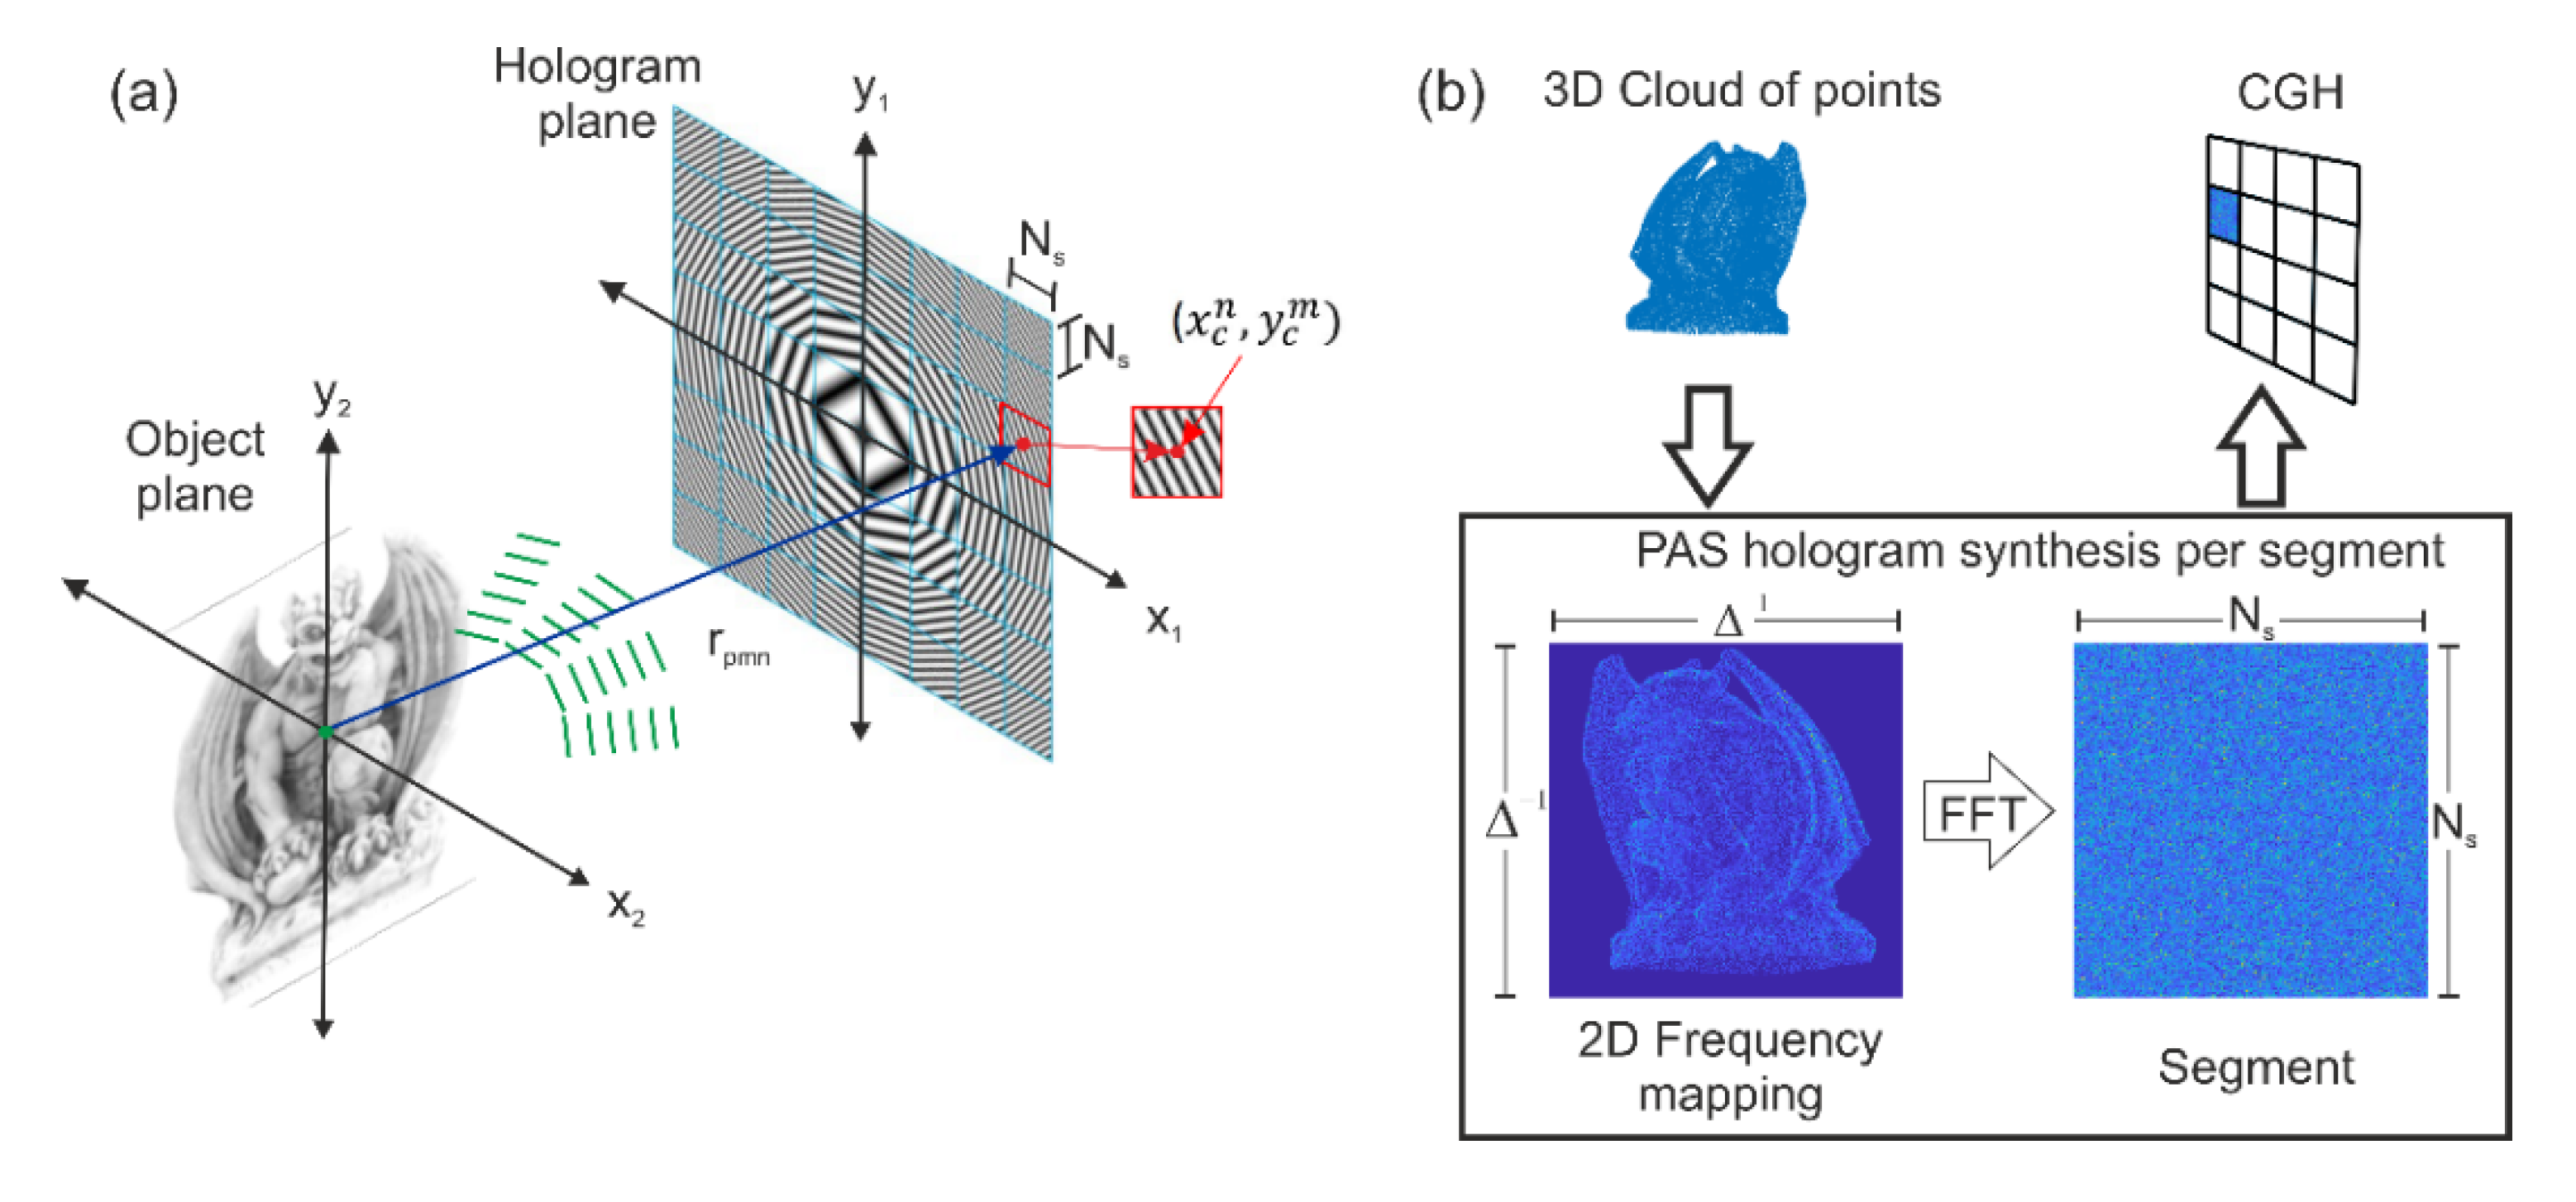
M in the vertical direction. At each segment, PAS approximates the spherical wavefront that comes from the
p-th point source of the object with a local tilted plane wave [
31], as shown in
Figure 2a. The direction of the plane wave is calculated according to the value of the local instantaneous frequency at the center of the segment
, where
n = 1, …, N, and
m = 1, …,
M indicates segment position over the horizontal and vertical direction, respectively. Since the frequency information of each segment is coded according to the local approximation of the tilted plane, the PAS can calculate the diffracted field of objects larger than the hologram size. The term
O for a given segment (
m,n) is calculated with the PAS as follows
where
Dpmn is the distance from
p-th point source to the center of the segment (
m,n), and
are the local instantaneous frequencies. The angles
θxpnm,
θypnm,
θrxnm, and
θrynm are the incident angles of object and reference beams on
x-axis and
y-axis in relation to the center of the segment, respectively. Notably, the hologram in the corresponding segment is a superposition of plane waves. When the reference beam has a constant incident angle, spatial frequencies depend on the object beam [
31].
Direct computation of Equation (3) can still be slow for a dense cloud of points. Nevertheless, this process can be significantly accelerated when employing the FT. When representing Equation (3) in frequency domain, the plane waves in the segment are transformed into a 2D distribution of Dirac deltas. The positions of these deltas need to be set to a discrete value that is specified by the segment size. Hence, Equations (4) and (5) are rewritten as:
where Δ
f = 1/
NsΔ is the frequency sampling, and ⌊ ∙ ⌋ is the rounding operation. When employing Equations (6) and (7), the term
OR is expressed in the frequency domain as
After placing all the Dirac deltas for the 3D point distribution into the segment, the inverse FT is applied, and then the complex field for a given segment is obtained. This procedure is repeated for all segments for obtaining the CGH, as shown in
Figure 2b.
3. Occlusion Culling of Back Points with the PAS
Representation of 3D object for point-based approach offers a simple and flexible way of depicting its shape. Moreover, this representation allows associating the sources with additional information such as colors, textures, and normals [
40]. Each point source generates a complex field from the scene towards the hologram plane, and the final CGH is the sum of all corresponding spherical waves. In the point-based representation, point sources cannot occlude one another, unless they accidentally fall along the same direction from the viewpoint. The wavefields from back and front points are encoded in the CGH. This prevents correct reproduction of depth cues of the 3D object in holographic image. In order to eliminate the back points, occlusion techniques are needed. Occlusion techniques can rely on geometric considerations [
40], light shielding [
17], or hybrid [
15,
23]. Since the CGH must provide motion parallax, the chosen occlusion technique must consider that the visibility of object changes according to the movement of the viewer.
Occlusion can be introduced by employing the segmentation property of the PAS [
29]. As shown in Equation (3), the term
O for a given segment (
m,n) is a superposition of plane waves having directional wave vectors calculated according to the center of the segment. When applying the FT to the segment, the coordinates of 3D point sources are mapped into the sets of 2D Dirac deltas in frequency domain. The frequency support of this segment is given by Δ
−1. Since frequency allocation depends on the size of the segment, the gaps between adjacent Dirac deltas can be controlled in the frequency domain by the value of
Ns.
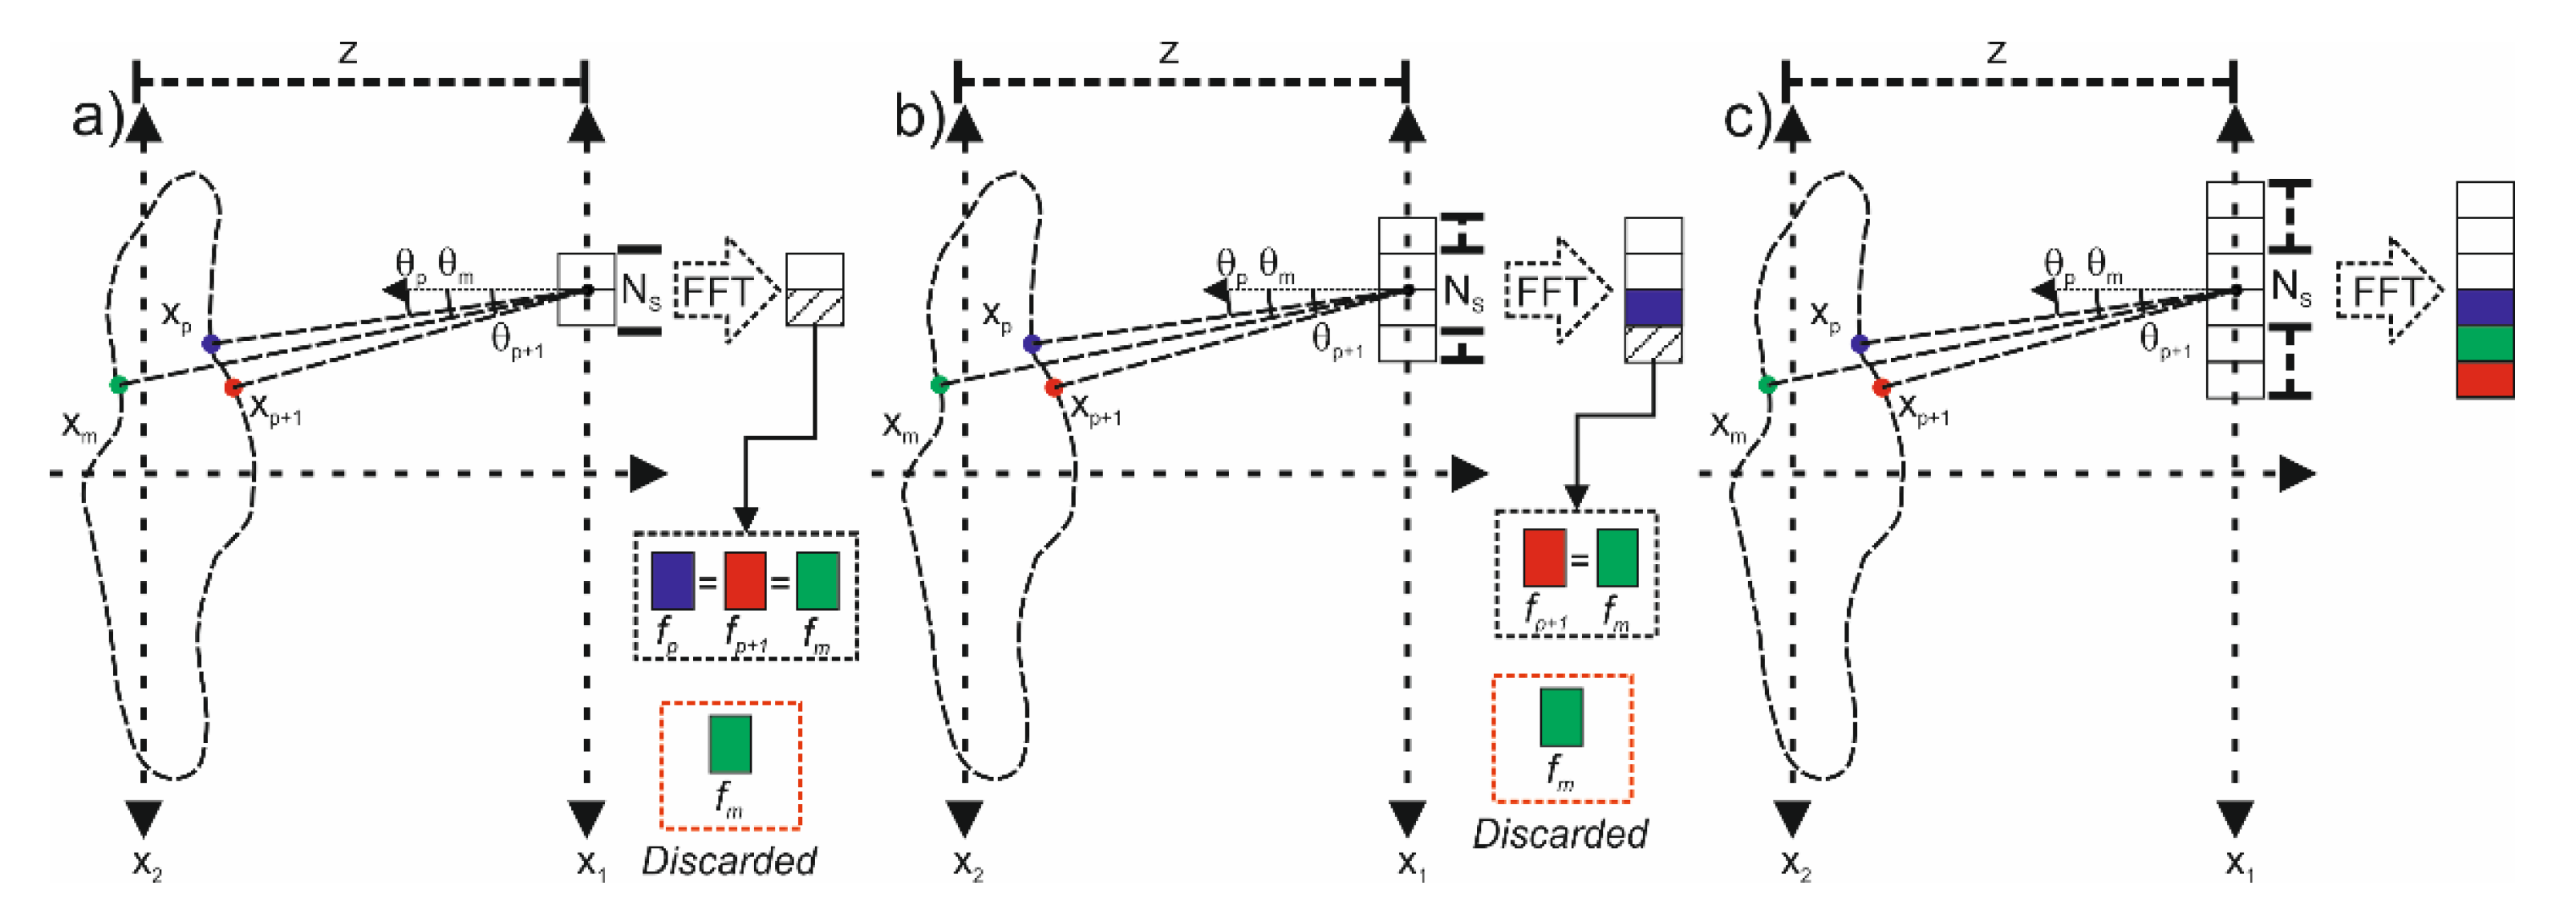
Figure 3 illustrates this effect for three point sources when using different segments sizes. The point sources
xp, and
xp+1 are adjacent front points, while
xm is a back point. The angles of corresponding plane waves are
θp,
θp+1, and
θm, respectively. In this example, the angles fulfill the relation
θp <
θm <
θp+1.
Figure 3a presents the case of a small segment. In this case, the wavefront information for all point sources is located in the same frequency pixel since
. For carrying out the occlusion, information related with the point source
xm needs to be disregarded because it has the farthest separation from the hologram plane. When enlarging the segment, as shown in
Figure 3b, wavefront information of front points
xp and
xp+1 is allocated in frequency pixels
and
, respectively. In this case, the information related to the source
xm will be placed to the nearest neighbor
. Similarly to
Figure 3a, the information related to the source
xm needs to be disregarded for the occlusion culling. Finally, for large segment the wavefront information of each point source is stored in independent pixels, as presented in
Figure 3c. As seen in
Figure 3, the key point of occlusion culling when using PAS is the allocation of frequency information of the sources that are closer to the hologram plane first, which are labeled as front sources. These sources contribute the proper object information to the CGH. Other point sources of the same frequency but farther from the hologram plane are labeled as back sources, which must be disregarded. Thus, sorting of the cloud in respect to the
z-axis allows identifying points from the nearest to the farthest in respect to the hologram plane.
With the aim to calculate the maximum segment size that enables occlusion, let’s consider a set of points that are distributed in the plane (
x2,
z). Then, adjacent points
xp and
xp+1 and an arbitrary hologram segment with center at
are chosen. The difference between corresponding local frequencies is given by
Note that θ
(p+1)nx = θ
pnx + Δθ, where Δθ is the angular difference between adjacent sources. To eliminate any gap between adjacent frequencies, the right-hand side of Equation (9) must be equal or smaller than the frequency sampling of the segment. This can be expressed as
The denominator on the right-hand side of Equation (10) has been obtained by using the sum-to-product identity. When meeting this condition, the two wavefronts corresponding to the discrete frequencies
and
are occupying two adjacent discrete locations in the frequency matrix. When considering a back point
xm, which view angle
θm lies between
θp and
θp+1, the holographic information associated with the frequency
can be accommodated into the nearest neighbor
or
. Nevertheless, the contribution from
can be disregarded since the frequency positions are already occupied by the front point sources, as shown in
Figure 3b. Finally, maximum segment size can be found by solving Equation (10) for
Ns, which yields
Notably, Equation (11) allows calculating the segment size that enables occlusion culling of back points. Once the occlusion culling of back points is complete, inverse FT is applied, and thus, the hologram segment with the proper depth perspective is obtained.
It is important to differentiate two cases in the occlusion culling. The first case can be exemplified by
Figure 3a. In this case, a small segment is employed for the occlusion. As depicted in this figure, the holographic information of two sources (or more) is allocated in the same frequency pixel. This means that resolution between the sources is lost. Thus, the smaller the segment is, the smaller the resolution in the CGH. On the other hand, when the chosen segment size is closer to
Ns, wavefront information of the sources is placed in different frequency pixels, as presented in
Figure 3b, which allows preserving resolution in the reconstructed image. Finally, it is important to note that position of the segment shifts allocation of the discrete frequencies but not the condition imposed by Equation (11). For segments that are too far from the center of the CGH, the shifting causes discrete frequencies to fall outside from the frequency support Δ
−1.
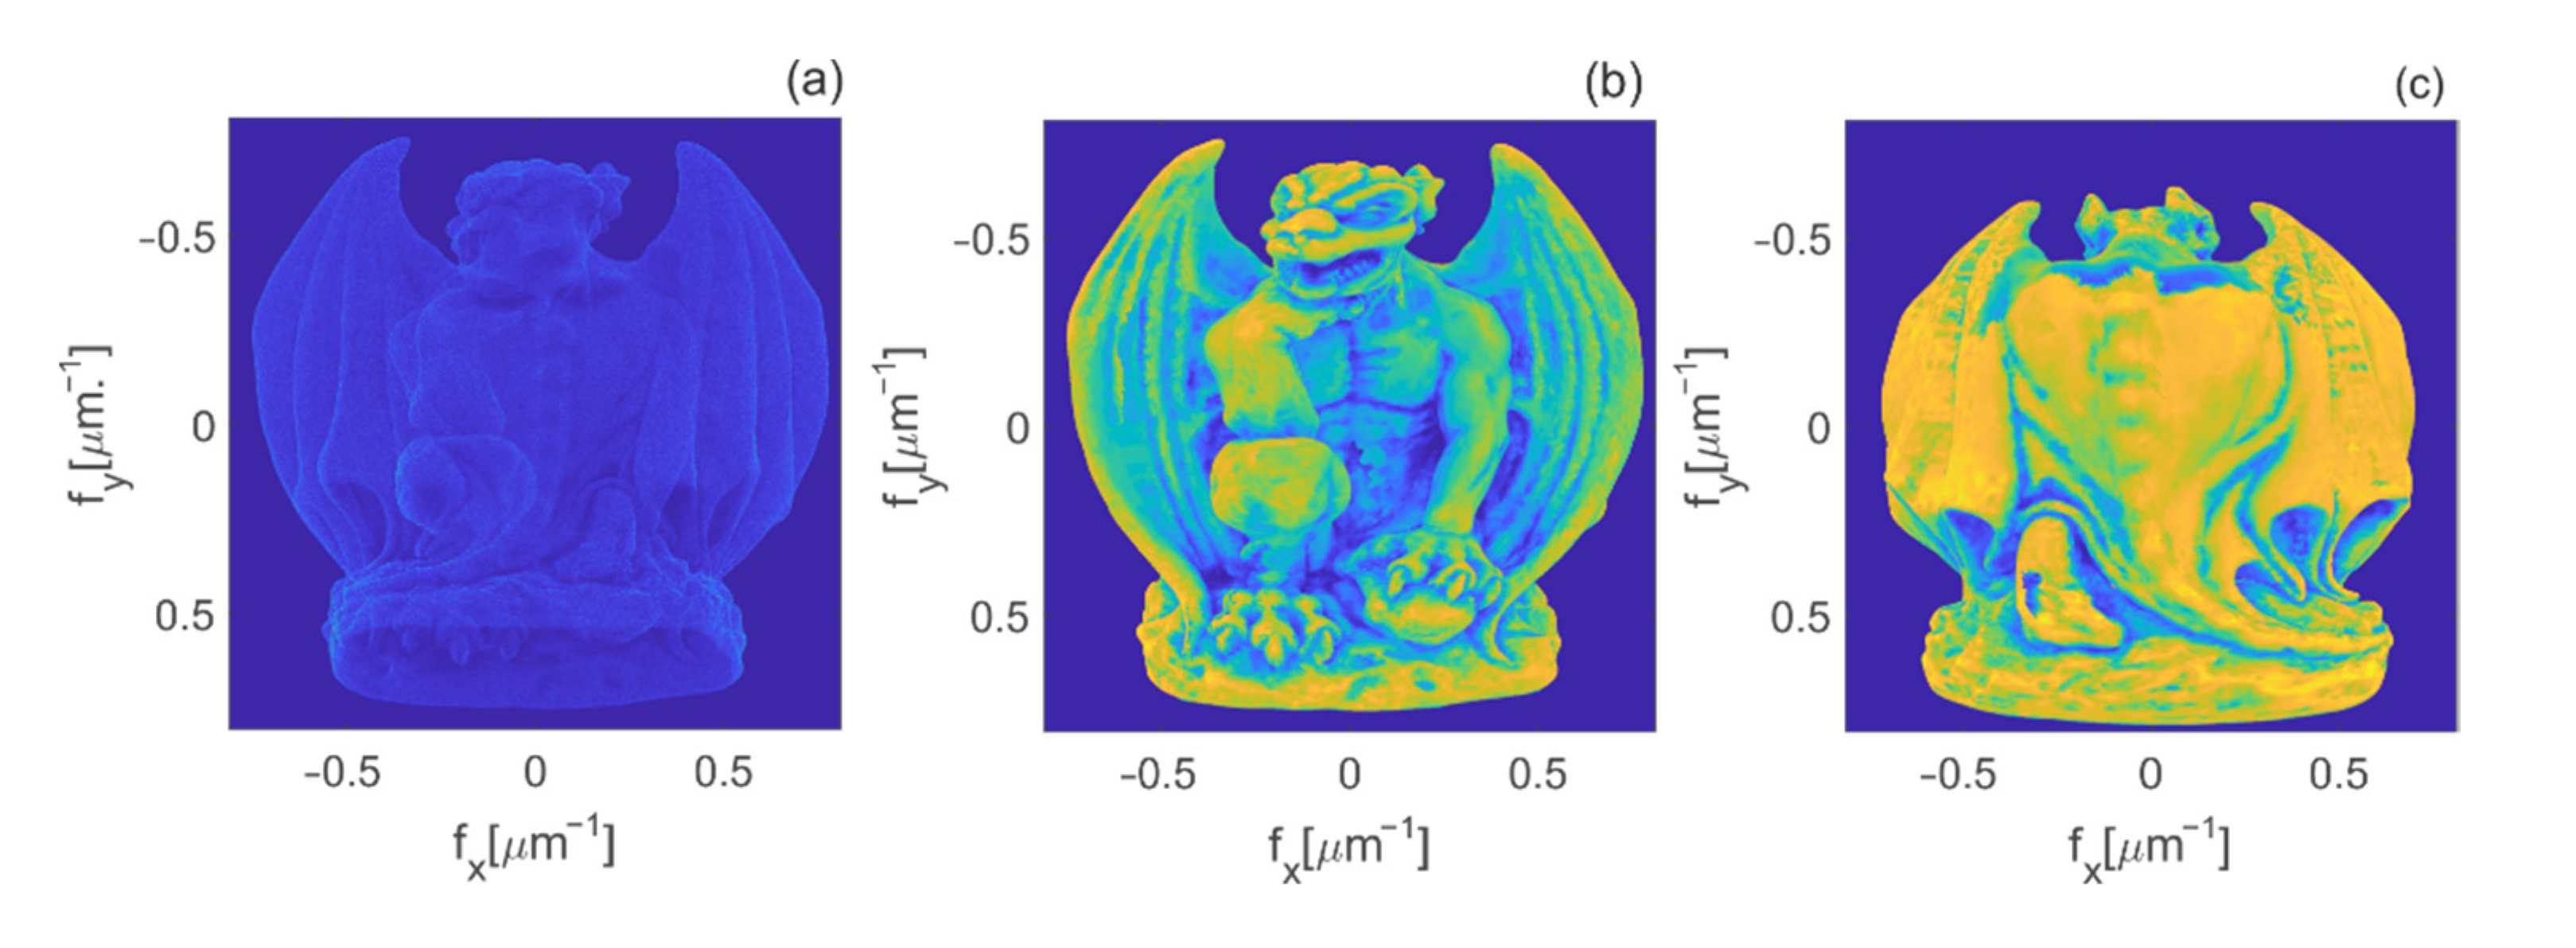
Visualization of the occlusion culling for a segment in the frequency domain is presented in
Figure 4. The employed object is a point cloud of a gargoyle figurine with dimensions 1055 mm (height) × 971 mm (width) × 485 mm (depth) composed of approximately 24M points with a density of 9 points/mm
2. The distance from the center of the object to the hologram plane is one meter. Employed features allow calculating an average angular spacing of 0.038°. Employed features allow calculating an average angular spacing of 0.035°. When employing, Δ = 0.62 µm and λ = 640 nm, which enables maximum angle view of 62.5°, it is found that
Ns must be smaller than 1550 pixels. Thus, segment size is selected as
Ns = 1024. The size of the calculated CGH is chosen as 4096 × 4096 pixels. In terms of the PAS technique, the CGH consists of 4 segments of size
Ns ×
Ns, and thus
N,
M = 4.
Figure 4 shows the amplitudes of the segment
m = 1 and
n = 1 in the frequency domain.
Figure 4a depicts the cloud of points without occlusion. Image shows that back and front points contribute to the holographic information of the segment. Thus, the depth cues are not correctly displayed.
Figure 4b shows the cloud of points when applying the proposed occlusion culling based PAS. After the occlusion culling of back points, only the front of the gargoyle is seen, which is the correct observable surface. Later, the cloud of points is rotated 180° and PAS with culling occlusion is applied again. Hence, the back of the gargoyle is obtained. The result is shown in
Figure 4c. These examples show that our method can eliminate unwanted back points by using the segmentation properties of the PAS.
In its basic configuration, the PAS algorithm introduces a truncation error when discretizing the instantaneous local frequencies (Equations (6) and (7)) [
32], which decreases the reconstruction quality of the CGH. This truncation error depends on the segment size and can be easily reduced by using a large segment. In the general case of CGH calculation, arbitrarily large segment cannot be selected since the wavefront at the hologram plane may not be well represented. For the proposed occlusion culling PAS, the restriction of the segment becomes stricter due to the limitation imposed with Equation (11). Accurate PAS (A-PAS) can be employed for solving the discretization problem while fulfilling the
Ns constraint and sampling theory [
31] at the same time. The A-PAS considers that the segment is enlarged in the discrete frequency domain by an integer factor
r. In this way, the frequency sampling is increased
r-times, which allows a better approximation of the discrete values of the frequencies to their respective continuous values. After applying the inverse FT to the enlarged segment, the original segment is taken. The A-PAS is implemented in the occluded PAS algorithm by considering that the enlarged segment in frequency domain is not larger than
Ns. This means that we must find a hologram segment of size
Nso and extension factor
r such that
Ns > Nsor. When selecting proper
Nso and
r, the accuracy of the PAS algorithm can be reached while preserving the occlusion culling of unwanted back points.
5. Diffraction Efficiency Based on Assessment of CGH Quality
In this section, assessment of CGH quality based on diffraction efficiency measure is carried out. This is done with the aim to quantify quality of point reproduction of calculated CGH. Reconstruction of wide-angle CGHs require, see first row of
Table 1, a large amount of memory and processing time. Nevertheless, for measuring the diffraction efficiency of CGHs of this work, we retrieve a small region where a point source is reconstructed. Hence, the OADI method is suitable for measuring the diffraction efficiency of CGHs calculated with the PAS algorithm.
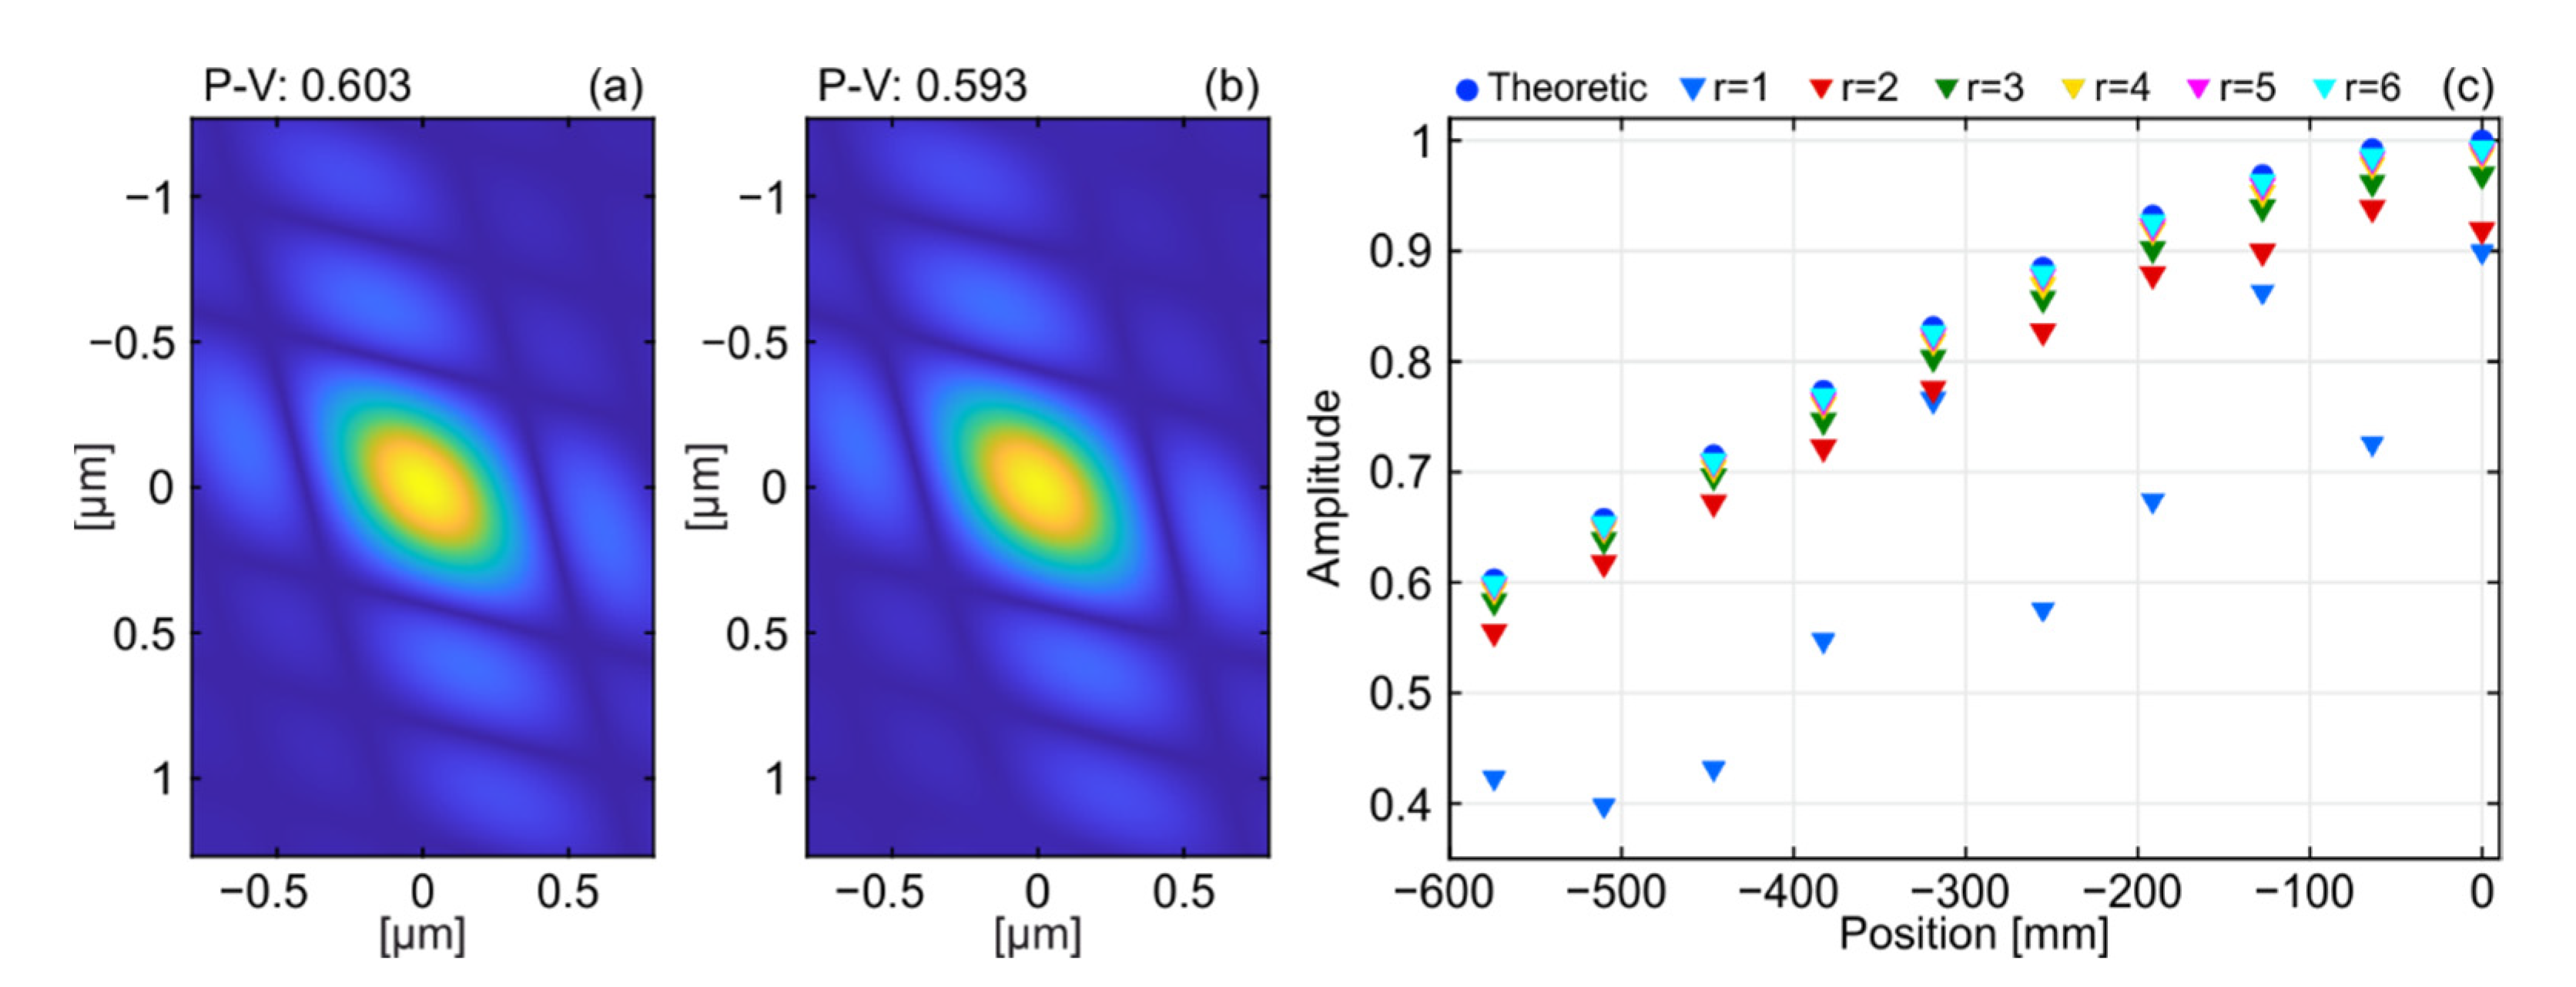
The first diffraction efficiency-based test is evaluated with two CGHs of ten point sources distributed linearly along the diagonal from the center of the image
P0(0, 0,
z) up to corner point
P10 = (−0.475
Bx2, −0.475
By2, z), where
z = 1000 mm. Pixel pitch of the CGHs is Δ = 0.62 µm. Theoretical CGH, which is reference one, is calculated using Equation (2), while the second CGH with the PAS algorithm employing
Nso = 256 and
r = 4. Calculated CGHs are processed with Equation (12) and the corresponding off-axis coordinate. As a result, the single point source with its nearest neighborhood is reconstructed.
Figure 5a,b present the reconstruction of point P
10 of theoretical and PAS CGHs, respectively. Visually, reconstructed point sources have identical profiles and almost the same peak value (P-V).
Figure 5c presents the accuracy test in relation to point source position along the diagonal of image space. Maximum amplitude values are normalized with respect to the on-axis point P
0 from theoretical CGH. Regardless, the CGH is made with PAS method or with Equation (2), the linear loss of amplitude due to point source position is present. Moreover, it is clearly seen in the plot that accuracy of reconstructed point sources is strongly related to the selection of the parameter
r, e.g., for
r ≥ 3, the maximum amplitude of each point starts to behave stable and is close to the result of theoretical CGH. Accordingly, CGHs of high accuracy made with PAS can be achieved by using a value
Nso and large
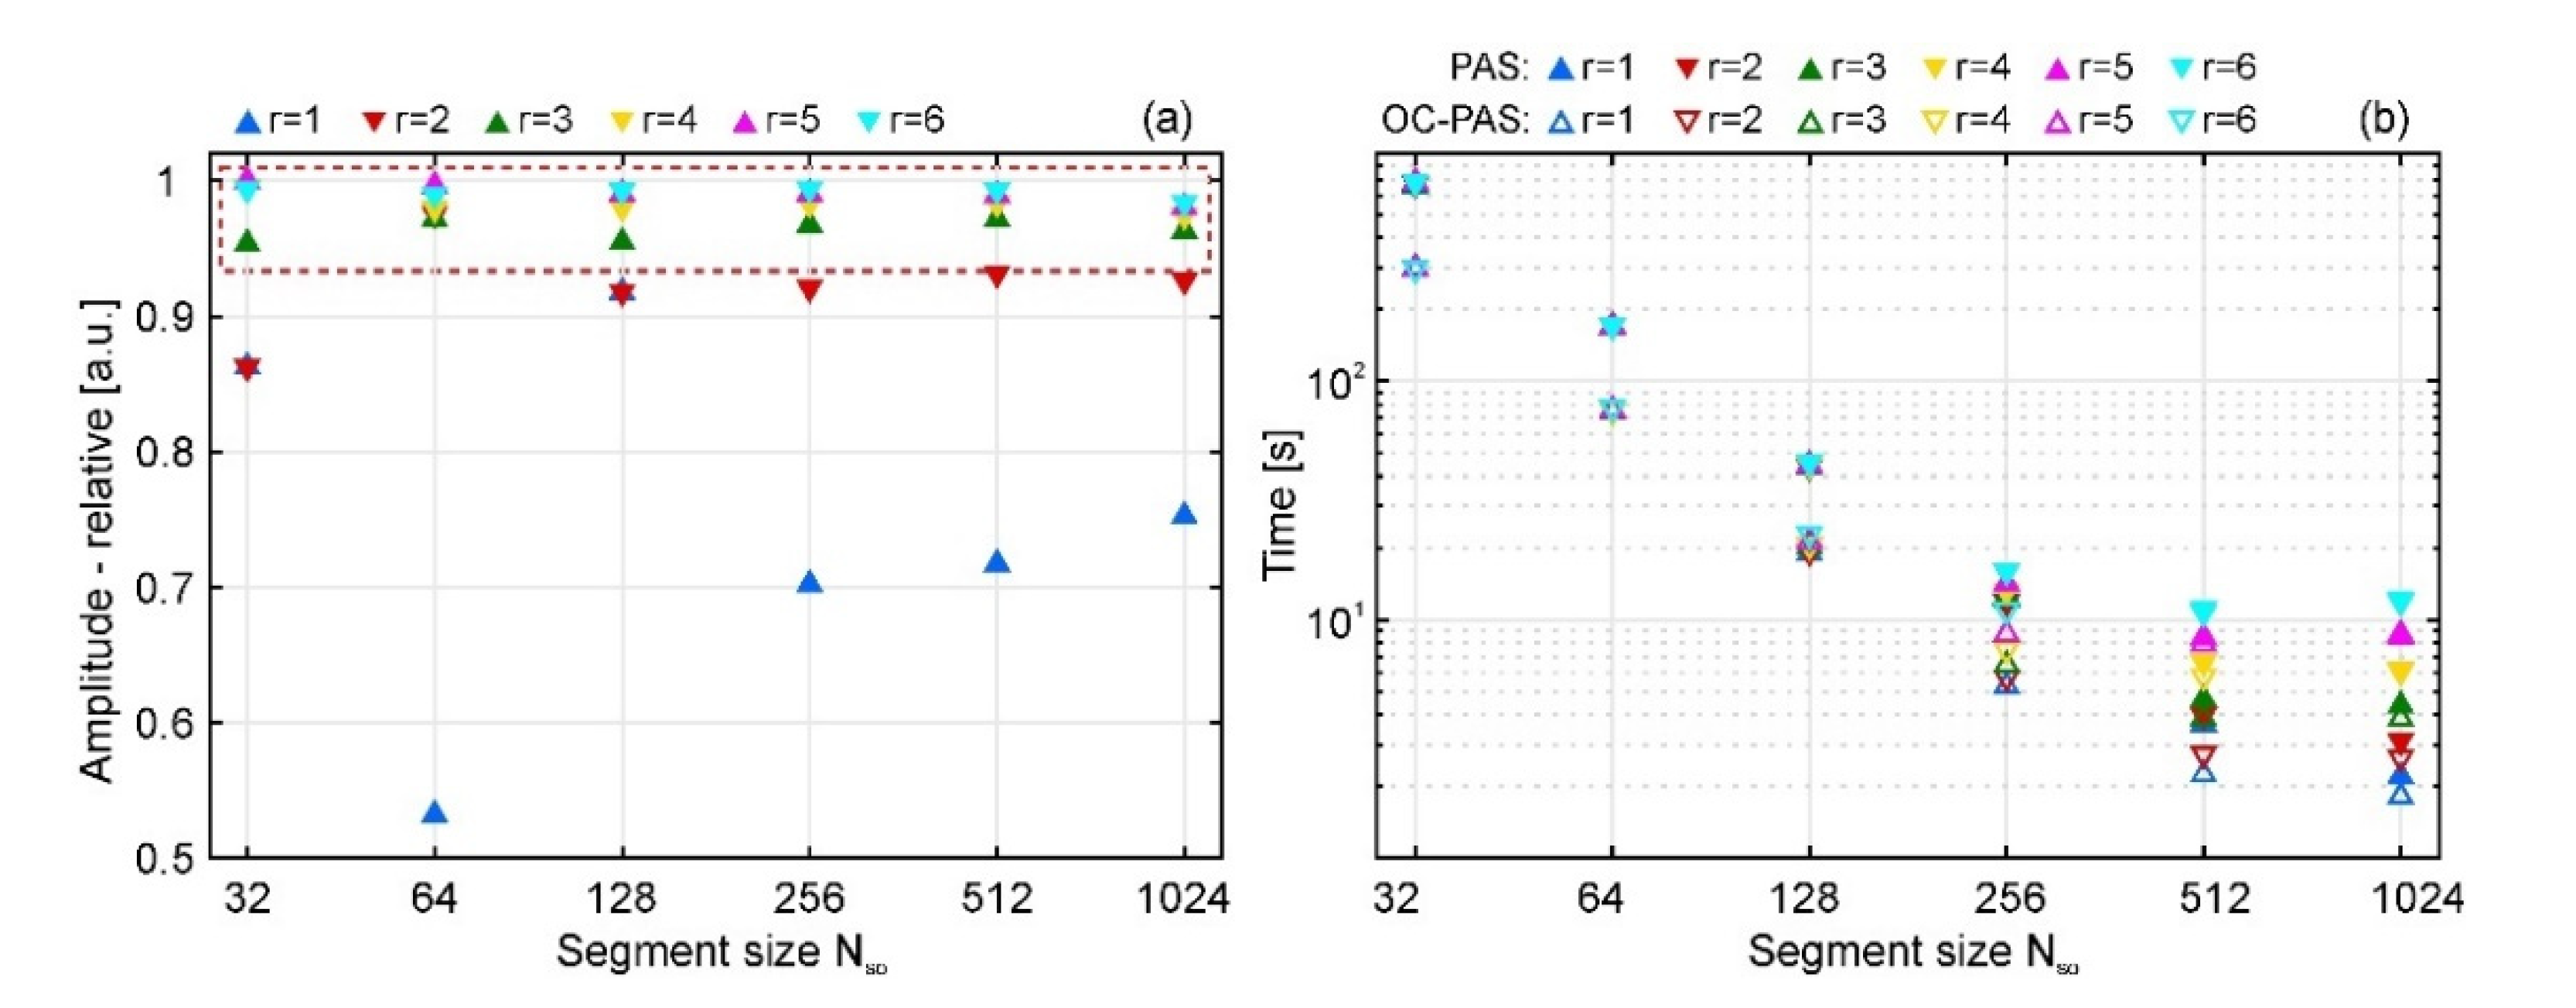
r. Nevertheless, the constraint provided by Equation (11) must be fulfilled all the time if occlusion culling is desired. For this reason, we perform a test that is aimed to measure the accuracy of calculated CGHs with the PAS with different parameters
Nso and
r. As a measure of accuracy, the ratio of maximum amplitude of reconstructed point P
10 between PAS and theoretical CGH is used. Corresponding results are shown in
Figure 6a. The obtained ratios demonstrate that when using original segment size (
r = 1), the diffraction efficiency is low and unstable, which means that calculated CGH with PAS is not optimal. When using large values of
r (
r > 2), the maximum amplitude increases its value independently of the
Nso, which is pointed out by large dash box into the plot.
The second test is carried out for measuring the computation time of calculated CGH with a point cloud of one million points. The cloud has a similar point density to the gargoyle figurine presented in
Section 3. Different
Nso and
r values without and with occlusion culling routine are employed. The results are presented in
Figure 6b. Note that PAS calculation of a segment consists of two parts: allocation of holographic information according to the local instantaneous discrete frequencies and performing FFT. Time consumption for allocation depends on the number of points, and thus the larger the cloud is, the larger the computational effort. Time consumption is particularly demanding when the number of points within the cloud is counted in millions. In comparison, the computational effort of the FFT only depends on the size of the frequency matrix (
Nso ×
r), where the holographic information is stored. Since the computational complexity of FFT is given by (
Nso ×
r) × log(Nso ×
r), then a small product of
Nso and
r will result in a short computation time, which is almost negligible, while a large product between
Nso and
r, will increase it. However, this FFT-related time is still shorter than for point processing. A benefit of using large segments
Nso is that less segments are computed for hologram generation, which speeds up the CGH computation. When measuring time for the occlusion culling, it is seen that the occlusion PAS is faster than normal PAS. For example, generation of the CGH without occlusion for
Nso = 32 and
r = 3, and
Nso = 512 and
r = 3 took around 674 and 4.6 s, respectively. On the other hand, calculation of the CGH with occlusion for previous parameters took around 297 s and 3.9 s, respectively. Notably, for segments of size
Nso ×
r that do not fulfill Equation (11) the growth of computation time is higher for the occlusion culling than for the computation without occlusion. This is because of the finer frequency sampling of the segment, which means that back points are allowed to store their holographic information. Therefore, the number of processed points grows, and thus the computation time as well.
As discussed in former paragraph, selection of
Nso and
r for ensuring high accuracy and fast execution time must consider the constraint imposed by Equation (11). However, Equation (11) relies in the angular spacing Δθ. The parameter Δθ depends on the geometry of the object, the dimension of the hologram, and the separation between object and hologram planes. Due to the mentioned features, the estimation of the angular spacing is a non-trivial issue. Here, it is decided to estimate the local angular spacing with the fitting of a Gaussian distribution to the computed local density of points. Also, considering the standard deviations, we estimate the quasi-minimal angular spacing value for the points clouds that statistically work properly for over 99% of the object surface.
Table 2 presents the connection between the average angular spacing of the point cloud and the proper segment size
Nso as it is stated in Equation (11). Four point clouds with the same geometry from gargoyle figure from
Section 3 are employed. These clouds have 200 thousand, 1 million, 5 million, and 24 million of points. Investigation of these exemplary point clouds presents the proper choice of the segment size due to the point cloud angular spacing and their respective CGH time calculation.
6. Reconstruction of Wide-Angle CGHs Calculated with the Occlusion Culling Based-PAS Algorithm
In this section, numerical and optical reconstructions of wide-angle CGHs obtained with the occlusion culling based PAS are carried out. PAS algorithm is implemented in Matlab software, which is installed on a PC equipped with Intel i9-9900K processor, 32 GB of RAM, and run without support of GPU. Selected size of the CGHs is 4160 × 2160 pixels, which corresponds to the size of the 4K SLM Holoeye GAEA 2,0, pixel pitch Δ
SLM = 3.74 μm. CGHs are calculated from the cloud of 24 million points defined in
Section 3 and PAS parameters:
Nso = 512,
r = 3, and Δ = 0.62 µm, which according to
Table 2 fulfills
Ns limit. Calculation time for each CGH is around 190 s, which can be reduced up to 30 s when using the Matlab parallel toolbox. When comparing this time with
Table 1 from reference [
29], it can be seen that our approach improves the calculation time by a factor of 3000.
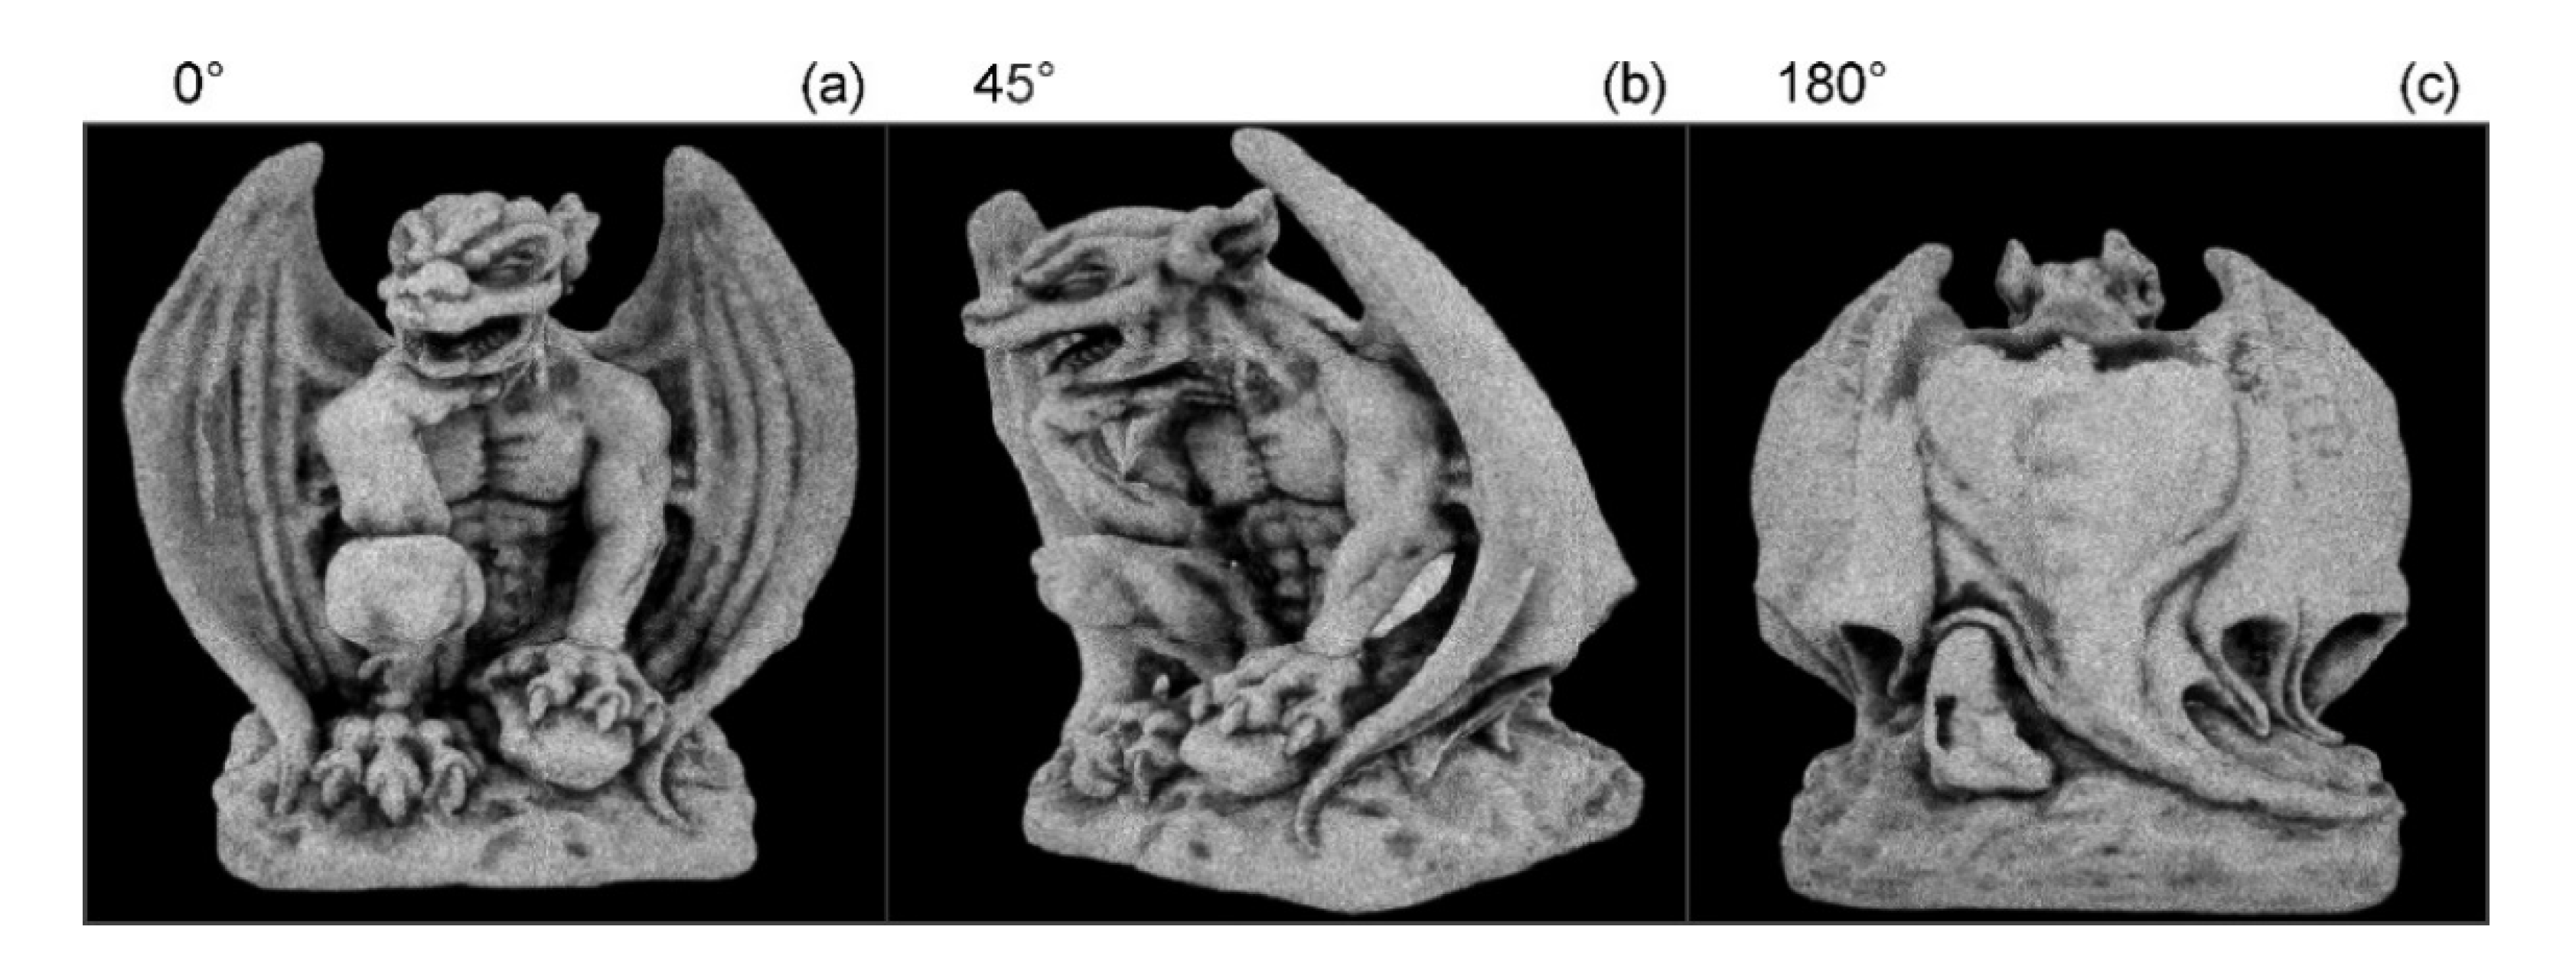
Figure 7a–c show numerical reconstructions for three perspectives angles: 0°, 45°, and 180° of CGH calculated with the 2D MFFT-AS, respectively. Notably, the application of the occlusion culling based PAS algorithm allows eliminating unwanted back points, and hence, reconstruction of the object with proper depth cues. It is worth noting that SFI method is not able to provide any of the presented results since it is a method designed under the constraints of the paraxial regime.
Video S1 presents the numerical reconstruction of the gargoyle view angles from 0° to 360°. The cloud of points was rotated 8° between each frame.
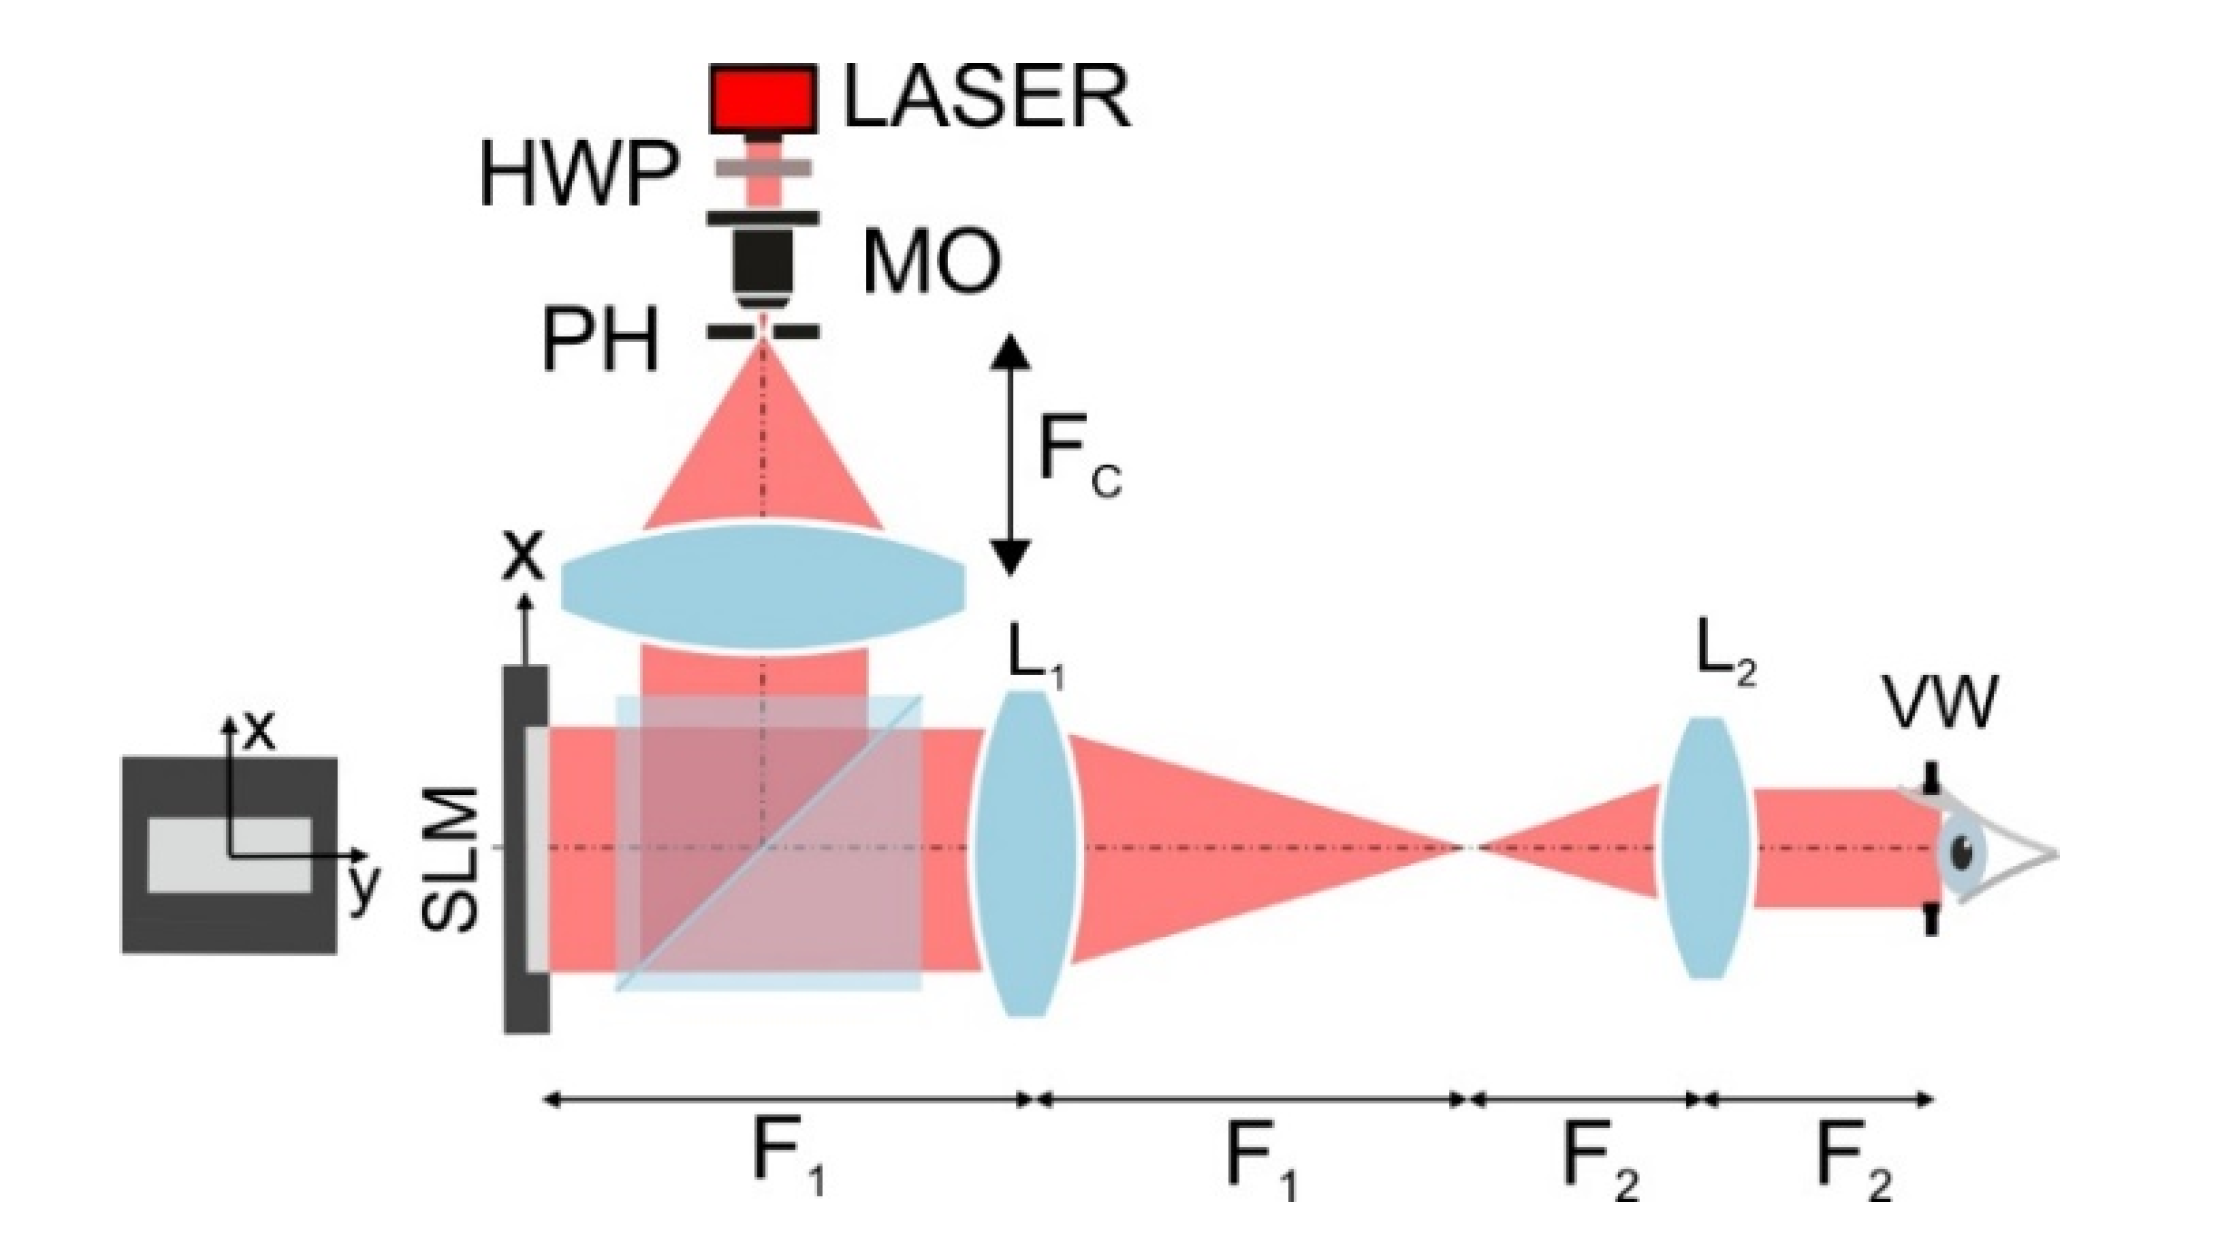
Optical reconstruction of CGH is carried out in the display setup presented in
Figure 8. Illumination laser source (λ
R = 640 nm) hits half-wave plate (HWP), which controls polarization state. Next, the beam passes through microscopic objective (MO) and a pinhole (PH), generating a spherical wavefront. A collimator lens C (
Fc = 300 mm) is placed in front of the pinhole to obtain an extended plane wave. Plane wave illumination is directed to the phase only 4K SLM by a non-polarized beam splitter. SLM is imaged by an afocal demagnifying system composed of an objective (
F1 = 200 mm, Ø
1 = 50 mm) and an eyepiece (
F2 = 33 mm, Ø
2 = 25 mm). At the viewing window (VW) plane pixel pitch of the image of SLM is Δ’
SLM =
F2/
F1 × Δ
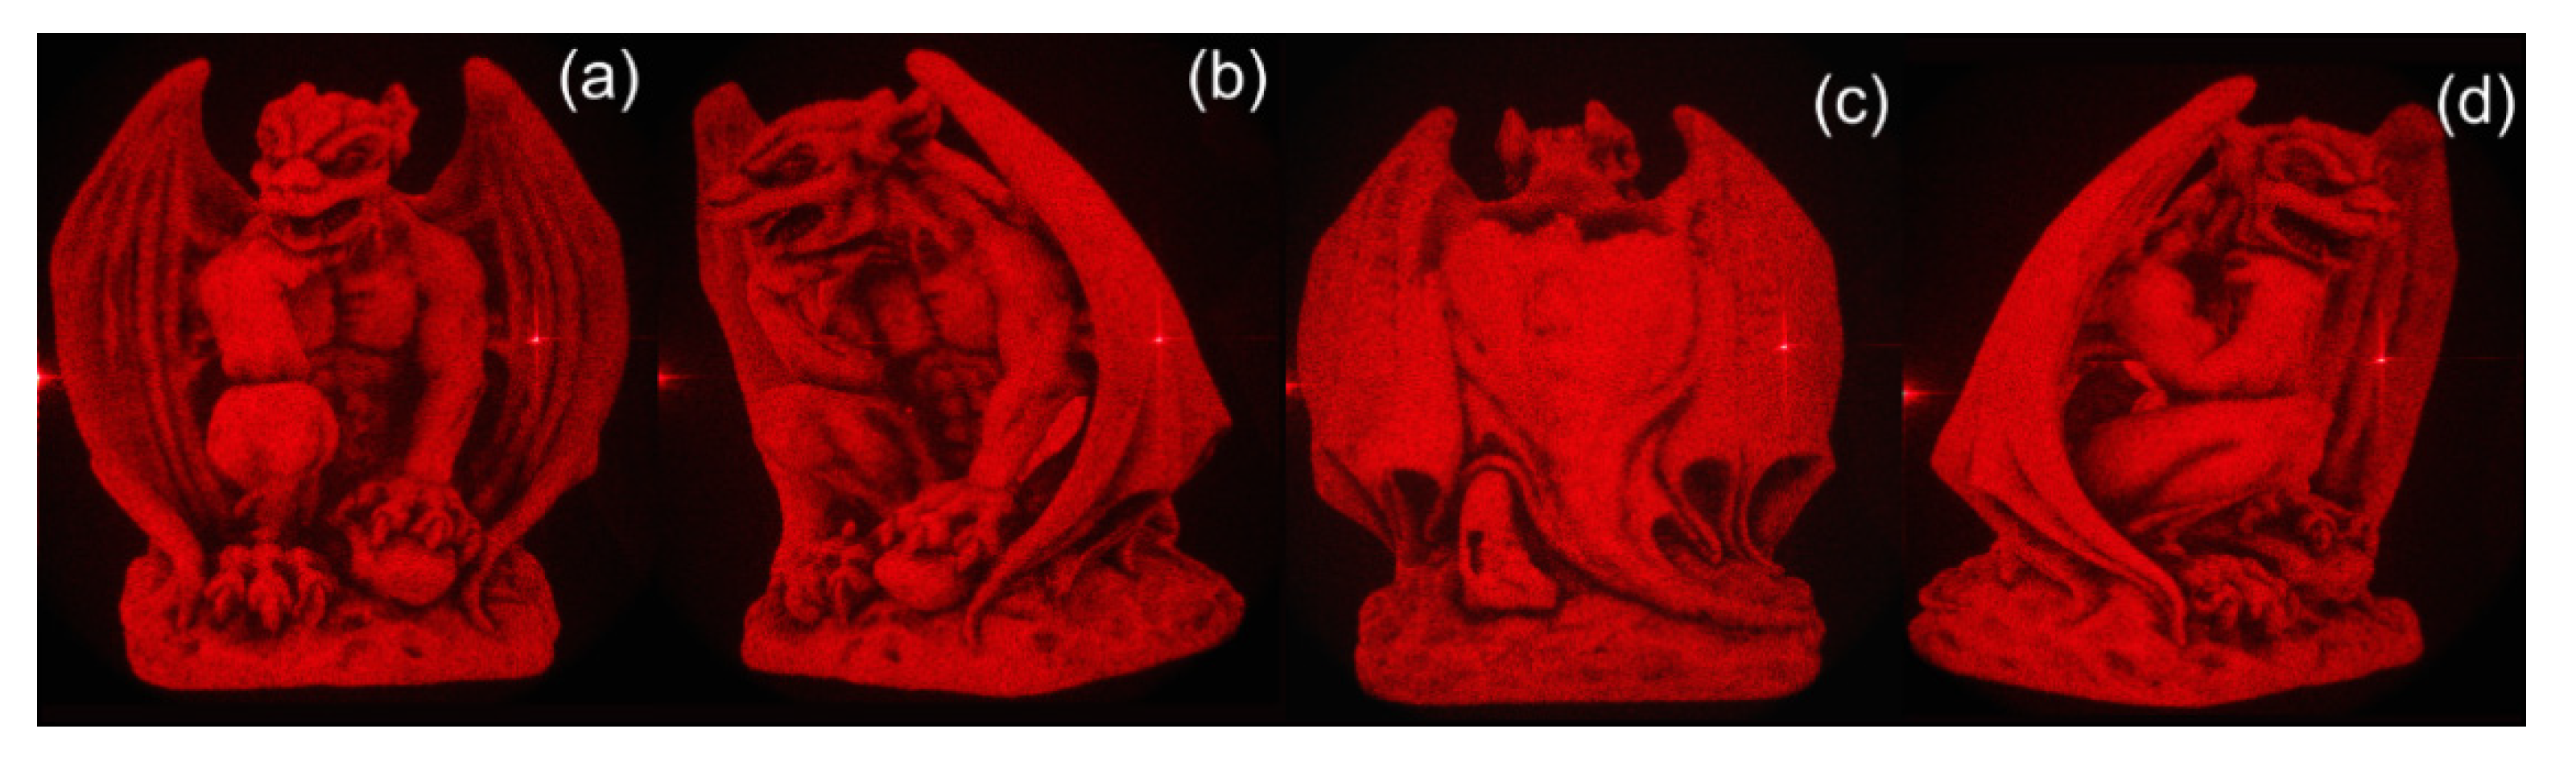
SLM = 0.62 µm. The small pixel pitch allows for a wide viewing angle (62.5°). However, the physical aperture of the eyepiece limits it to 36°.
Figure 9 shows optical reconstructions of CGH generated and reconstructed for four view angles: 0°, 45°, 180° and 275°. To fit the viewing angle of the display system, gargoyle dimensions are resized to 559 × 527 × 279 [mm
3]. Since the dimension of the cloud is reduced, the average angular spacing of the point cloud decreases to 0.030°. For this value, the
NS must be smaller than 1900 pixels. Hence, former PAS parameters fulfill accuracy and speed for CGH calculation as well. Obtained results prove that the occlusion culling based-PAS can eliminate unwanted back points for each angle.
Video S2 presents the optical reconstruction of the gargoyle from 0° to 360°. Here, the cloud of points was rotated 1° per frame.

 ,
, 


