Article

Controlled Coherence Plasmonic Light Sources

1
Department of Physics and Optical Science, UNC Charlotte, Charlotte, NC 28223, USA
2
Precision Pharmacotherapy Research & Development Institute, Tabula Rasa HealthCare, Orlando, FL 32827, USA
*
Author to whom correspondence should be addressed.
These authors contributed equally to this work.
Photonics 2021, 8(7), 268; https://doi.org/10.3390/photonics8070268
Submission received: 4 June 2021 / Revised: 29 June 2021 / Accepted: 5 July 2021 / Published: 8 July 2021
(This article belongs to the Special Issue Structured Light Coherence)

Abstract

:
Through a computational model, we study the coherence converting capabilities of an array of holes in a surface plasmon-supporting metal plate, with an eye towards the creation of controlled coherence plasmonic light sources. We evaluate how the average coherence and transmission of the hole array depends on the parameters of the array, such as the array geometry, lattice constant, and hole size. We show that the location of coherence bandgaps and resonances can be estimated through a simple formula and that increases in coherence are strongly correlated with increases in transmission.

1. Introduction

In recent years, the properties of propagating surface charge density waves on some metals, known as surface plasmon polaritons (SPPs), have proven useful in a wide array of applications. They are very sensitive to the local refractive index and have been used for the detection of individual living cells [1], the development of lab-on-a-chip devices [2], and disease detection [3]. SPPs also have a wavelength shorter than the free-space wavelength, and they strongly confine light near the surface of the metal, making them useful for focusing beyond the diffraction limit [4]. SPPs generated on metal films perforated by arrays of sub-wavelength diameter holes have been used in a number of applications, including in the design of a form of e-paper [5] and in enhancing the photon-to-electron conversion efficiency of semiconductors [6].
The recent explosion of interest in SPPs can be traced to studies of their effects in such subwavelength hole arrays. In 1998, Ebbesen et al. demonstrated [7] that much more light can be transmitted through such arrays than conventional diffraction theory predicts, a phenomenon connected with SPPs. A theoretical and computational analysis several years later showed that SPPs can enhance or suppress the transmission of light, depending on the properties of the array and the illuminating light [8]. This extraordinary optical transmission has been studied extensively and has found many uses [9].
When the field illuminating a hole array is partially coherent, SPPs can not only improve the transmission of light through the array but also modify the spatial coherence of light on transmission. This was first shown by Gan et al. [10] and was experimentally demonstrated soon afterward [11]. It has long been known that many important properties of a light field, such as the directionality [12], spectrum [13], degree of polarization [14,15], and state of polarization [16], can be strongly influenced by the spatial coherence properties of light, making devices that can manipulate the spatial coherence of great interest. The coherence modulation ability of plasmonic arrays led to a proposal [17] to use such an array to convert the coherence of a transmitted beam to a desired state.
Such a device could be extremely beneficial in designing structured light beams [18], i.e., light beams that have had their amplitude, phase, polarization, and coherence characteristics tailored for a particular application. Structured light has been proposed as a method to improve the robustness and channel capacity of free-space optical communication [19], where atmospheric turbulence has a strong effect. In particular, partially coherent fields in the atmosphere have been shown to have reduced fluctuations of intensity, reducing the bit-error rate of data transfer accordingly [20]. However, standard methods for adjusting spatial coherence, such as spatial light modulators or rotating ground glass plates, are either too slow to be effective for free-space communication or do not have an adjustable degree of coherence; the latter ability is necessary because the optimal spatial coherence depends on the turbulence channel.
The coherence converting plasmonic array proposed in Reference [17] could potentially overcome these limitations: its speed would come from the inherent fluctuations of the illuminating field, and its wavelength sensitivity allows tunable coherence over a small range of wavelengths. However, the previous work left many practical questions unanswered, such as how the output coherence depends on the system parameters and how the transmission is related to the output coherence. Some of these questions were examined in Reference [21] but only for one-dimensional hole arrays.
In this paper, we perform a detailed study of the coherence converting capabilities of plasmonic hole arrays, looking at the transmission of the arrays as well as their global coherence and determining the effect of the system parameters on the output coherence. By introducing a global coherence parameter, we show that the resonance and bandgap locations of such two-dimensional plasmonic hole arrays can be predicted with relatively simple equations. Furthermore, we show that increases in coherence are strongly correlated with the increase in transmission. This work, and the model used to generate our results, provides guidelines and possible future steps in designing controlled coherence plasmonic sources for structured light applications.

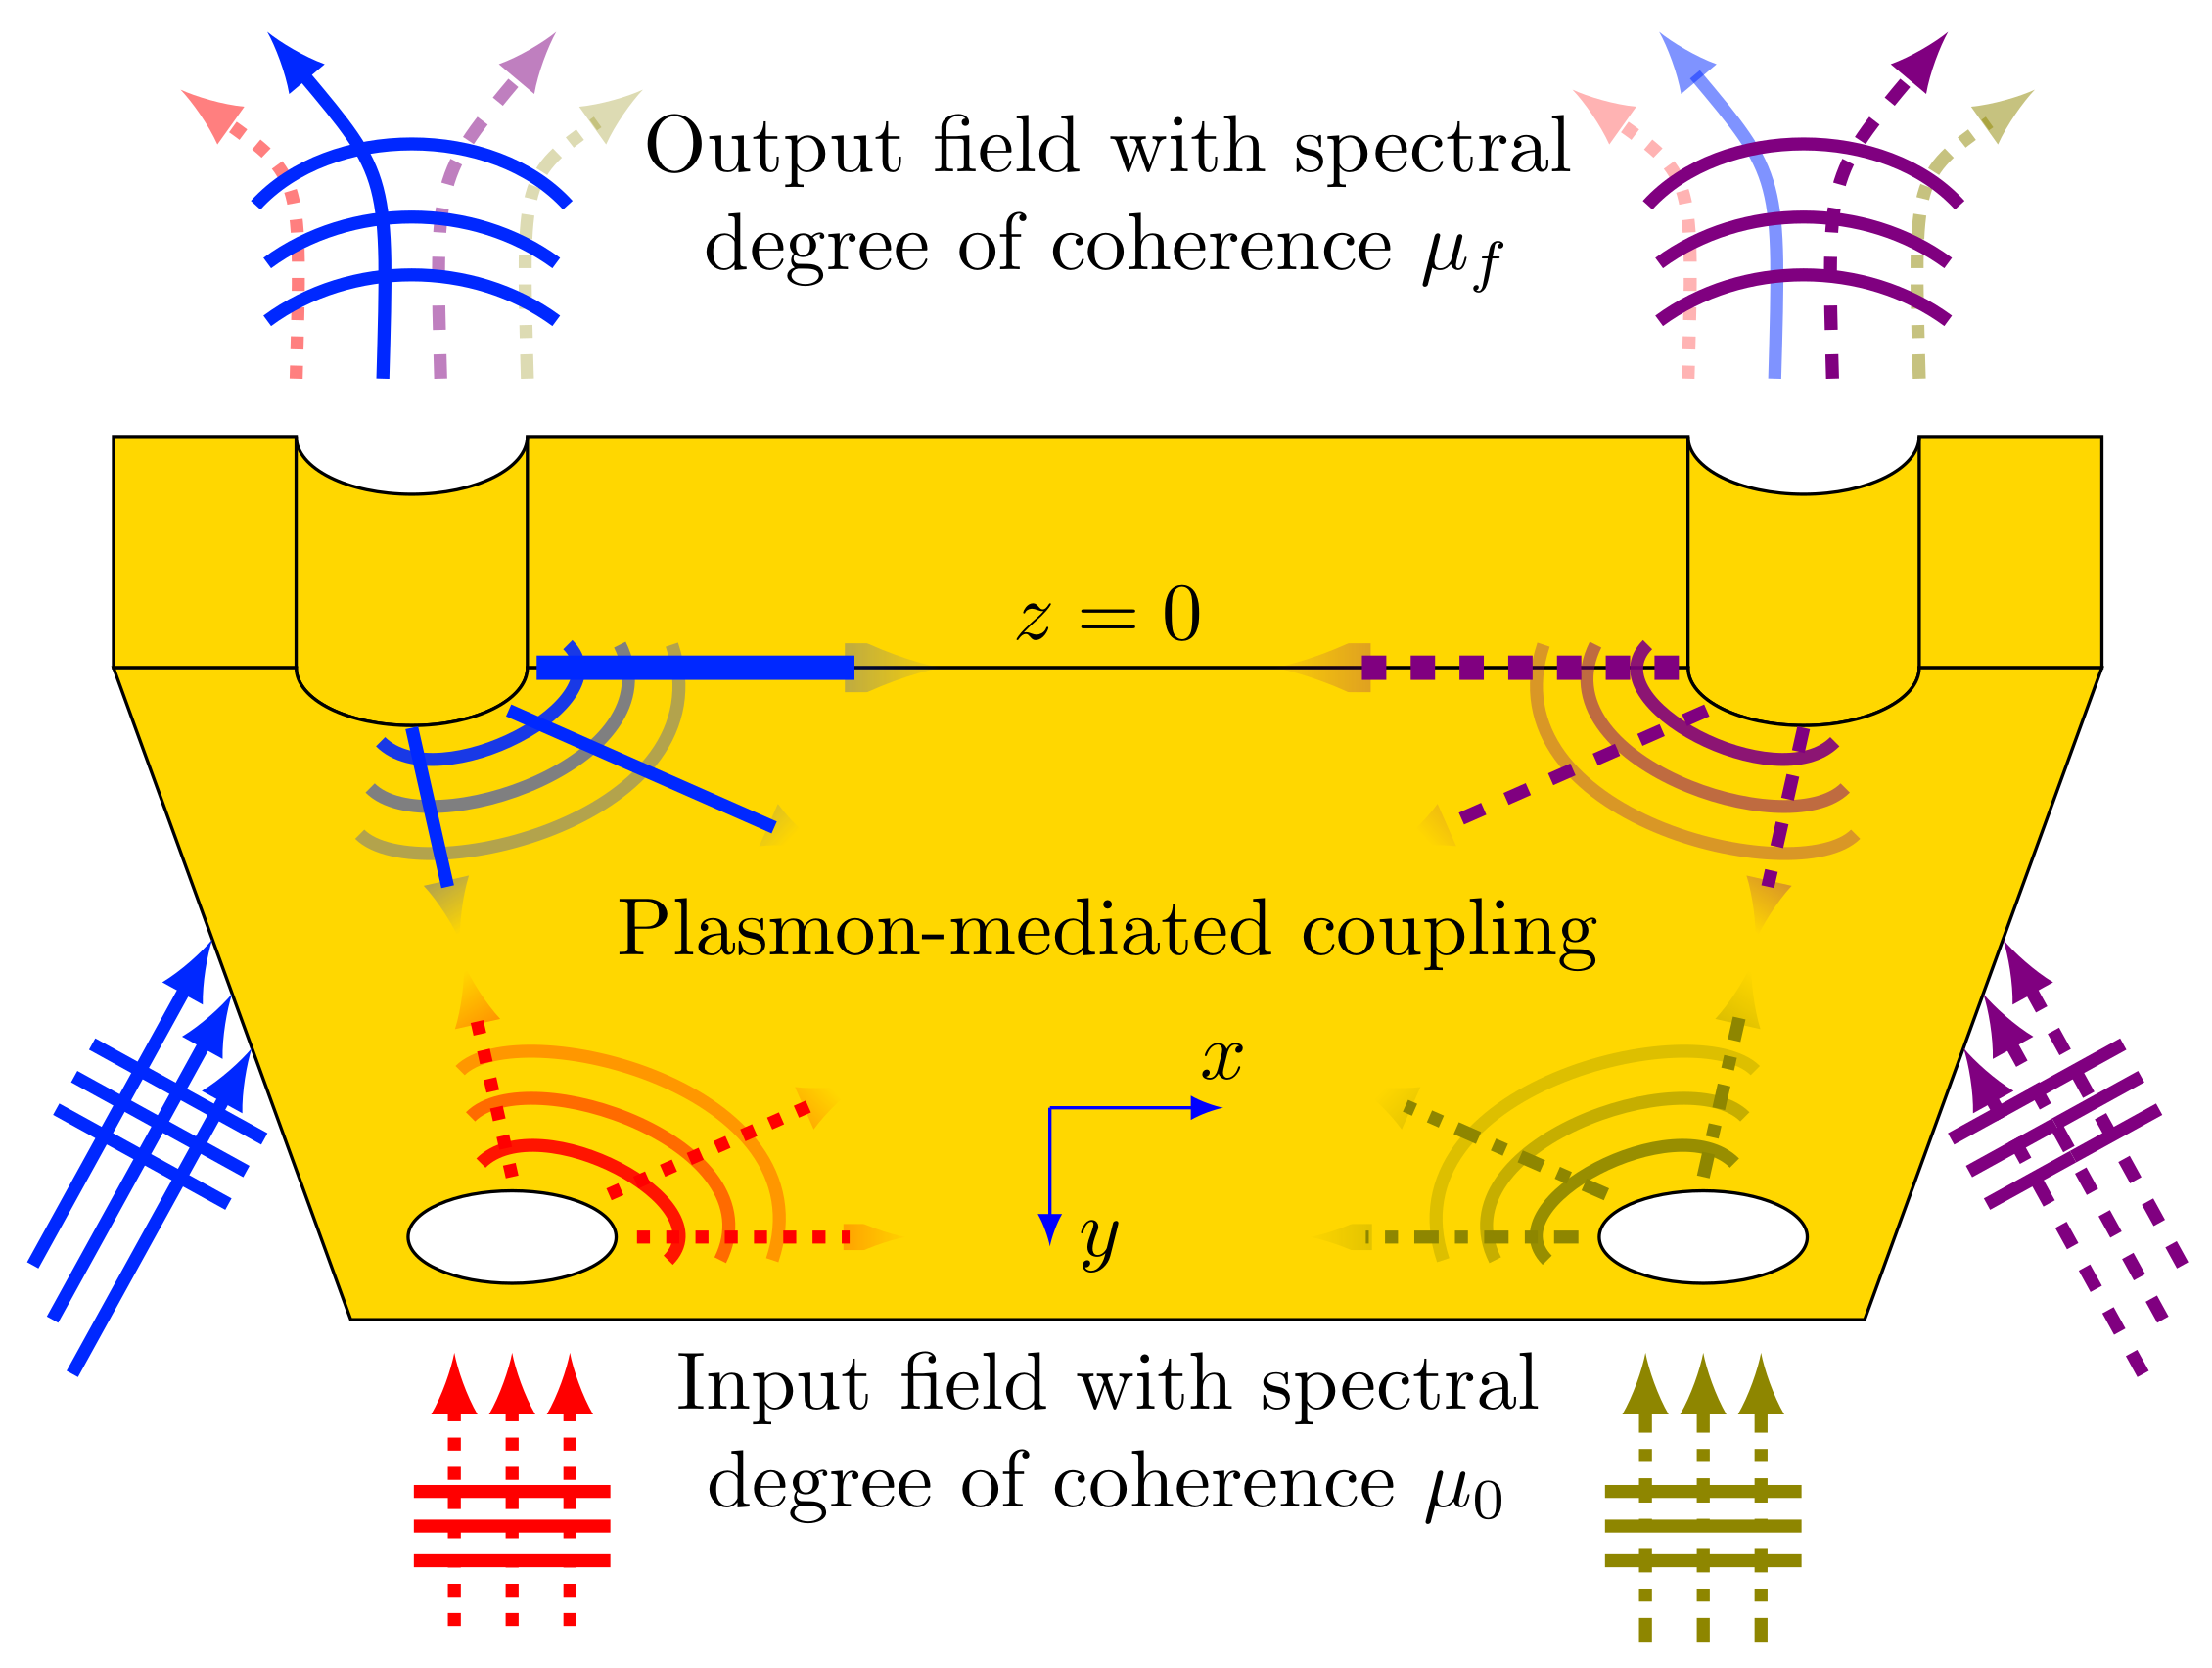
2. Review of the Model

To simulate the controlled coherence plasmonic source, we employ the scalar model first introduced in Reference [17], with the modifications that were introduced in Reference [21]. We consider a free-standing gold film of subwavelength thickness suspended in free space perforated by a periodic array of holes of subwavelength diameter; the holes are typically separated by a distance of several wavelengths, as depicted in Figure 1. We take the film to lie in the z = 0 plane.
A partially coherent light field with spectral degree of coherence μ 0 ( r 1 , r 2 ) between pairs of points r 1 and r 2 is incident on the film from the z < 0 side. Upon contact with the film, light striking a hole will partially transmit directly through the hole to the z > 0 side of the film, but it will also create a surface plamon polariton (SPP) wave, which will propagate away from the hole. As each SPP strikes another hole, it can either scatter into another SPP or decouple from the surface and be transmitted through the hole to the z > 0 side as a light wave. A study of a three-slit Young-style experiment with SPPs, applying an exact solution of Maxwell’s equations, demonstrated that the middle slit does not prevent SPPs from propagating between the outer holes [23], so we do not expect that the holes in our two-dimensional array will significantly obstruct SPPs. The end result is that the light being emitted from any given hole on the z > 0 side will be a combination of light originally incident upon that hole and light incident upon the other holes in the array. This transmitted light will have new correlations introduced during the plasmon-mediated coupling process and so will have a new spectral degree of coherence μ f ( r 1 , r 2 ) at the output.
This model may be broadly broken into two parts: the mathematical description of a partially coherent Schell-model wave as an incoherent superposition of plane waves, and the exact scattering and transmission model for a coherent plane wave illuminating the hole array. We describe each of these in turn.

2.1. Coherence Model

We take our input field to be a quasi-monochromatic scalar field with central wavelength λ 0 and with Gaussian-Schell model coherence. A Gaussian-Schell model field will have a spectral degree of coherence μ 0 ( ρ n , ρ m ) between two points ρ n and ρ m that depends only on their separation ρ m ρ n in the form
μ 0 ( ρ n , ρ m ) = exp ( ρ m ρ n 2 2 δ 2 ) ,
where δ is the transverse correlation length. Taking the field to have a uniform spectral density S 0 in the z = 0 plane, the cross-spectral density of the field may be written as
W 0 ( ρ n , ρ m ) = S 0 μ 0 ( ρ m ρ n ) .
This cross-spectral density can expressed in a helpful form by writing the spectral degree of coherence μ 0 ( ρ n , ρ m ) in terms of its Fourier transform μ 0 ( ρ m ρ n ) , i.e.,
μ ˜ 0 ( k ) = 1 2 π δ k 2 exp ( k 2 2 δ k 2 ) ,
with δ k : = 1 / δ .
The cross-spectral density then becomes
W 0 ( ρ n , ρ m ) = μ ˜ 0 ( k ) S 0 e i k · ( ρ m ρ n ) d 2 k .
It is to be noted that Equation (4) describes the cross-spectral density as an incoherent superposition of plane waves ϕ k ( ρ ) , defined as
ϕ k ( ρ ) : = S 0 e i k · ρ .
With this definition, we may write
W 0 ( ρ n , ρ m ) = μ ˜ 0 ( k ) ϕ k * ( ρ n ) ϕ k ( ρ m ) d 2 k .
Equation (6) is analogous to a coherent-mode representation [24] of the cross-spectral density of the field on the illuminated side of the film. In a formal coherent-mode expansion, the field is expanded into an incoherent superposition of square-integrable modes that are orthogonal over the domain of interest. In this case, it represents the illuminating field as an incoherent superposition of plane waves that are orthogonal over the z = 0 plane. Each of these plane waves acts as a coherent monochromatic wave and may be propagated individually through our plasmonic system. On the dark side of the metal plate, the modes will remain incoherent, so the cross-spectral density can be written as
W f ( ρ n , ρ m ) = μ ˜ 0 ( k ) ψ k * ( ρ n ) ψ k ( ρ m ) d 2 k ,
where ψ k ( ρ ) is the field of the kth mode on the dark side of the film. The output spectral degree of coherence is therefore obtained from the expression,
μ f ( ρ n , ρ m ) = W f ( ρ n , ρ m ) S f ( ρ n ) S f ( ρ m ) ,
with S f ( ρ m ) = W f ( ρ m , ρ m ) being the spectral density at the position ρ m .
To find the output coherence of the field, we therefore propagate the individual plane wave modes ϕ k ( ρ m ) through our system to produce the output modes ψ k ( ρ m ) ; we then combine those modes using Equations (7) and (8). The modes ψ k ( ρ m ) are determined by a multiple scattering model, which we consider next.

2.2. Plasmon Scattering Model

To study the interactions of light and SPPs with an array of subwavelength-size holes, we employ a Foldy–Lax model [25,26] of SPP scattering on the metal surface, which takes into account multiple scattering of SPPs by holes. In this model, the Green’s function for two-dimensional wave propagation is used to describe the propagation between holes; asymptotic boundary conditions are automatically included in the Green’s function. This model may be arranged as follows.
Upon striking a hole at position ρ n , light may be reflected, directly transmitted through the hole, or converted into an SPP. We neglect the reflected light and imagine that the output mode ψ k ( ρ n ) consists of some fraction α of the mode ϕ k ( ρ n ) that has propagated directly through the hole, and contributions from surface plasmons that have propagated from all other holes. The output mode at ρ n is thus
ψ k ( ρ n ) = α ϕ k ( ρ n ) + Ψ ( ρ n ) ,
where Ψ ( ρ n ) is the SPP field from the other holes, written as
Ψ ( ρ n ) : = β ( a , λ 0 ) m = 1 , m n N G ( ρ n , ρ m ) ψ k ( ρ m ) .
Here, β ( a , λ 0 ) is an electromagnetic scattering parameter and G ( ρ n , ρ m ) is the 2D Green’s function representing the plasmon wave propagating from ρ m to ρ n ,
G ( ρ n , ρ m ) : = i 4 H 0 ( 1 ) ( k sp ρ m ρ n ) ,
where H 0 ( 1 ) is the zeroth-order Hankel function of the first kind. The quantity k sp is the surface plasmon wavenumber,
k sp ( λ 0 ) = k 0 ϵ 0 ϵ m ( λ 0 ) ϵ 0 + ϵ m ( λ 0 ) ,
ϵ 0 is the dielectric constant of free space, ϵ m ( λ 0 ) is the dielectric constant of the metal, and k 0 = 2 π / λ 0 .
The scattering parameter β ( a , λ 0 ) represents the strength of SPP scattering by a hole, and it depends on the hole radius a and the center wavelength λ 0 . The derivation of β ( a , λ 0 ) is somewhat lengthy; full details can be found in Reference [17]. In that reference, the cylindrical holes in the film are modeled as spherical holes in a metal background, resulting in a scattering strength of
β ( a , λ 0 ) ( 2 π a λ 0 ) 3 1 ϵ m ( λ 0 ) / ϵ 0 1 + 2 ϵ m ( λ 0 ) / ϵ 0 .
Because the holes are taken to be subwavelength in size, it is expected that there will be little quantitative difference in modeling cylindrical holes as spherical cavities.
We note that the assumptions in the derivation of β ( a , λ 0 ) mean that our film is assumed to be about as thick as the hole diameter. Additionally, we note that we are treating the holes as point scatterers since they are assumed to be of sub-wavelength size and to be separated by multiple wavelengths. We restrict ourselves to the case when the distance between neighboring holes is less than the SPP propagation length to ensure that SPPs actually provide an interaction between holes.
To model the wavelength dependence of ϵ m ( λ 0 ) , we use the critical points model described in References [27,28], which describes the metal’s dielectric function as
ϵ m ( λ 0 ) = ϵ 1 λ p 2 ( 1 / λ 0 2 + i / γ p λ 0 ) + n = 1 2 A n λ n e i ϕ n ( 1 / λ n 1 / λ 0 i / γ n ) + e i ϕ n ( 1 / λ n + 1 / λ 0 + i / γ n ) ,
where λ p is the plasma wavelength, λ n is the interband transition wavelength, γ p and γ n are damping terms, and A n is an amplitude. Values used in Equation (14) for gold can be found in Table 1.
The final expression for the output modes is
ψ k ( ρ n ) = α ϕ k ( ρ n ) + β ( a , λ 0 ) m = 1 , m n N G ( ρ n , ρ m ) ψ k ( ρ m ) .
This represents a system of N equations in N unknowns,
U = α U ( 0 ) + β ( a , λ 0 ) G U ,
where
U ( 0 ) : = ϕ k ( ρ 1 ) , ϕ k ( ρ 2 ) , , ϕ k ( ρ N ) T ,
U : = ψ k ( ρ 1 ) , ψ k ( ρ 2 ) , , ψ k ( ρ N ) T ,
where the superscript T denotes matrix transposition, and
G : = 0 G ( ρ 1 , ρ 2 ) G ( ρ 1 , ρ N ) G ( ρ 2 , ρ 1 ) 0 G ( ρ 2 , ρ N ) G ( ρ N , ρ 1 ) G ( ρ N , ρ 2 ) 0 .
We note that the diagonal elements of G are set to 0 since the plasmon waves do not self-interact. Formally, we can obtain the output modes ψ k ( ρ ) using matrix inversion,
U = α I β ( a , λ 0 ) G 1 U ( 0 ) ,
or we may determine U from Equation (16) using any technique for solving a linear system of equations.

2.3. Average Coherence and Transmittance

Quantifying the transmittance of a plasmonic hole array and the output coherence of such an array presents significant challenges. Though the input spectral density is constant and the input spectral degree of coherence is homogeneous and can be characterized by a single parameter δ , neither of these properties hold for the transmitted field. Both the transmission and the spectral degree of coherence of the output depend on the hole or holes they are measured at, and so we must introduce quantities that characterize the behavior of the output as a whole.
The normalized transmission of light T ( ρ ) through a single hole can be defined as
T ( ρ ) = S f ( ρ ) S 0 ( ρ ) .
In defining an averaged transmittance, we first note that the transmittance, as defined in Equation (21), will always be scaled by α 2 in the numerator; this can be seen from Equation (20). However, α is expected to be a slow function of λ 0 , whereas transmittance is a fast function of λ 0 , so we do not expect the value of α to make any significant change to the transmittance value. Since we want to compare how transmittance and coherence change together as a function of wavelength, we can focus on the qualitative changes to these quantities. Therefore, we elect to scale out α by defining a scaled transmittance T s :
T s ( ρ ) : = T ( ρ ) α 2 .
We then define the averaged transmittance T s avg across all holes in the array as
T s avg : = 1 N n = 1 N T s ( ρ n ) .
Since coherence is defined in terms of pairs of holes, we define the averaged coherence across all pairs of holes in the array, M f , as
M f : = 1 N n = 1 N 1 N 1 m = 1 , m n N μ f ( ρ n , ρ m ) .
We use M 0 to represent the average coherence of the field illuminating the holes right before the gold film. In general, μ f is a complex number; in Equation (24), we use | μ f | to avoid misleading low averages due to terms that are out of phase. We do not sum over m = n because | μ f | = 1 for m = n by definition. The value of α does not affect the spectral degree of coherence, since α is present in both the numerator and denominator of Equation (8).

3. Results and Discussion

As has been shown in previous work [17,21] and will be seen in the results to come, spatial coherence is typically enhanced over very narrow wavelength ranges that correspond to plasmon resonances in the period hole array. We envision designing a controlled coherence plasmonic light source such that the operating wavelength is near one of these resonances, allowing the spatial coherence to be dramatically changed with a small change in the center wavelength. With this in mind, we examine the effect of array shape, hole spacing, hole diameter, and number of holes on the average transmittance and coherence of the device.
We consider two kinds of arrays, as shown in Figure 2: square arrays and triangular arrays. Both are periodic with lattice constant d. We define both arrays in terms of the number of holes along the vertical axis, N s . A square array is simply defined as an array with N s holes on each side. For the triangular array, we define the array to have N s horizontal rows of holes, where the bottom row has N s holes and the row above has N s 1 holes. The rows then alternate up the array between having N s holes and N s 1 holes. Defined this way, both kinds of arrays will have approximately N s 2 holes; specifically, the number of holes in a triangular array is
N triangular = N s 2 N s + N s 2 N s 1 ,
where ⌈⌉ and ⌊⌋ are the ceiling and floor operators, respectively.
For these periodic arrays, there are three physical parameters we vary: the lattice constant d, the hole radius a, and the array size N s . For all simulations, we set δ = 1000 nm. Unless stated otherwise, the values for the other parameters when held fixed are N s = 6 , d = 1000 nm, and a = 200 nm.

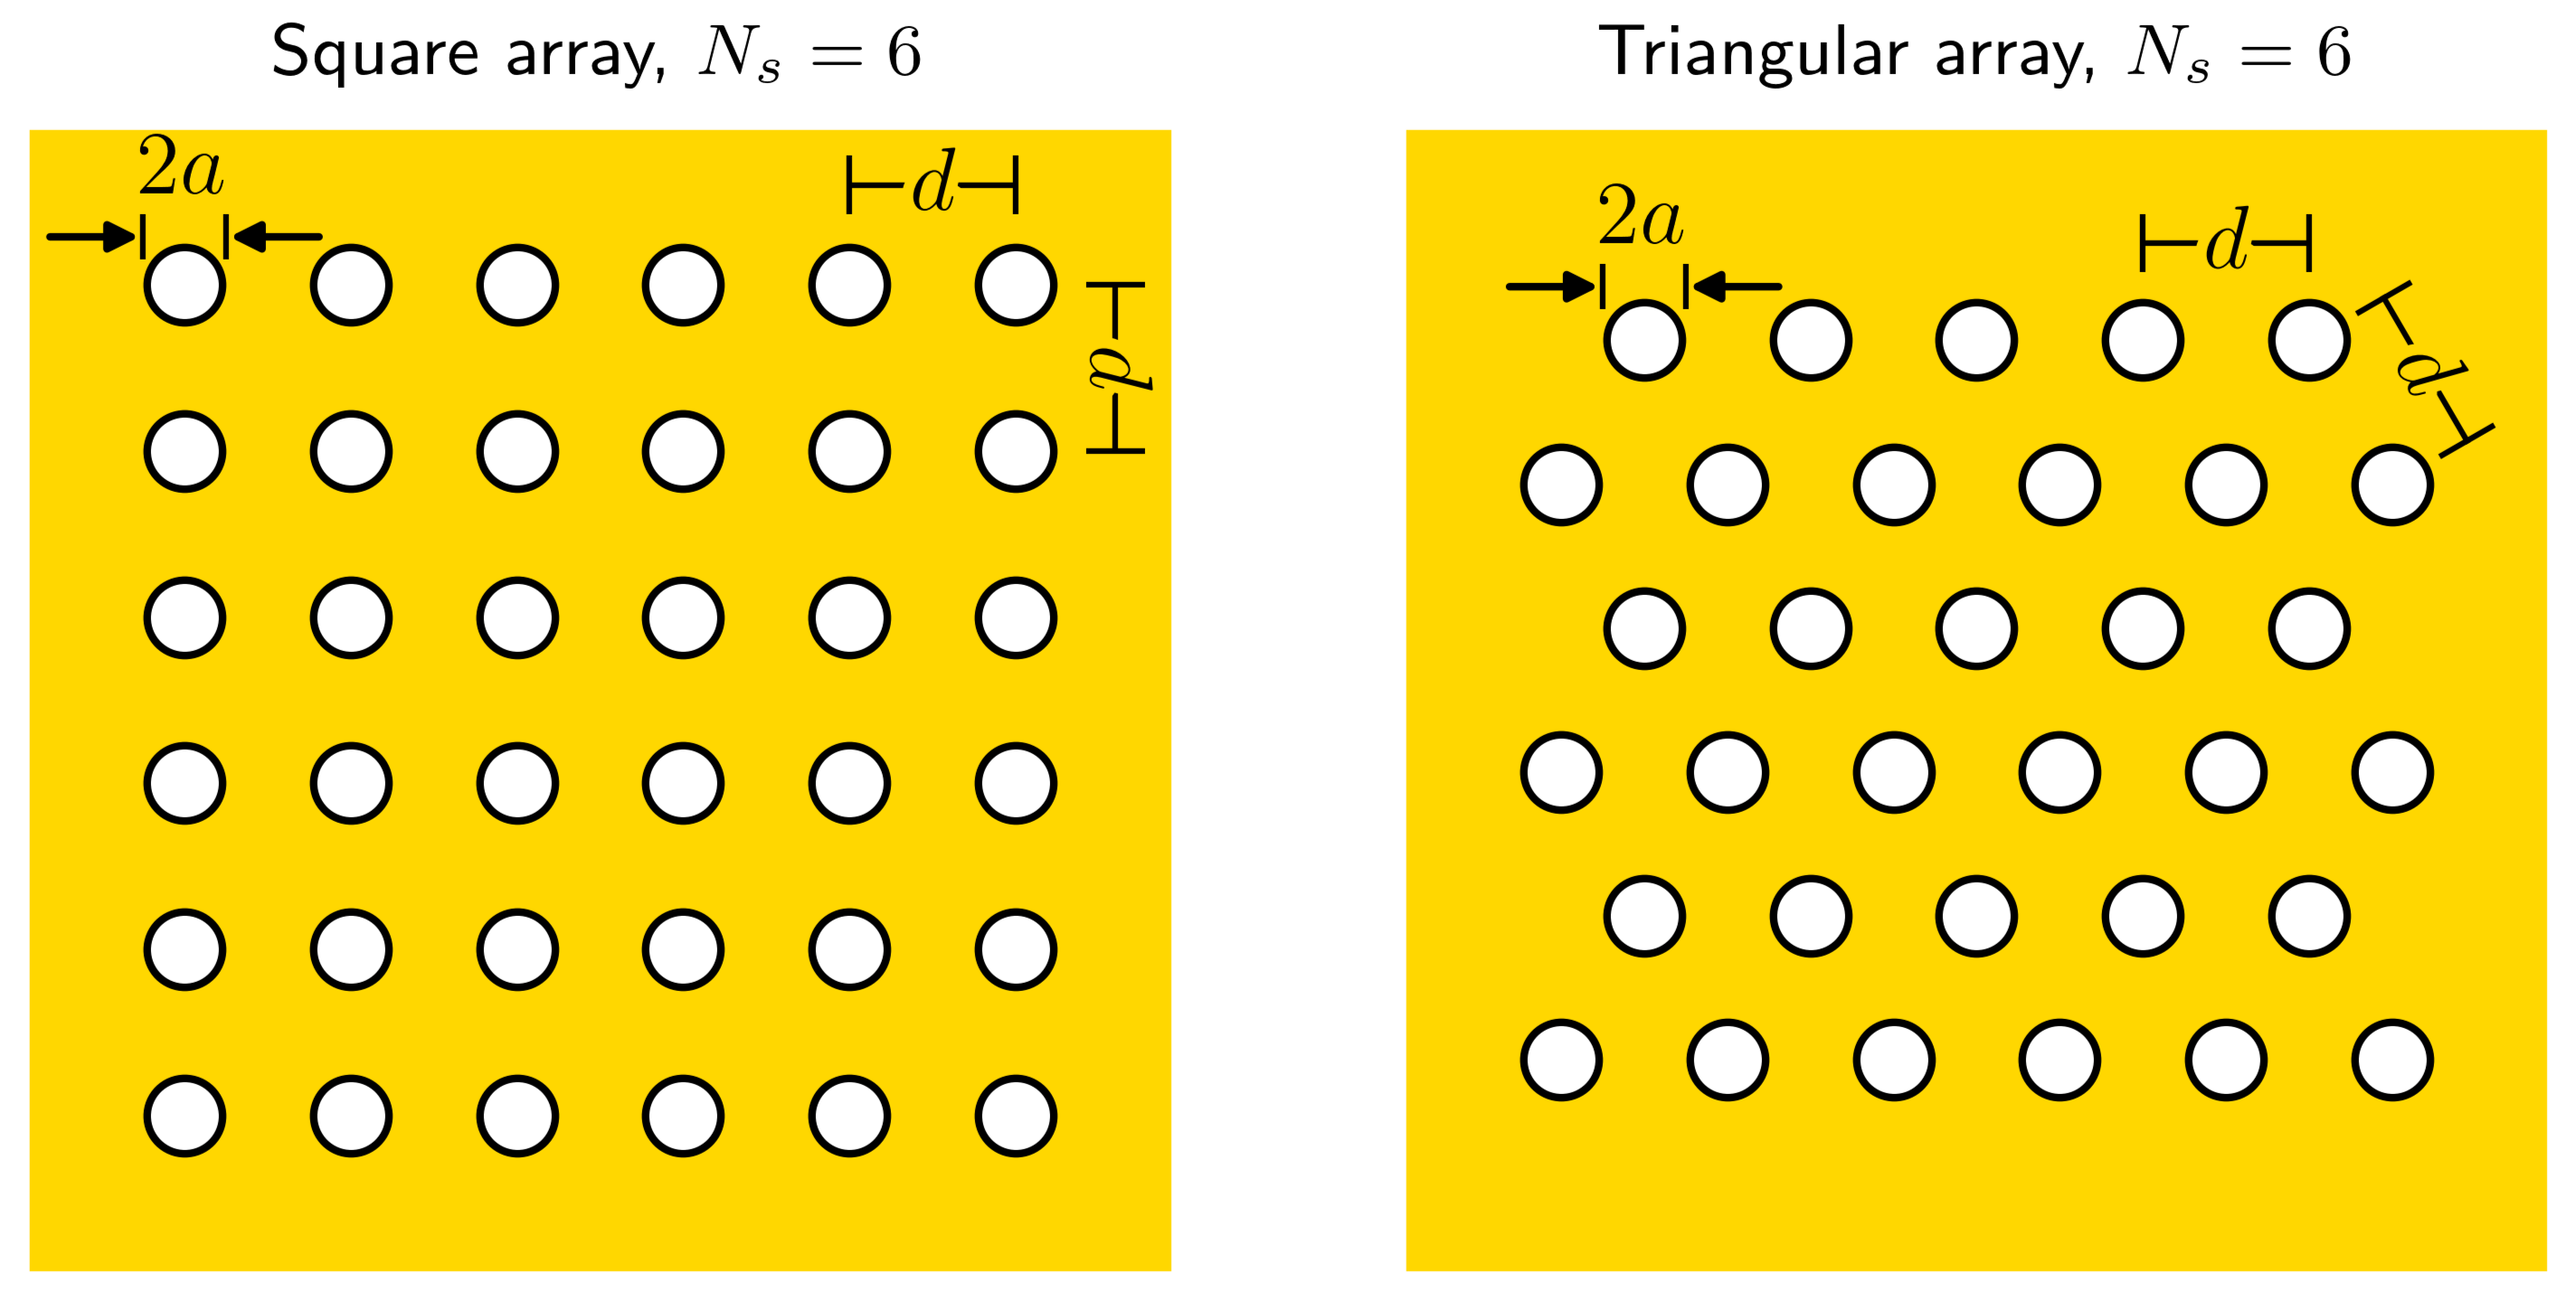
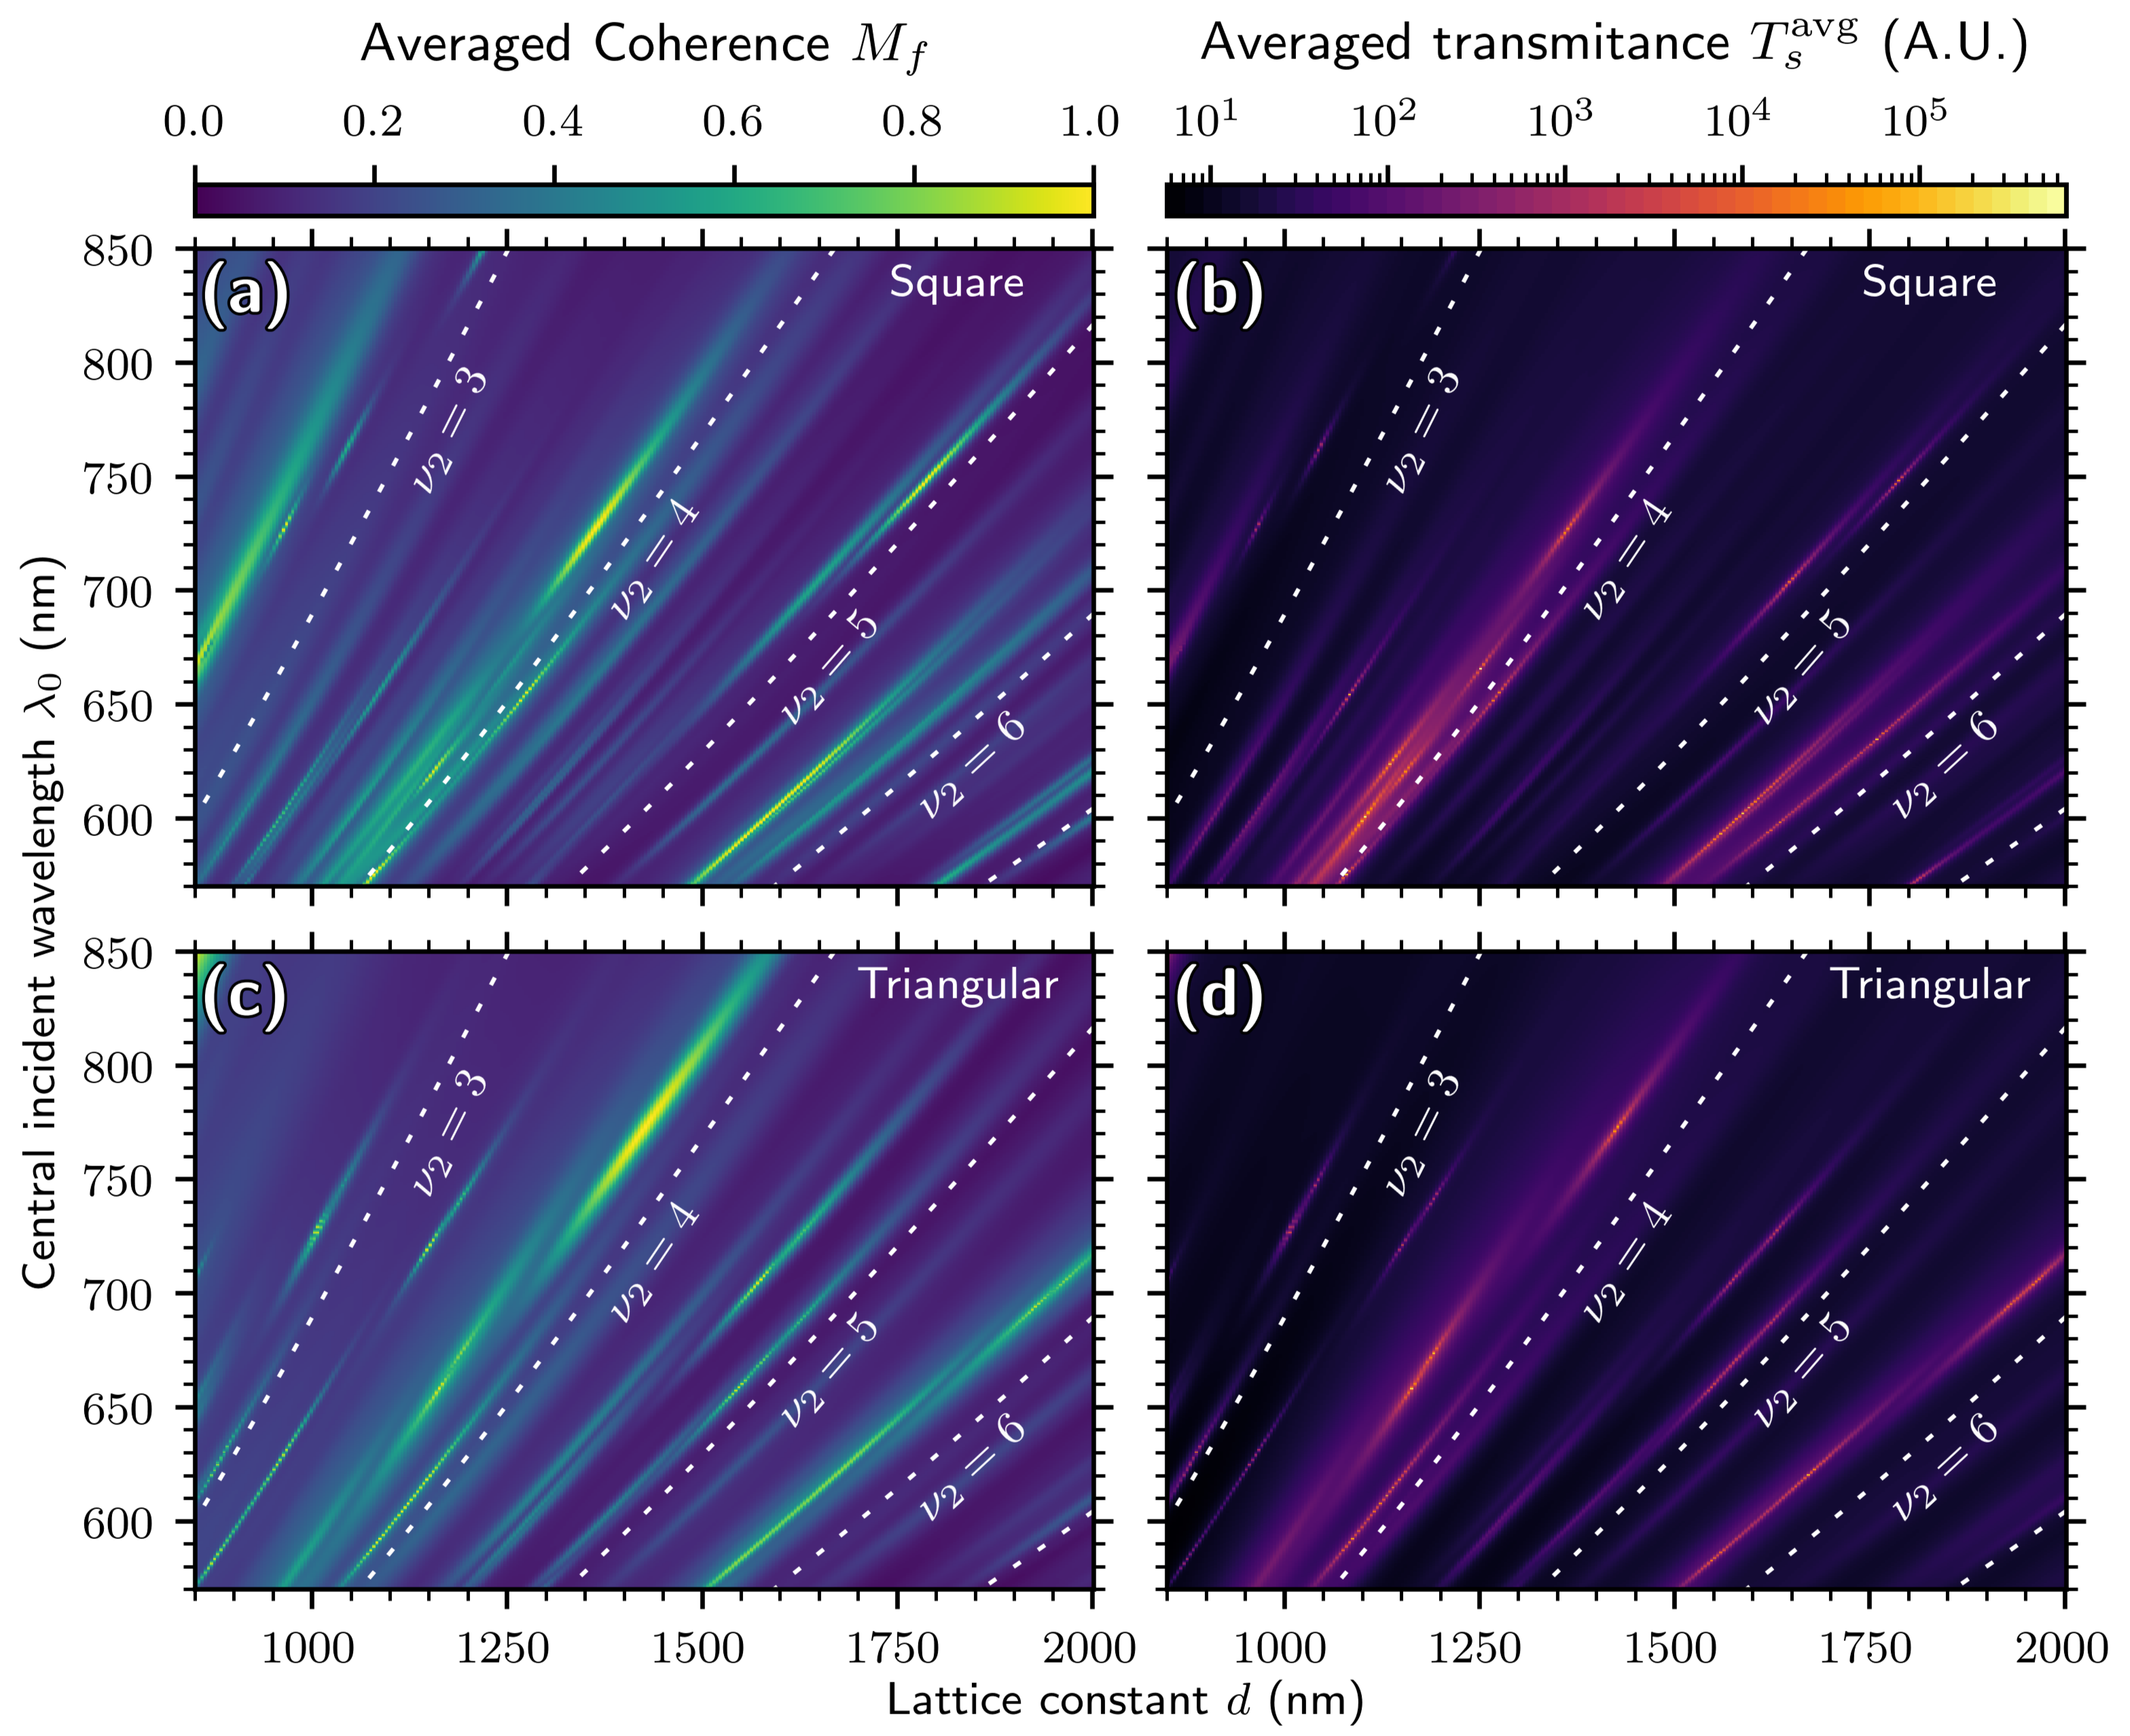
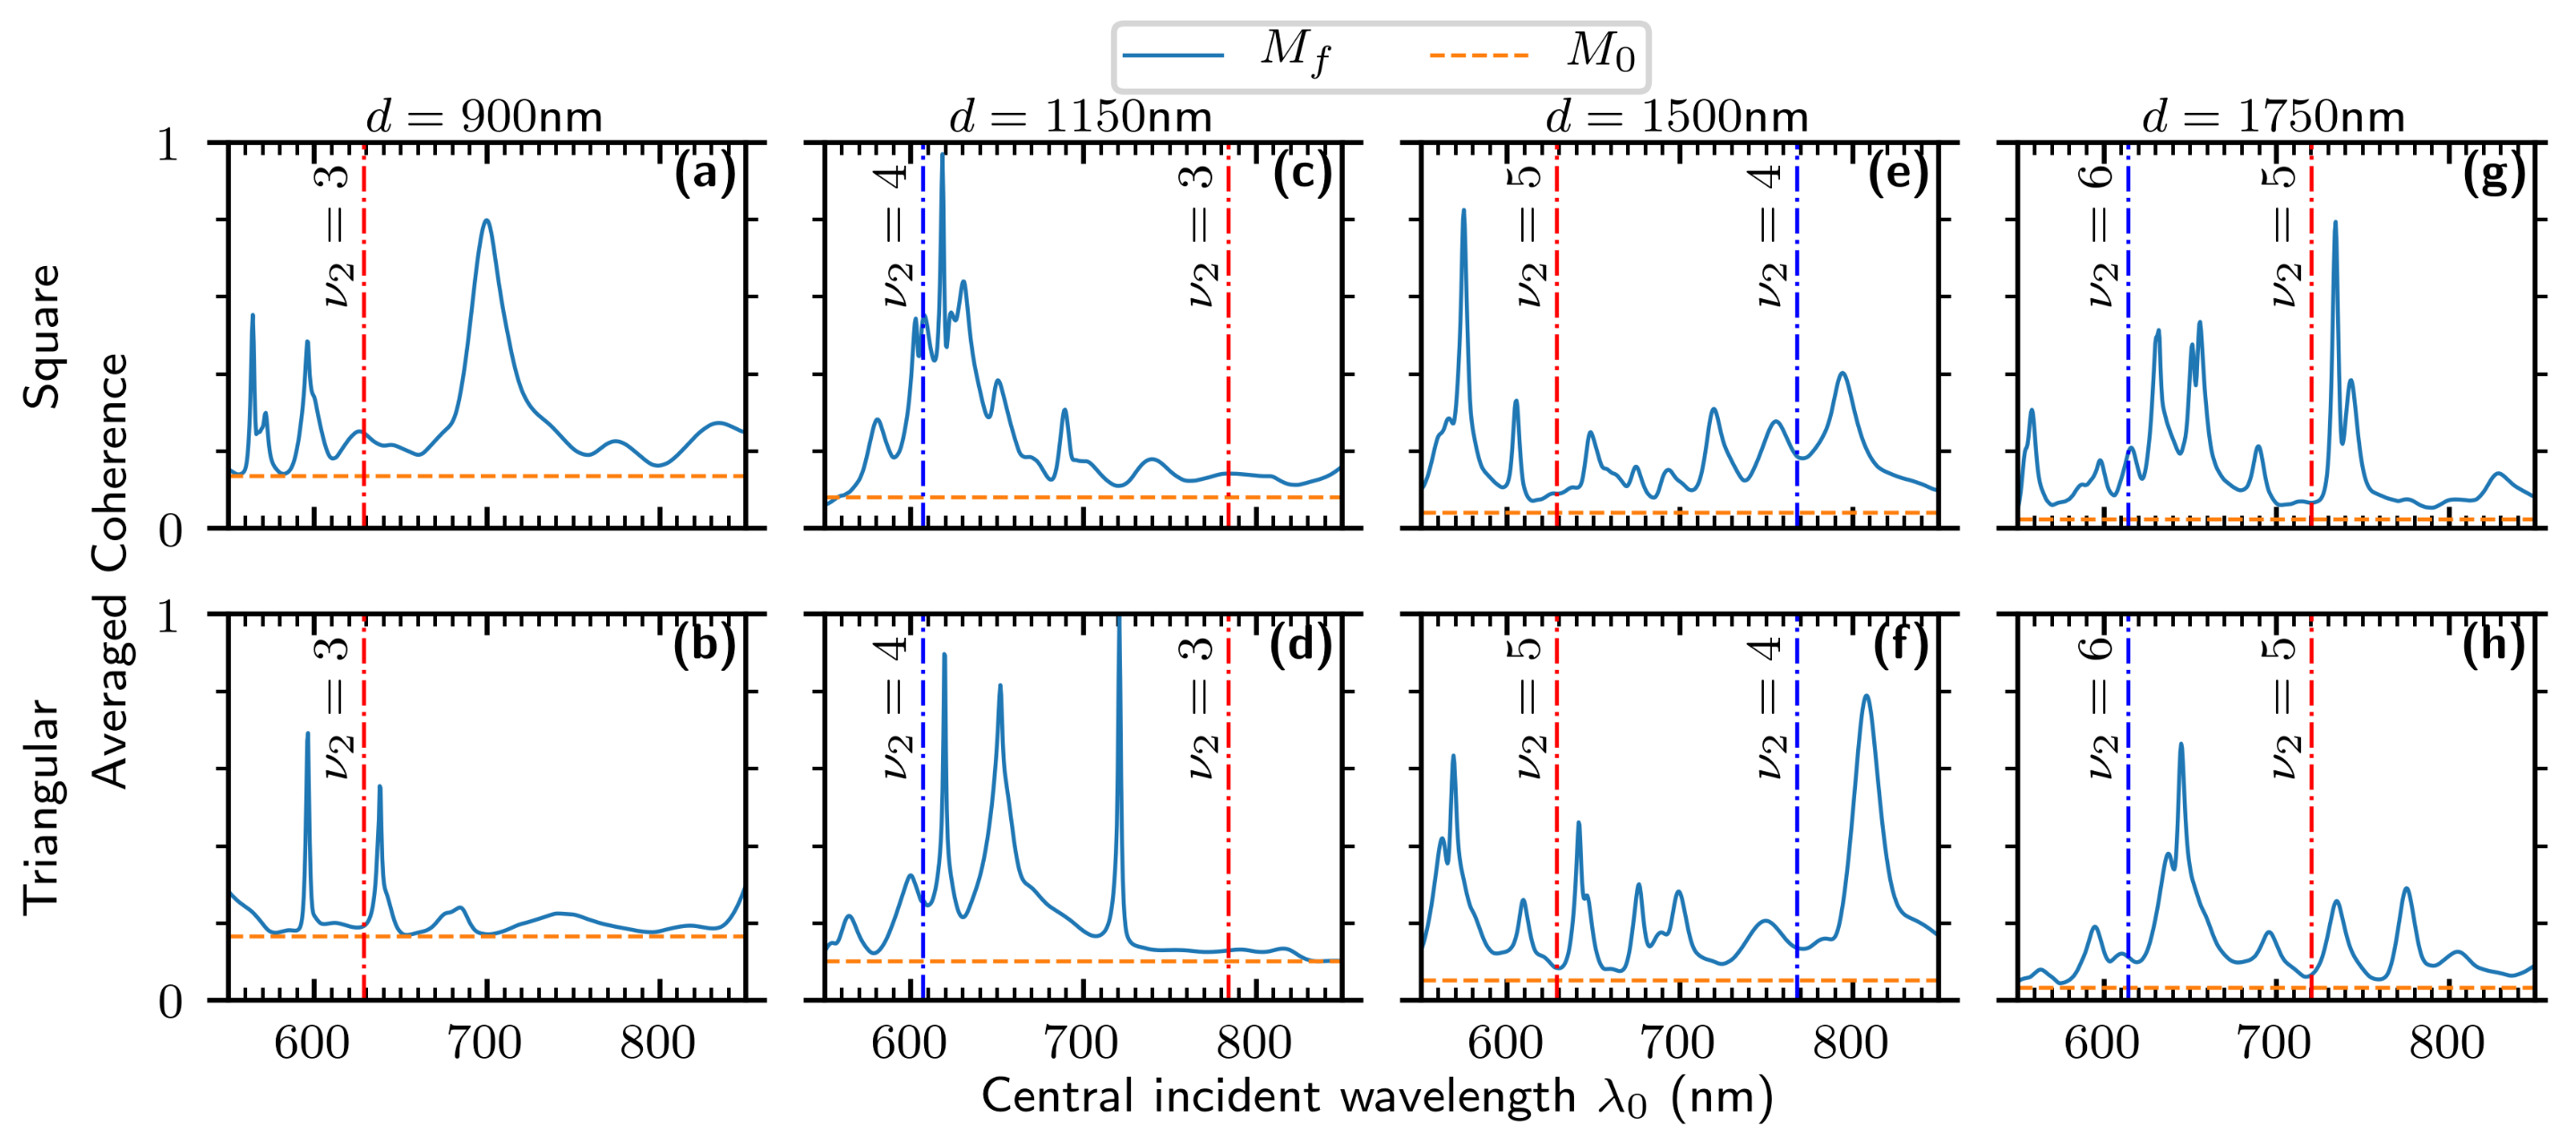
3.1. Changing Lattice Constant d

The lattice constant will determine the wavelengths at which the spatial coherence has resonances and at which it has coherence bandgaps, broad spectral regions where M f M 0 , as the point of this proposed device to cause significant coherence changes over a small variation in wavelength. The work in Reference [21] explored coherence bandgaps in one-dimensional linear arrays; the authors showed that bandgaps and resonances depend on λ 0 and d and that they could occur when
R k sp d = ν 2 π ,
where k sp is the surface plasmon wavenumber given by Equation (12), R · denotes the real part, and ν 2 is an integer. Bandgaps (resonances) can occur at wavelengths with odd (even) values of ν 2 . This simple relation worked well for the 1D linear arrays considered in Reference [21], but may not hold as well when considering 2D arrays, where distances between holes are not all integer multiples of d.
In Figure 3, we plot the averaged coherence and transmittance of arrays with varying d from 850 nm to 2000 nm. Looking at the coherence of both arrays in Figure 3a,b, we can see that there are “bands” of high coherence and of low coherence that approximately follow the lines of constant ν 2 . For both arrays, the ν 2 = 3 and ν 2 = 5 lines are local minima of fairly low value and are therefore likely to be bandgaps. It is not clear if the ν 2 = 4 line is a maximum or minimum; we will plot some cross-sections shortly to examine this in more detail. Interestingly, the ν 2 = 6 line is a local maximum (though a low-valued one) for the square array, but it is a local minimum for the triangular array.
In Figure 3b,d, we can see that the transmittance follows the coherence closely; in fact, the logarithm of the transmittance has almost exactly the same shape as the coherence. This agrees with our argument that the increase of spatial coherence is an SPP resonance effect connected to the extraordinary transmission of light.
In Figure 4, we show the averaged input and output coherence for both array types for several characteristic values of d. In Figure 4a,b, where ν 2 = 3 , we can see that M f has coherence bandgap behavior for the triangular array: it is flat and approximately the value of M 0 . This is not quite the case for the square array, which has low M f near ν 2 = 3 , but not flat or near M 0 . Figure 4c,d shows that both arrays have resonances near ν 2 = 4 , especially the square array, which has a broader series of peaks about that wavelength. We can see the ν 2 = 5 line in Figure 4e,f. For both arrays, we have low coherence around ν 2 = 5 , though it is not quite clear whether either is a bandgap. Figure 4g,h shows the ν 2 = 6 line, and we can see that the spatial coherence is low there.
It is to be noted that the global changes in coherence can be very large, even over a relatively small range of wavelengths. In Figure 4c,d, for example, the average output coherence is nearly unity at λ 0 = 620 nm, even though the input coherence is low. It is to be stressed again that this is a global change in coherence, averaged over the whole array. In Figure 4d, we can see that the output coherence is almost unity over a peak centered on λ 0 = 720 nm with a peak width of only 10 nm. These results illustrate that it should be possible to make a device that can have large changes in global spatial coherence over a very short range of wavelengths.
Taken together, Figure 4 illustrates that 2D arrays have a richer and more complicated coherence structure than 1D arrays. However, the results indicate that Equation (26) gives a good qualitative description of key coherence features, and could be used as a first step in designing a coherence converting device.
It should further be noted from Figure 4 that the output coherence never drops below the input coherence. This is in stark contrast to the two slit case considered in Reference [10], where the output coherence could be greater or less than the input. Evidently, it is not typical for a suppression of spatial coherence via SPPs when a large number of holes are involved.

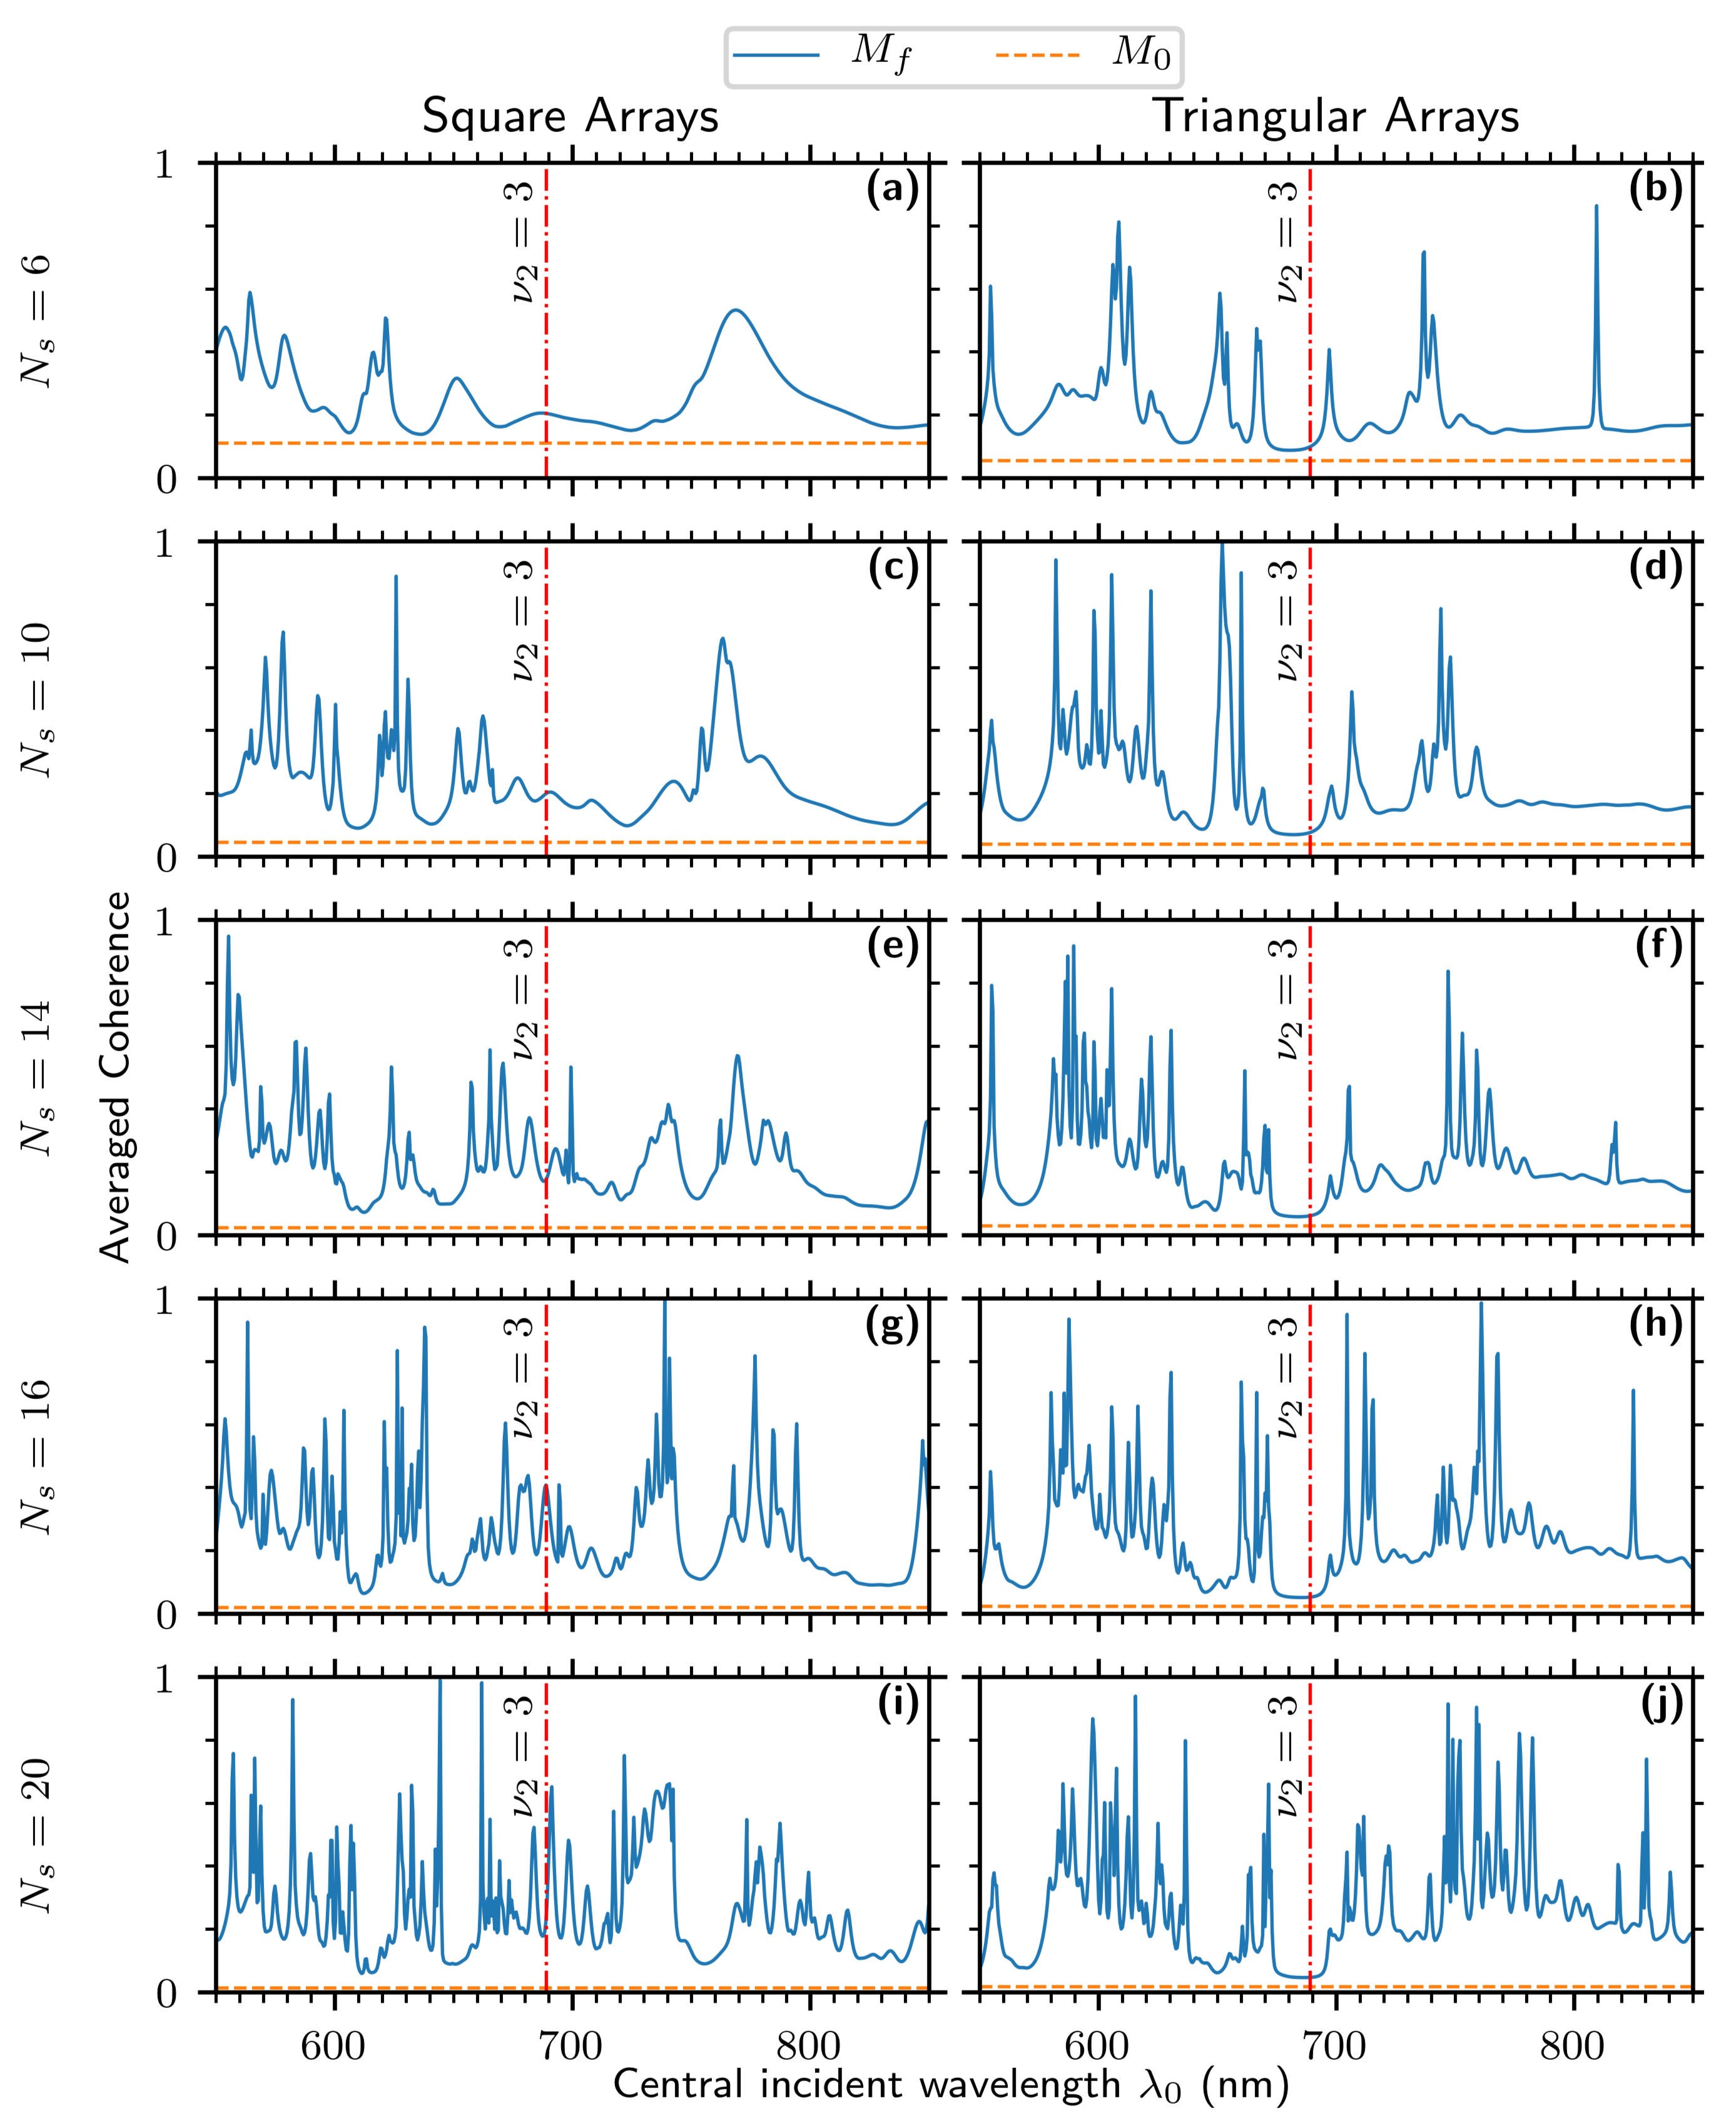
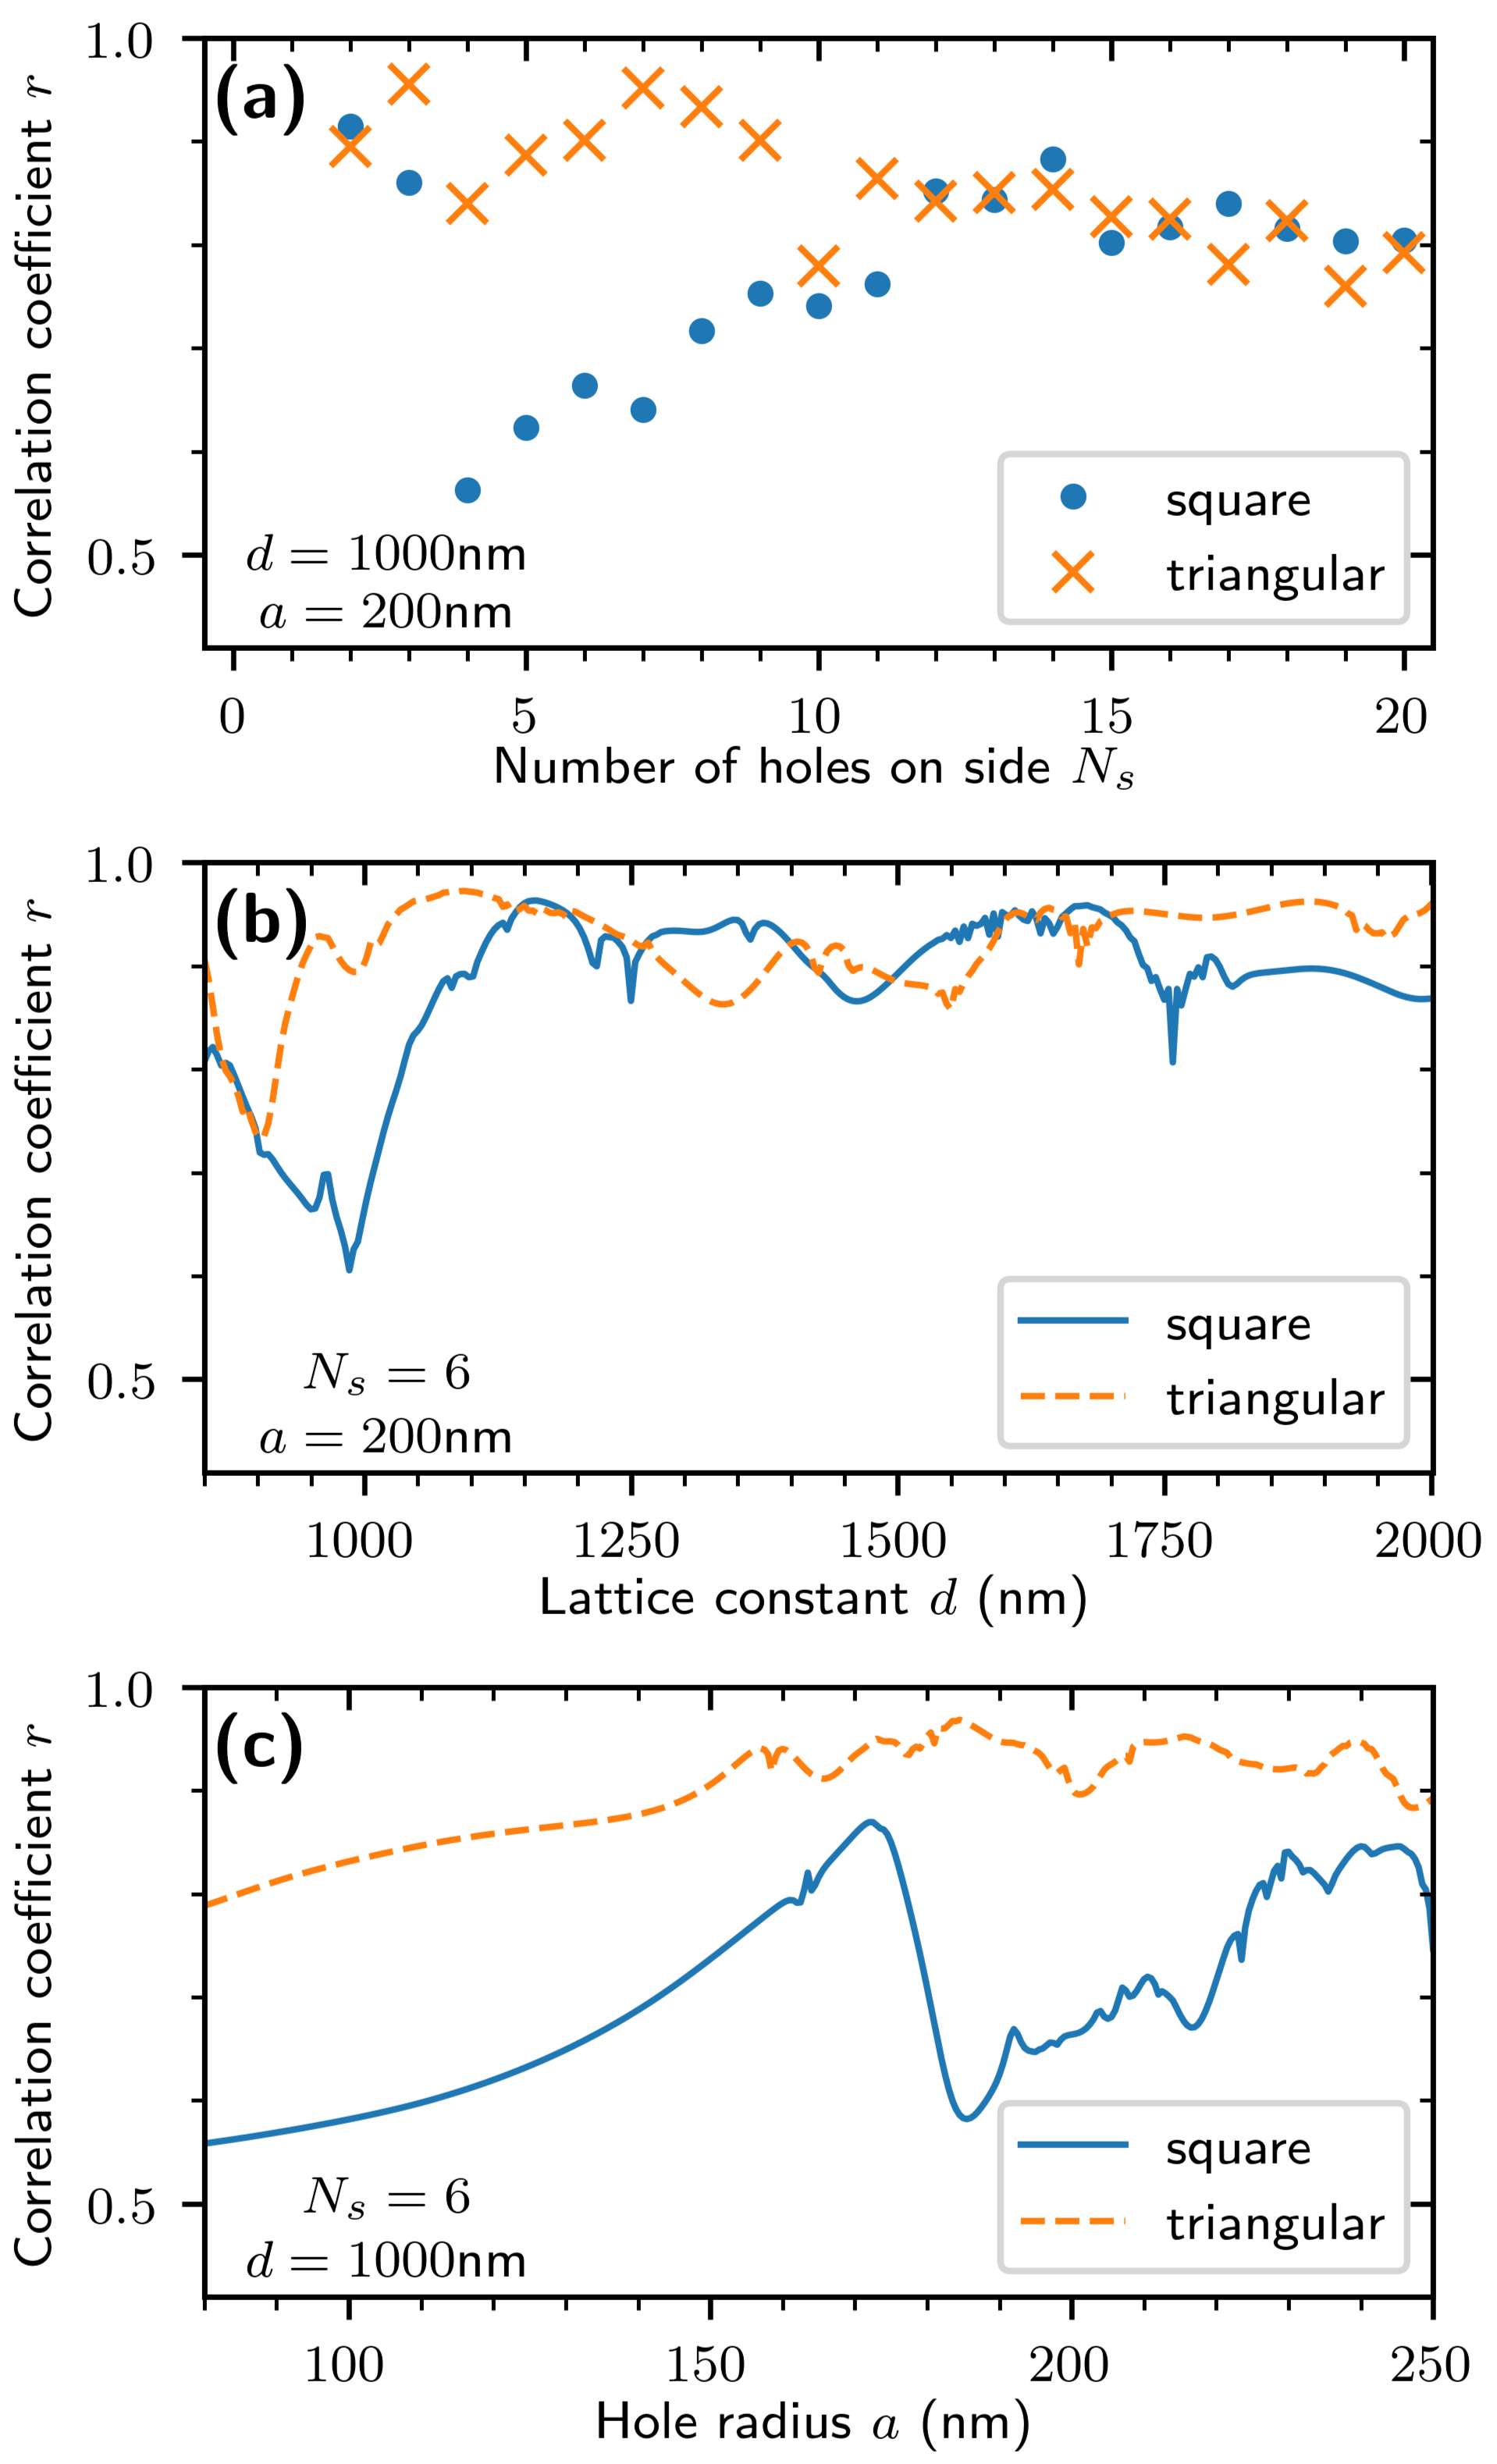
3.2. Changing Array Size N s

To create a global change of the state of coherence of a light beam, a controlled coherence plasmonic source must have holes over the entire cross-section of the illuminating beam, which would suggest dozens or even hundreds of holes. We next examine the effect of increasing N s to get a sense of the limiting behavior as the array grows.
In Figure 5, we plot M f and M 0 for several values of N s . There are two key observations. First, it is noteworthy that, when ν 2 = 3 , the triangular arrays have the expected bandgap, while the square arrays do not. The larger square arrays have regions at about λ 0 = 650 nm and λ 0 = 760 nm, where the coherence rapidly drops to a low value; these regions do not correspond to any value of Equation (26), but may be bandgaps associated with propagation lengths between non-nearest neighbor holes in the array. Second, while the output coherence changes drastically as N s increases from N s = 6 to N s = 14 , it does not change significantly from N s = 16 to N s = 20 . Because the SPPs have a finite propagation distance, there is a limit to how far they can create interactions between distant holes. Figure 5 suggests that increasing the array size beyond a certain threshold does not qualitatively change the resonance behavior.

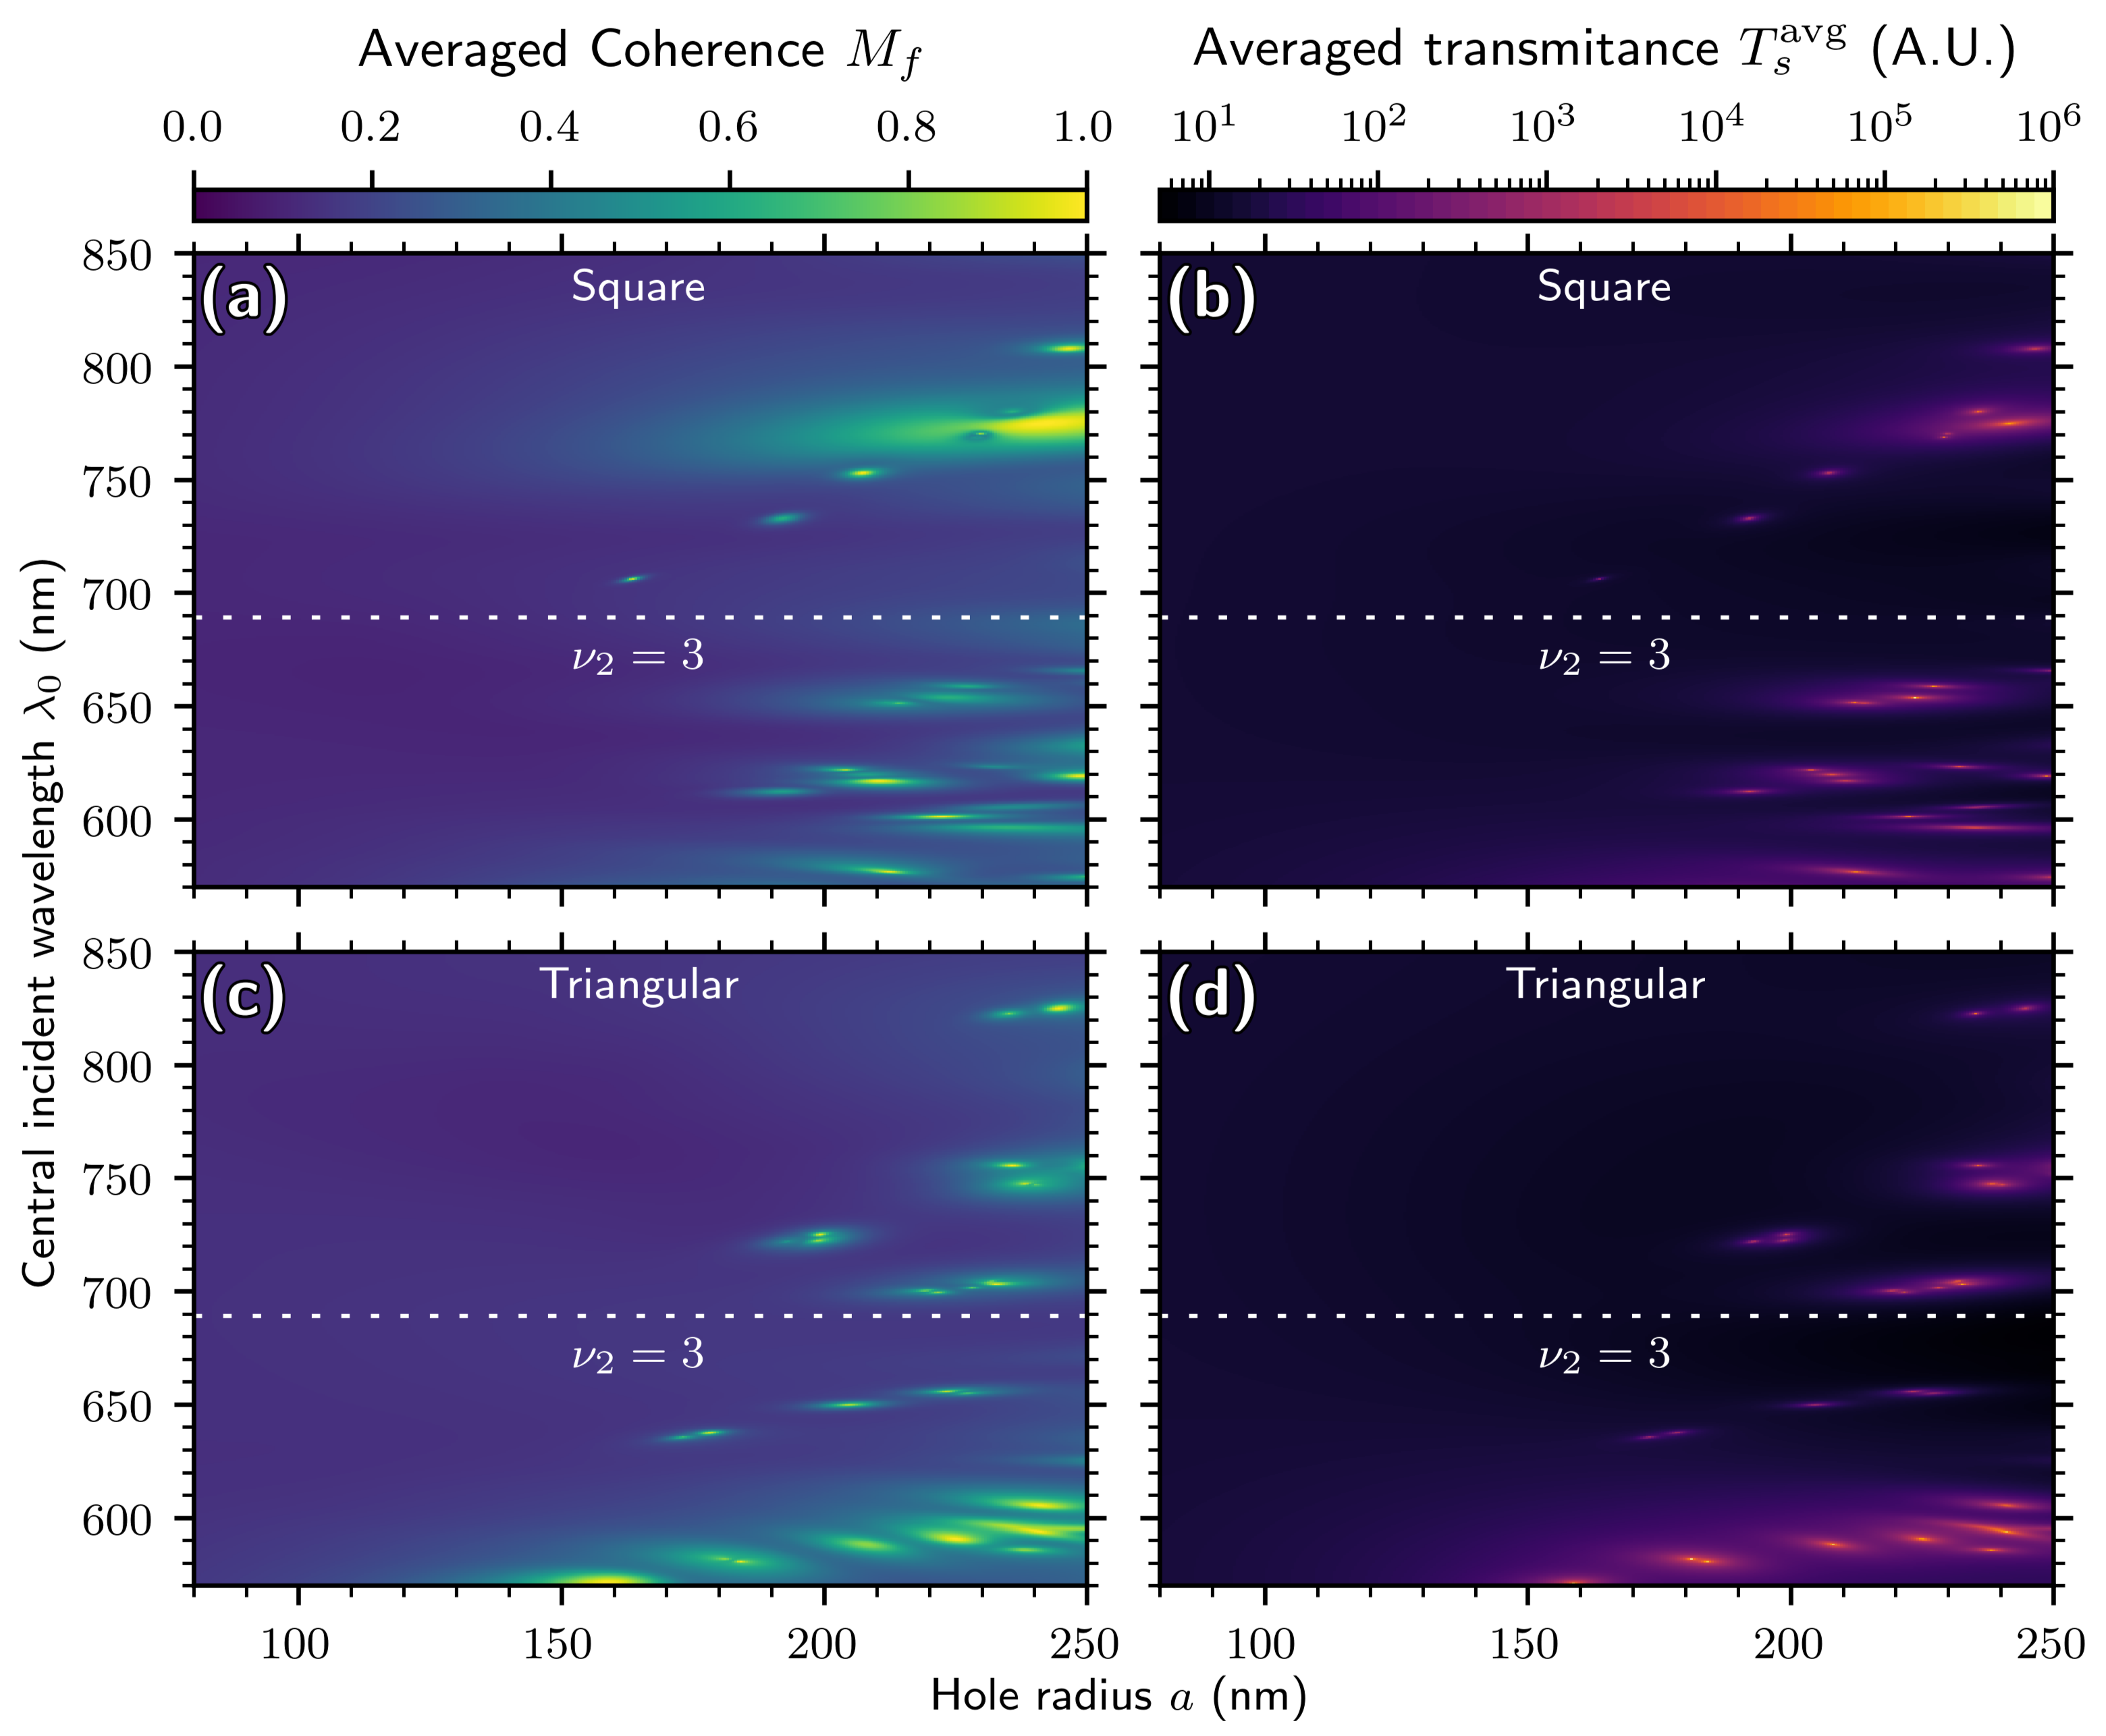
3.3. Changing Hole Radius a

The hole radius affects the electromagnetic scattering parameter β , as shown in Equation (13), which in turn determines the overall strength of the light-plasmon coupling. Increasing a, at least within the limits of our small hole approximation, should therefore increase the coupling and thus cause greater changes in the output coherence.
In Figure 6, we show the average coherence and transmittance of arrays upon varying a from 80 nm to 250 nm. We can see in Figure 6a,c that, M f is relatively low for a < 150 nm. After that threshold, resonance features appear and become increasingly more common. This matches our expectation that increasing a results in stronger light–plasmon coupling, which causes the output coherence to differ significantly from M 0 . In this configuration, we have M 0 0.110 for the square array and M 0 0.135 for the triangular array. It is noteworthy that none of the coherence peaks are on the ν 2 = 3 line; this is consistent with bandgap behavior. Figure 6b,d show that again that the coherence and transmittance coincide well.

3.4. Correlation between Coherence and Transmittance

Finally, as we noted in Figure 3 and Figure 6, there is a strong correlation between the averaged coherence and transmittance. We quantify this relationship by introducing a correlation coefficient between them,
r = λ 0 ( M f M f ¯ ) ( Γ Γ ¯ ) d λ 0 λ 0 M f M f ¯ 2 d λ 0 1 2 λ 0 ( Γ Γ ¯ ) 2 d λ 0 1 2 ,
where
Γ : = log 10 ( T s avg ) .
We use the logarithm of T s avg instead of using T s avg directly, both because of the wide range of values involved and because we have been plotting T s avg on a logarithmic scale anyway, so this calculation of r can correspond to what we have been observing in plots. In Figure 7, we plot r as a function of Ns, d, and a for both array types. We can see that this calculation confirms our observation that coherence tends to correspond well with transmittance.
The correlation between these quantities represents a limitation of such a controlled coherence light source, as it suggests that a low coherence state will have a lower throughput than a high coherence state; an ideal source will have the same intensity for every state of coherence. It is to be noted that the correlation is lower for a square array than a triangular array, which may make the former a better choice for a device.

4. Concluding Remarks

In this work, we have used simulations to study the effect of array size, lattice constant, and hole radius on the output coherence and transmittance of square and triangular plasmon-supporting hole arrays. These simulations have shown that it is possible to create very large changes in spatial coherence over a small range of wavelengths and that the field can be made almost fully coherent in some cases, even though the incident field has very low spatial coherence. This suggests that it is feasible to design controlled coherence plasmonic light sources. It is to be noted that the output coherence is never lower than the input coherence, suggesting that the most versatile source will be one where the hole array is illuminated by a low coherence field, and the coherence is tuned upwards using plasmonic effects.
We have restricted ourselves to periodic arrays in this paper for simplicity, which allows us to use Equation (26) to roughly predict the position of resonances and bandgaps. However, one expects even richer behavior if more complicated patterns of holes are used. It is also to be noted that the choice of hole positions could be used to change the average intensity and phase of the output field, to create structured light beams.
In this paper, we have used a scalar model to describe plasmonic waves, which neglects polarization effects that could be used as another method for controlling the spatial coherence. It is worth noting that there have been several studies of the physics of partially coherent surface plasmons that could be helpful in developing a full electromagnetic model; see, for instance, References [29,30,31].
The correlation between coherence and intensity is a significant limitation of the current hole arrays. This could be partially solved by using a hole array in a reflection geometry instead of a transmission geometry. Then, the plasmons generated on the illuminated side of the plate would contribute to modifying the coherence of the reflected light beam. This approach would likely result in less extreme changes in spatial coherence but also smaller variations in the intensity of the source.
In this paper, we have focused on the changes in coherence for a gold film. It is clear, however, that analogous effects will arise for other plasmonic metals. The plasmon wavelength of the metal will determine the locations of the special features, as in Equation (26), while the propagation length will affect the strength of the resonances. Plasmons that can propagate several lattice constants will produce stronger resonance and bandgap effects than those that decay after propagating a distance of a single lattice constant.

Author Contributions

Conceptualization, G.G. and M.S.; methodology, G.G. and M.S.; software, M.S.; formal analysis, M.S.; investigation, G.G. and M.S.; writing—original draft preparation, M.S.; writing—review and editing, G.G. and M.S.; visualization, M.S. All authors have read and agreed to the published version of the manuscript.

Funding

This work was supported the Air Force Office of Scientific Research under grant FA9550-21-1-0171.

Data Availability Statement

All simulation results are presented in the manuscript.

Acknowledgments

We would like to thank Yong Zhang at UNC Charlotte for helpful suggestions.

Conflicts of Interest

The authors declare no conflict of interest.

References

  1. Krupin, O.; Wang, C.; Berini, P. Selective capture of human red blood cells based on blood group using long-range surface plasmon waveguides. Biosens. Bioelectron. 2014, 53, 117–122. [Google Scholar] [CrossRef]
  2. Schwarz, B.; Reininger, P.; Ristanic, D.; Detz, H.; Andrews, A.M.; Schrenk, W.; Strasser, G. Monolithically integrated mid-infrared lab-on-a-chip using plasmonics and quantum cascade structures. Nat. Commun. 2014, 5, 4085. [Google Scholar] [CrossRef] [Green Version]
  3. Wong, W.R.; Krupin, O.; Sekaran, S.D.; Mahamd Adikan, F.R.; Berini, P. Serological Diagnosis of Dengue Infection in Blood Plasma Using Long-Range Surface Plasmon Waveguides. Anal. Chem. 2014, 86, 1735–1743. [Google Scholar] [CrossRef] [PubMed]
  4. Gramotnev, D.K.; Bozhevolnyi, S.I. Nanofocusing of electromagnetic radiation. Nat. Photonics 2014, 8, 13–22. [Google Scholar] [CrossRef]
  5. Xiong, K.; Tordera, D.; Emilsson, G.; Olsson, O.; Linderhed, U.; Jonsson, M.P.; Dahlin, A.B. Switchable Plasmonic Metasurfaces with High Chromaticity Containing Only Abundant Metals. Nano Lett. 2017, 17, 7033–7039. [Google Scholar] [CrossRef] [PubMed] [Green Version]
  6. Li, J.; Cushing, S.K.; Zheng, P.; Meng, F.; Chu, D.; Wu, N. Plasmon-induced photonic and energy-transfer enhancement of solar water splitting by a hematite nanorod array. Nat. Commun. 2013, 4, 2651. [Google Scholar] [CrossRef] [PubMed]
  7. Ebbesen, T.; Lezec, H.; Ghaemi, H.; Thio, T.; Wolff, P. Extraordinary optical transmission through sub-wavelength hole arrays. Nature 1998, 391, 667–669. [Google Scholar] [CrossRef]
  8. Schouten, H.; Kuzmin, N.; Dubois, G.; Visser, T.; Gbur, G.; Alkemade, P.F.A.; Blok, H.; Hooft, G.W.; Lenstra, D.; Eliel, E.R. Plasmon-Assisted Two-Slit Transmission: Young’s Experiment Revisited. Phys. Rev. Lett. 2005, 94, 053901. [Google Scholar] [CrossRef] [Green Version]
  9. Rodrigo, S.G.; de León-Pérez, F.; Martín-Moreno, L. Extraordinary Optical Transmission: Fundamentals and Applications. Proc. IEEE 2016, 104, 2288–2306. [Google Scholar] [CrossRef] [Green Version]
  10. Gan, C.H.; Gbur, G.; Visser, T.D. Surface Plasmons Modulate the Spatial Coherence of Light in Young’s Interference Experiment. Phys. Rev. Lett. 2007, 98, 043908. [Google Scholar] [CrossRef]
  11. Kuzmin, N.; ’t Hooft, G.W.; Eliel, E.R.; Gbur, G.; Schouten, H.F.; Visser, T.D. Enhancement of spatial coherence by surface plasmons. Opt. Lett. 2007, 32, 445–447. [Google Scholar] [CrossRef] [Green Version]
  12. Wolf, E. Coherence and radiometry. J. Opt. Soc. Am. 1978, 68, 6–17. [Google Scholar] [CrossRef]
  13. Wolf, E.; James, D.F.V. Correlation-induced spectral changes. Rep. Prog. Phys 1996, 59, 771–778. [Google Scholar] [CrossRef]
  14. James, D.F.V. Change of polarization of light beams on propagation in free space. J. Opt. Soc. Am. A 1994, 11, 1641–1643. [Google Scholar] [CrossRef]
  15. Wolf, E. Correlation-induced changes in the degree of polarization, the degree of coherence, and the spectrum of random electromagnetic beams on propagation. Opt. Lett. 2003, 28, 1078–1080. [Google Scholar] [CrossRef] [PubMed]
  16. Korotkova, O.; Wolf, E. Changes in the state of polarization of a random electromagnetic beam on propagation. Opt. Commun. 2005, 246, 35–43. [Google Scholar] [CrossRef]
  17. Gan, C.H.; Gu, Y.; Visser, T.D.; Gbur, G. Coherence Converting Plasmonic Hole Arrays. Plasmonics 2012, 7, 313–322. [Google Scholar] [CrossRef] [Green Version]
  18. Forbes, A.; de Oliveira, M.; Dennis, M.R. Structured light. Nat. Photonics 2021, 15, 253–262. [Google Scholar] [CrossRef]
  19. Cox, M.A.; Mphuthi, N.; Nape, I.; Mashaba, N.; Cheng, L.; Forbes, A. Structured Light in Turbulence. IEEE J. Sel. Top. Quantum Electron. 2021, 27, 1–21. [Google Scholar] [CrossRef]
  20. Gbur, G. Partially coherent beam propagation in atmospheric turbulence (Invited). J. Opt. Soc. Am. A 2014, 31, 2038–2045. [Google Scholar] [CrossRef] [Green Version]
  21. Smith, M.; Gbur, G. Coherence resonances and band gaps in plasmonic hole arrays. Phys. Rev. A 2019, 99, 023812. [Google Scholar] [CrossRef] [Green Version]
  22. Smith, M. Optical Vortices and Coherence in Nano-Optics; The University of North Carolina at Charlotte: Charlotte, NC, USA, 2019. [Google Scholar]
  23. Gan, C.H.; Gbur, G. Spatial Coherence Conversion with Surface Plasmons Using a Three-slit Interferometer. Plasmonics 2008, 3, 111–117. [Google Scholar] [CrossRef] [Green Version]
  24. Wolf, E. New theory of partial coherence in the space–frequency domain. Part I: Spectra and cross spectra of steady-state sources. J. Opt. Soc. Am. 1982, 72, 343–351. [Google Scholar] [CrossRef]
  25. Foldy, L.L. The Multiple Scattering of Waves I. General Theory of Isotropic Scattering by Randomly Distributed Scatterers. Phys. Rev. 1945, 67, 107–119. [Google Scholar] [CrossRef]
  26. Lax, M. Multiple Scattering of Waves. II. The Effective Field in Dense Systems. Phys. Rev. 1952, 85, 621–629. [Google Scholar] [CrossRef]
  27. Etchegoin, P.G.; Le Ru, E.C.; Meyer, M. An analytic model for the optical properties of gold. J. Chem. Phys. 2006, 125, 164705. [Google Scholar] [CrossRef]
  28. Etchegoin, P.G.; Le Ru, E.C.; Meyer, M. Erratum: “An analytic model for the optical properties of gold” [J. Chem. Phys.125, 164705 (2006)]. J. Chem. Phys. 2007, 127, 189901. [Google Scholar] [CrossRef]
  29. Norrman, A.; Ponomarenko, S.A.; Friberg, A.T. Partially coherent surface plasmon polaritons. Europhys. Lett. 2016, 116, 64001. [Google Scholar] [CrossRef]
  30. Chen, Y.; Norrman, A.; Ponomarenko, S.A.; Friberg, A.T. Plasmon coherence determination by nanoscattering. Opt. Lett. 2017, 42, 3279–3282. [Google Scholar] [CrossRef]
  31. Chen, Y.; Norrman, A.; Ponomarenko, S.A.; Friberg, A.T. Coherence lattices in surface plasmon polariton fields. Opt. Lett. 2018, 43, 3429–3432. [Google Scholar] [CrossRef] [PubMed]
Figure 1. Cut-away view of a gold film in the z = 0 plane demonstrating the plasmon coherence conversion process. Note that the field in the input plane is the same throughout the plane; the different colors on the arrows indicate which hole they are incident upon. From Reference [22]. Used with permission.
Photonics 08 00268 g001
Figure 2. Example geometries of periodic square and triangular arrays of holes of radius a, with lattice constant d, with N s = 6 .
Photonics 08 00268 g002
Figure 3. Averaged coherence and transmittance of square and triangular hole arrays, varying lattice constant d. Here, N s = 6 , a = 200 nm, and δ = 1000 nm. Note the logarithmic scale for transmittance. (a,b) are results for the square array, while (c,d) are the results for the triangular array.
Photonics 08 00268 g003
Figure 4. Averaged output and input coherence of square and triangular arrays for a few values of d. Here, N s = 6 , a = 200 nm, and δ = 1000 nm. (a,c,e,g) are for the square array, while (b,d,f,h) are for the triangular array.
Photonics 08 00268 g004
Figure 5. Averaged output and input coherence of square and triangular hole arrays, varying N s . (aj) Here, d = 1000 nm, a = 200 nm, and δ = 1000 nm.
Photonics 08 00268 g005
Figure 6. Averaged coherence and transmittance of square and triangular hole arrays, varying hole radius a. Here, d = 1000 nm, N s = 6 , and δ = 1000 nm. Note the logarithmic scale for transmittance. Here (a,b) are for the square array, while (c,d) are for the triangular array.
Photonics 08 00268 g006
Figure 7. Correlation between averaged output coherence, Mf, and the logarithm of the averaged transmittance, Γ. (a) Correlation versus number of holes, (b) correlation versus lattice constant d, and (c) correlation versus radius a.
Photonics 08 00268 g007
Table 1. Values for gold for Equation (14).
ParameterValue [28]
ϵ 1.54
λ p 143 nm
γ p 14,500 nm
A 1 1.27
ϕ 1 π / 4 rad
λ 1 470 nm
γ 1 1900 nm
A 2 1.1
ϕ 2 π / 4 rad
λ 2 325 nm
γ 2 1060 nm
Publisher’s Note: MDPI stays neutral with regard to jurisdictional claims in published maps and institutional affiliations.

