Article

Simulated Study of High-Sensitivity Gas Sensor with a Metal-PhC Nanocavity via Tamm Plasmon Polaritons

School of Physics and Optoelectronic Engineering, Shandong University of Technology, Zibo 255000, China
*
Author to whom correspondence should be addressed.
Photonics 2021, 8(11), 506; https://doi.org/10.3390/photonics8110506
Submission received: 22 September 2021 / Revised: 18 October 2021 / Accepted: 8 November 2021 / Published: 10 November 2021
(This article belongs to the Section Lasers, Light Sources and Sensors)

Abstract

:
An optical configuration was designed and simulated with a metal-photonic crystal (PhC) nanocavity, which had high sensitivity on gas detection. The simulated results shows that this configuration can generate a strong photonic localization through exciting Tamm plasmon polaritons. The strong photonic localization highly increases the sensitivity of gas detection. Furthermore, this configuration can be tuned to sense gases at different conditions through an adjustment of the detection light wavelength, the period number of photonic crystal and the thickness of the gas cavity. The sensing routes to pressure variations of air were revealed. The simulation results showed that the detection precision of the proposed device for gas pressure could reach 0.0004 atm.

1. Introduction

A high-sensitivity method of gas sensing is increasingly necessary through the development of a measurement technique. Recently, optical sensors have played an important role in the high-sensitivity sensing of various targets due to the development of photonic and laser technologies [1,2,3]. Tamm plasmon polaritons (TPPs) based optical sensors present many advantages [4,5]. TPPs, traditionally formed at the interfaces between photonic crystal and metal film, can be excited with both transverse electric (TE) and transverse magnetic (TM) polarized lights without the assistance of external structures [6,7]. Meanwhile, TPPs can selectively transform the energy of a specific wavelength light into an electromagnetic mode and can generate optical field enhancement. Their easy excitation mode and high optical field localization make TPPs attractive for many types of research fields, including sensors [4,5,8], photodetection [9,10,11], thermal emission [12], solar cell [13,14], confined laser [15,16], nonlinear optical effects [17,18], perfect absorption [19,20], and tunable filters [21,22,23]. Benefiting from the increasingly mature preparation technology, simple Tamm structures have been experimentally studied and have garnered plenty of results that matched well with theoretical studies [24,25,26,27,28,29]. These results demonstrate the value and the potential of TPPs-based devices. Recently, we found that a metal-PhC cavity could also generate TPPs, as the cavity could be used as gas channel. In this work, we designed an optical sensor based on a Ag-PhC nanocavity, that could allow for the high-sensitivity detection of gas.

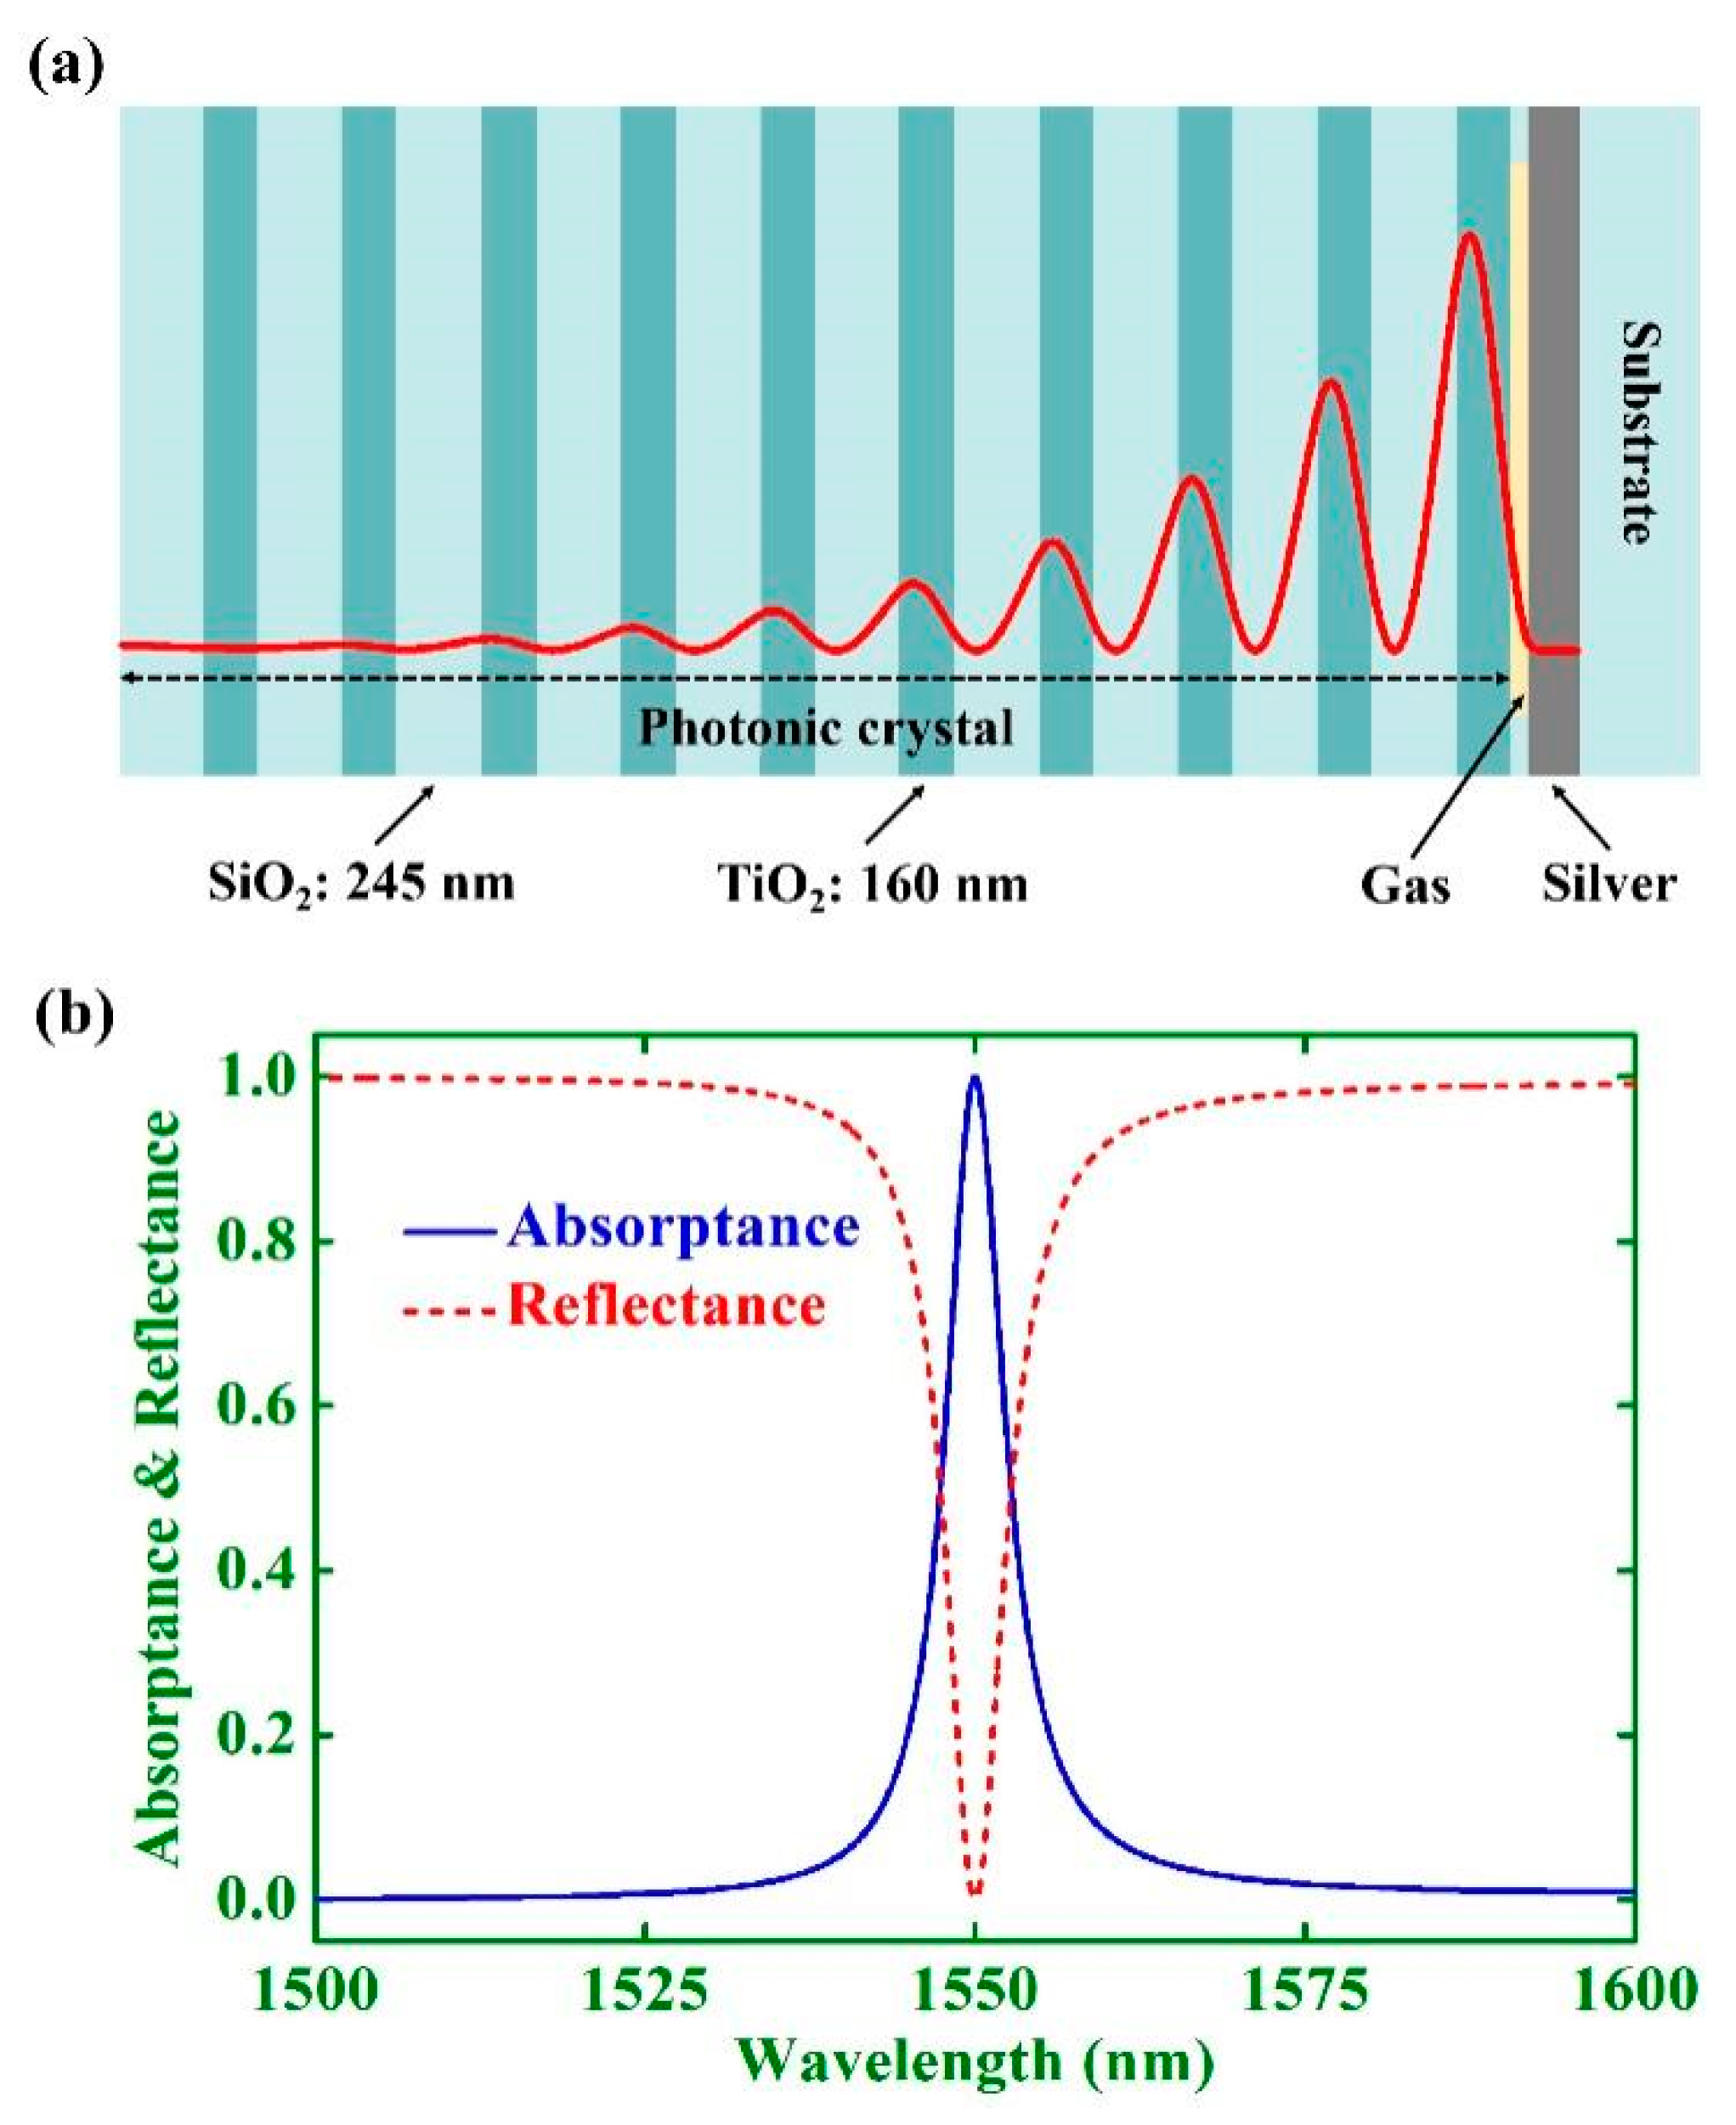
2. Structure and Methods

The structure of an Ag-PhC nanocavity is shown in Figure 1a, and mainly contains PhC, gas nanocavity and Ag film. The preparation of an Ag-PhC nanocavity can be processed as discussed. Firstly, by preparing Ag film on silica substrate and etching a gas nanocavity on the Ag film. Then, by preparing a PhC structure on another silica substrate. Finally, by combining the etched Ag film and the PhC structure. The selected alternate dielectric layers of the PhC structure are silicon dioxide (SiO2) and titanium dioxide (TiO2), two common periodic structure materials. The thicknesses of SiO2 and TiO2 are set as 245 nm and 160 nm, respectively. The thickness of the gas nanocavity is set as 50 nm.
Both the reflection and absorption spectra of this configuration are theoretically investigated by the transfer matrix approach. There are two different matrices in this method, which are the transmission matrix (TM) and propagation matrix (PM), that can be described as:
T M k = 1 t k [ 1 r k r k 1 ] ,   P M k = [ exp ( i φ k ) 0 0 exp ( i φ k ) ] .
Here, tk and rk are the transmission and reflection coefficients of light transmission from the (k − 1)-th layer to the k-th layer. φk is the phase of light propagating in the k-th layer. Thus, the total transfer matrix can be represented as:
M = T M 1 P M 1 T M 20 P M 20 T M g P M g T M s .
Here, TMg refers the transmission matrix for the interface of the TiO2 layer and the gas nanocavity, PMg refers the propagation matrix of the gas nanocavity, TMs refers the transfer matrix for the interface of the gas nanocavity and the Ag film. The transmission intensity will increase when the thickness of the Ag film is thinner than 60 nm. This will influence the intensity of the reflection light. In this study, the thickness of Ag film is set as 150 nm. Thus, the transmittance of the Ag-PhC nanocavity is near zero and negligible. The reflectance and absorptance of the structure can be expressed as R = |M21/M11|2 and A = 1 − R. M21 refers the first matrix element in the second row of M. M11 refers the first matrix element in the first row of M.
Figure 1b shows the reflection and absorption spectra of the Ag-PhC nanocavity when the period number of PhC is set as 10. The refractive indices of SiO2 and TiO2 can be set as 1.45 and 2.13 [23]. The permittivity of the Ag film is described by the Lorentz-Drude model [30]. It can be seen that the proposed structure has a narrow-band absorption of almost 1550 nm. The reflection spectrum shows a narrow valley at the corresponding wavelength. Meanwhile, the red line in Figure 1a shows the electric field distribution of light at 1550 nm, at which a high localization in the PhC exists. These results reveal the generation of TPPs in the Ag-PhC nanocavity.

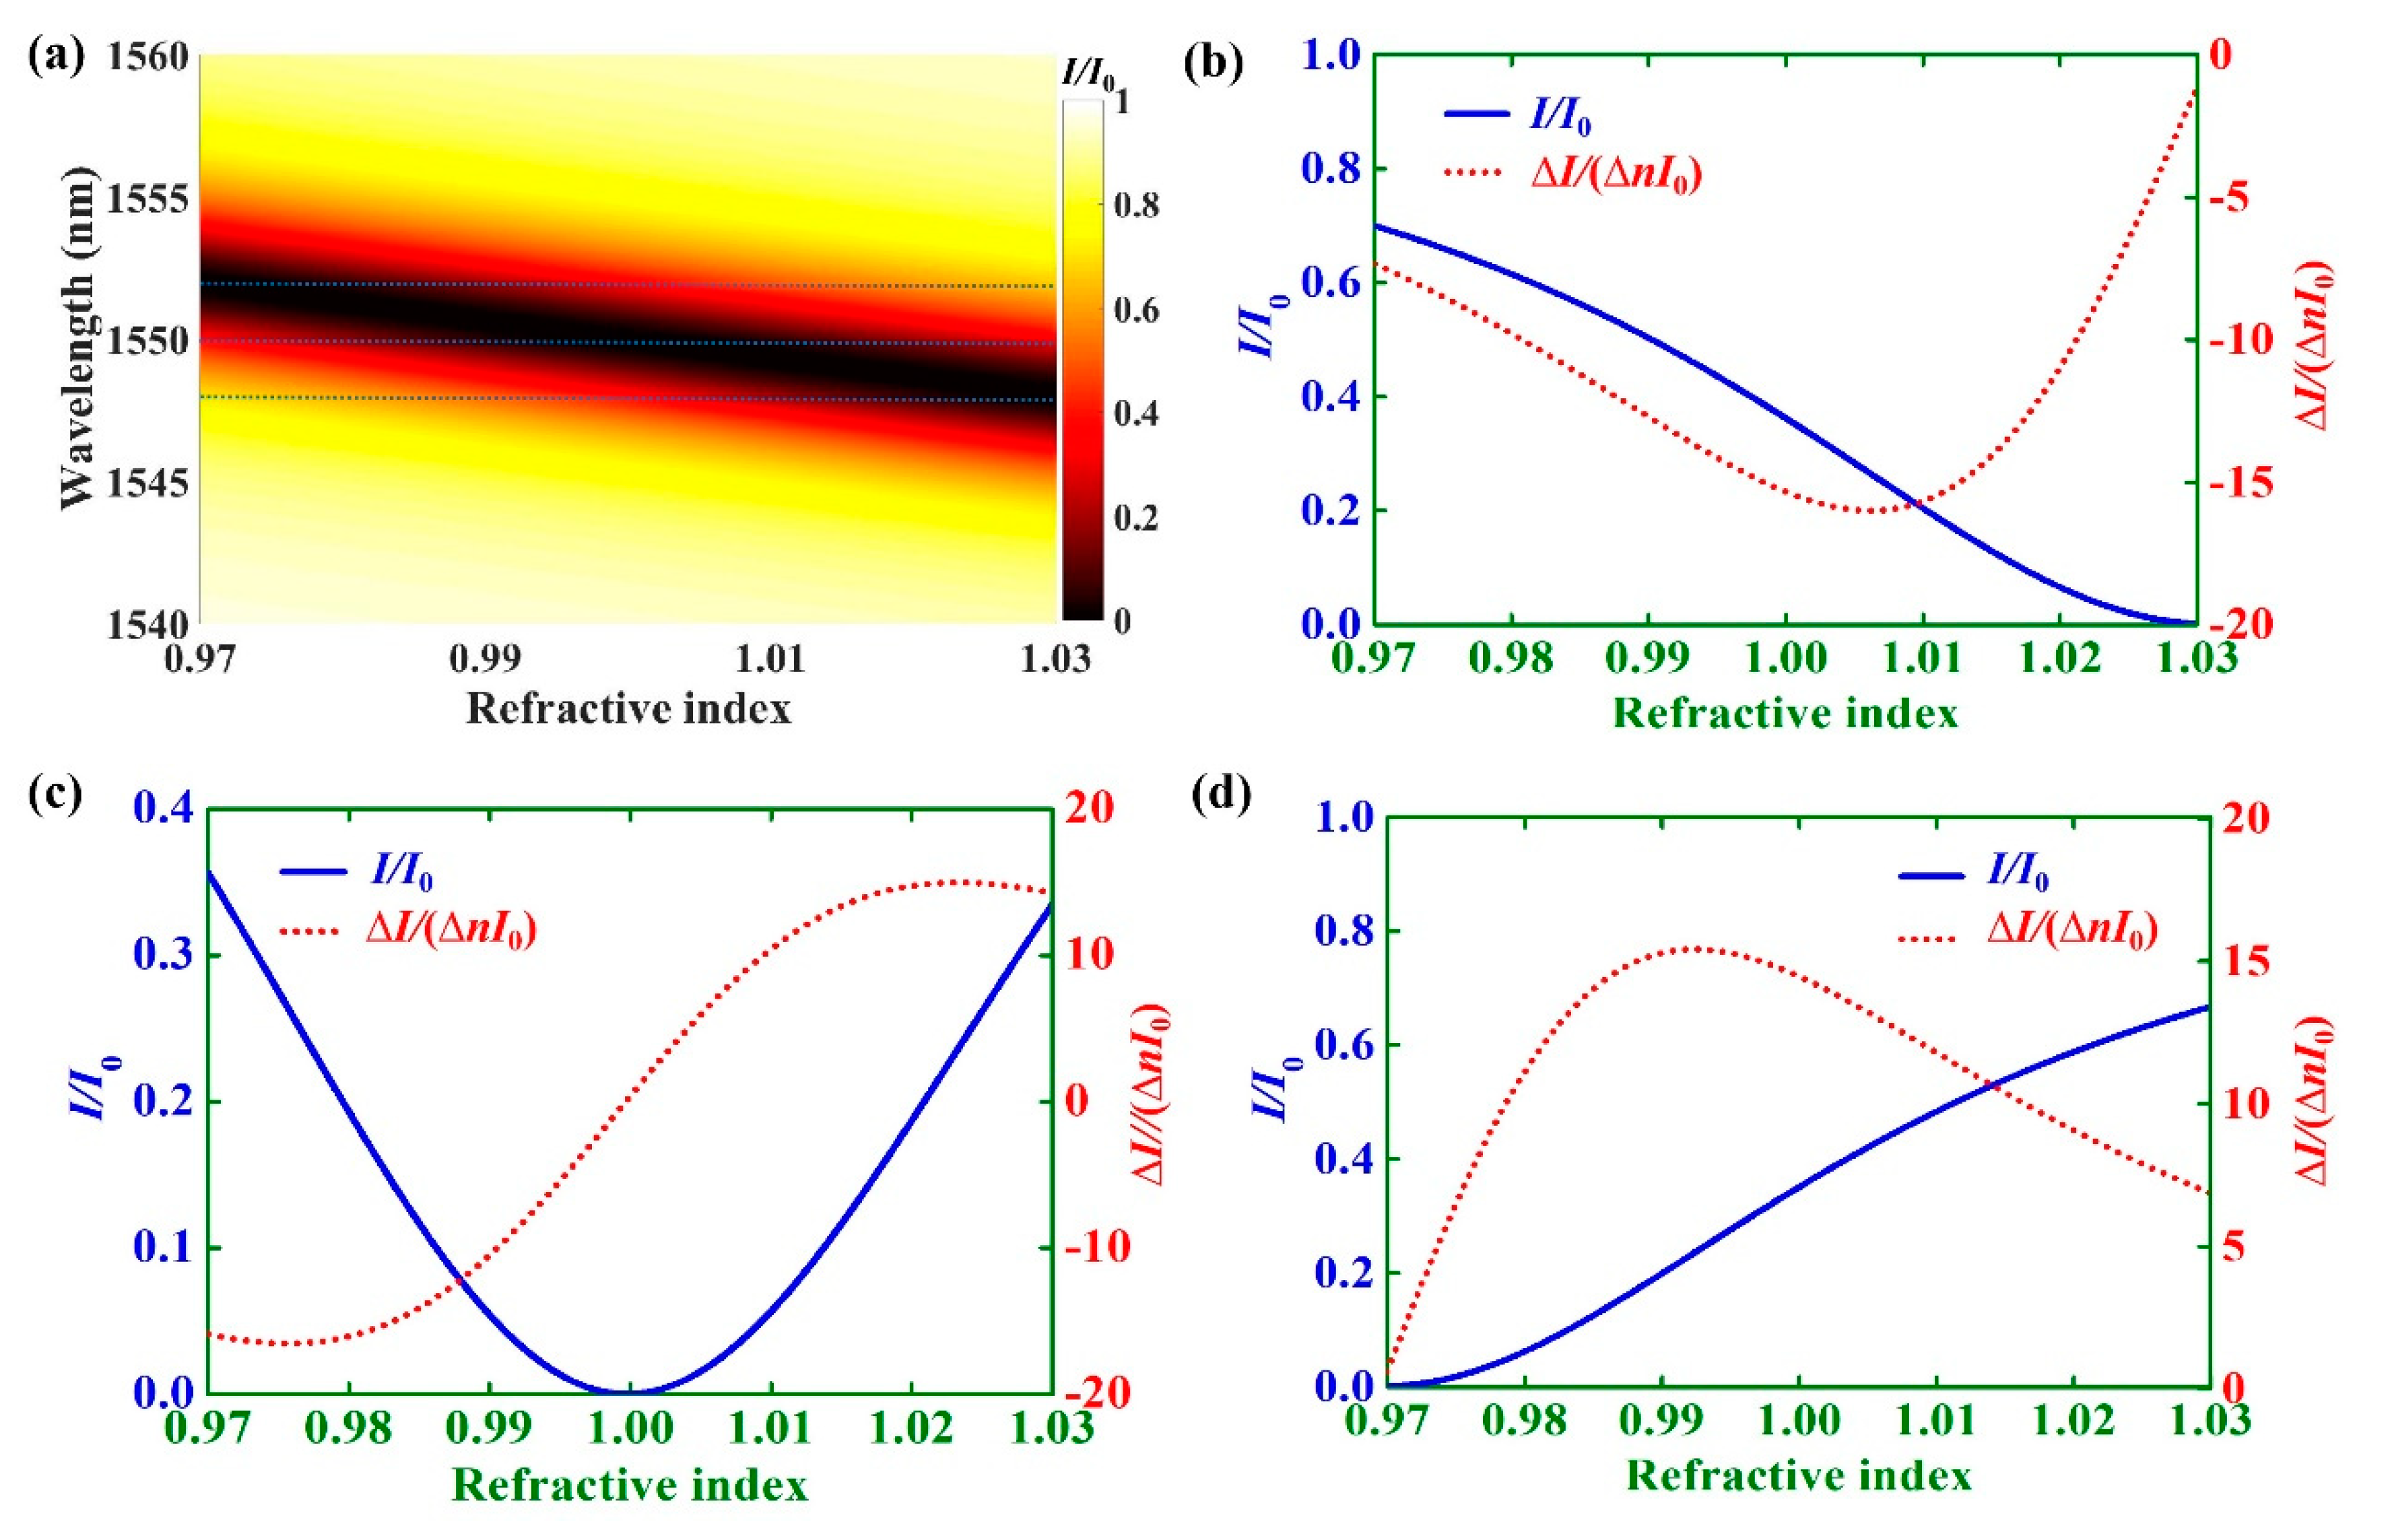
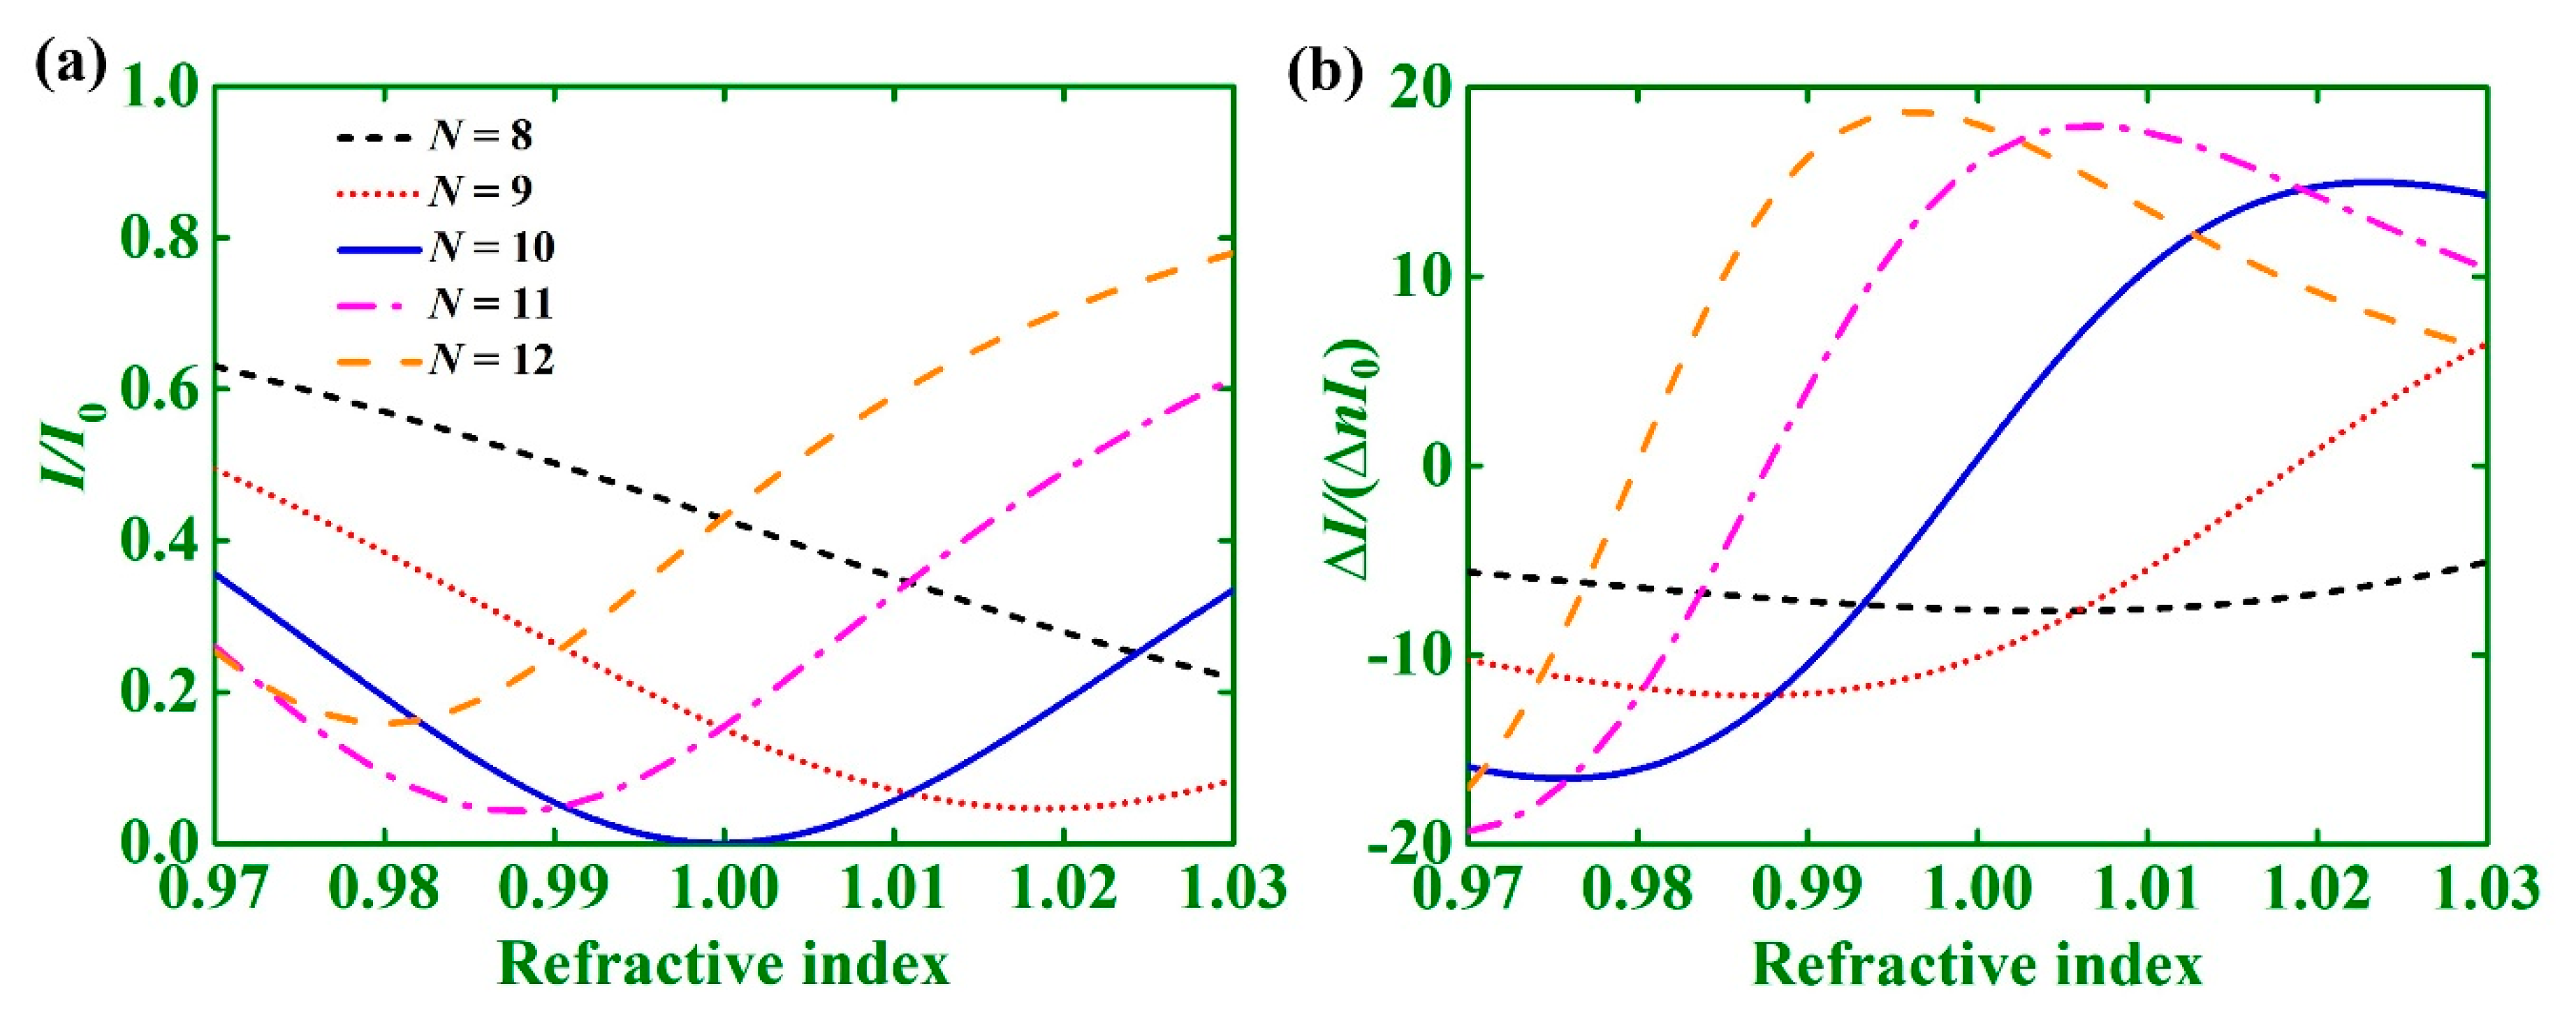
3. Results and Discussion

The intensity of the reflection light (I) and the intensity of the light source (I0) can be detected using an optical power meter. We can simulate I/I0 by calculating the reflectance of the Ag–PhC nanocavity. The influence of the gas refractive index (n) on the reflectance of the Ag–PhC nanocavity is shown in Figure 2, in which the period number of the PhC (N) is set as 10. As shown in Figure 2a, we can find that the reflection valley blue-shifts from ~1552 nm to ~1548 nm as n varies from 0.97 to 1.03. We derived the reflectance of the Ag–PhC nanocavity at 1548 nm, 1550 nm and 1552 nm, as shown in Figure 2b–d. It can be observed that the reflection has high selectivity on the light wavelength. For 1548 nm light, the reflectance decreases from ~0.7 to near zero as n varies from 0.97 to 1.03, which increases from almost zero to ~0.7 for 1552 nm light. To clearly study the sensitivity to n, we plotted the derivative of the reflection with n, as the dotted lines in Figure 2b–d. It can be observed that the absolute value of derivation reaches ~15, which means the reflectance of the Ag–PhC nanocavity will change by ~15 times the I0 as n changes 1. The maximum absolute value of derivation appeared at a medium value of the reflectance, which is disparate for different light wavelengths. That means we can tune the sensitivity of gas nanocavity by selecting the wavelength of light source.
After this, we investigated the influence of N (the period number of PhC), as shown in Figure 3. The wavelength of the light source is set as 1550 nm. It can be observed that the minimum value of reflectance is lowest when N is 10, which is near zero. This minimum value of reflectance appears at a lower n as N increases. Meanwhile, we calculated the derivation of lines in Figure 3a, as shown in Figure 3b. It can be seen that the maximum value of derivation increases with an increase of N. Meanwhile, the position of this maximum sensitivity appeared at different n for different N. These results reveal that the sensitivity of the Ag–PhC nanocavity on the gas nanocavity can be adjusted using the period number of PhC.
Furthermore, the influence of the thickness of the nanocavity (dg) was investigated. We found a series of dg could lead to the TPPs reflectance valley at 1550 nm, such as 50 nm, 825 nm, 1600 nm, 2375 nm and so on. These thicknesses of the nanocavity satisfy ng·∆dg = λ/2. Furthermore, ng refers the refractive index of the cavity. λ refers the wavelength of light. The generation of TPPs must satisfy the phase matching condition that can be deduced as [6,7]:
r PhC r Ag   exp ( 2 i φ g ) = 1
Here, rPhC and rAg refer the reflection coefficients from the gas cavity to the PhC and the Ag layer, respectively. φg = 2πngdg/λ is the phase of light propagating in the gas cavity. As seen in Equation (4), the variation of φg needs to be an integral number of π, which corresponds well with the above results. The influence of dg on the reflectance spectrum is investigated, as shown in Figure 4a. It can be found that the full width of half maximum (FWHM) of the TPPs valley becomes narrower with an increase of dg. The FWHM of the TPPs valley is 5.38 nm (dg = 50 nm), 3.14 nm (dg = 825 nm), 2.22 nm (dg = 1600 nm), 1.71 nm (dg = 2375 nm), respectively. Additionally, the derivative of reflection on the gas refractive index is also investigated, as shown in Figure 4b. It can be seen that the maximum value of derivation dramatically increases with an increasing dg, which reaches ~800 for dg = 2375 nm. However, the detection range of the gas refractive index decreases with an increase of dg. We can set the monotone increasing section in Figure 4b as the detection range. For dg = 50 nm, the detection range is ~0.04. For dg = 2375 nm, the detection range decreases to ~0.0001. Thus, we can select the applicable thickness of the gas cavity based on practical necessity.
To discuss the detection precision of the proposed structure, we calculated the wavelength of the reflectance valley at different dg. From Figure 5, we found that the wavelength of the reflectance valley linearly red-shifts when the refractive index of the gas cavity increases. For the proposed structure, the detection sensitivity can be set as S = ∆λ/∆n. It can be deduced that S reaches 1057 nm/RIU when dg = 2375 nm. The figure of merit (FOM) is also an important parameter to characterize the sensing ability, which can be defined as FOM = S/FWHM. It can be deduced that FOM reaches 618.1/RIU when dg = 2375 nm. These parameters of detection sensitivity can be further enhanced by increasing the thickness of the gas cavity. This can be explained by the phase matching condition, for which the TPPs wavelength is related to φg. The refractive index of the gas will have a greater influence on φg when the thickness of the gas cavity increases. To assess the detection ability of the proposed configuration, sensitivities of different TPP-based gas sensors are listed in Table 1. It can be seen that the proposed structure in this paper has a relatively high sensitivity on the refractive index of gas.

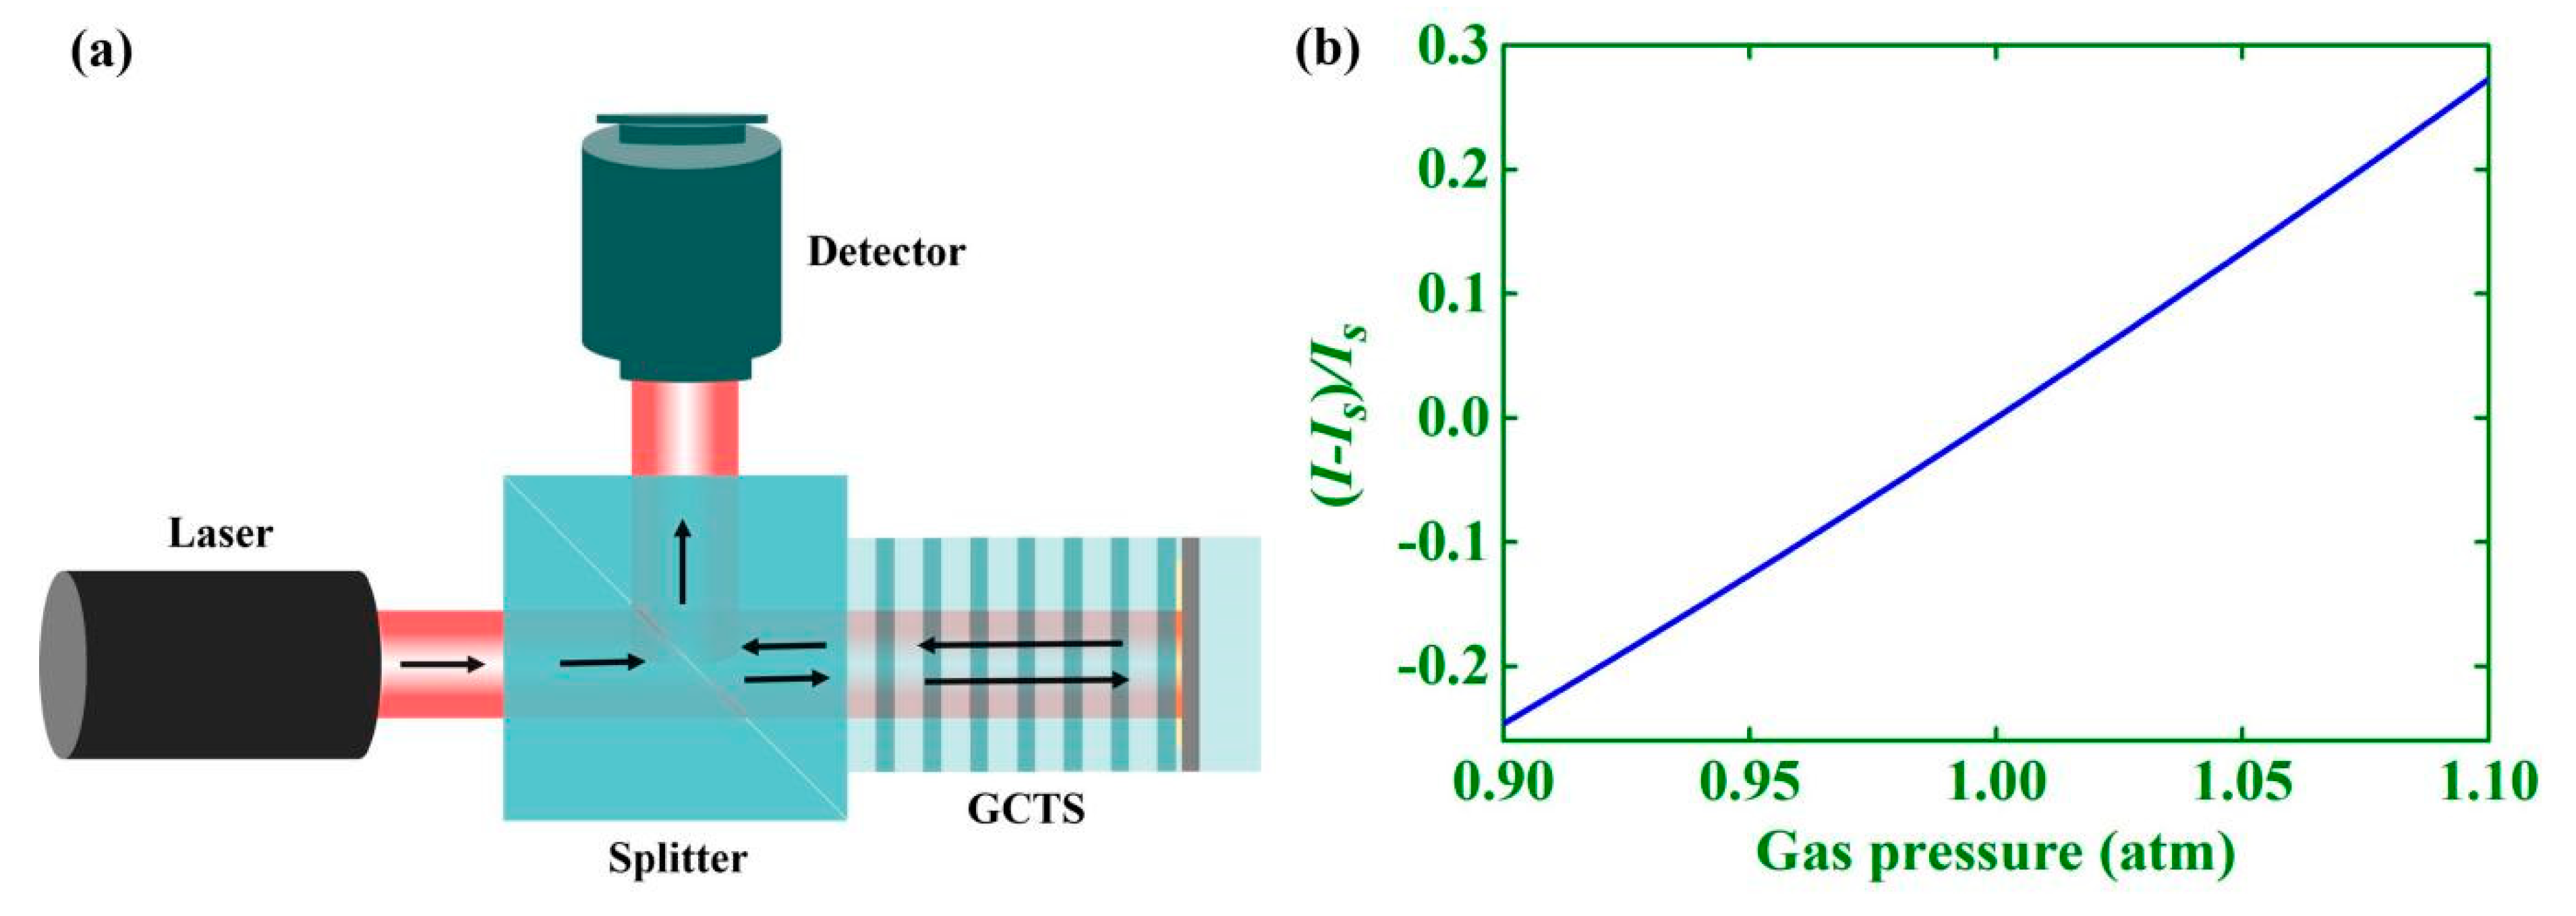
4. Simulation Sensing of Gas Pressure

To clearly demonstrate the high sensitivity of the Ag–PhC nanocavity on gas, we simulated the detection of air at different gas pressures. The sensing route is shown in Figure 6a. The 1550 nm laser passes through a splitter into the Ag-PhC nanocavity. The reflection laser of the Ag–PhC nanocavity is reflected by the splitter. Finally, the laser reflected from the splitter is detected by an optical detector, which can obtain the intensity of signal light I. The gas cavity is exposed to the outside, in which the gas pressure is consistent with the environment. The relationship between gas pressure and the gas refractive index can be expressed as [33]:
n = 1 + p ( n 0 1 ) 96095.43 × 1 + p ( 0.613 0.00998 t ) × 10 8 1 + 0.003661 t
Here, n is the gas refractive index and n0 is the gas refractive index of standard air, which equals 1.00012438 for 1550 nm light. p is the gas pressure and t is the temperature.
We set a standard intensity of the signal light Is at 1.0 atm and 25 °C. Based on the above formula, we plotted the intensity variation of the signal light (normalized by Is) with different gas pressures as shown in Figure 6b. It can be seen that I is greatly influenced by the gas pressure, has and that they have a significant linear relationship. The variation rate of normalized light intensity on gas pressure reaches ~2.5 per atm, which means that ∆pI/∆I is ~0.4 atm if we set the detection precision of optical power meter as a thousandth of the detection range. Thus, the detection precision of gas pressure can reach 0.0004 atm.

5. Conclusions

In summary, TPPs were generated in an Ag-PhC nanocavity. Based on the Ag-PhC nanocavity, an optical sensor for gas was designed. The simulated results revealed that the detection sensitivity for the gas refractive index could reach 1057 nm and the FOM is able to reach 618.1/RIU. Meanwhile, the simulated results demonstrated that the detection precision of the Ag–PhC nanocavity on gas pressure could reach 0.0004 atm. The proposed configuration can also be used for many other applications, such as concentration sensing and composition detecting.

Author Contributions

Conceptualization, L.L.; methodology, L.L.; software, L.L.; validation, L.L.; formal analysis, H.H.; investigation, L.L.; resources, L.L.; data curation, H.H.; writing—original draft preparation, L.L.; writing—review and editing, H.H.; visualization, H.H.; supervision, L.L.; project administration, L.L. and H.H.; funding acquisition, L.L. and H.H. All authors have read and agreed to the published version of the manuscript.

Funding

This work was supported by National Natural Science Foundation of China (project No. 12004217); Natural Science Foundation of Shandong Province (project Nos. ZR201910230199, ZR201910230202).

Data Availability Statement

All relevant data is within the present manuscript.

Conflicts of Interest

The authors declare that they have no known competing financial interest or personal relationships that could have appeared to influence the work reported in this paper.

References

  1. Zhou, J.; Wang, Y.; Liao, C.; Sun, B.; He, J.; Yin, G.; Liu, S.; Li, Z.; Wang, G.; Zhong, X.; et al. Liquid-crystal active Tamm-plasmon devices. Sens. Actuators B-Chem. 2015, 208, 315–319. [Google Scholar] [CrossRef]
  2. Motogaito, A.; Ito, Y. Excitation mechanism of surface plasmon polaritons for surface plasmon sensor with 1D metal grating structure for high refractive index medium. Photonic Sens. 2019, 9, 11–18. [Google Scholar] [CrossRef] [Green Version]
  3. Kim, K.J.; Lu, P.; Culp, J.T.; Ohodnicki, P.R. Metal-organic framework thin film coated optical fiber sensors: A novel waveguide-based chemical sensing platform. ACS Sens. 2018, 3, 386–394. [Google Scholar] [CrossRef]
  4. Zhang, W.; Wang, F.; Rao, Y.; Jiang, Y. Novel sensing concept based on optical Tamm plasmon. Opt. Express 2014, 22, 14524–14529. [Google Scholar] [CrossRef]
  5. Li, N.; Tang, T.; Li, J.; Luo, L.; Sun, P.; Yao, J. Highly sensitive sensors of fluid detection based on magneto-optical optical Tamm state. Sens. Actuators B-Chem. 2018, 265, 644–651. [Google Scholar] [CrossRef]
  6. Kaliteevski, M.; Iorsh, I.; Brand, S.; Abram, R.A.; Chamberlain, J.M.; Kavokin, A.V.; Shelykh, I.A. Tamm plasmon-polaritons: Possible electromagnetic states at the interface of a metal and a dielectric Bragg mirror. Phys. Rev. B 2007, 76, 165415. [Google Scholar] [CrossRef] [Green Version]
  7. Sasin, M.E.; Seisyan, R.P.; Kalitteevski, M.A.; Brand, S.; Abram, R.A.; Chamberlain, J.M.; Egorov, A.Y.; Vasilev, A.P.; Mikhrin, V.S.; Kavokin, A.V. Tamm plasmon polaritons: Slow and spatially compact light. Appl. Phys. Lett. 2008, 92, 251112. [Google Scholar] [CrossRef] [Green Version]
  8. Zaky, Z.A.; Ahmed, A.M.; Shalaby, A.S.; Aly, A.H. Refractive index gas sensor based on the Tamm state in a one-dimensional photonic crystal: Theoretical optimisation. Sci. Rep. 2020, 10, 9736. [Google Scholar] [CrossRef] [PubMed]
  9. Wang, J.; Zhu, Y.; Wang, W.; Li, Y.; Gao, R.; Yu, P.; Xu, H.; Wang, Z. Broadband Tamm plasmon-enhanced planar hot-electron photodetector. Nanoscale 2020, 12, 23945–23952. [Google Scholar] [CrossRef] [PubMed]
  10. Zhu, Y.; Yu, P.; Liu, T.; Xu, H.; Govorov, A.O.; Wang, Z. Nanolayered Tamm plasmon-based multicolor hot electron photodetection for O- and C-band telecommunication. ACS Appl. Electron. Mater. 2021, 3, 639–650. [Google Scholar] [CrossRef]
  11. Zhu, Y.; Xu, H.; Yu, P.; Wang, Z. Engineering plasmonic hot carrier dynamics toward efficient photodetecion. Appl. Phys. Rev. 2021, 8, 021305. [Google Scholar] [CrossRef]
  12. Wang, Z.; Clark, J.K.; Ho, Y.L.; Vilquin, B.; Daiguji, H.; Delaunay, J.J. Narrowband thermal emission realized through the coupling of cavity and Tamm plasmon resonances. ACS Photonics 2018, 5, 2446–2452. [Google Scholar] [CrossRef]
  13. Zhang, X.L.; Song, J.F.; Li, X.B.; Feng, J.; Sun, H.B. Optical Tamm states enhanced broad-band absorption of organic solar cells. Appl. Phys. Lett. 2012, 101, 243901. [Google Scholar] [CrossRef] [Green Version]
  14. Bikbaev, R.G.; Vetrov, S.Y.; Timofeev, I.V.; Shabanov, V.F. Photosensitivity and reflectivity of the active layer in a Tamm-plasmon-polariton-based organic solar cell. Appl. Opt. 2021, 60, 3338–3343. [Google Scholar] [CrossRef]
  15. Symond, C.; Lheureux, G.; Hugonin, J.P.; Greffet, J.J.; Laverdant, J.; Brucoli, G.; Lemaitre, A.; Senellart, P.; Bellessa, J. Confined Tamm plasmon lasers. Nano Lett. 2013, 13, 3179–3184. [Google Scholar] [CrossRef]
  16. Toanen, V.; Symonds, C.; Benoit, J.M.; Gassenq, A.; Lemaitre, A.; Bellessa, J. Room-temperature lasing in a low-loss Tamm plasmon cavity. ACS Photonics 2020, 7, 2952–2957. [Google Scholar] [CrossRef]
  17. Lee, K.J.; Wu, J.W.; Kim, K. Enhanced nonlinear optical effects due to the excitation of optical Tamm plasmon polaritons in one-dimensional photonic crystal structures. Opt. Express 2013, 21, 28817–28823. [Google Scholar] [CrossRef] [PubMed]
  18. Xue, C.; Jiang, H.; Lu, H.; Du, G.; Chen, H. All-optical bistable logic control based on coupled Tamm plasmons. Opt. Lett. 2013, 38, 4092–4095. [Google Scholar]
  19. Gong, Y.; Liu, X.; Lu, H.; Wang, L.; Wang, G. Perfect absorber supported by optical Tamm states in plasmonic waveguide. Opt. Express 2011, 19, 18393–18398. [Google Scholar] [CrossRef] [PubMed]
  20. Li, L.; Zhao, H.; Zhang, J. Tunable perfect absorber supported by accumulation electron gas at ITO-dielectric heterointerface. J. Phys. D Appl. Phys. 2017, 50, 405109. [Google Scholar] [CrossRef] [Green Version]
  21. Lu, H.; Gan, X.; Jia, B.; Mao, D.; Zhao, J. Tunable high-efficiency light absorption of monolayer graphene via Tamm plasmon polaritons. Opt. Lett. 2016, 41, 4743–4746. [Google Scholar] [CrossRef]
  22. Wang, X.; Jiang, X.; You, Q.; Guo, J.; Dai, X.; Xiang, Y. Tunable and multichannel terahertz perfect absorber due to Tamm surface plasmons with graphene. Photonics Res. 2017, 5, 536–542. [Google Scholar] [CrossRef]
  23. Li, L.; Zhao, H.; Zhang, J. Electrically tuning reflection of graphene-based Tamm plasmon polariton structures at 1550 nm. Appl. Phys. Lett. 2017, 111, 083504. [Google Scholar] [CrossRef]
  24. Nunez-Sanchez, S.; Lopez-Garcia, M.; Murshidy, M.M.; Abdel-Hady, A.G.; Serry, M.; Adawi, A.M.; Rarity, J.G.; Oulton, R.; Barnes, W.L. Excitonic optical Tamm states: A step toward a full molecular-dielectric photonic integration. ACS Photonics 2016, 3, 743–748. [Google Scholar] [CrossRef] [Green Version]
  25. Mischok, A.; Siegmund, B.; Ghosh, D.S.; Benduhn, J.; Spoltore, D.; Bohm, M.; Frob, H.; Korner, C.; Leo, K.; Vandewal, K. Controlling Tamm plasmons for organic narrowband near-infrared photodetectors. ACS Photonics 2017, 4, 2228–2234. [Google Scholar] [CrossRef]
  26. Yang, Z.; Ishii, S.; Yokoyama, T.; Dao, T.D.; Sun, M.; Pankin, P.S.; Timofeev, I.V.; Nagao, T.; Chen, K. Narrowband wavelength selective thermal emitters by confined Tamm plasmon polaritons. ACS Photonics 2017, 4, 2212–2219. [Google Scholar] [CrossRef] [Green Version]
  27. Zhang, C.; Wu, K.; Giannini, V.; Li, X. Planar hot-electron photodetection with Tamm plasmons. ACS Nano 2017, 11, 1719–1727. [Google Scholar] [CrossRef] [Green Version]
  28. Cheng, H.; Kuo, C.; Hung, Y.; Chen, K.; Jeng, S. Liquid-crystal active Tamm-plasmon devices. Phys. Rev. Appl. 2018, 9, 064034. [Google Scholar] [CrossRef]
  29. Tsurimaki, Y.; Tong, J.K.; Boriskin, V.N.; Semenov, A.; Ayzatsky, M.I.; Machekhin, Y.P.; Chen, G.; Boriskina, S.V. Topological engineering of interfacial optical Tamm states for highly sensitive near-singular-phase optical detection. ACS Photonics 2018, 5, 929–938. [Google Scholar] [CrossRef] [Green Version]
  30. Rakic, A.D.; Djurisic, A.B.; Elazar, J.M.; Majewski, M.L. Optical properties of metallic films for vertical-cavity optoelectronic devices. Appl. Opt. 1998, 37, 5271–5283. [Google Scholar] [CrossRef]
  31. Anguie, B.; Fuertes, M.C.; Angelome, P.C.; Abdala, N.L.; Soler Illia, G.J.A.A.; Fainstein, A. Tamm plasmon resonance in mesoporous multilayers: Toward a sensing application. ACS Photonics 2014, 1, 775–780. [Google Scholar]
  32. Keshavarz, M.M.; Alighanbari, A. Self-referenced terahertz refractive index sensor based on a cavity resonance and Tamm plasmon modes. Appl. Opt. 2020, 59, 4517–4526. [Google Scholar] [CrossRef] [PubMed]
  33. Edlén, B. The refractive index of air. Metrologia 2005, 2, 71. [Google Scholar] [CrossRef]
Figure 1. (a) Schematic of the Ag-PhC nanocavity. Red line is the electric field distribution of light at 1550 nm (b) Absorption and reflection spectra of the Ag-PhC nanocavity when the period number of PhC is 10.
Photonics 08 00506 g001
Figure 2. (a) Evolution of the reflection spectrum for the Ag-PhC nanocavity with different refractive index of gas. Reflection and the derivative of reflection with n at (b) 1448 nm, (c) 1550 nm and (d) 1552 nm.
Photonics 08 00506 g002
Figure 3. Dependence of (a) the reflection and (b) the derivative of reflection on gas refractive index at different N. The light wavelength is set as 1550 nm.
Photonics 08 00506 g003
Figure 4. (a) Reflectance spectrum of the proposed structure with different dg. (b) Dependence of the derivative of reflection on gas refractive index at 1550 nm with different dg.
Photonics 08 00506 g004
Figure 5. Dependence of the TPPs valley wavelength on gas refractive index at different dg.
Photonics 08 00506 g005
Figure 6. (a) Schematic of the proposed configuration for measuring gas pressure (b) The relation between normalized light intensity variation and gas pressure. dg is set as 2375 nm.
Photonics 08 00506 g006
Table 1. Sensitivities of different Tamm plasmon based gas sensors.
StructureS (nm/RIU)FOM (/RIU)
PhC-Au-Gas [31]55-
Ag-Gas/Si PhC [4]83.3-
Graphene-Gas-PhC [32]
(in terahertz band)
-142
This work1057618.1
Publisher’s Note: MDPI stays neutral with regard to jurisdictional claims in published maps and institutional affiliations.

