1. Introduction
In the last two decades, injection locking (IL)—a nonlinear phenomenon for synchronizing outputs where two or more self-holding lasers are coupled—attracted much attention due to its numerous applications in optical communications [
1,
2,
3,
4], optical signal-processing systems [
5], oscillators [
6,
7,
8], laser cooling [
9], optical phased arrays [
10], etc. In the IL regime, most of the fundamental limits of the laser, such as the mode-distribution noise, relaxation oscillation frequency, nonlinear electron-photon coupling, relative intensity noise, etc., are improved. Using the IL technique, a Fabry–Pérot (FP) laser with multiple longitudinal modes can be operated in a single longitudinal mode, which greatly improves its properties [
11,
12]. Moreover, the performance of optical IL and direct-modulated laser-diode emitters are investigated to operate as single longitudinal mode lasers with reduced linewidth [
13], frequency chirp reduction [
14], improved modulation bandwidth [
15], and so on. However, due to the complex system dynamics of an injection-locked FP laser and its extensive dynamic behavior, it is very difficult to determine the stable-locking conditions, especially in the boundary regions [
16]. Moreover, the IL can be unstable, especially as a result of temperature fluctuations, vibrations, and other possible environmental effects, where an already-locked slave laser can be unlocked by external environmental effects. In recent years, methods for stabilizing injection-locked lasers using various optical and electrical feedbacks were presented [
17,
18,
19,
20]. The stabilization methods allow automatic acquisition of the injection-locked state and maintain this state for an indefinite time. However, they pose significant technical challenges or require the additional modulation of a slave laser.
An important reason that deserves great attention in the analysis of the stability state of an optical injection-locked laser is that the frequency response of a directly modulated laser in the IL state offers different operating states across the locking range. In fact, we find different modulation regimes related to the frequency response within the IL range. Each of the regimes provides solutions that are suitable for specific applications. For negative detuning values, the response is characterized by a highly damped resonant peak that exhibits a relatively linear response [
21]. This response is suitable for applications with a high linearity and a low link loss. At the other extreme of the locking map, in the positive detuning of the IL region, the resonant frequency experiences its maximum. As Murakami et al. [
21] point out, the increase in the resonant frequency represents the difference between the frequency of the master laser and the natural cavity of the slave laser. In the IL regime, for positive values of the frequency detuning, the dominant mode of the master laser moves in the opposite direction to the cavity mode of the slave laser (SL), which is redshifted by the linewidth-enhancement factor α, providing an increased resonant frequency. This condition is characterized by a high resonant-frequency peak and is suitable for applications that require a high resonant frequency, such as ultra-high-frequency opto-electronic oscillators [
22]. A high resonant frequency is also suitable for modulation in the near-single-sideband region [
23]. The third regime is the so-called wideband regime, which is characterized by low values of frequency detuning and where there is a trade-off between increasing the frequency response and attenuating the resonant peak. This range is very suitable for high-bandwidth telecommunication solutions [
12]. All these ranges show that within the IL map of the laser, the possibilities for tuning the modulation responses of the IL laser are wide, especially for extreme values of the frequency detuning where the stability of the IL laser is in question.
Another important parameter is the dependence of the 3-dB roll-off on the injected power. A high, optically injected power causes a 3-dB roll-off before reaching the resonant frequency, which limits the use of the frequency range [
24] and restricts the application of a high injected power for wideband applications.
In our earlier work on measuring the IL map [
25], the injection-locked state was observed by the suppressed ratio of the longitudinal modes of the laser in the optical spectrum. This conventional criterion, which can be found in the literature, states that the slave laser is in IL mode when the side-mode suppression ratio (SMSR) is at least 35 dB [
1,
2,
16,
25]. However, due to the complicated behavior of a slave laser, the stability map is not only a single-valued function correlated with the frequency shift between the frequencies of the master laser and the slave laser, and the ratio between the optical power of the master laser and the optical power of the injected-locked mode of the slave laser, but the stability map is a multivalued function [
16].
Since in optical IL the master laser imposes its spectral distribution on the slave laser [
25], in this work we apply an observational technique for the stable-locking regime by observing the transformation of the linewidth of the slave laser during IL. To the best of our knowledge, this technique, which employs the well-known, self-homodyne detection technique and the novel approach of an additional external cavity with low reflectivity for the slave laser, has not been used before for observing the stable-locking regime of the injection-locked laser.
In the newly proposed monitoring technique, we observe the spectral components that are present in the radio-frequency (RF) spectrum when the linewidth is not fully converted to IL and hence the stability is incomplete. To generate these new, additional spectral components for the observation of the locking state, we added an external resonator to the FP laser. Thanks to the developments in microwave photonics in the last decade [
26], we transform these additional optical components into the microwave range and observe the suppression of the RF spectral components in the RF spectrum using the delayed self-homodyne technique. In this work, we showed that the proposed novel monitoring technique provides an accurate way to determine the stability of an injection-locked FP laser in the limiting regions of the locking map, compared to only observing the SMSR in the optical spectrum. The results presented in this paper are experimentally oriented, with the goal of explaining the phenomena intuitively. Precise analytical solutions for IL and external optical feedback can be found in [
16,
21,
24] and [
27,
28,
29]. The aim of this work is to experimentally verify the newly proposed detection of a FP laser in the stable-locking regime by observing the RF spectrum instead of using the conventional 35-dB criterion in the optical spectrum.
In
Section 2, we explain the contribution of the external resonator to the performance of the injection-locked FP laser. In
Section 3, we present the experimental results of the linewidth measurement of the FP laser in the IL condition and in the free-running condition when observed in the electric domain.
Section 4 presents the experimental setup for determining stability region of the injection-locked FP laser observed in the electric domain. In
Section 5, the measurement results are presented and in
Section 6 discussed. Experiment shows the correlation between the stability of the injection-locked FP laser and the linewidth transformations. We present the IL map of the FP laser measured using the conventional and new methods. In
Section 7, the new device for stability supervision of an injection-locked FP laser is presented. In
Section 8, we present a conclusion.
2. Laser with an External Cavity
The broadening of the linewidth of the laser is attributed to the change in the phase and intensity due to a spontaneous-emission event [
30]. According to the theory of the laser power spectrum [
31], the laser produces a Lorentzian power spectrum if the fluctuations are assumed to be controlled by a random Gaussian process with zero mean.
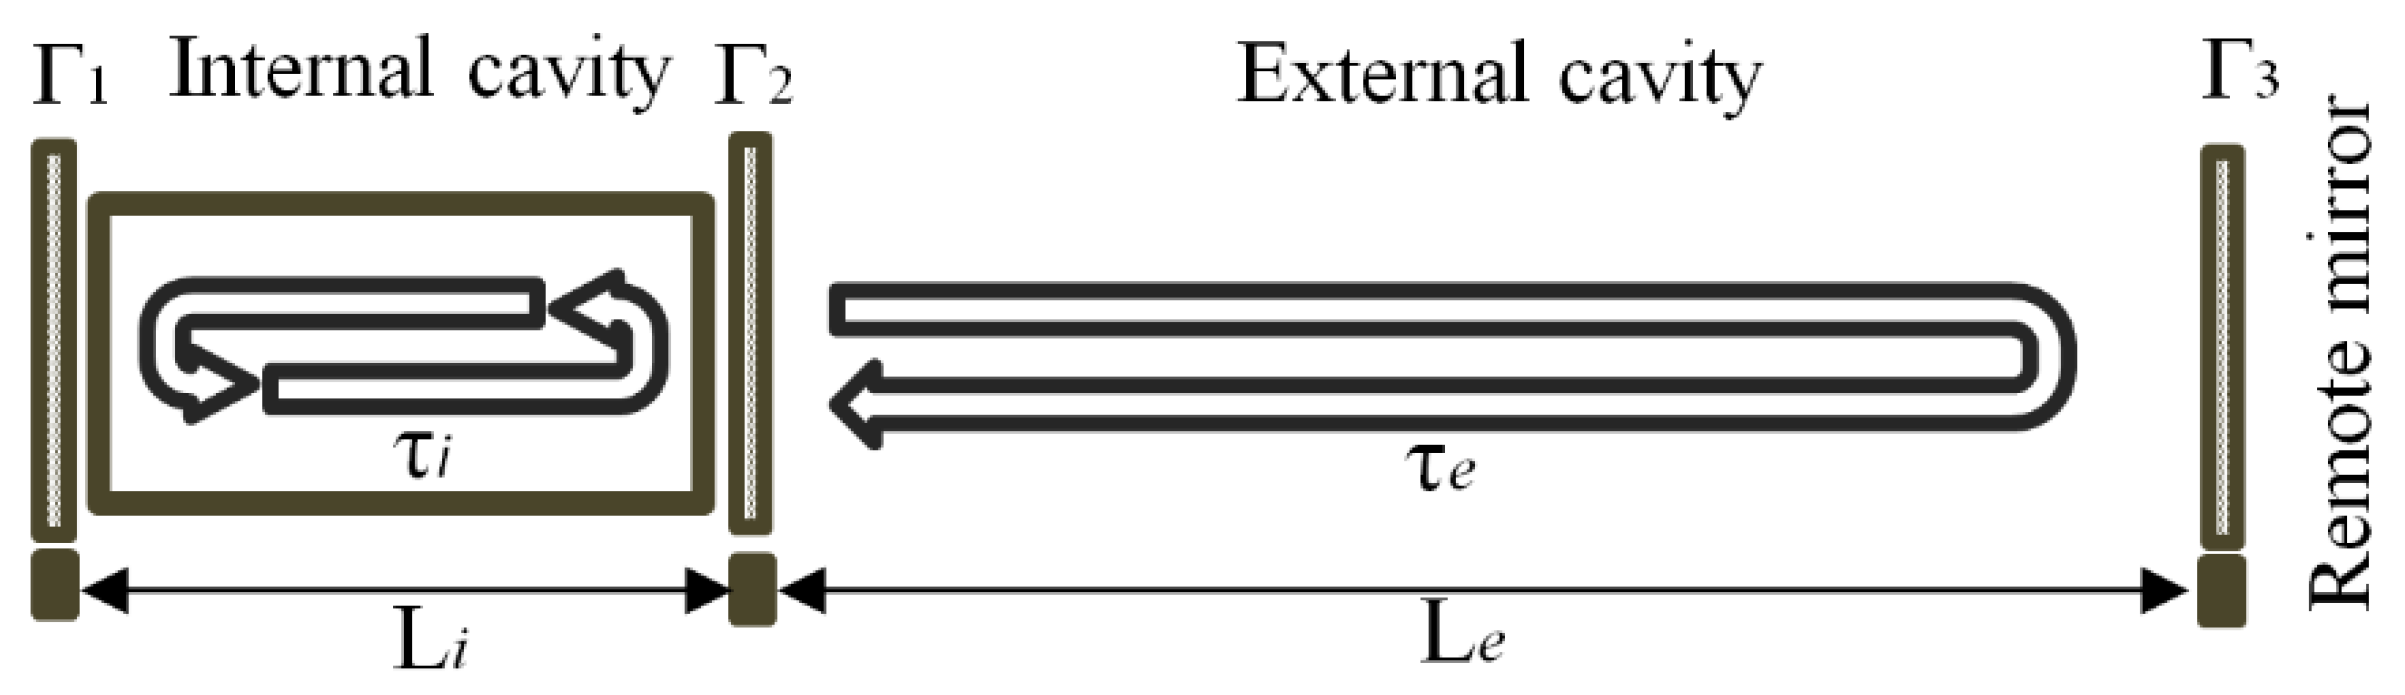
In general, the optical feedback mechanism created by the optical Fresnel reflections for the facets of a FP semiconductor laser is used for sustained laser oscillations. Therefore, the number of multilongitudinal modes is determined by the gain of the active gain medium and the length of the laser diode [
27]. Nowadays, attaching an additional external cavity to the active gain medium is a well-known technique for applying different modes, eliminating them, or achieving tunability, since optical feedback also allows us to change the power spectral density of the laser [
32]. In general, an additional remote mirror with a reflectivity Γ
3 is connected at a distance of L
e to the internal cavity length L
i with reflectivity Γ
1 and Γ
2, as shown in
Figure 1. The optical feedback of the external cavity changes the threshold condition of the laser, which means that the phase and gain conditions are changed [
29]. The optical feedback signal for the solitary multimode laser is analyzed and quantified in [
33].
The properties of the external cavity laser depend on the reflectivity and the position of the remote mirror. The external cavity affects the optical spectrum of the laser [
28]. The optical feedback through the remote mirror leads to additional multilongitudinal signal groups on every internal cavity mode, which are the result of competition between the laser modes. The modes within each group are separated by f ≤ 1/τ
e, which is out of proportion to the additional time delay due to the external cavity. These multilongitudinal groups arise from the multiple solutions of the phase conditions [
29]. In the case of weak optical feedback, the system is always stable, but this changes with an increase in the feedback level [
34]. However, as pointed out in [
2], the effects of the relative intensity noise (RIN) of the laser as well as the additional spectral components generated by the external cavity are greatly reduced in the IL state of the FP laser.
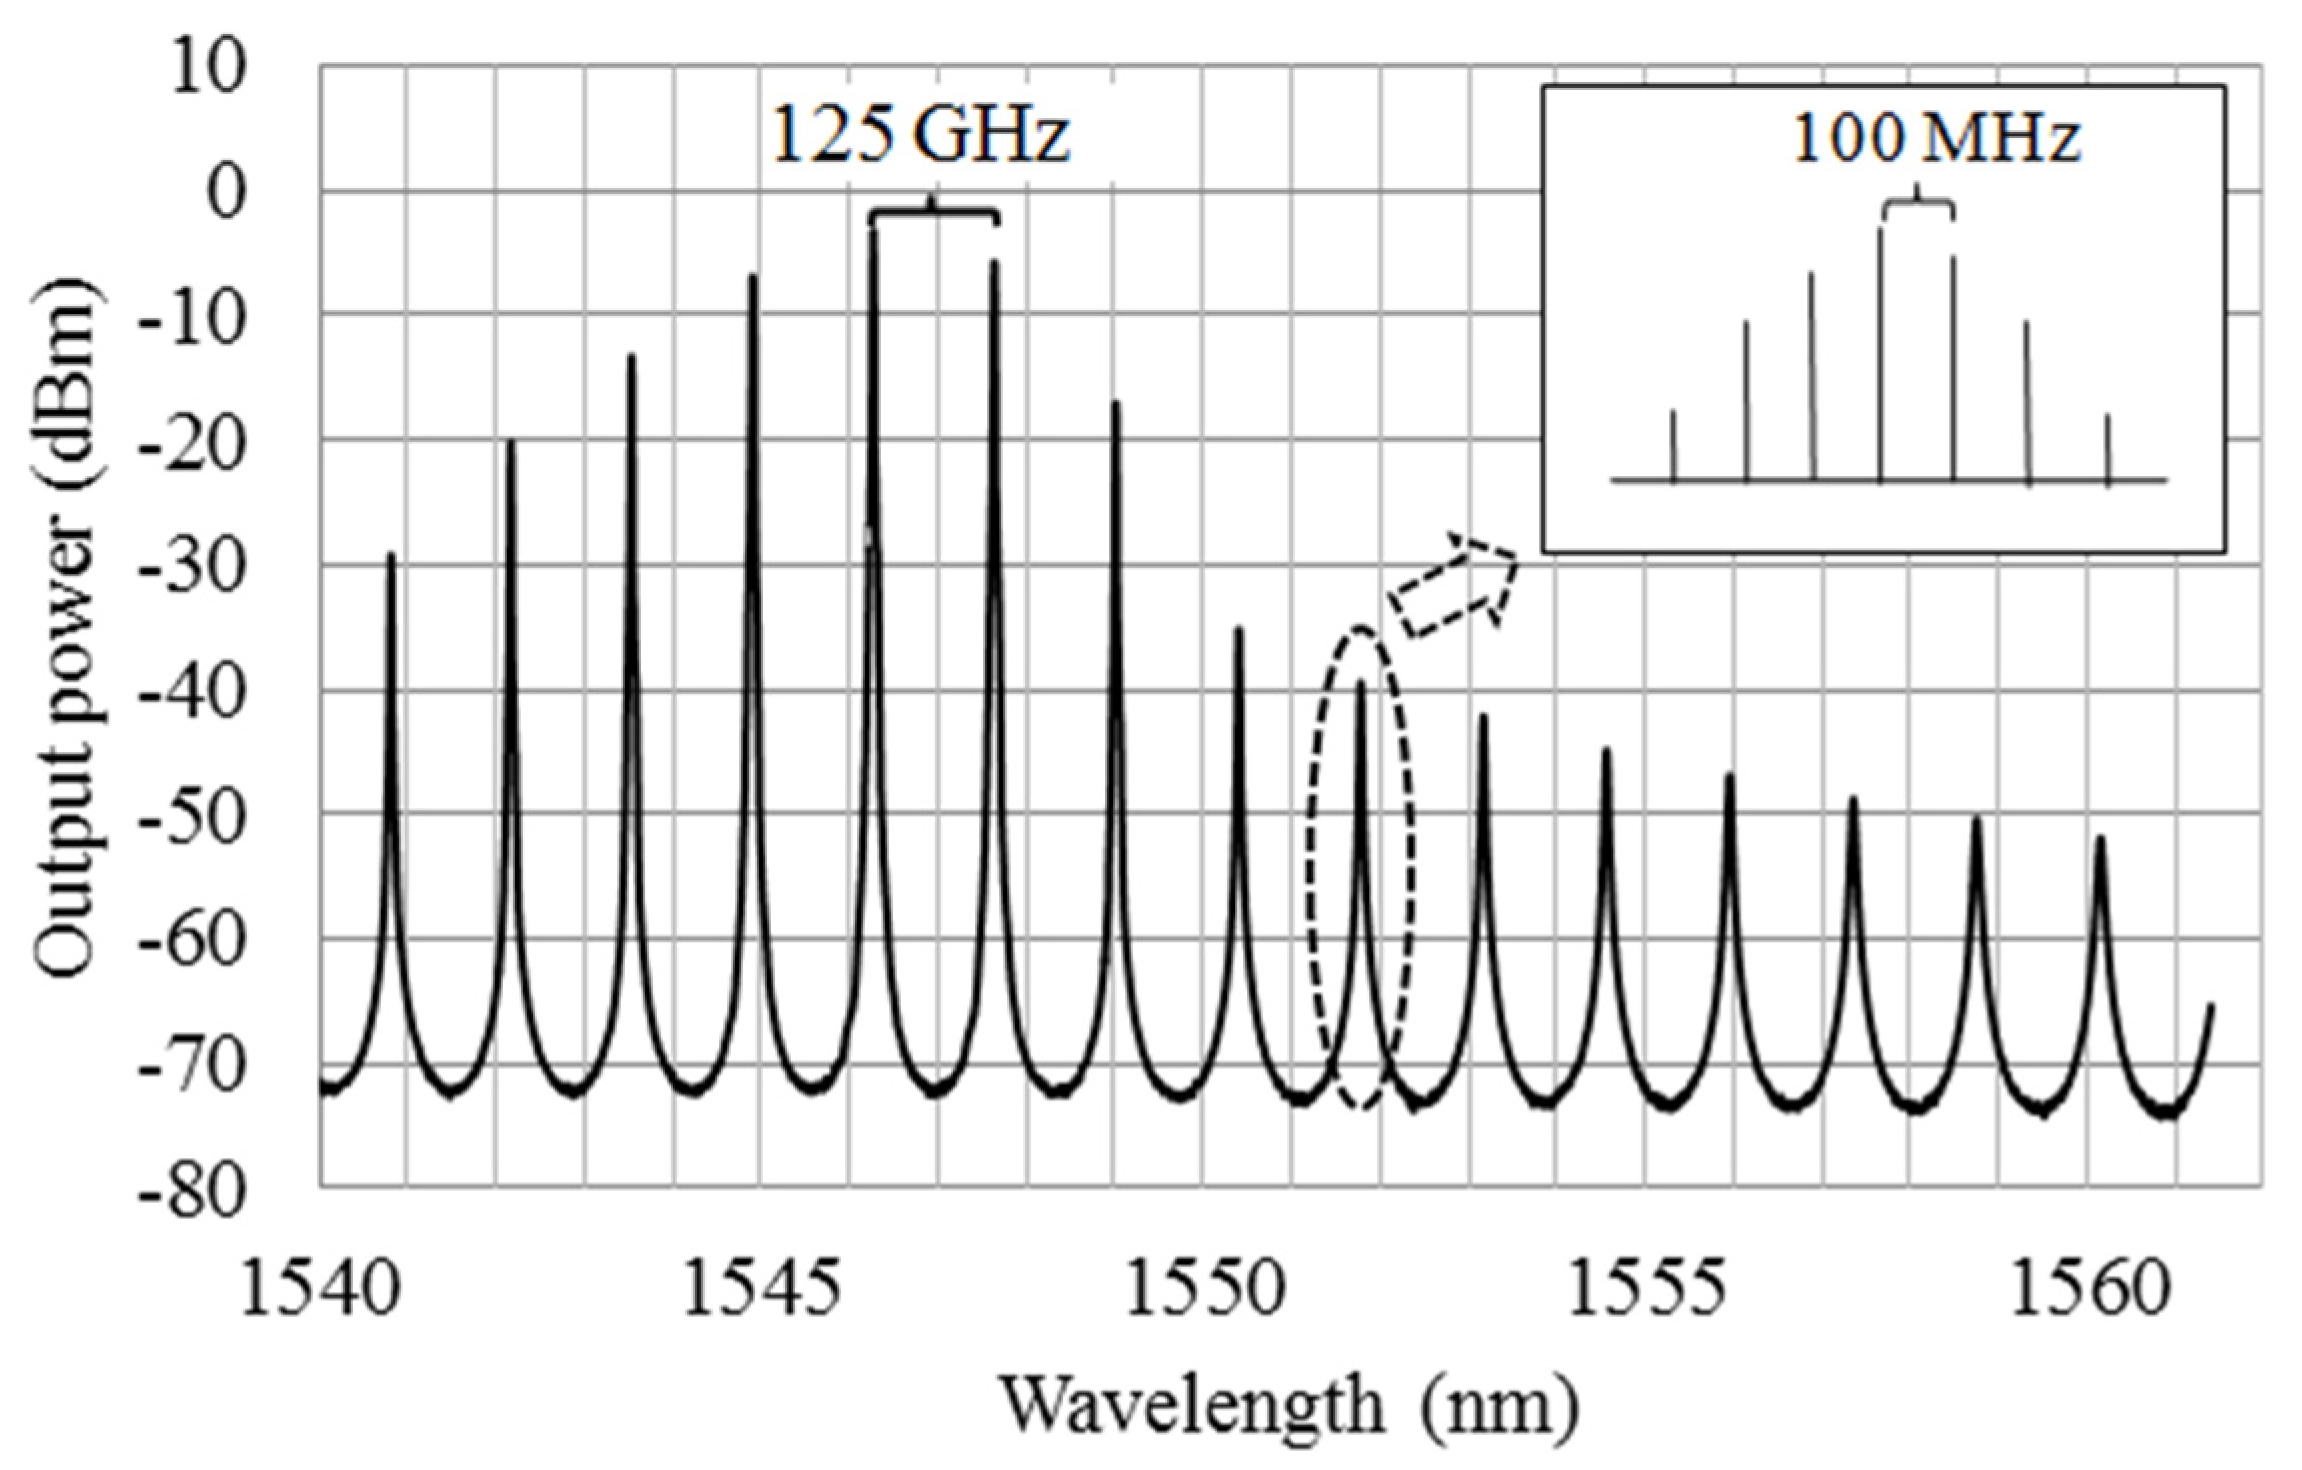
In the case of a 324-µm-long InGaAsP (indium gallium arsenide phosphide) semiconductor FP laser, where Γ
1 = Γ
2 ~ 30%, the internal cavity generates modes with a frequency spacing of 125 GHz, as presented in
Figure 2. In the experimental part of this paper, an experimental verification is performed using a 1-m optical fiber and an external mirror. Low-loss, semireflective, in-fiber mirrors [
35] can be used for the external mirror, but for simplicity, a fiber-optic connector is used in our experimental verification. Such a physical-contact connector acts as a mirror Γ
3 with a reflectivity of 0.5%, where Γ
3 << Γ
2.
Each longitudinal mode of the FP laser is accompanied by additional modes produced by the external cavity. The 1-m-long optical fiber connected to the FP laser, has a time delay of τe = 9.7 ns, measured by τe = 2 nl/c, where n is the refractive index, l is the length of the fiber cable, and c is the speed of light in a vacuum. The free spectral range of the external cavity is ~100 MHz. This also leads to the separation of additional laser modes by ~100 MHz. Such frequency modes are very easy to observe with the RF spectrum analyzer, as explained in the next section.
3. Laser Spectrum Measurement
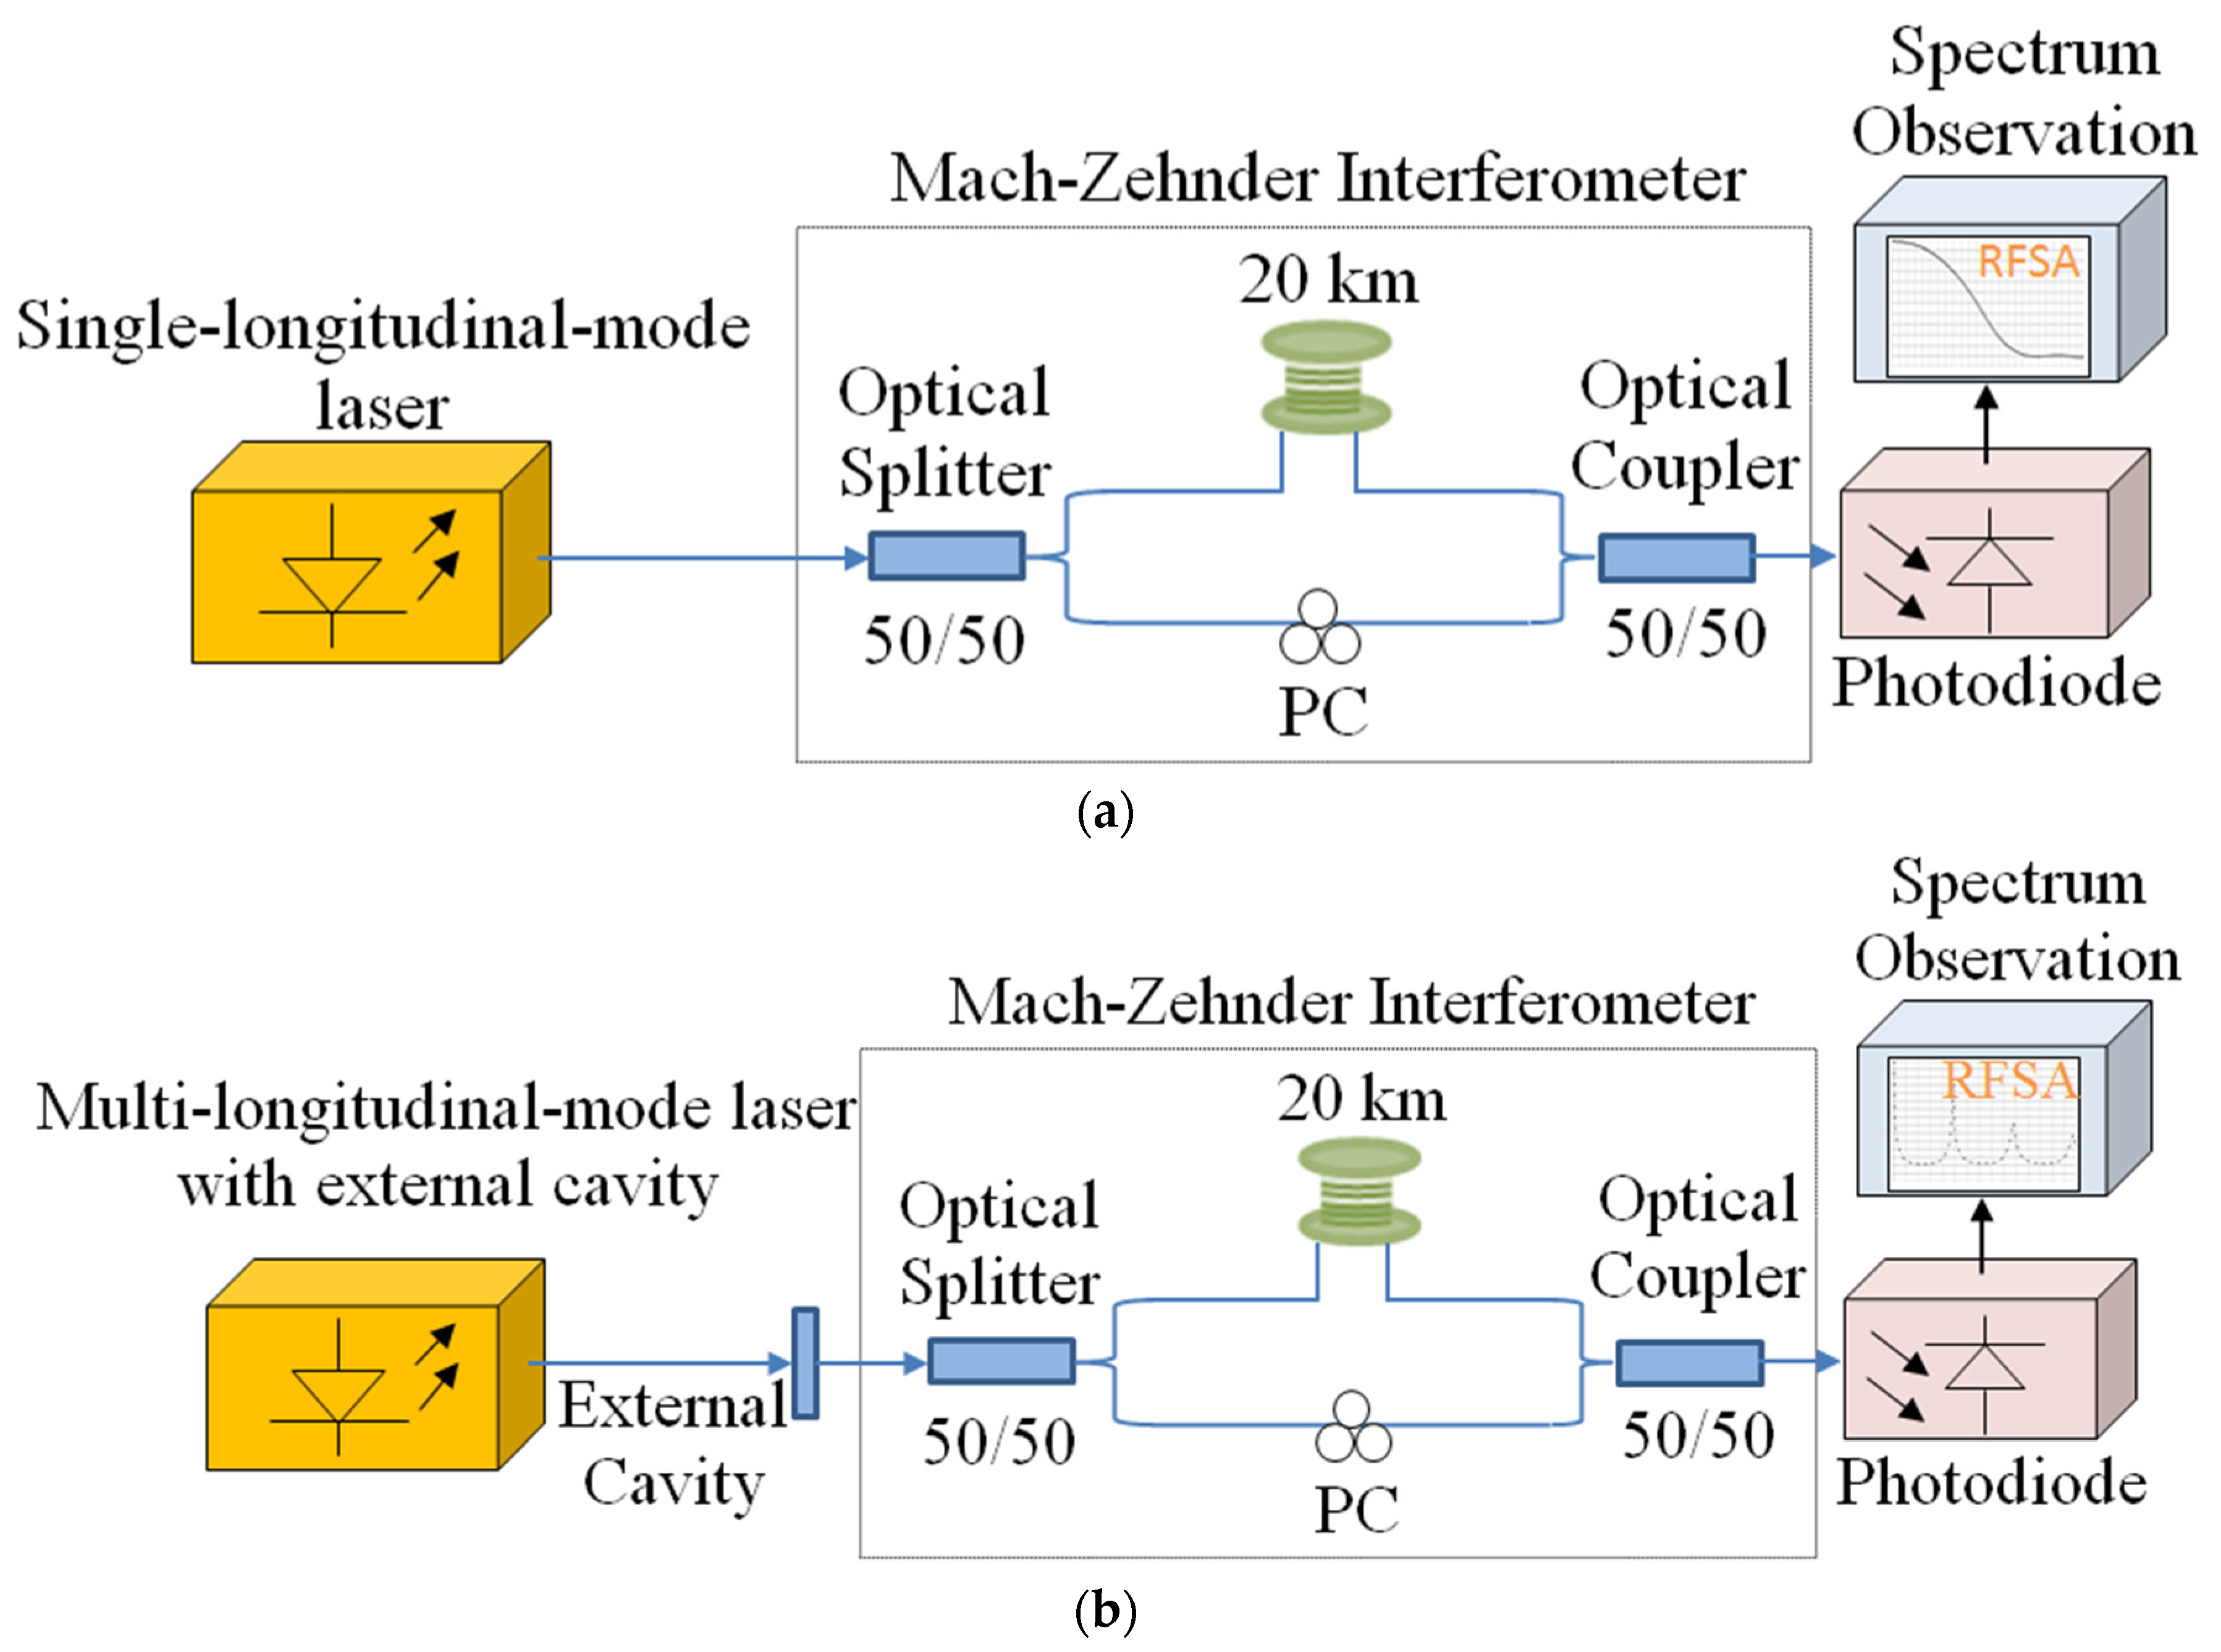
The linewidths of the master laser and the slave laser were measured using the well-known delayed-self-homodyne technique [
36], the setups of which are shown in
Figure 3. In
Figure 3a, the measurement of the linewidth of a single-longitudinal-mode laser used as the master laser during the IL experiment is shown, and in
Figure 3b, the multilongitudinal-mode laser with an external resonator used as the slave laser in the IL experiment is shown. The purpose of this microwave-photonics technique is to add a time delay to one arm of the interferometer, so that at the photodiode the interfering phases of the fields, coming from two arms of the Mach–Zehnder interferometer (MZI), are completely uncorrelated, generating a Lorentzian power spectrum with a width of twice the full width at half maximum (FWHM) of the laser linewidth [
31]. In our experiment, the laser’s optical light is split into two arms, and a 20 km single-mode fiber is inserted into one arm of the MZI to add a time delay of 98 µs. The inserted time delay results in uncorrelated beams at the photodiode, since the delay inserted by the delay line is much longer than the coherence time of the laser. With this inserted time delay, we are able to measure the linewidth in the range of 10 kHz. We ensured that the prepared setup for the linewidth measurement meets our technical requirements, and the time delay is more than sufficient to measure the ~100 MHz linewidth of the master laser used in our experimental setup.
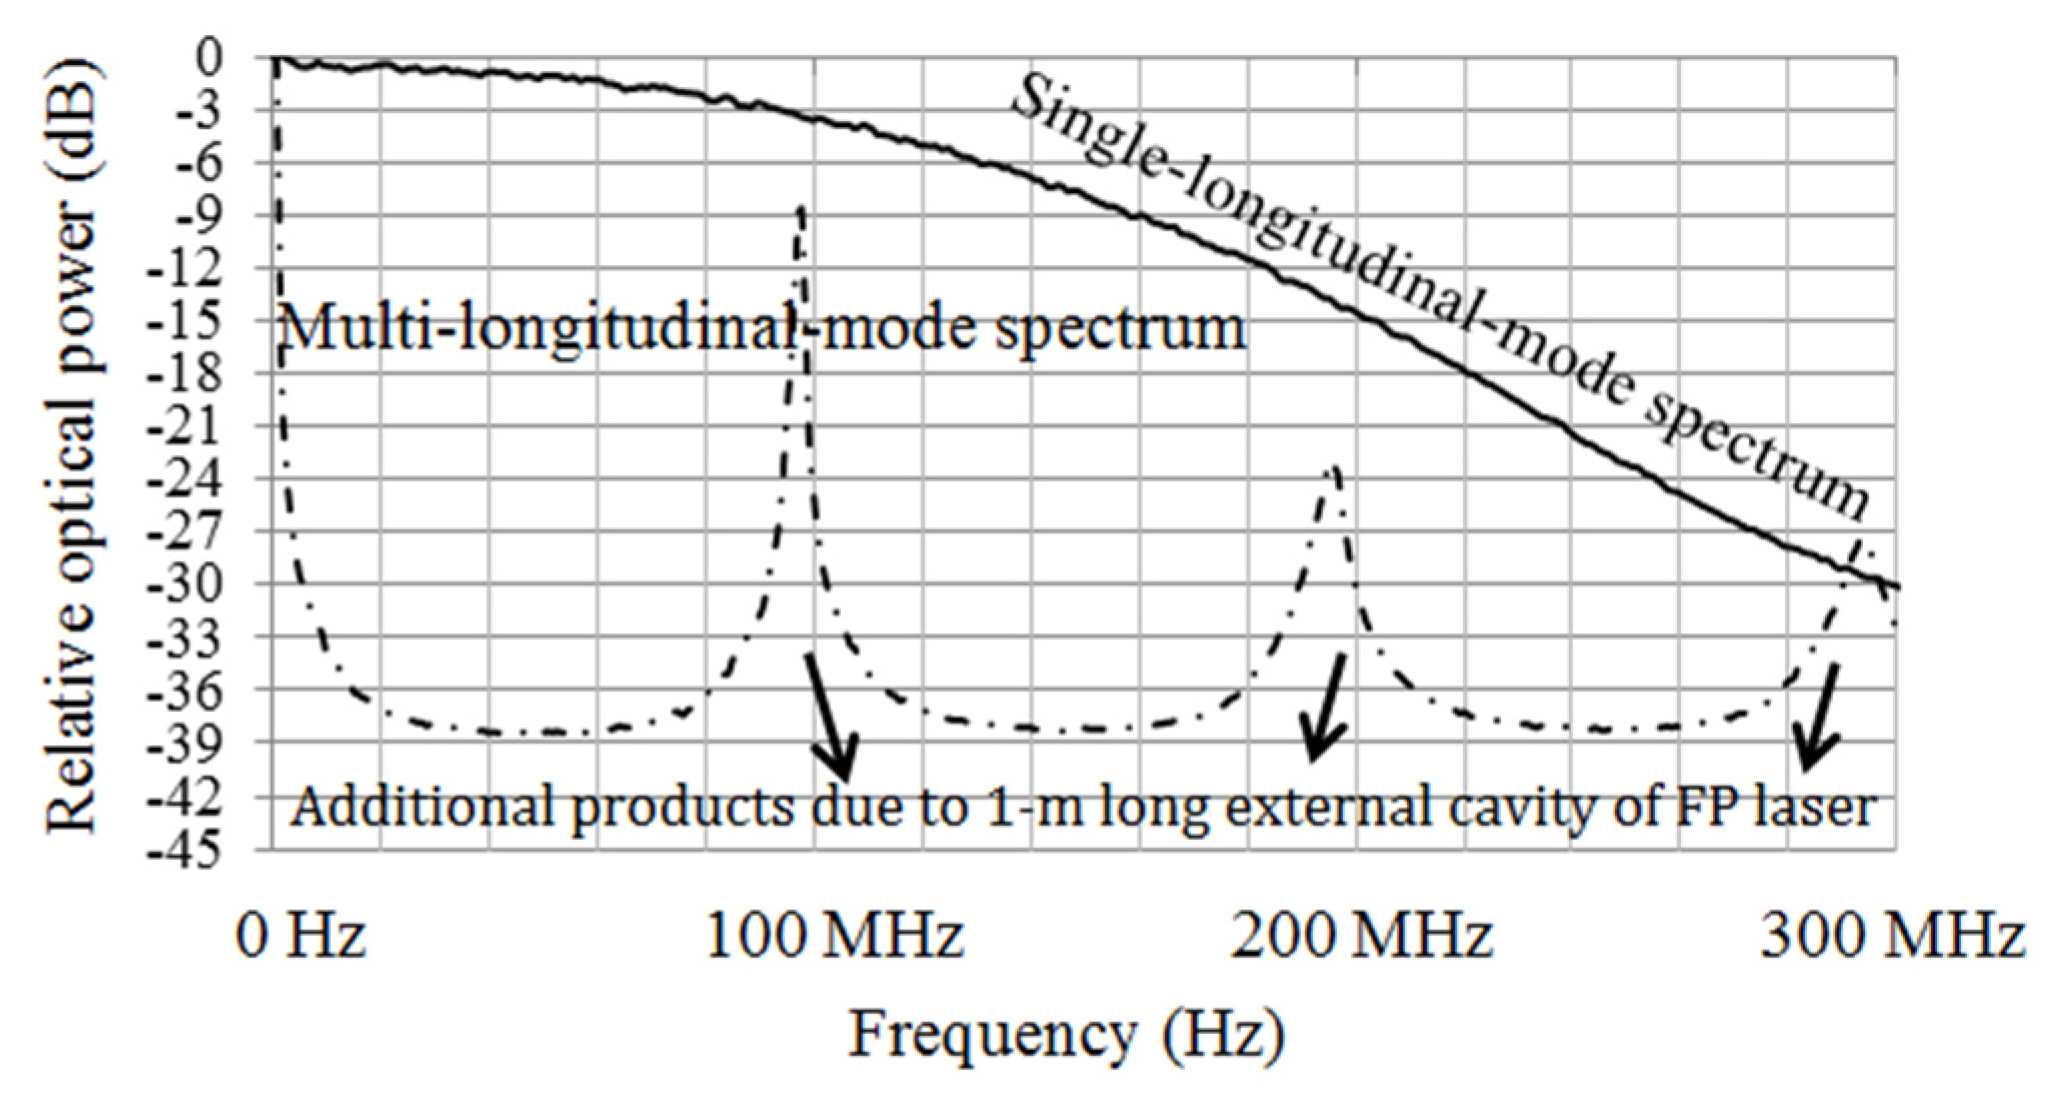
For the detection of the optical signal after the recombination of the two arms of the interferometer, a PIN-FET photodiode with a bandwidth of 1.9 GHz is used. From the photodiode, the signal is amplified and sent to a 13.2-GHz spectrum analyzer (Agilent E4445A), where the resolution bandwidth is set to 100 kHz and the video bandwidth (VBW) is set to 510 Hz. The single longitudinal-mode master laser is a HP 8153A tunable laser source (TLS). With an optical output power of 6 dBm at the output of the master laser (2 dBm at the input of the FP laser), the linewidth of 100 MHz is measured according to the optical -3 dB criterion, see
Figure 4. The slave laser is a FP laser with a threshold current of 10 mA. When the FP laser is stabilized at 20 °C with a bias current of I = 3 Ith, we find the dominant mode at 1546.244 nm. The FP laser is equipped with a 1-m single-mode optical fiber and an optical connector with physical contact and a reflectivity of 0.5%, which serves as an external cavity. The reflectivity of the optical connector is measured using a HP 8153A multimeter with a HP 81534 return-loss module.
Figure 4 shows the delayed self-homodyne spectrum of both the single-longitudinal-mode master laser and the FP laser, with a time delay in the MZI of 98 µs. For the linewidth of the FP laser with an attached external cavity, due to its multilongitudinal spectrum, in the RF spectra we have the corresponding additional products of the optical longitudinal modes generated by optical beating of the multilongitudinal groups with an FSR of 100 MHz, existing on each longitudinal mode of the FP laser. Such a beating signal generated through optical heterodyning on a photodiode is subject to mode partition noise as additional intensity noise [
37,
38]. The dashed and dotted lines in
Figure 4 represent the cumulative power of all the longitudinal groups generated by the external cavity. The overlap of the multiple longitudinal groups increases the RF components in the RF spectrum, making it easier to observe them on the scale of the instrument, and this consequently increases the sensitivity of the subsequently presented method for determining the IL in the RF spectrum. Since the laser mode partition noise decreases as the number of modes increases [
17], the phase noise of the lower frequency components generated by more beating modes is lower.
4. Experimental Setup for Determining the FP Laser’s Stable-Locking Regime
A conventional observation of the injection-locked stability of a FP laser is performed with the setup shown in
Figure 5, where a single-longitudinal-mode laser is used for the master laser, whose measured linewidth is shown in
Figure 4, while the multilongitudinal-mode FP laser is used for the slave laser. In this experimental part, we compare the conventional observation with the proposed new technique.
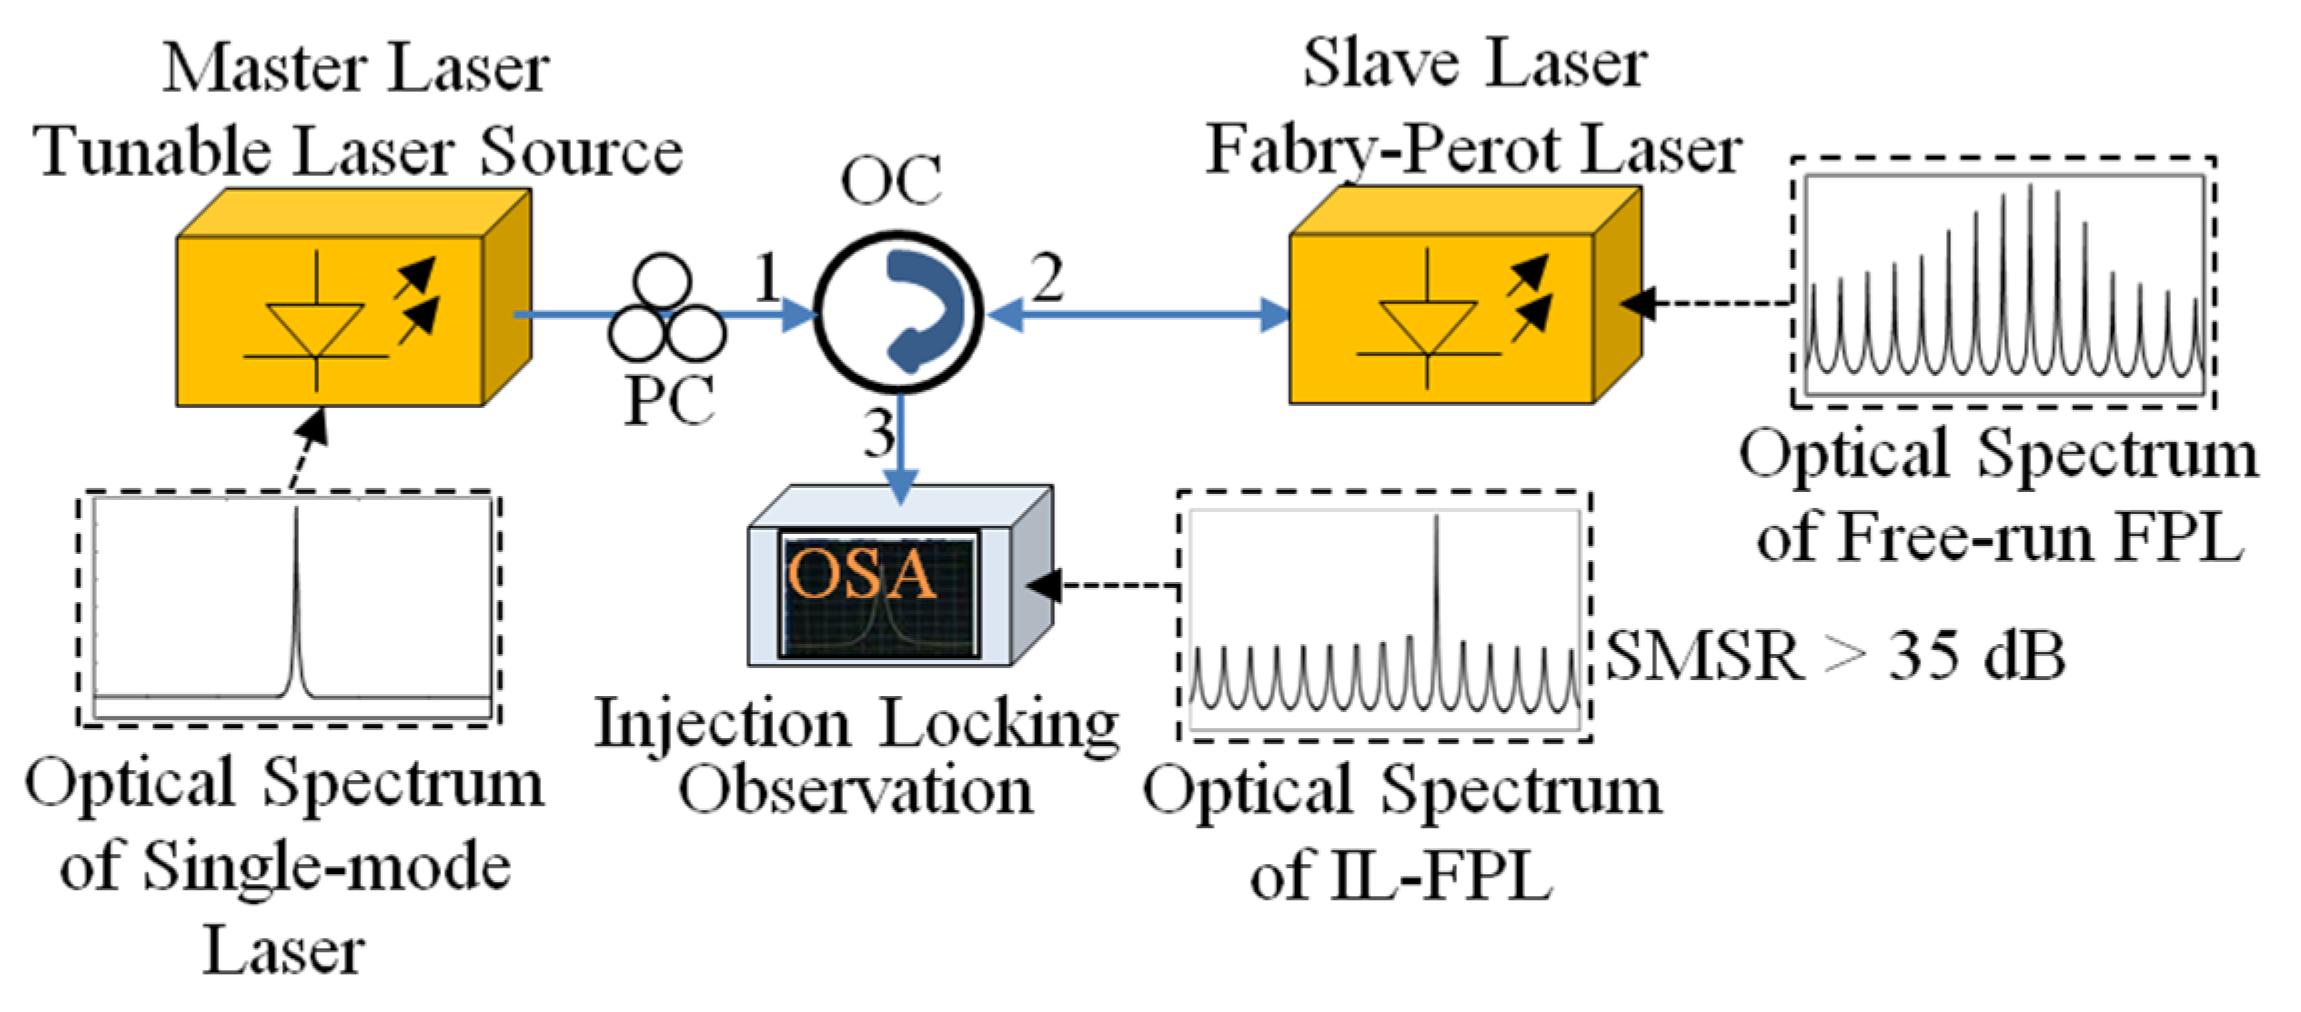
Before using the proposed new technique for the stable-locking observation, we prepared the conventional setup shown in
Figure 5 to record the stable-locking map of the IL-FP laser by observing the SMSR in the optical spectrum. The stability condition was related to the SMSR, which was higher than 35 dB. The master laser and the slave laser are the same ones that were used in the setups shown in
Figure 3. The optical spectrum analyzer (OSA) (Ando AQ6317), with resolution set to 0.02 nm, provides the ability to observe the IL waveform. The optical circulator (OC), which causes an additional 1-dB loss, injects the light into the cavity of the FP laser while providing the necessary isolation to prevent the light from returning to the master laser.
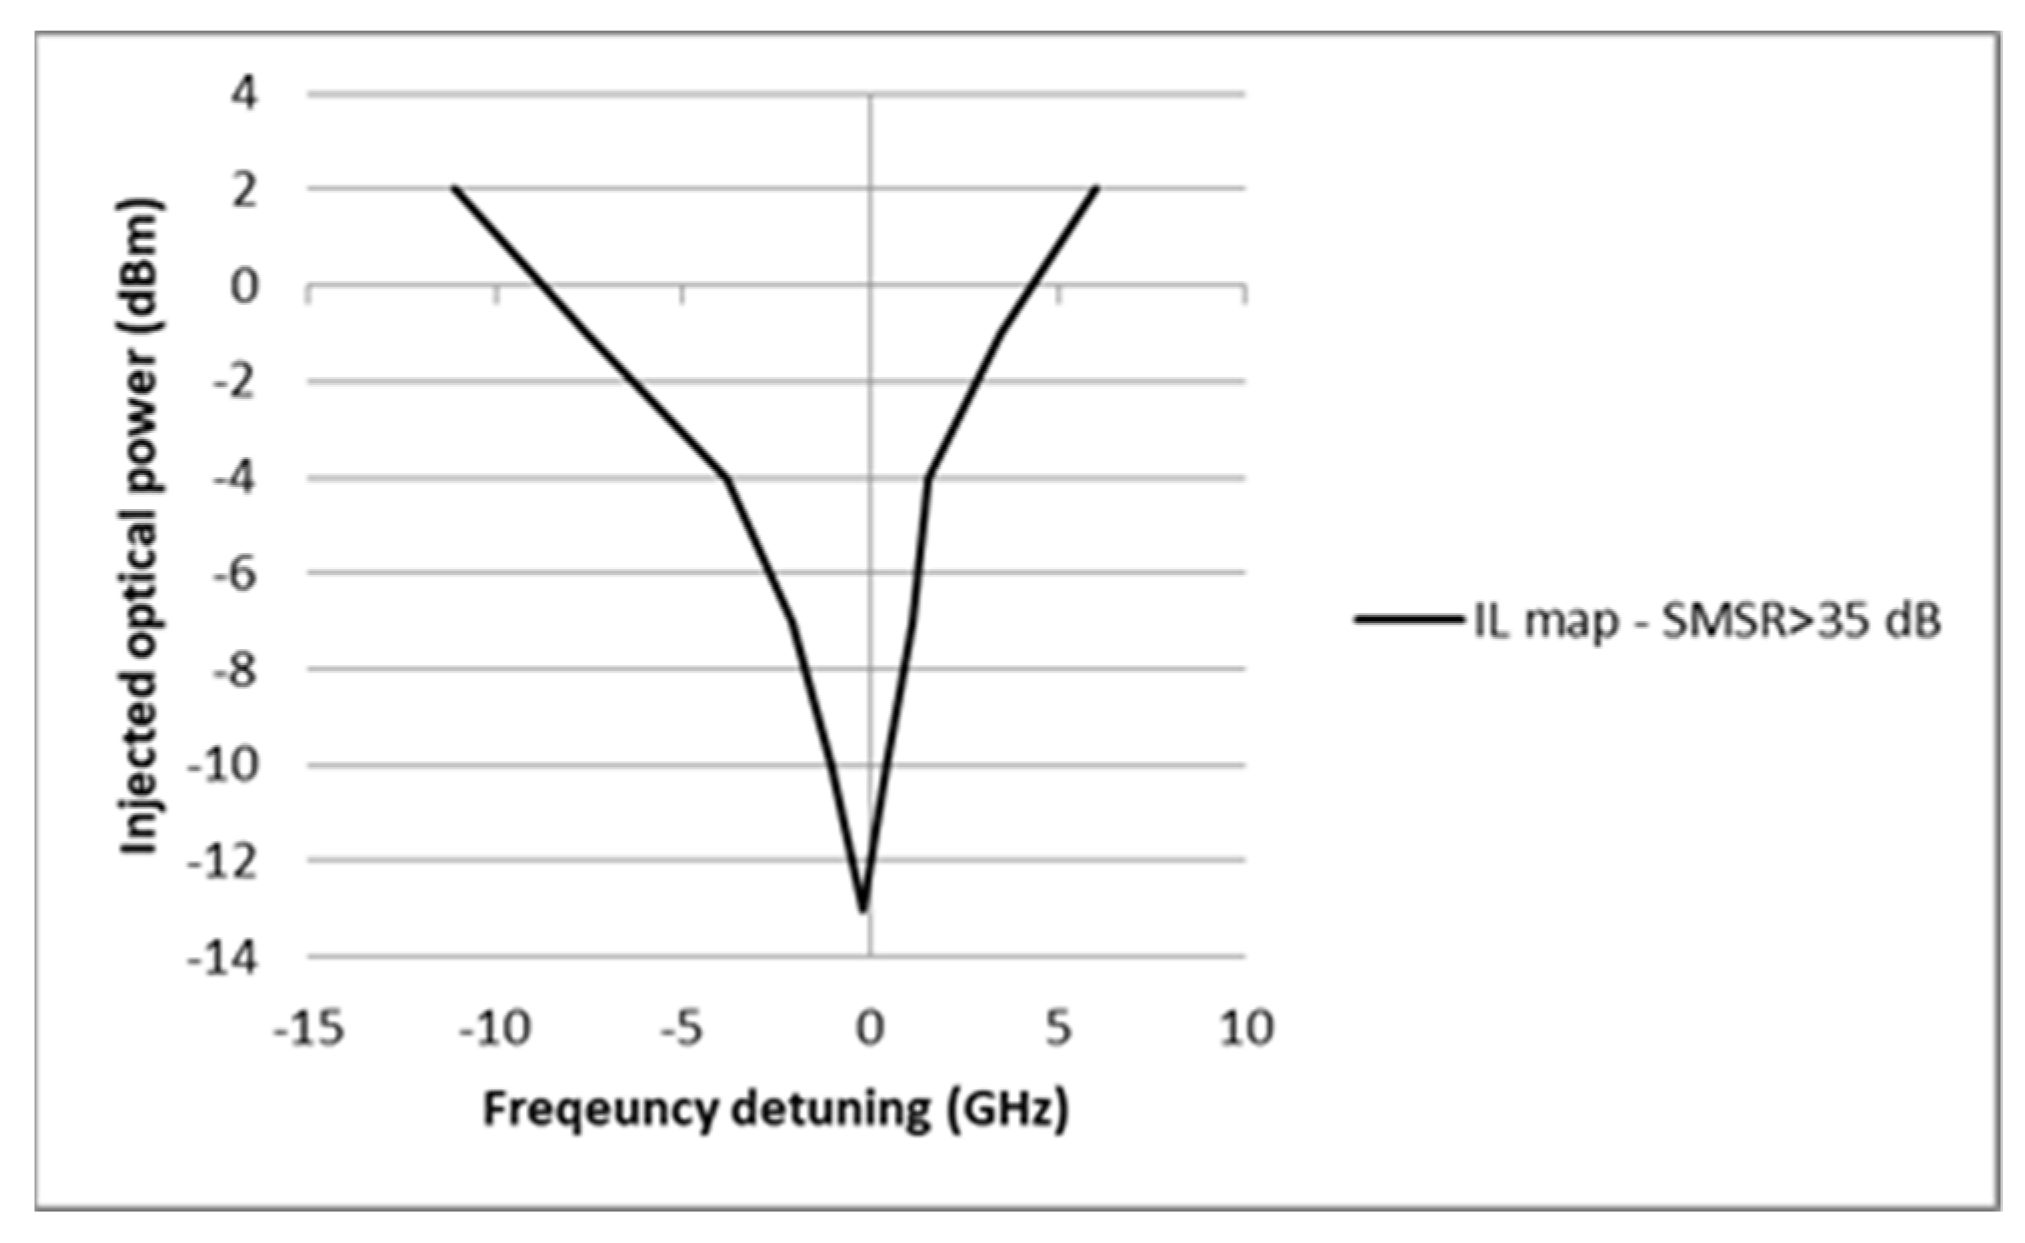
The mode we chose for the IL was the first mode on the short-wavelength side of the central mode of the FP laser when viewed in the nanometer domain of the optical spectrum, with a wavelength of 1547.660 nm. The FP laser was forward biased with a current of 30 mA and stabilized at 20 °C. For this experiment we considered the FP laser to be in the injection-locked state when we measured an SMSR greater than 35 dB. The results are shown in
Figure 6.
Within the locking region, when the optical spectrum is considered according to the conventional criterion of 35 dB, the suppression ratio of the SMSR is satisfied. Outside the locking region, it is the typical optical spectrum of the FP laser with multiple longitudinal modes. The locking parameter for the FP laser used in this work follows the natural pattern of the IL map.
Figure 6 illustrates the locking map of the FP laser under different injected powers and frequency tunings. The main conclusion we can draw is that with a higher injection power we have a larger locking area, which means that the IL is easier to achieve for higher injection powers. At a low optical injection power, in the range of −13 dBm at the FP laser input, the frequency detuning had to be close to 0 Hz to reach the IL of the FP laser. As the injection power increases, the frequency-detuning values can be higher. For an optical injection power of 0 dBm, the frequency detuning is about 10 GHz. One anomaly that can be detected when observing the locking map is that we have a narrower locking range for positive values of the frequency detuning. This is due to the presence of the α-linewidth-enhancement factor, which is due to the dependence of the carrier concentration on the refractive index of the active region and, as a result, shrinks the positive part of the locking map.
An FP laser adopts most of the properties of the master laser during IL [
16,
25], and most of the fundamental limitations of the directly modulated FP laser are improved [
24], together with the significantly increased modulation bandwidth [
25]. An injection-locked laser offers a variety of operating characteristics for different values of the frequency detuning suitable for different applications. In fact, the highest values of the resonant frequency are achieved at extreme values of positive frequency detuning with a high resonance [
24]. However, as pointed out in [
12,
27], the FP laser shows instabilities in the border regions of the IL stability map in both parts, but they are more pronounced in the case of positive frequency detuning. In the case of negative frequency detuning, the instabilities show up in the form of hysteresis and bistabilities [
16].
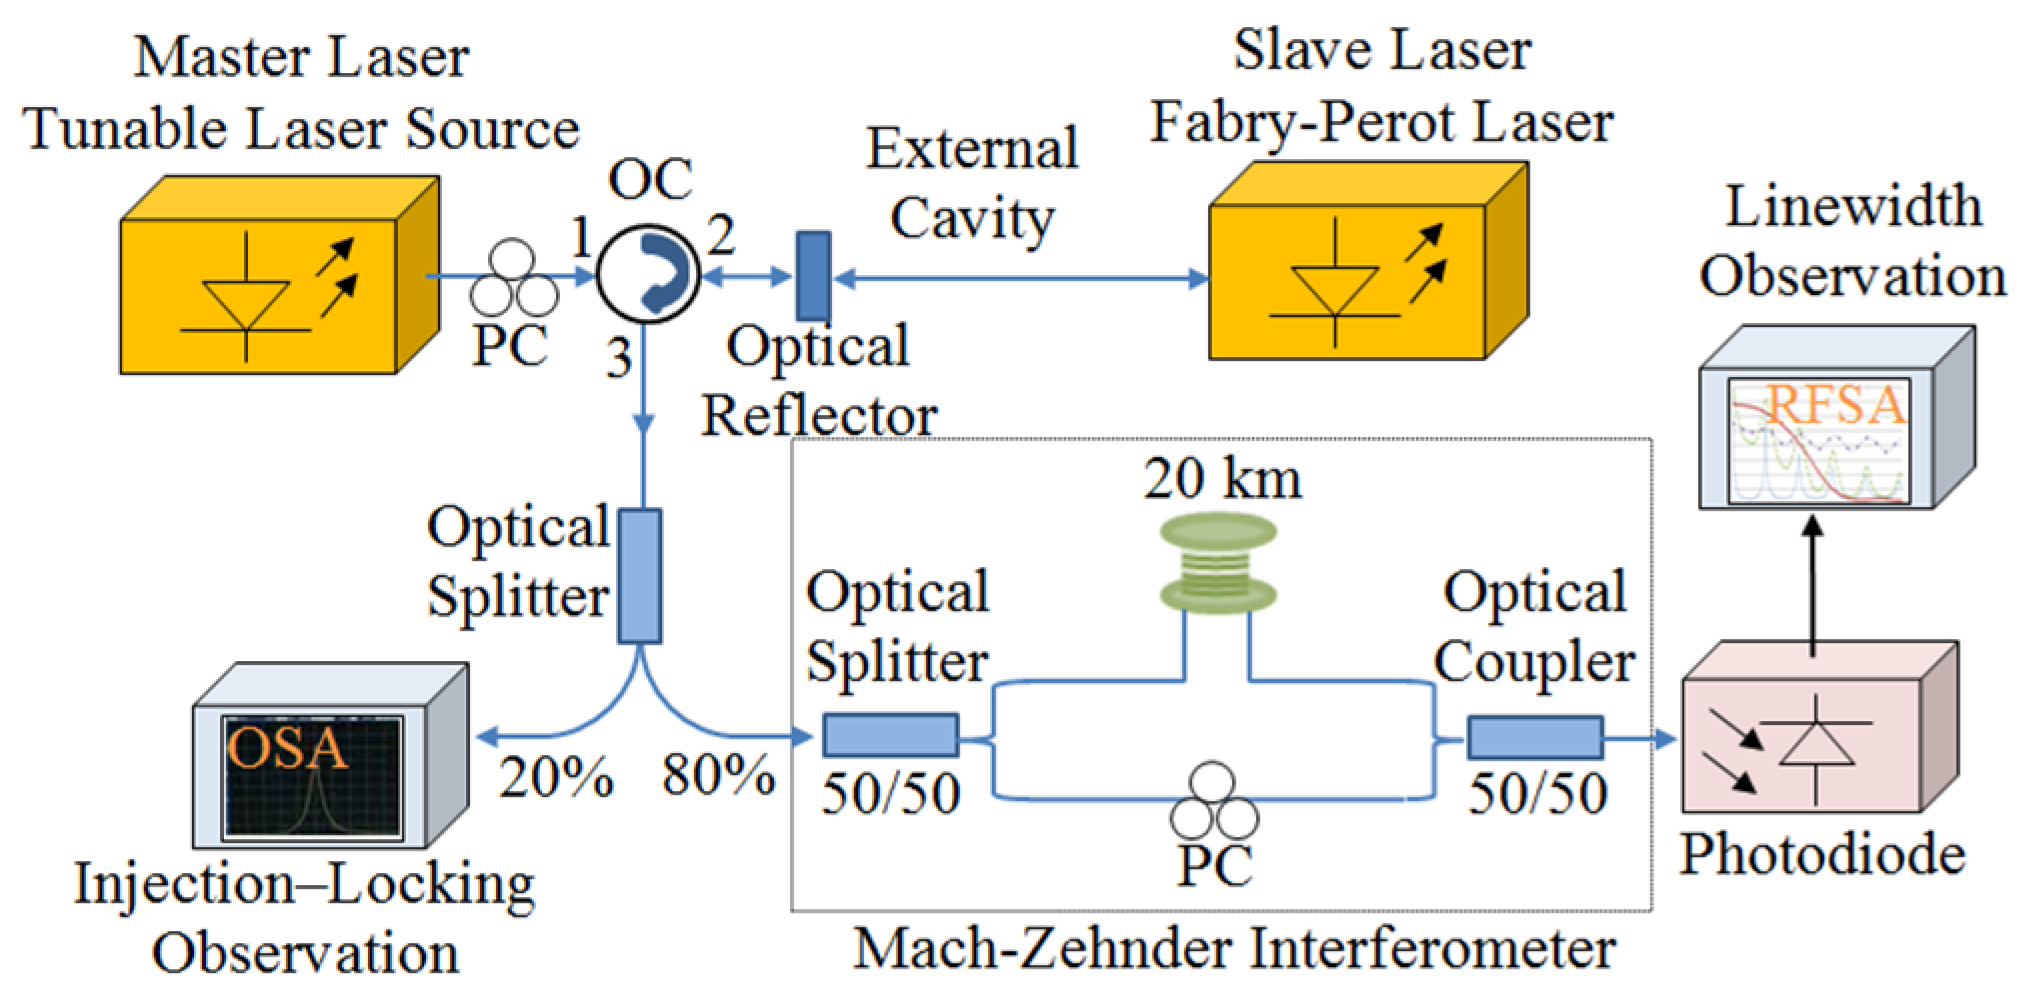
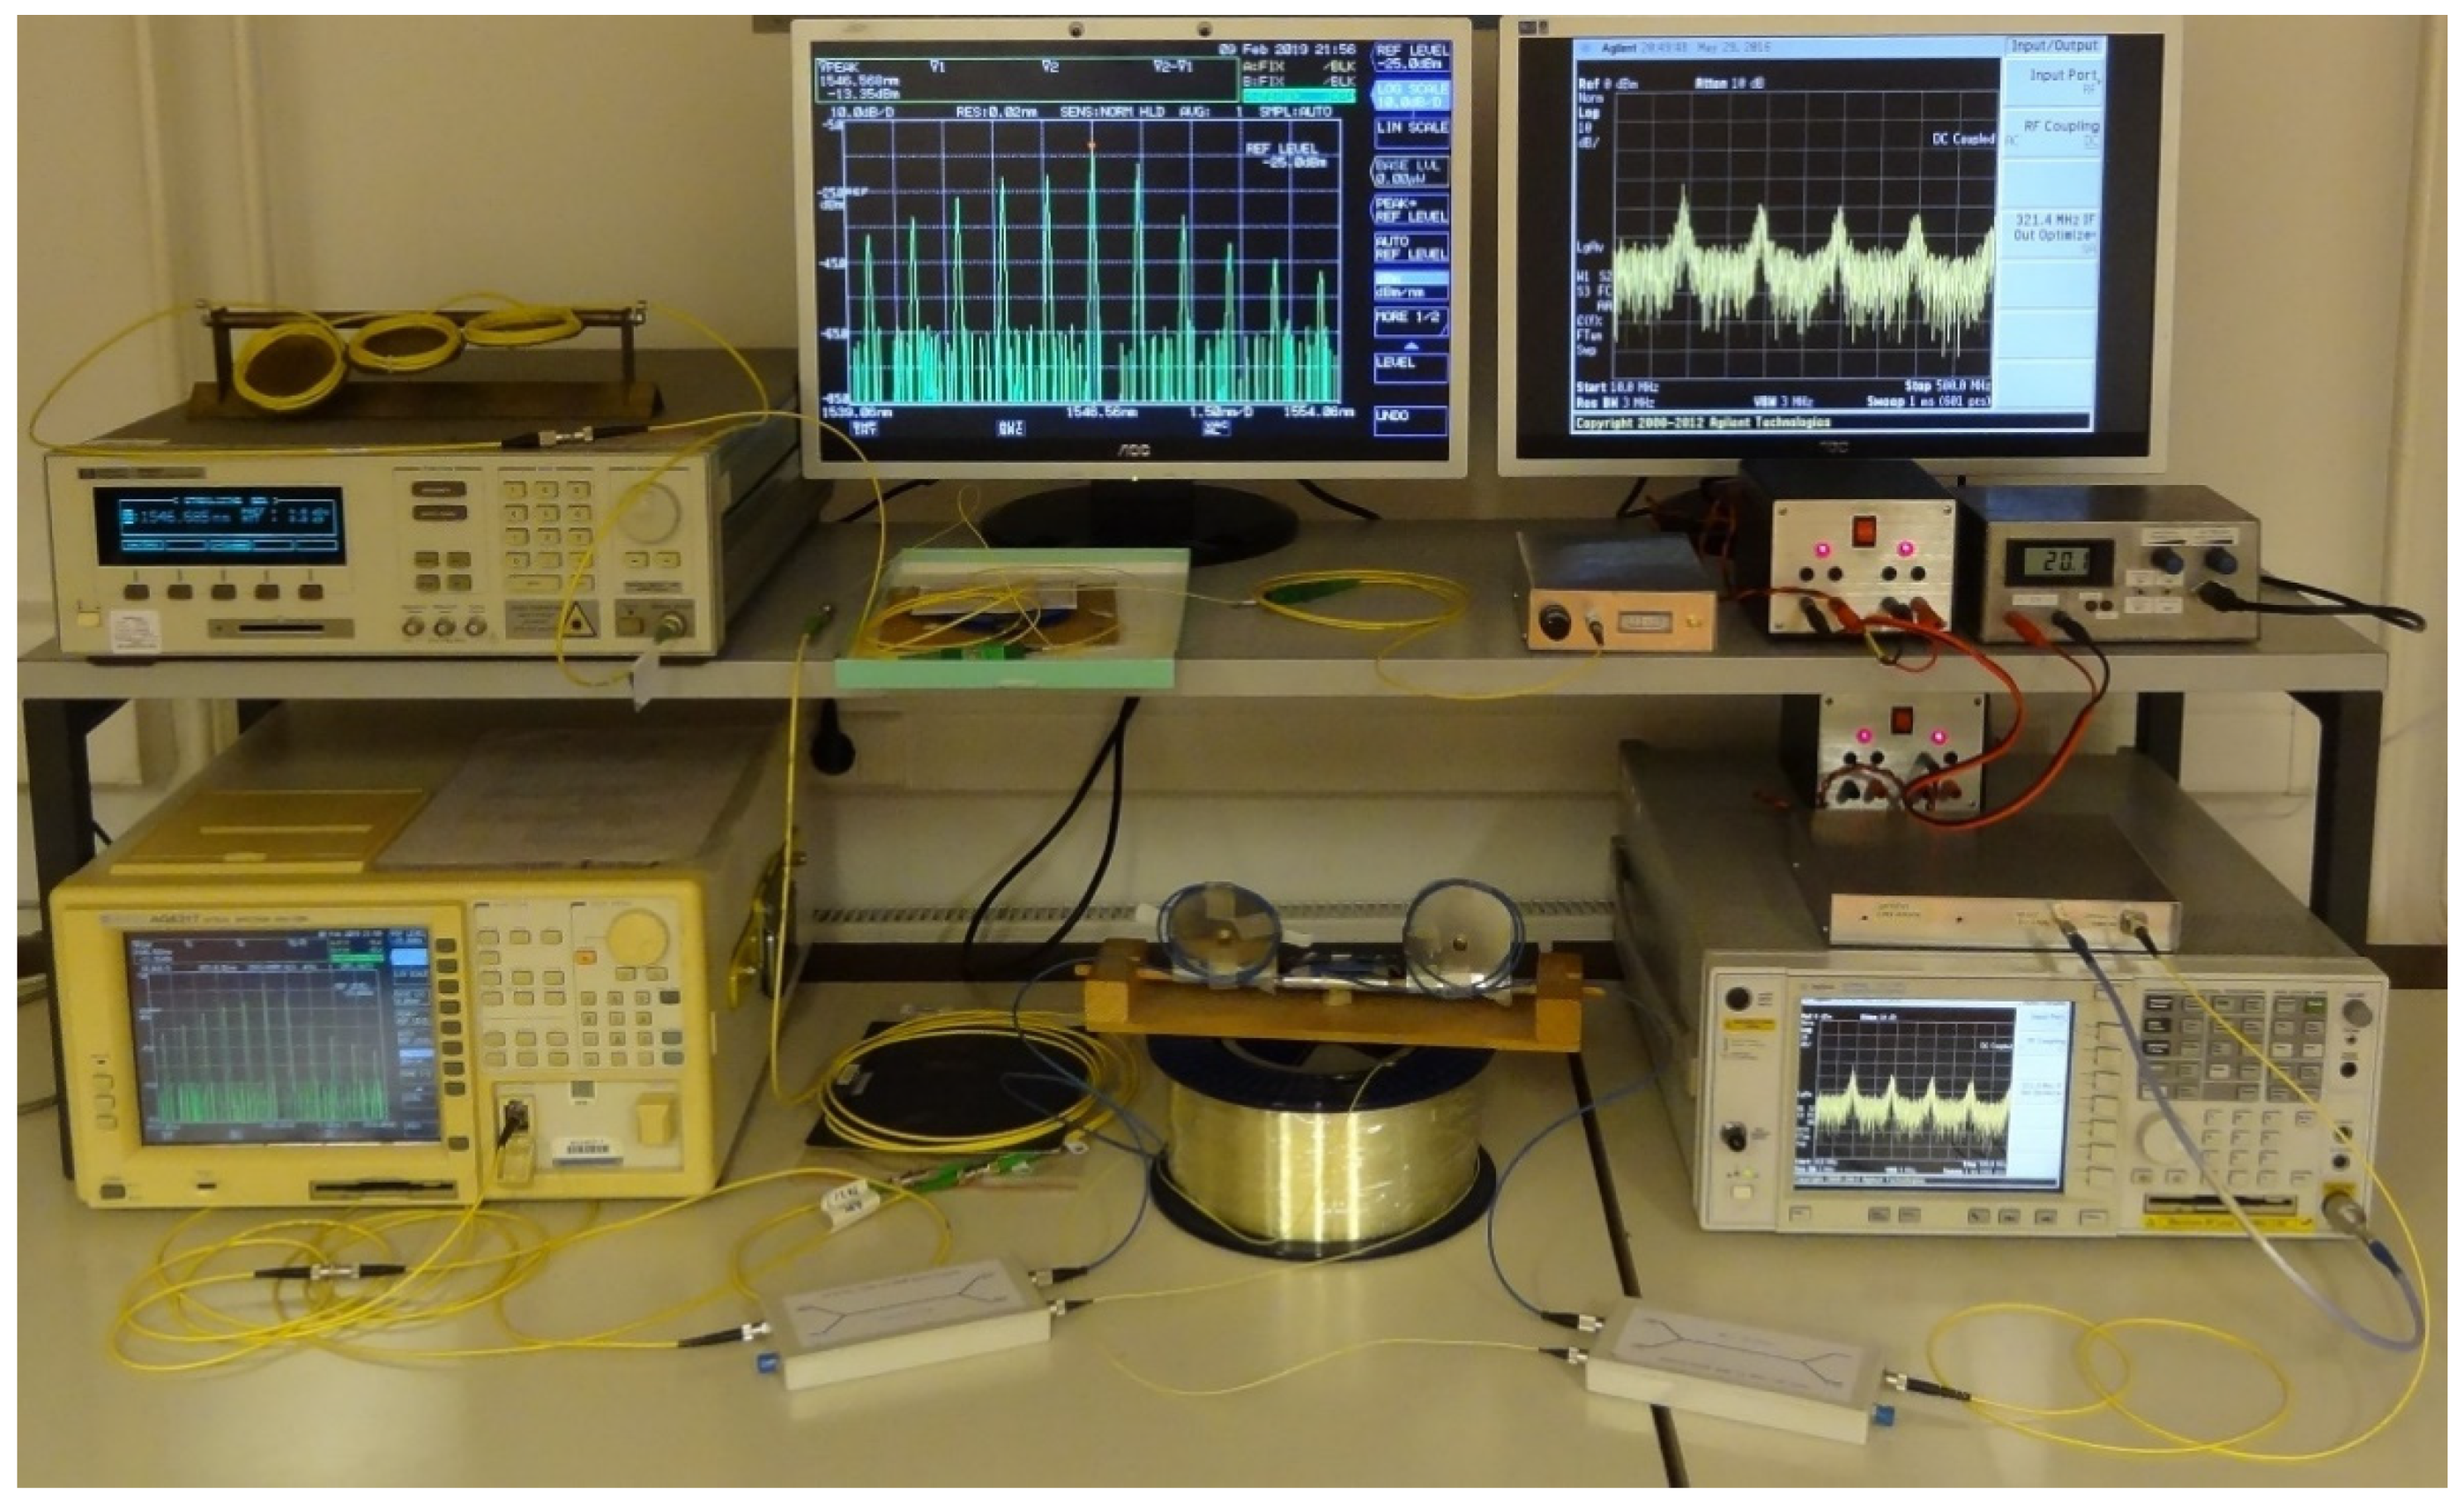
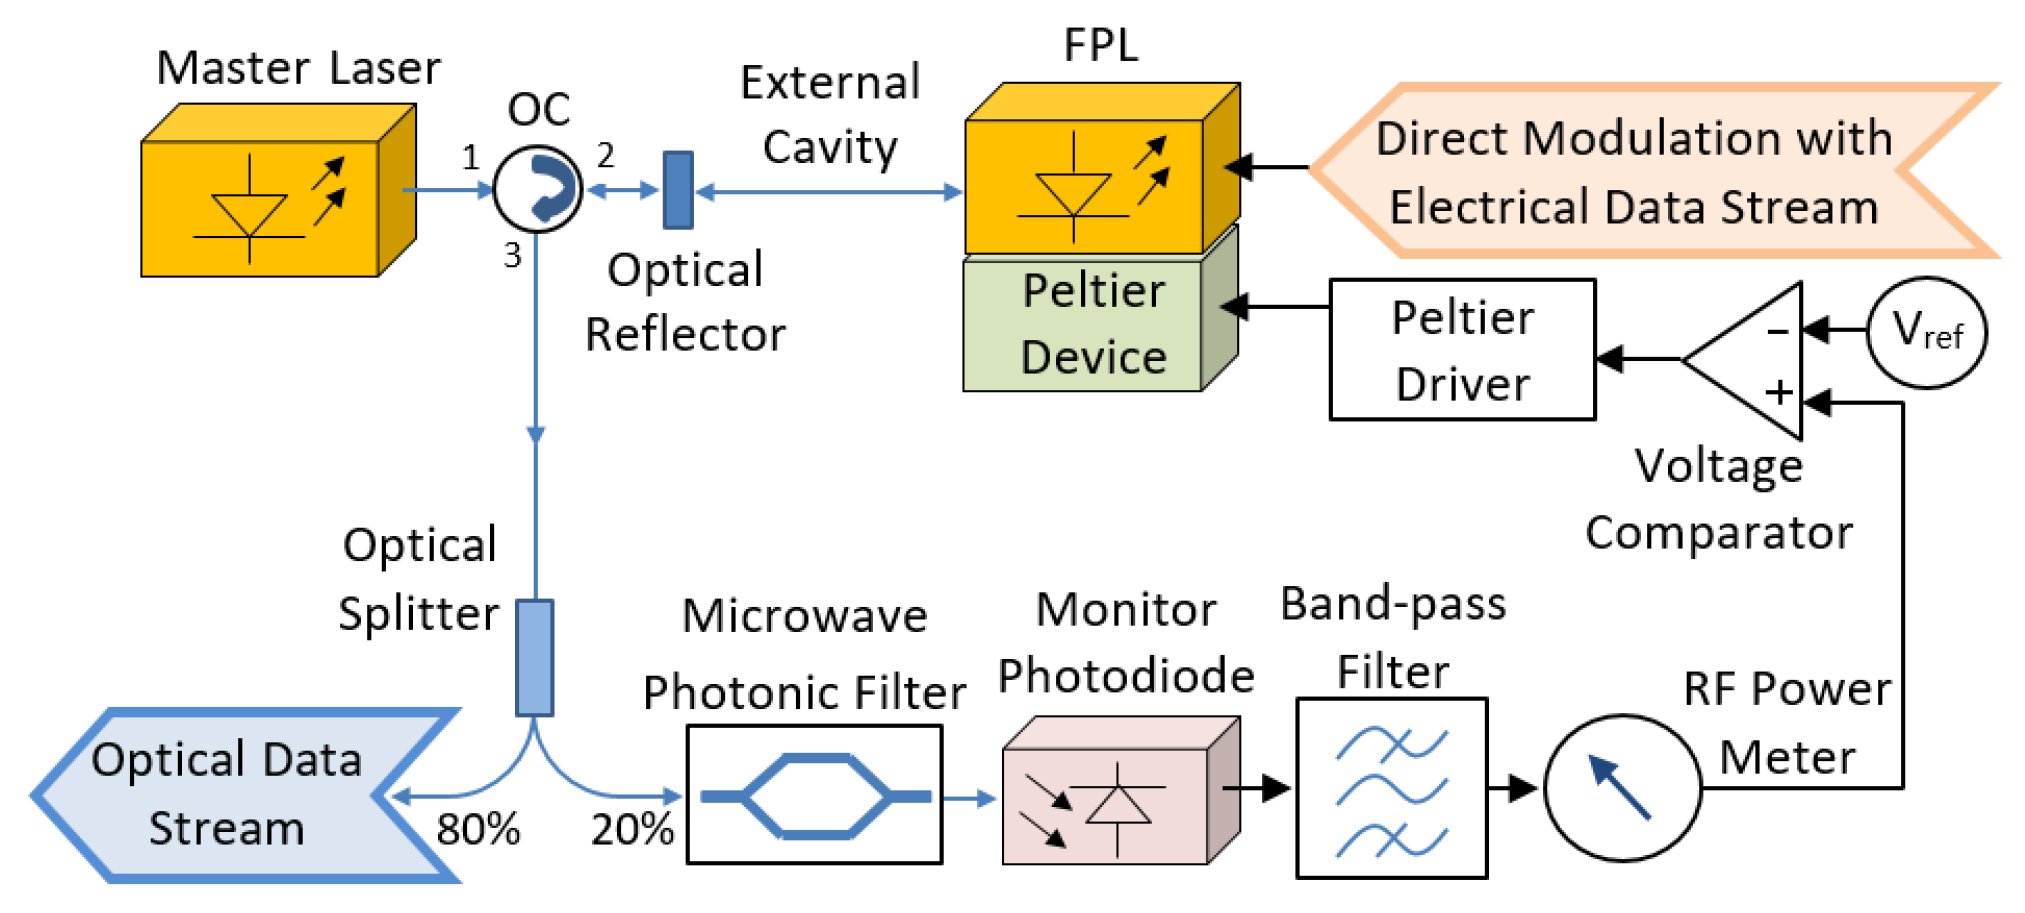
To verify the performance of the IL of the FP laser with the newly proposed technique, we set up the experimental system as shown in
Figure 7, the schematic drawing, and
Figure 8, a photograph of the experiment from the laboratory. By combining the two experimental setups shown in
Figure 3 and
Figure 5, we were able to incorporate the FP laser into the IL process and observe the process of converting the linewidth of the FP laser from its free-running state into the injection-locked state. The test unit consists of instruments and equipment to observe the optical and RF spectra. To avoid additional unwanted light reflections in the test setup, which possibly affected the verification results, both the lasers and the optical circulator are connected using angled-physical-contact (APC) connectors.
By comparing the SMSR in the optical spectrum and the 100-MHz components in the RF spectrum, the proposed system can be evaluated simultaneously. For this experiment, we kept the injected power constant, as in the previous experiments, with a value of 2 dBm at the input of the FP laser, changing the values of the frequency detuning from the negative to the positive range. By observing the suppression of the RF components, which is a consequence of the external cavity at the FP laser, and simultaneously observing the SMSR in the optical spectrum analyzer, especially in the limit of the positive frequency detuning, the correlation between these two activities and the stability of the injection-locked FP laser is established.
5. Measurement Results
The stability analysis focuses on the case of positive frequency detuning, since the instabilities are more pronounced in this region [
16,
24]. In
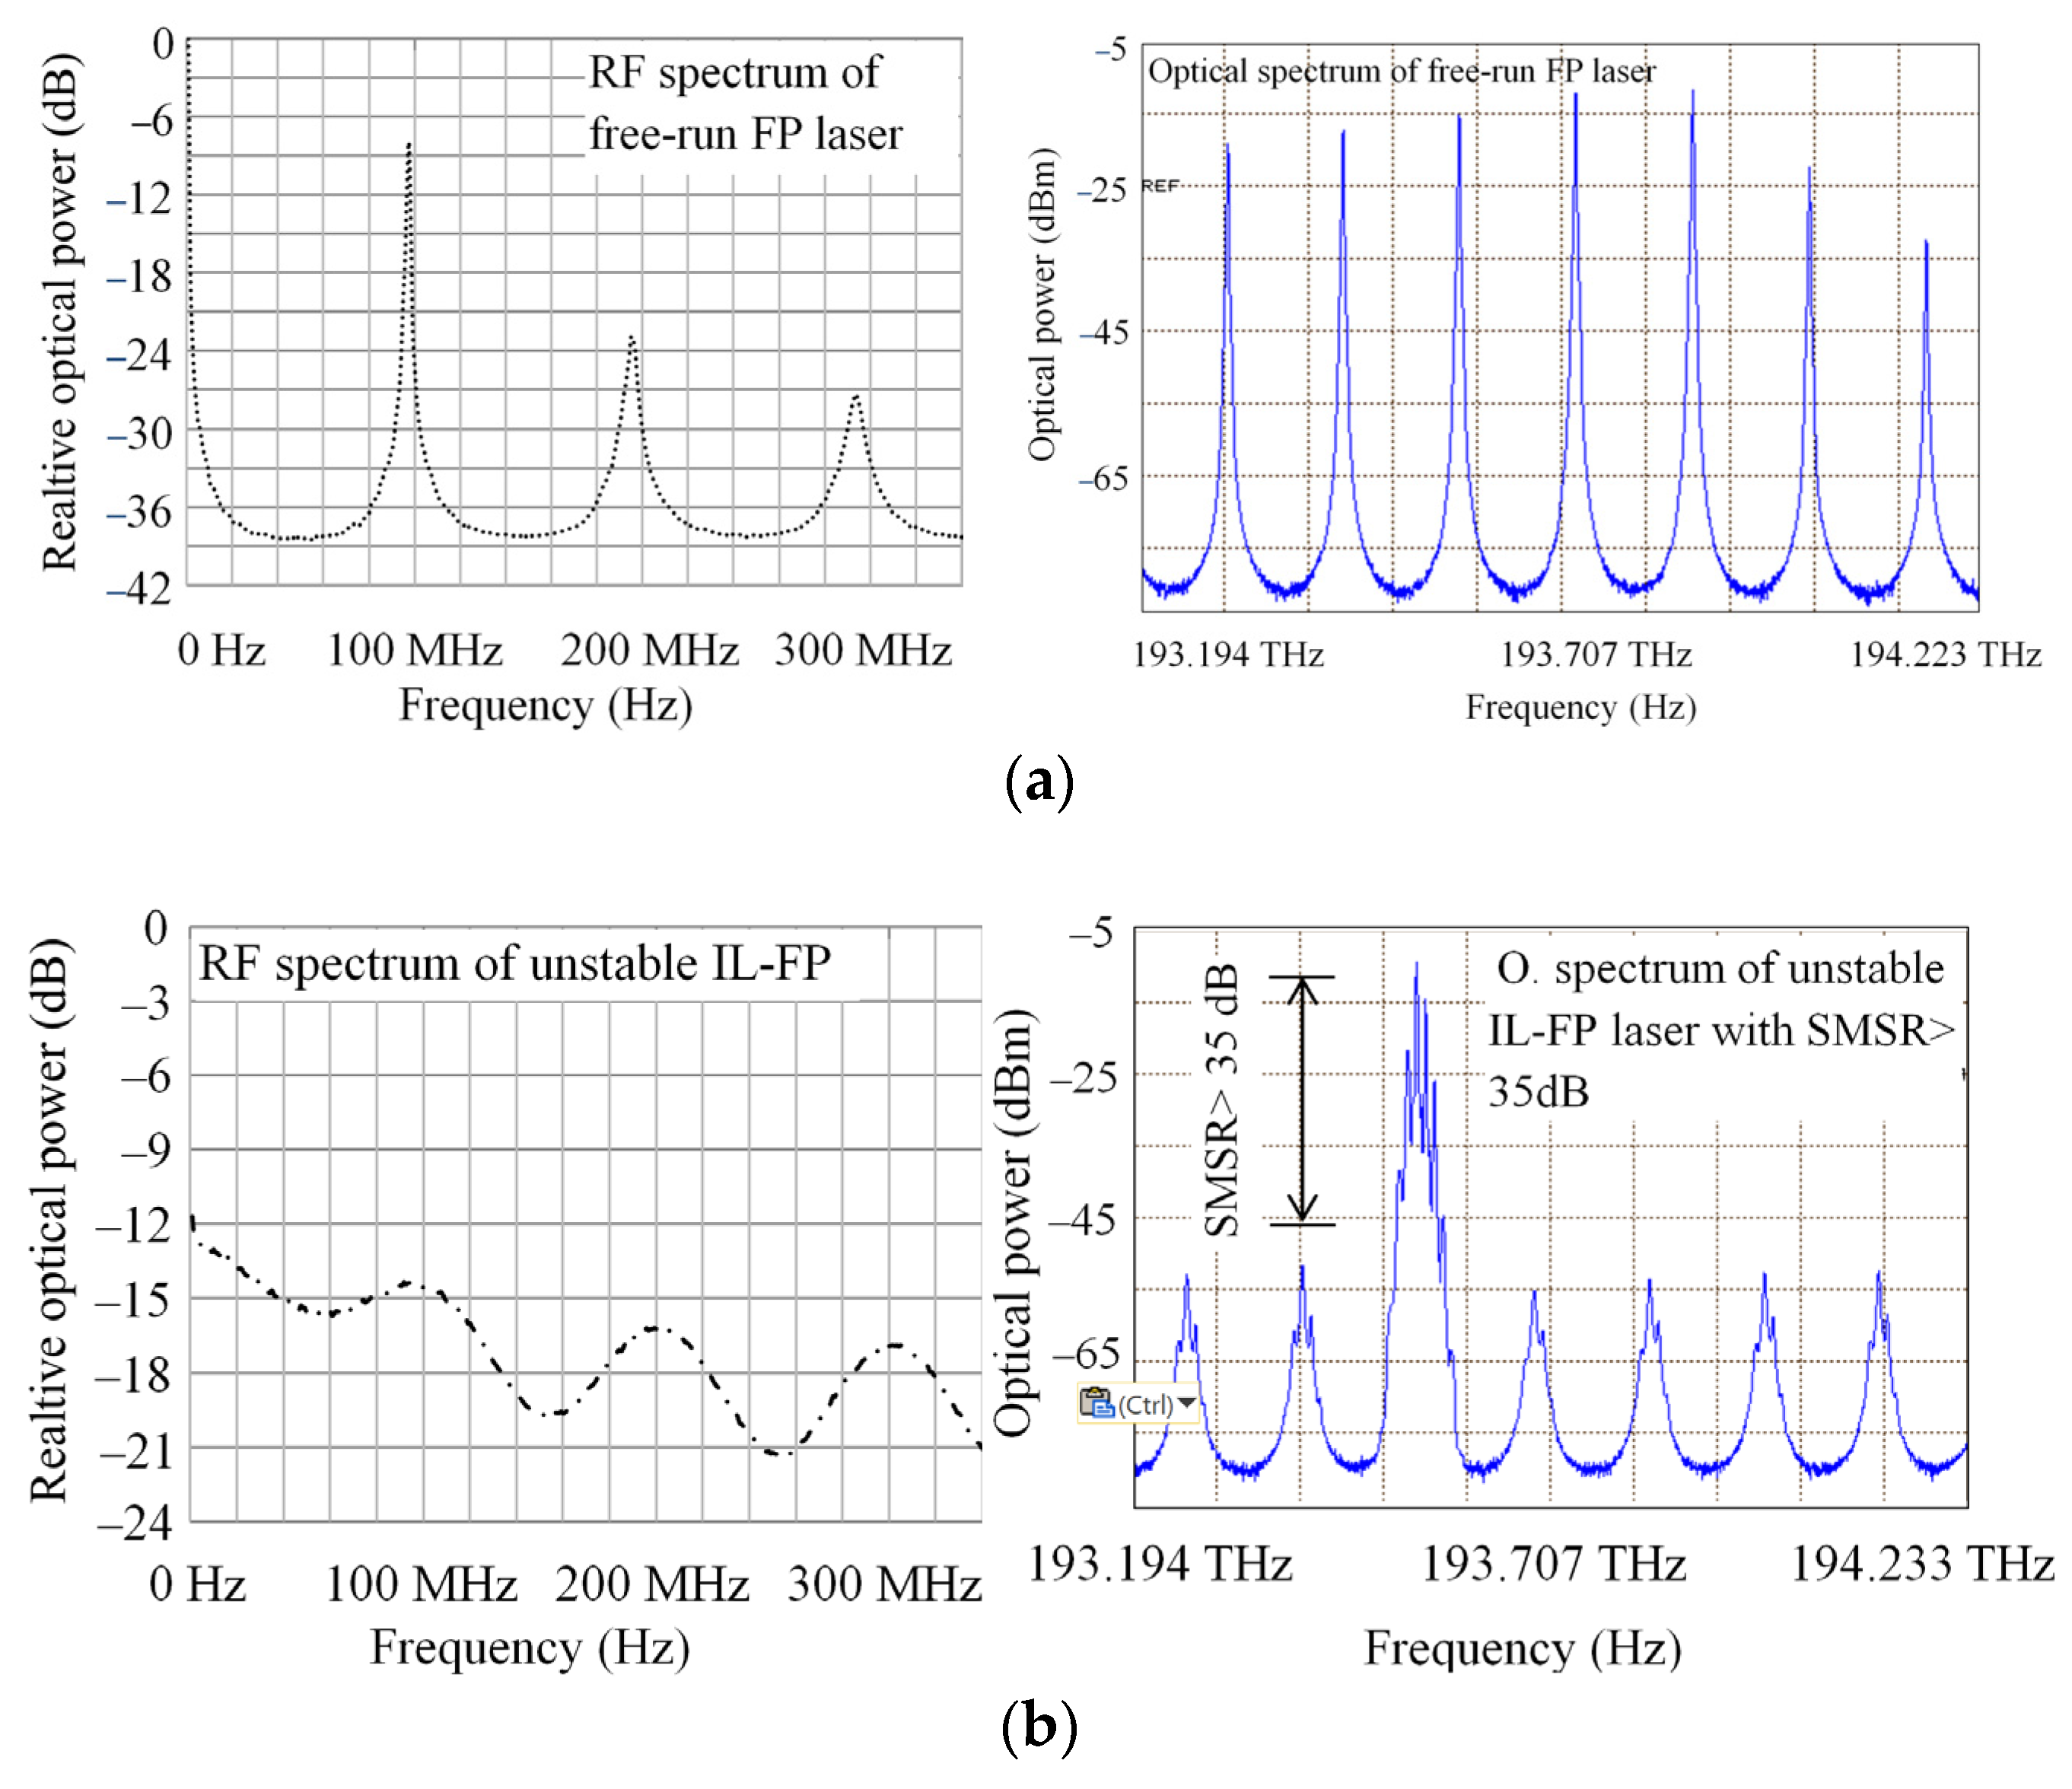
Figure 9, we present the measurements of three stages. In
Figure 9a we see the observed RF components in the electrical spectrum and the corresponding optical spectrum, in which we see a typical multilongitudinal mode spectrum, for the case when the FP laser is in the free-running state.
When the injection-locking procedure starts, the suppression of the RF component in the RF spectrum is clear and, at the same time, in the optical spectrum the suppression of the modes that are not locked. The most important phenomenon is shown in
Figure 9b. If we observe the SMSR, we can see that the SMSR is above 35 dB, which falsely indicates stability locking, according to conventional criteria. However, if we look closely, we find that it is not a clean single laser mode, but a secondary peak near the main peak. When the injection-locked FP laser is in the unstable region due to undamped relaxation oscillations, we see a side peak near the main peak in the optical spectrum corresponding to the RF frequency. These instabilities were also studied in their analytical form by Morgnesen et al. [
39], where their origin is attributed to the linewidth-enhancement factor α. It is fundamental to emphasize that for the above-mentioned condition of the optical spectrum in the corresponding RF spectrum, the RF components are still present. This condition in the RF spectrum correctly indicates the unstable state of the locked FP laser.
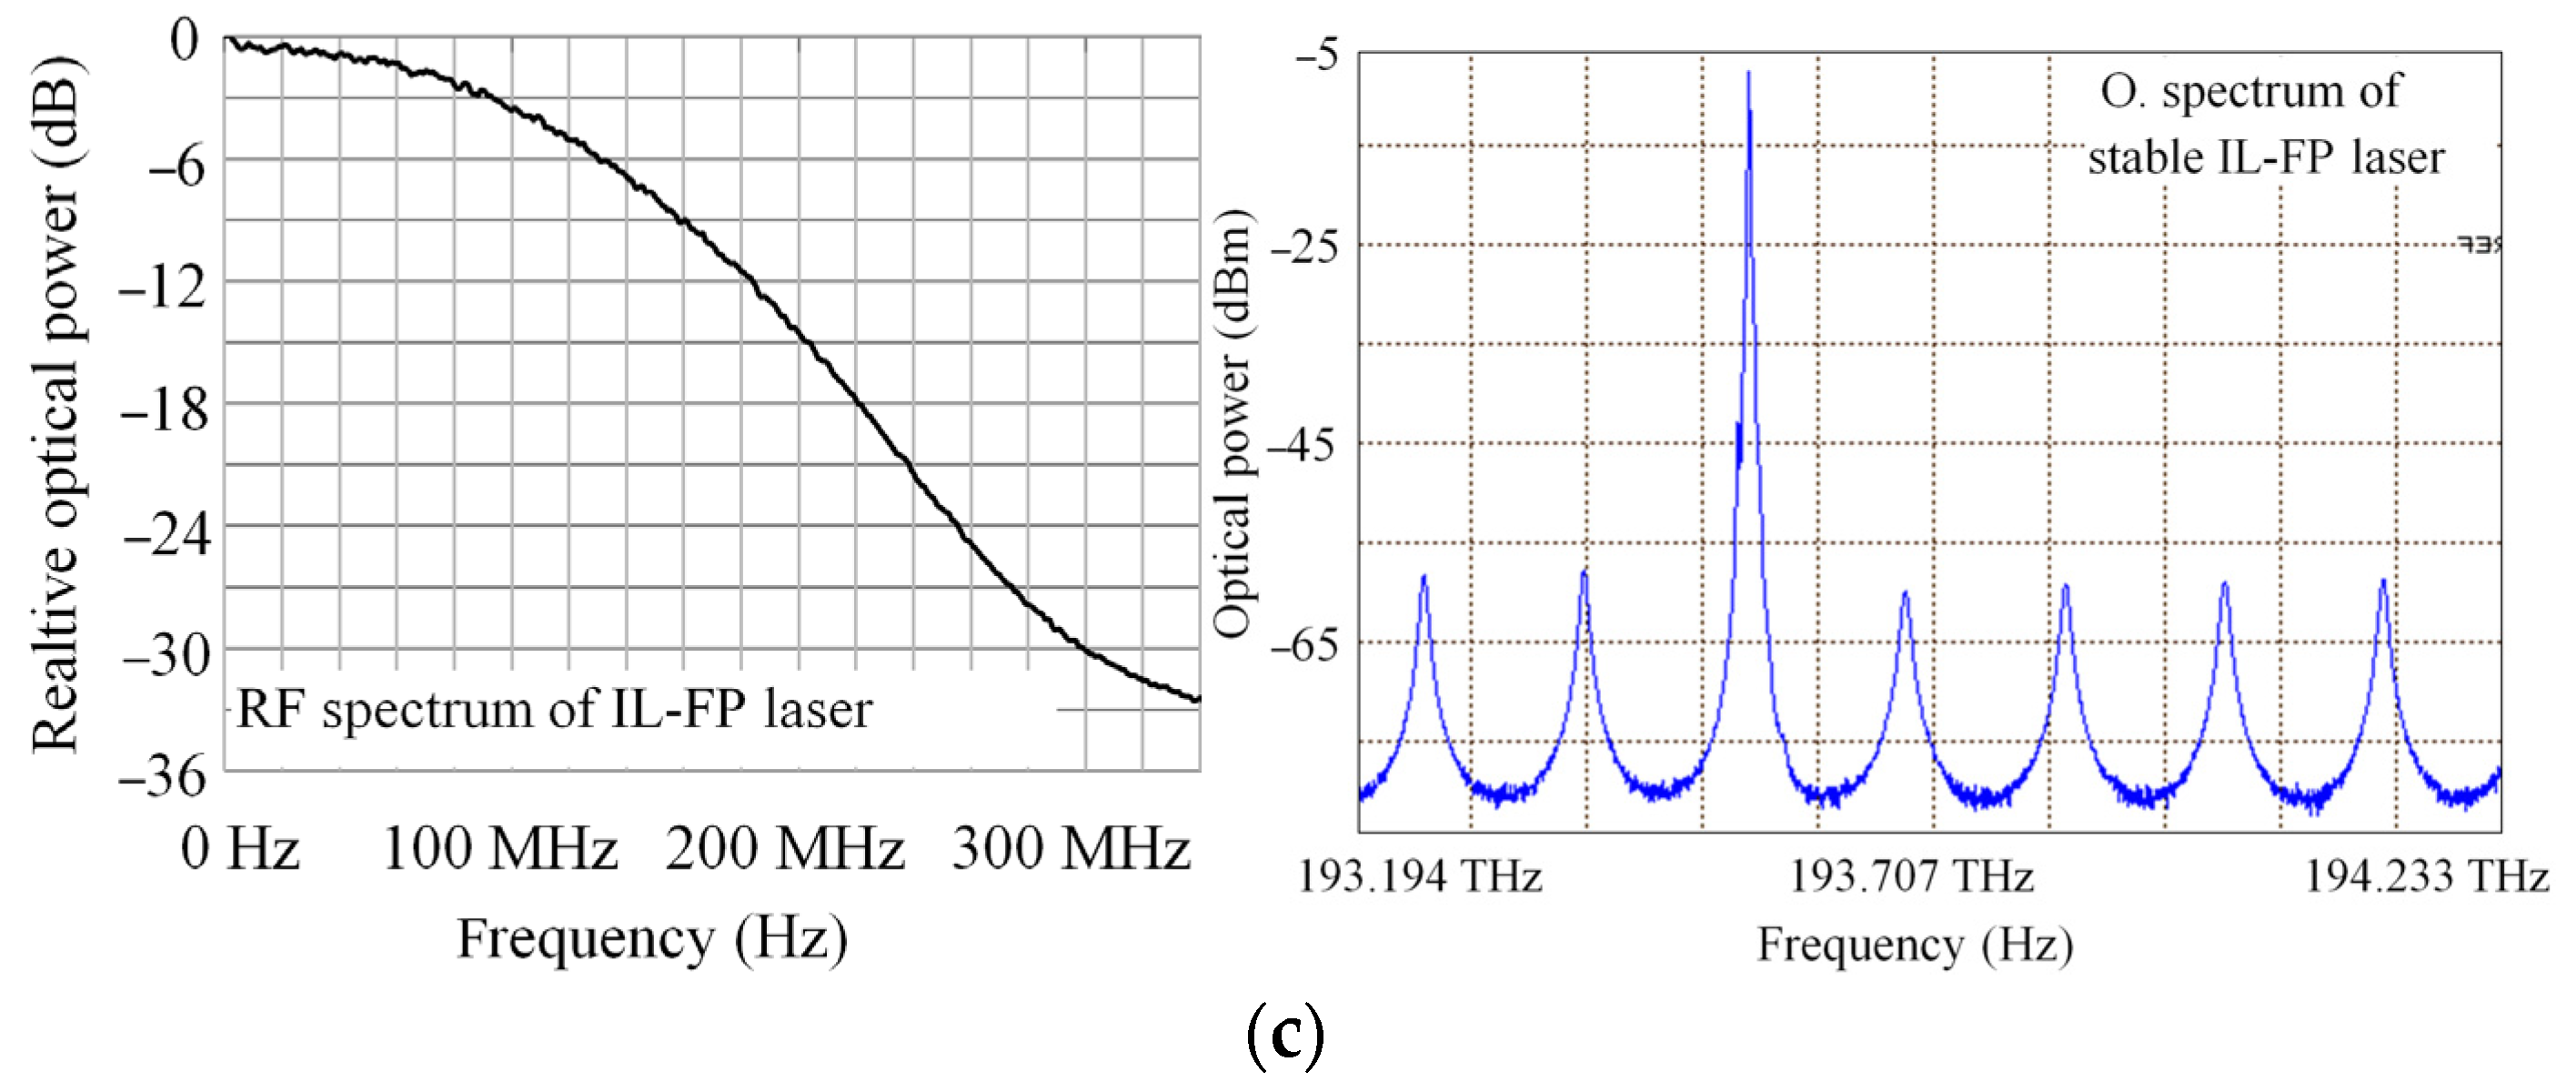
If we reduce the frequency detuning, the results of which can be seen in
Figure 9c, we achieve a stable-locking range. This condition is seen in both the optical spectrum and the RF spectrum. The optical spectrum in
Figure 9c helps to better understand the difference between the stable-locking region and the unstable-locking region in
Figure 9b. The highlighted fact underlines the main contribution of our research, i.e., that when looking at the RF spectrum in the stable IL condition of the FP laser in
Figure 9c, the RF components completely disappear, which is not the case in (a) and (b), indicating the stability of the locking laser.
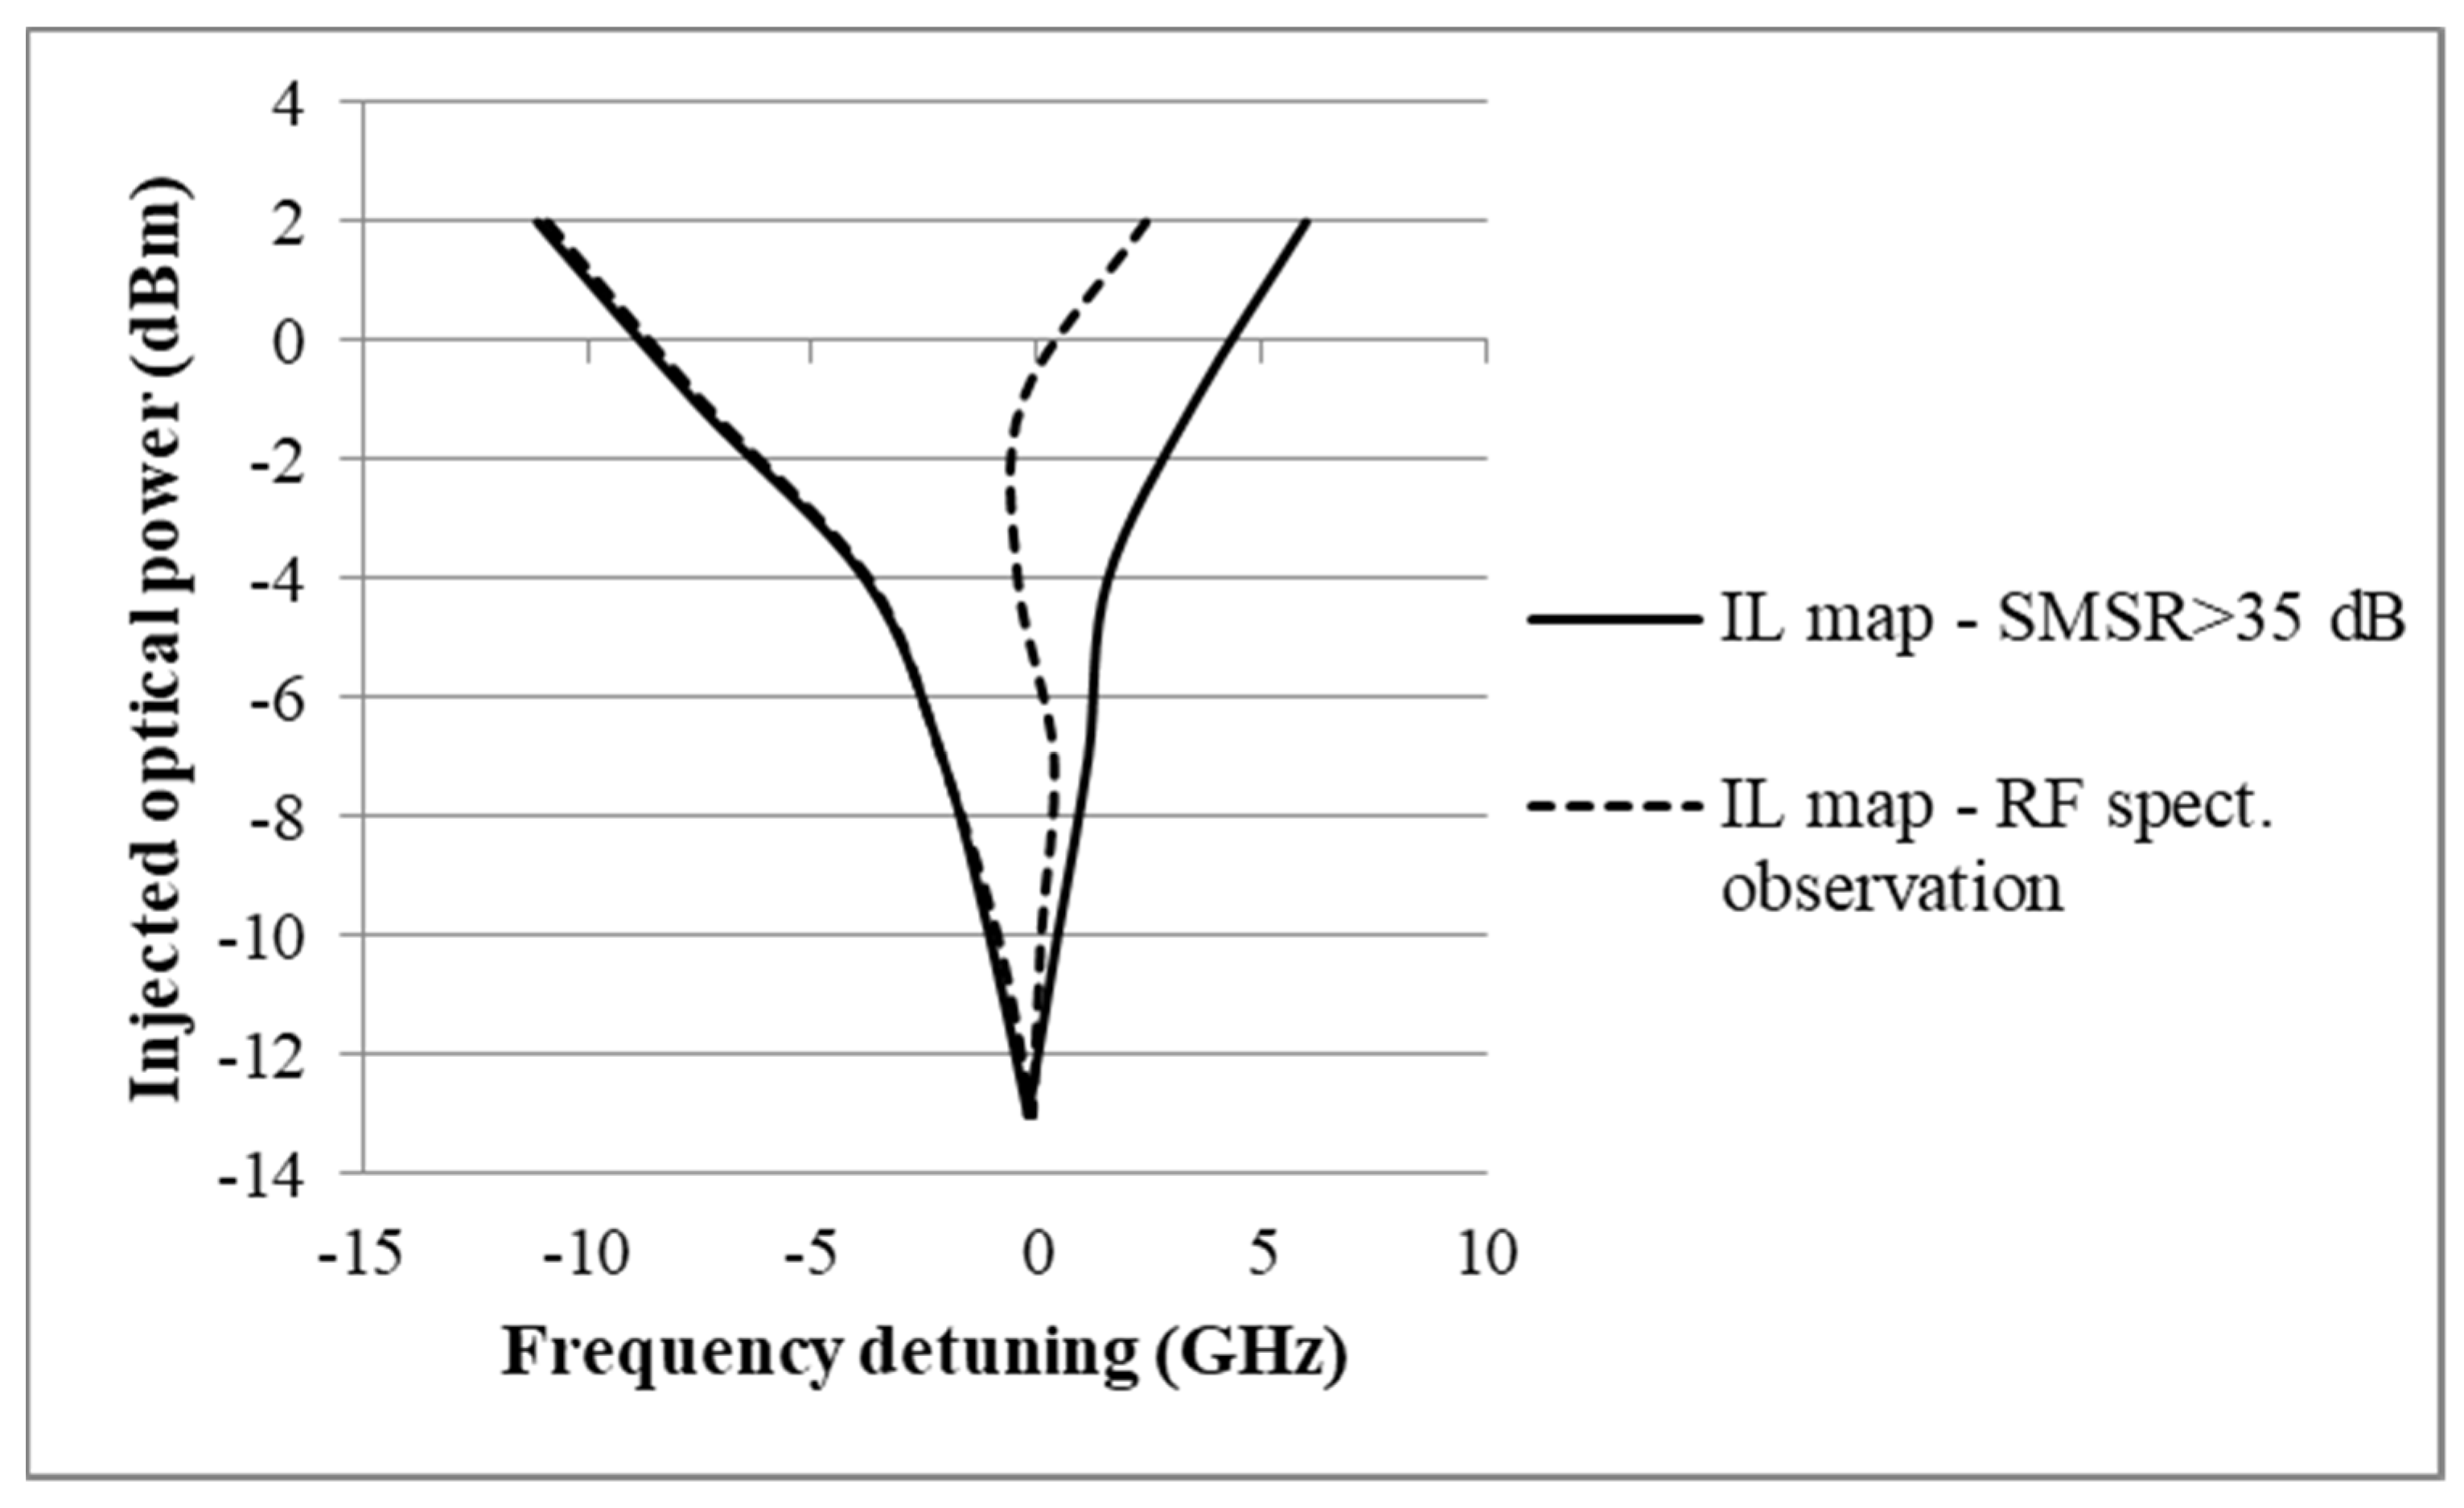
To validate the proposed technique, we performed measurements to plot a complete stable-locking map of the injection-locked FP laser by observing the suppression of the RF components and comparing it with the locking map shown in
Figure 6, where the optical SMSR criterion is used. In
Figure 10, the map of stable locking measured by observing the RF component in the electric spectrum is shown with dashed lines, and a solid line is used to show the map of locking when the optical SMSR criteria are met. In the negative part of the frequency detuning, the locking limits corresponding to the low frequency of the locking map show similar results. In this frequency range, the transition from unlocked to locked state is instantaneous, which is experimentally confirmed by both applied methods to determine the stable-locking range.
8. Conclusions
In this paper, we show that the IL condition can be observed and the stable-locking region for an injection-locked FP laser can be determined from the RF spectrum using the delayed-self-homodyne technique and an FP laser with an external cavity. Using the delayed self-homodyne technique, we were able to observe the phenomenon of linewidth transfer during the IL process. After analyzing the linewidth, we concluded that the widely used condition of an SMSR greater than 35 dB is a necessary but not sufficient condition for the stability of a FP laser. As shown by the results for positive frequency detuning, the linewidth was not fully transmitted at an SMSR of 35 dB for certain values of the frequency detuning.
By utilizing this microwave photonics method, the injection-locking information can be monitored without an optical spectrum analyzer, which can provide another type of monitoring the FP laser injection-locking region in the future.
As future work, we propose to replace the RF spectrum analyzer with a RF power detector and an electrical bandpass filter at the central frequency determined by the external cavity, i.e., 100 MHz. Such a solution decreases the impact of the laser mode partition noise and avoids the use of an optical or electrical spectrum analyzer to detect the stable state of the injection lock in the FP laser.


