1. Introduction
Milk is one of the best and easiest sources of calcium that we can consume through our daily diet [
1]. Milk can be obtained from various sources such as animals, humans and plants. People normally consume milk from cows, but milk also can be obtained from other animals such as goats and camels. Due to lactose intolerance, plant-based nondairy milk can be consumed as an alternative to cow’s milk. Almond milk, coconut milk, soy milk and rice milk are examples of plant-based milk that are produced as an alternative to cow’s milk. Besides that, humans also can produce milk, which is normally given to newborn babies. Milk content such as fat, carbohydrate and protein can affect the consumers’ healthy diet. Thus, the study of the properties of milk is important to determine milk quality.
Milk can be studied using chemical reaction, biosensing, spectroscopy and optical methods. A random laser is one of the optical methods that can be used as a light source for imaging and sensing applications. It operates based on multiple light scattering and optical gain instead of a cavity [
2]. Multiple light scattering and optical gain provide feedback and light amplification, respectively, where particles scatter the light and the light is confined and amplified by stimulated emission [
3]. The characteristics or properties of a random laser are lasing threshold, spectral narrowing, multiple emission peaks and polarization [
4]. The lasing threshold is reached when the energy transition is saturated, and the emission linewidth reduces nonlinearly with the increase of pump energy. When the system reaches the lasing threshold, the multiple emission peaks appear on top of the fluorescence background [
4,
5]. Lasing also can be achieved as spectral and temporal random variations of a signal [
6]. A random laser can be modeled based on light propagation theory.
Light propagation theory is used in many studies on milk quality involving spectrometry and optical fibers. Light propagation consists of light transmission, absorption, scattering and diffraction. The absorption of light is defined as the process of particles absorbing their light and converting it into energy. On the contrary, the transmission of light refers to the ability of light to pass through a material without being absorbed or scattered [
7]. Veenstra et al. [
8] studied the scattering properties of human milk experimentally and numerically whereas Kokotou et al. [
9] developed a method through liquid chromatography–high-resolution mass spectrometry to determine the free fatty acids in milk. This theory also has been applied in apple tissues to investigate the function of apple skin in the light propagation through its flesh [
10]. Research methods based on light propagation are convenient and non-intrusive as the methods do not affect or destroy the samples [
11]. Previous analysis of milk employed spectroscopy [
12], machine learning [
13] and chemical reactions [
14]. Abohassan et al. [
15] designed a photonic crystal sensor to detect the fat volume in milk, and Frizzarin et al. [
13] used statistical machine learning methods to predict the cow’s milk quality. However, the previous methods were complicated and applied to cow’s milk using a limited wavelength range.
Here, we analyzed milk from different sources such as fresh milk, almond milk, oat milk and soy milk using light propagation measurements and random-laser properties. This research continued our previous studies on the optical properties of cow’s milk using spectrometry [
16] and milk fermentation [
17]. This study consisted of two parts: spectrometry experiments and modeling. Results of visible and near-IR spectrometry experiments were analyzed using multivariate analysis. A random laser for various milk samples was modeled based on light propagation theory using MATLAB software. The aim of this study was to differentiate the characteristics of milk from animal, plant and human sources. We found that animal-based milk produces higher fluorescence than other resources and soy milk has the highest absorbance among all samples. The absorbance and fluorescence spectra for each milk are different due to different fat content of the samples. We measured the absorbance and fluorescence of various milk samples in the wavelength range 350 nm to 1650 nm. We also conducted statistical analysis using principal component analysis (PCA) to analyze the reliability and the validity of the absorbance and fluorescence data. Here, the experimental and statistical studies were comprehensive, convenient and non-intrusive. The analysis of milk was continued using the modeling approach on random lasers. The purpose of the modeling approach was to study the effects of fat content in milk on properties of random lasers, and we observed that higher fat content in milk can produce a lower lasing threshold. Multiple emission peaks appear when the lasing threshold is achieved. Dye concentration and pump energy also affect the properties of random lasers besides fat content.
2. Theoretical Study
Analysis of fat content in milk was conducted using a theoretical study of light propagation where random lasers were modeled using almond milk, fresh milk, oat milk and soy milk. The modeling technique was designed to investigate random lasing properties such as lasing threshold reduction and multiple emission peaks. The modeling technique was completed using equations as below.
Step 1: Setting up modeling parameters
The initial pump wavelength was set at 532 nm. The scatterer density,
, of each milk was calculated through the weight of fat in each milk as shown in Equations (1) and (2). The scattering cross section was determined based on Equations (3) and (4) [
18].
where diameter
D = 930 nm [
18].
The scatterer density was varied according to the fat content in each type of milk, and the concentration of dye was varied from 0.001 to 0.1 M by increasing the pump intensities from 10 mJ to 100 mJ.
Step 2: Inserting reference spectra
The reference spectrum (fluorescence of Rhodamine 6G) was inserted into the system.
Step 3: Photon loop
Photon loop starts by determining the direction of travel which is picked randomly from a uniform distribution over 4π steradians. The photons will travel at distance
l before being scattered. The distance
l was calculated based on Equation (5) [
19].
where ∑ is a uniform variate
. The scattering mean free path, defined as the average distance the light scatters in the medium between two scattering events, was calculated based on Equation (6) [
20].
The represents scatterer density whereas is the scattering cross section of the particles.
Step 4: Multiple light scattering for feedback mechanism
Light scattering in the simulation is assumed in the isotropic condition as in Equation (7) with the azimuthal angles
uniformly distributed over the range of 0 to 2π radians in Equation (8).
The light scattering was detected and calculated by the Henyey–Greenstein scattering function as in Equation (9) [
21,
22].
where
the mean cosine of scattering angle.
Step 5: Light amplification within photon loop
Photon was amplified when the dye was excited by a pump source. Gain value was obtained from Equations (10) and (11), assuming all dye molecules were excited.
where N
dye is the dye concentration whereas L is the path length.
Step 6: Intensity detection
The amplified photon from the scattering loop was detected and calculated for each type of milk.
3. Methodology
The study was conducted based on two parts: spectrometry experiments and theoretical analysis. The spectrometry experiments were conducted using VIS-NIR spectrometer and NIR spectrometer where the results of the experiment were shown in OceanView software and analyzed using multivariate analysis. For the theoretical part, random lasers for various milk samples were modeled using MATLAB software.
The investigation of light propagation in milk was conducted to observe the absorbance and fluorescence of light through the respective wavelength. Protein, carbohydrates and fat in milk can influence the absorbance and fluorescence of light in milk.
3.1. Milk Samples
Light propagation in milk from animal, plant and human sources was investigated. Seven types of milk were used in the spectrometry experiments. Almond milk, fresh milk, oat milk and soy milk were obtained from the same brand, Farm Fresh. Meanwhile, the goat milk, human breast milk sample 1 and human breast milk sample 2 were obtained pure from the source without alteration. The composition of almond milk, fresh milk, oat milk and soy milk are listed in
Table 1.
3.2. Sample Preparations and Measurements
Samples used for the spectrometry experiment were diluted with ratio of 1:100 with distilled water. The samples were diluted to allow only a significant amount of light to pass through the solution to prevent spectrum saturation. Milk prevents the light to pass through because it is an opaque and concentrated solution. The diluted samples were shaken lightly before being added to a cuvette, taking precautions to eliminate air bubbles. The air bubbles can affect light propagation where light can be diffracted once it hits the air bubbles [
23].
3.3. Experimental Set-Up
Two compact spectrometers were used to measure light propagation in milk: Ocean Optics Flame Near-Infrared (NIR) spectrometer and visible-NIR spectrometer. The VIS-NIR spectrometer was used to measure the wavelength range of 350 nm to 1000 nm whereas the NIR spectrometer was used for wavelength range of 950 nm to 1650 nm. The spectra were recorded 10 to 15 times for each diluted sample. The experimental set-up was similar to our previous method [
17]. The experiment was conducted by placing the diluted milk samples into a cuvette. Light from a tungsten halogen light passed through the samples, and the spectrometer collected the emission light. Then, the emission spectra were shown using Ocean Optics software. The experiments were repeated 10 to 15 times for each sample to observe the stability and reliability of the results.
3.4. Random Lasers Based on Theoretical Study
We modeled a random laser to analyze milk based on fat content. Four types of milk from
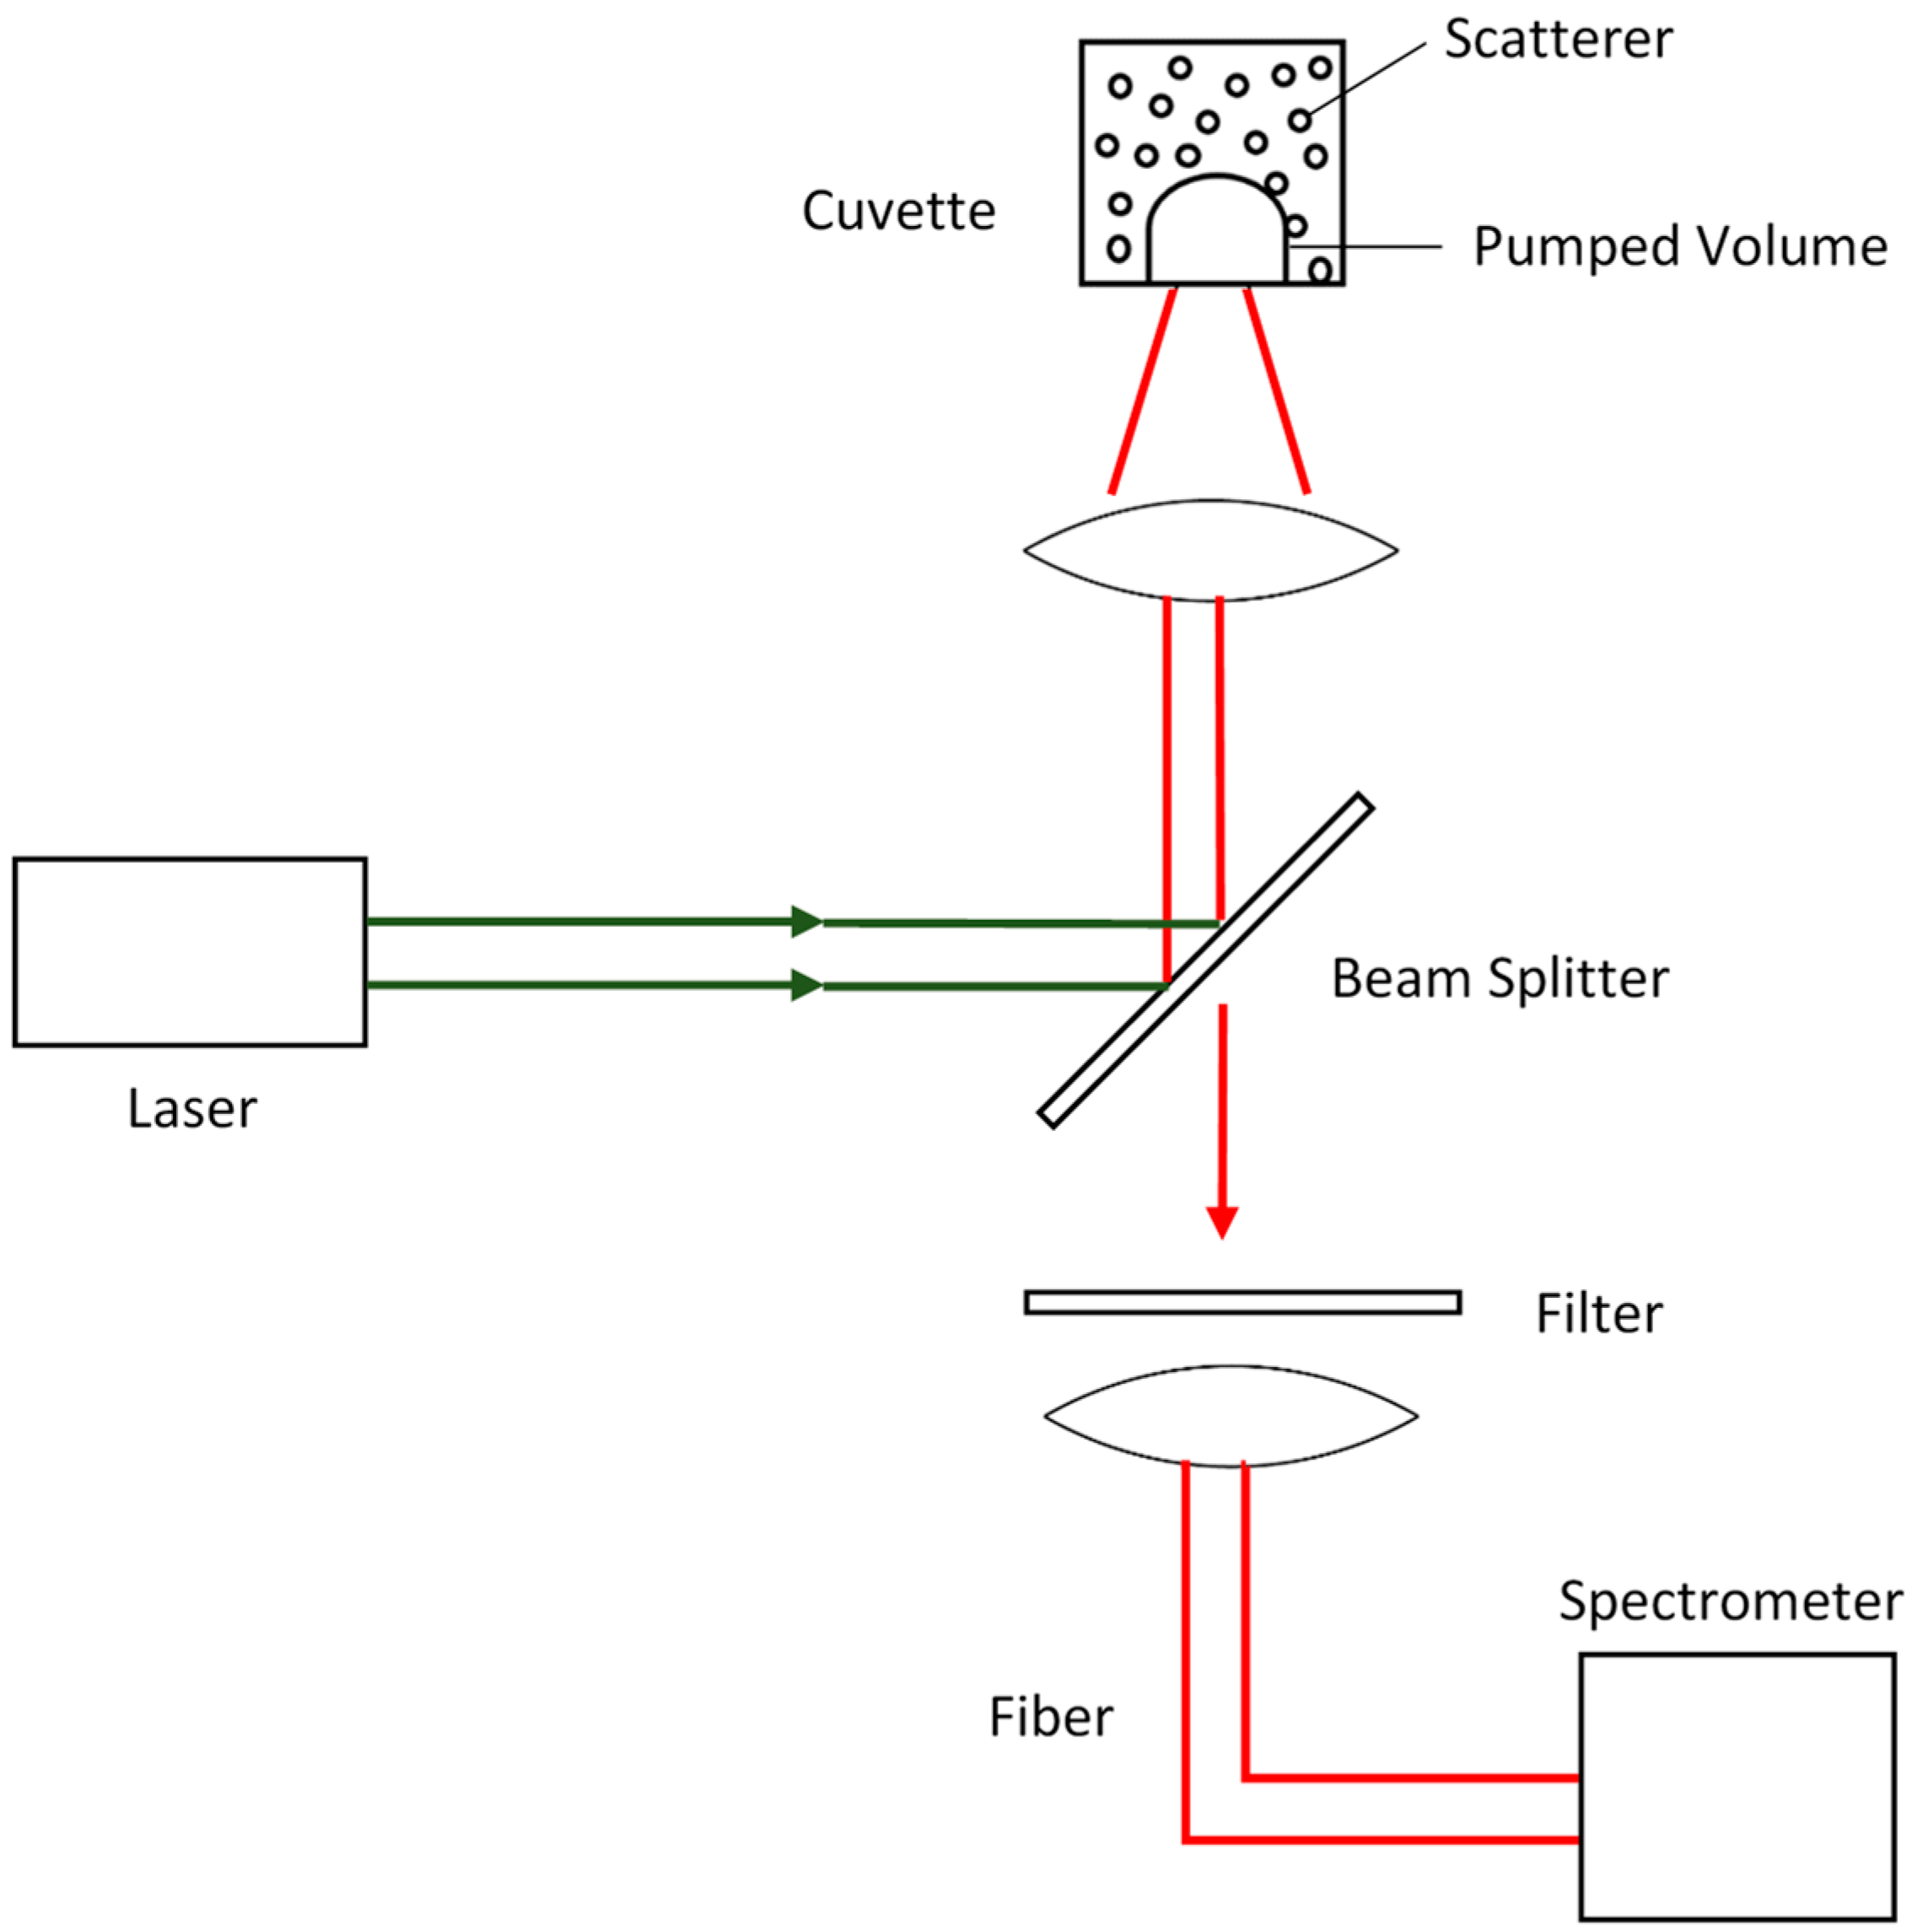
Table 1 were used in the modeling where the fat content was stated on the milk box. The objective of the modeling technique was to complement the experimental results to analyze the fat content in milk. The modeling was performed based on optical layout of random lasers, shown in
Figure 1. Laser (532 nm) was used to excite the sample, which consisted of milk and dye (Rhodamine 6G) as a gain medium. Fat content in milk can provide multiple light scattering for feedback mechanism. Equations (1)–(9) in
Section 2 (Theoretical Study) were used to estimate the multiple light scattering in the sample. The scattered light was amplified based on Equations (10) and (11), and the emission light was finally detected by a spectrometer.
4. Results and Discussion
We studied the properties of milk from animal, human and plant sources such as almond milk, fresh milk, oat milk, soy milk, goat milk and human breast milk. The study was performed based on experimental and theoretical analysis. NIR and VIS-NIR spectrometers were used to study the optical properties of milk by observing the light absorbance and fluorescence of the samples. The statistical analysis was carried out using principal component analysis (PCA) to analyze and evaluate the reliability of the experimental result. Meanwhile, light propagation was used to model random lasers for different types of milk. The features such as threshold reduction and multiple emission peaks were analyzed based on fat content, dye concentration and pump energy. Results from both experimental and modeling approaches were analyzed and discussed systematically. From our observation, we suppose that light absorption, fluorescence and random-laser properties can be used to differentiate milk from animal, plant and human sources.
4.1. Experimental Results
NIR and VIS-NIR spectrometers can measure emission spectra of milk samples from 950 nm to 1650 nm and 350 nm to 1000 nm, respectively. The absorbance and fluorescence spectra of different types of milk were observed using OceanView software. The samples used were almond milk, fresh milk, oat milk, goat milk and human breast milk.
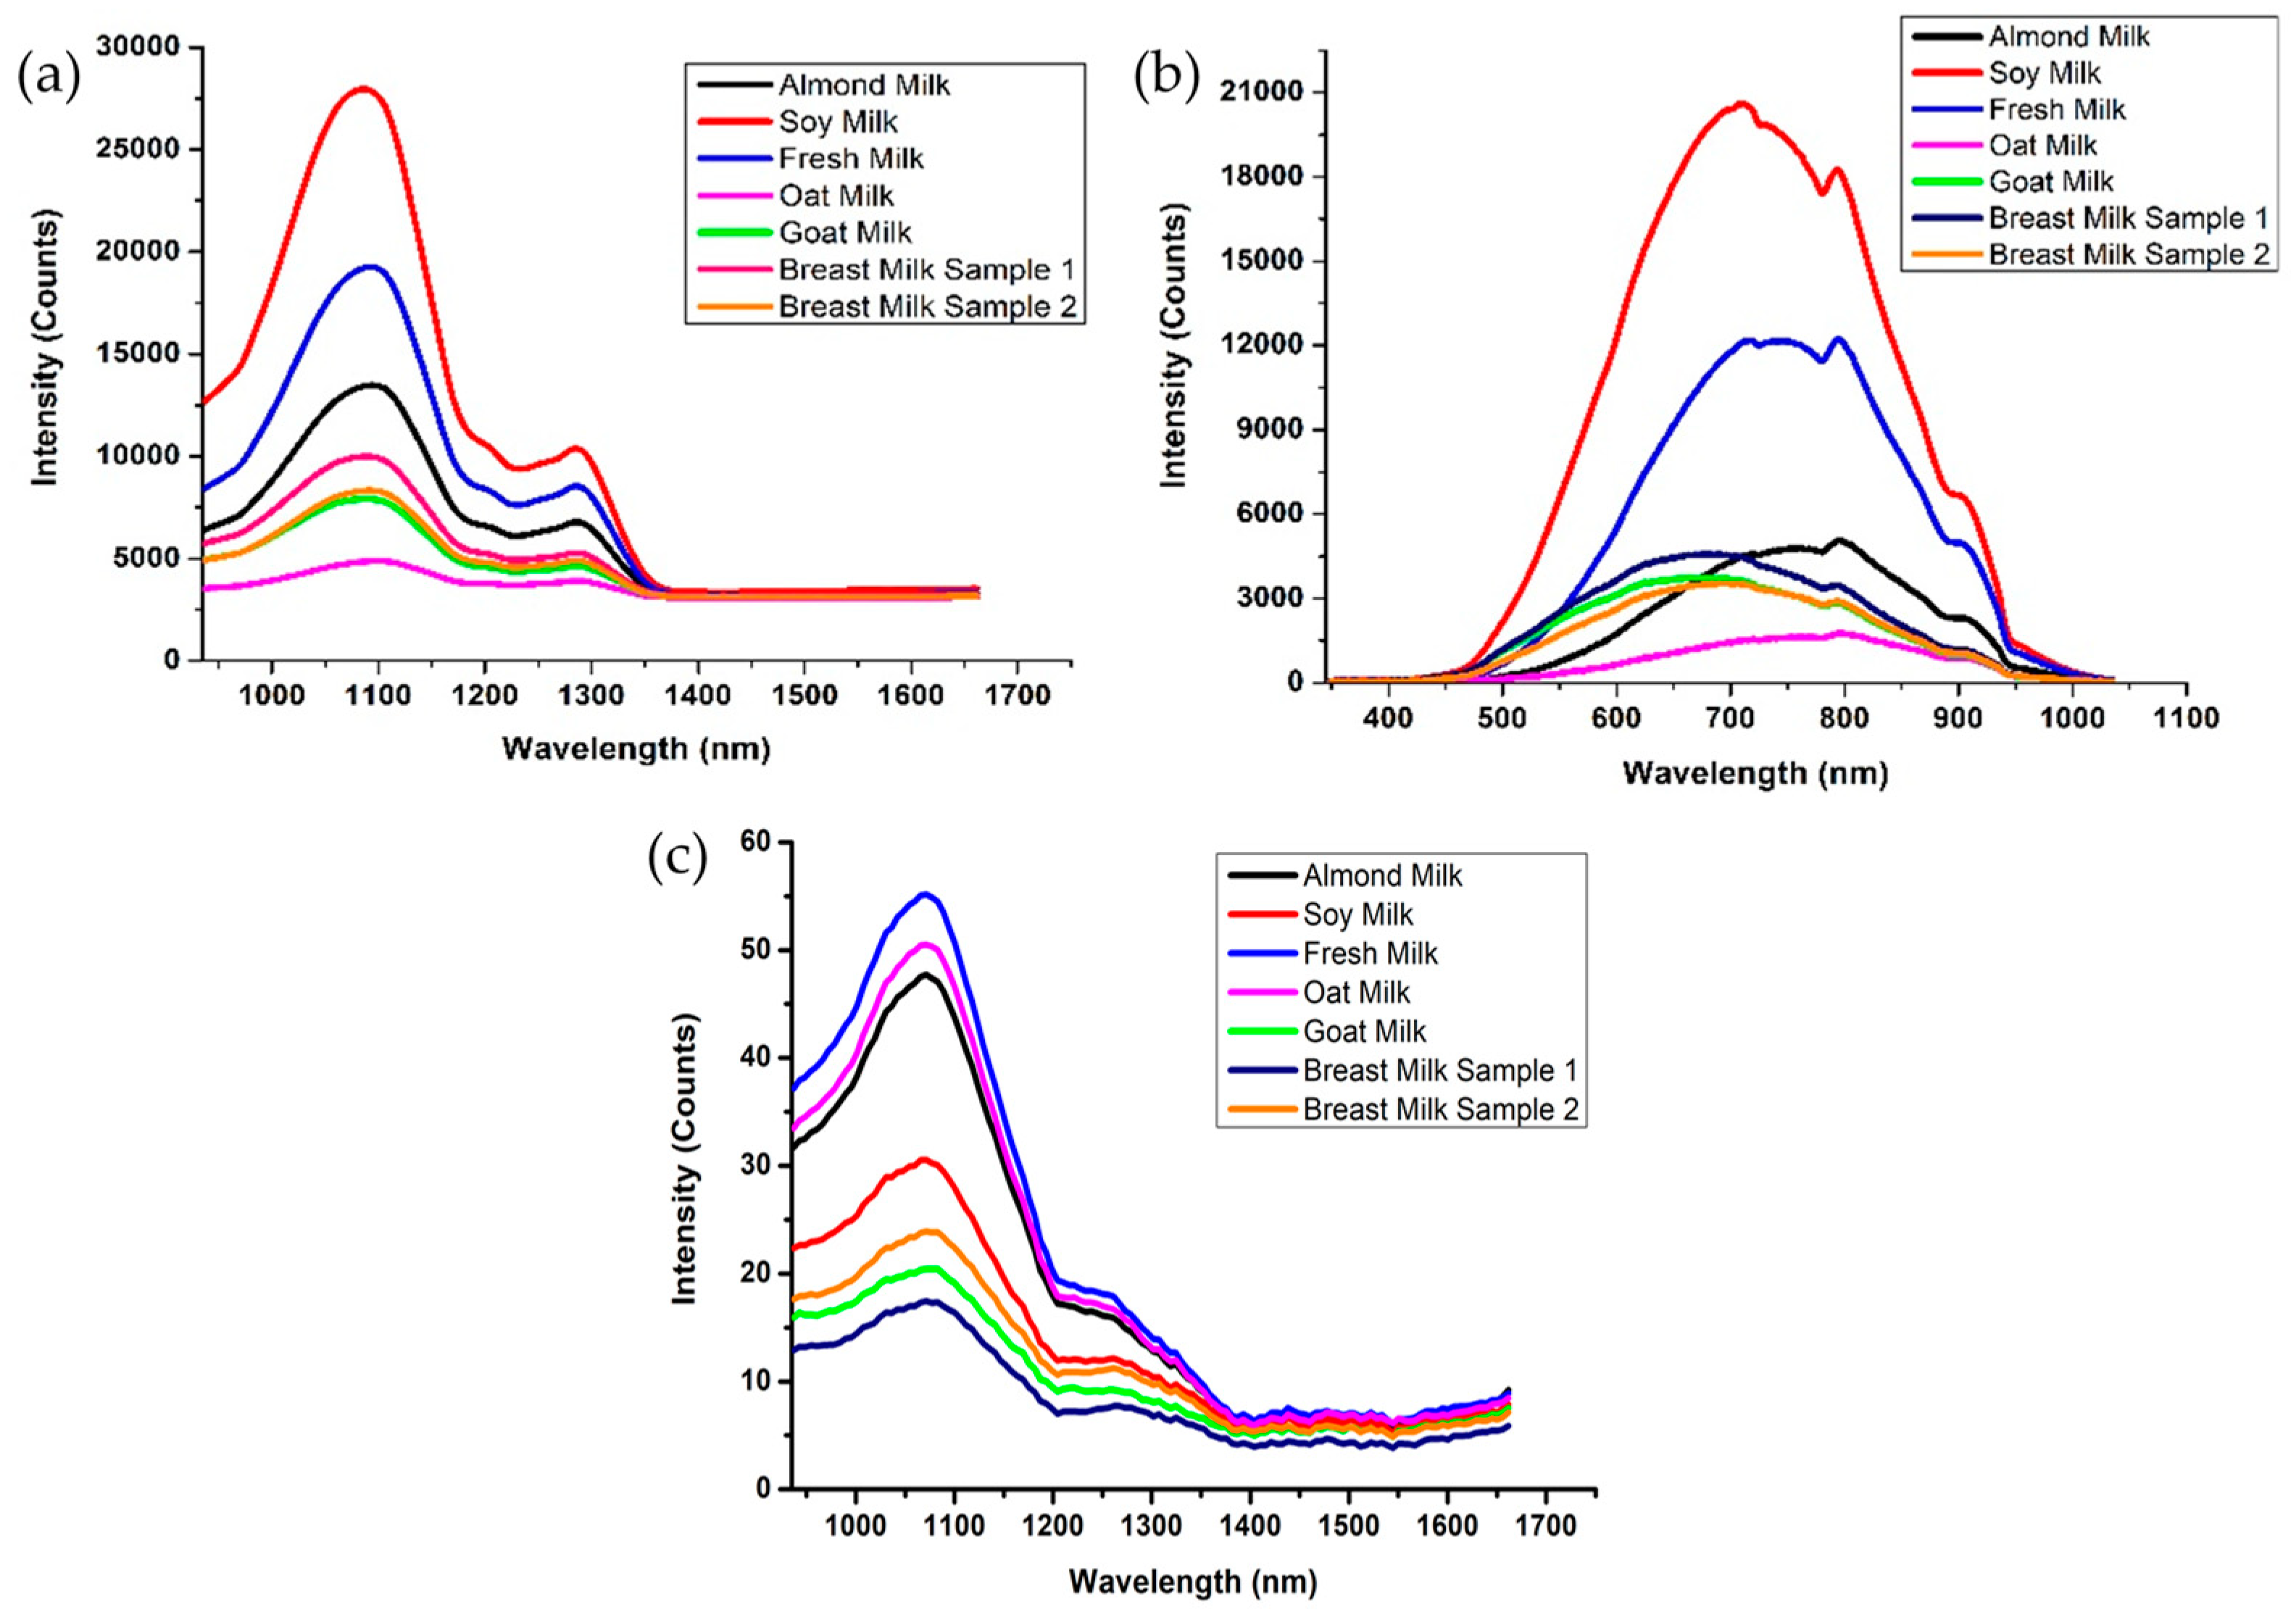
Figure 2 shows the absorbance and fluorescence spectra of various types of milk measured by both NIR and VIS-NIR spectrometers.
Figure 2a,b show the absorbance spectra of various milk samples measured by NIR and VIS-NIR spectrometers, respectively. It is clearly shown that soy milk has the highest absorbance spectra compared to other samples. It is attributed to the high amount of protein, fat and carbohydrate in the soy milk, as shown in
Table 1. The soybean seed itself consists of lots of proteins and carbohydrates compared to raw cow’s milk [
24]. Fresh milk shows the second-highest absorbance due to a high amount of fat, protein and carbohydrate as well. The thicker consistency of soy milk than fresh milk is one of the factors that affects light absorption.
Figure 2b shows that the absorption peak of fresh milk (750 nm) is slightly different from the absorption peak of soy milk (700 nm). Meanwhile, human breast milk (sample 2) has the lowest absorbance spectra as the sample is quite transparent and less dense compared to others. The intensity of absorbance spectra only reaches 4500 and 2800 through NIR and VIS-NIR spectrometers, respectively. The results clearly show that milk contents can affect light propagation.
Figure 2c shows the fluorescence spectra of various types of milk using NIR spectrometers. The fluorescence spectra show that fresh milk has the highest emission intensity compared to other milk samples. This is because fluorescence emission can be affected by the amount of fat content, and fresh milk contains the highest fat content compared to other milk [
25]. The fluorescence peaks for all samples are from 1000 to 1100 nm, depicting that milk may have ingredients that can emit light within the wavelength range. More comprehensive characterization studies should be conducted to identify any milk contents that can emit light. Besides that, the light source can be changed to lasers instead of tungsten halogen light that is currently used in the experimental set-up.
Recent studies have discussed the properties of milk such as developing a hand-held susceptible fiber optic milk-fat sensor using U-bent plastic optical fiber (POF) to study fat content in milk [
26], developing a fluorescence-based technique to study time-based milk degradation at room temperature and pH of milk [
27] and developing ultra high performance liquid chromatography–mass spectrometry to quantify micronutrients (B vitamins) in milk samples [
28]. All methods are complicated and consume time, money and energy. Furthermore, the methods are based on an intrusive approach which can result in less reliability of the data.
4.2. Multivariate Data Analysis
Principal component analysis (PCA) is a flexible tool used in multivariate data analysis in order to extract important information from the data and to express the information as a set of summary indices [
29]. Data obtained from the experiments were analyzed using principal component analysis to collectively observe the pattern and consistency of the data.
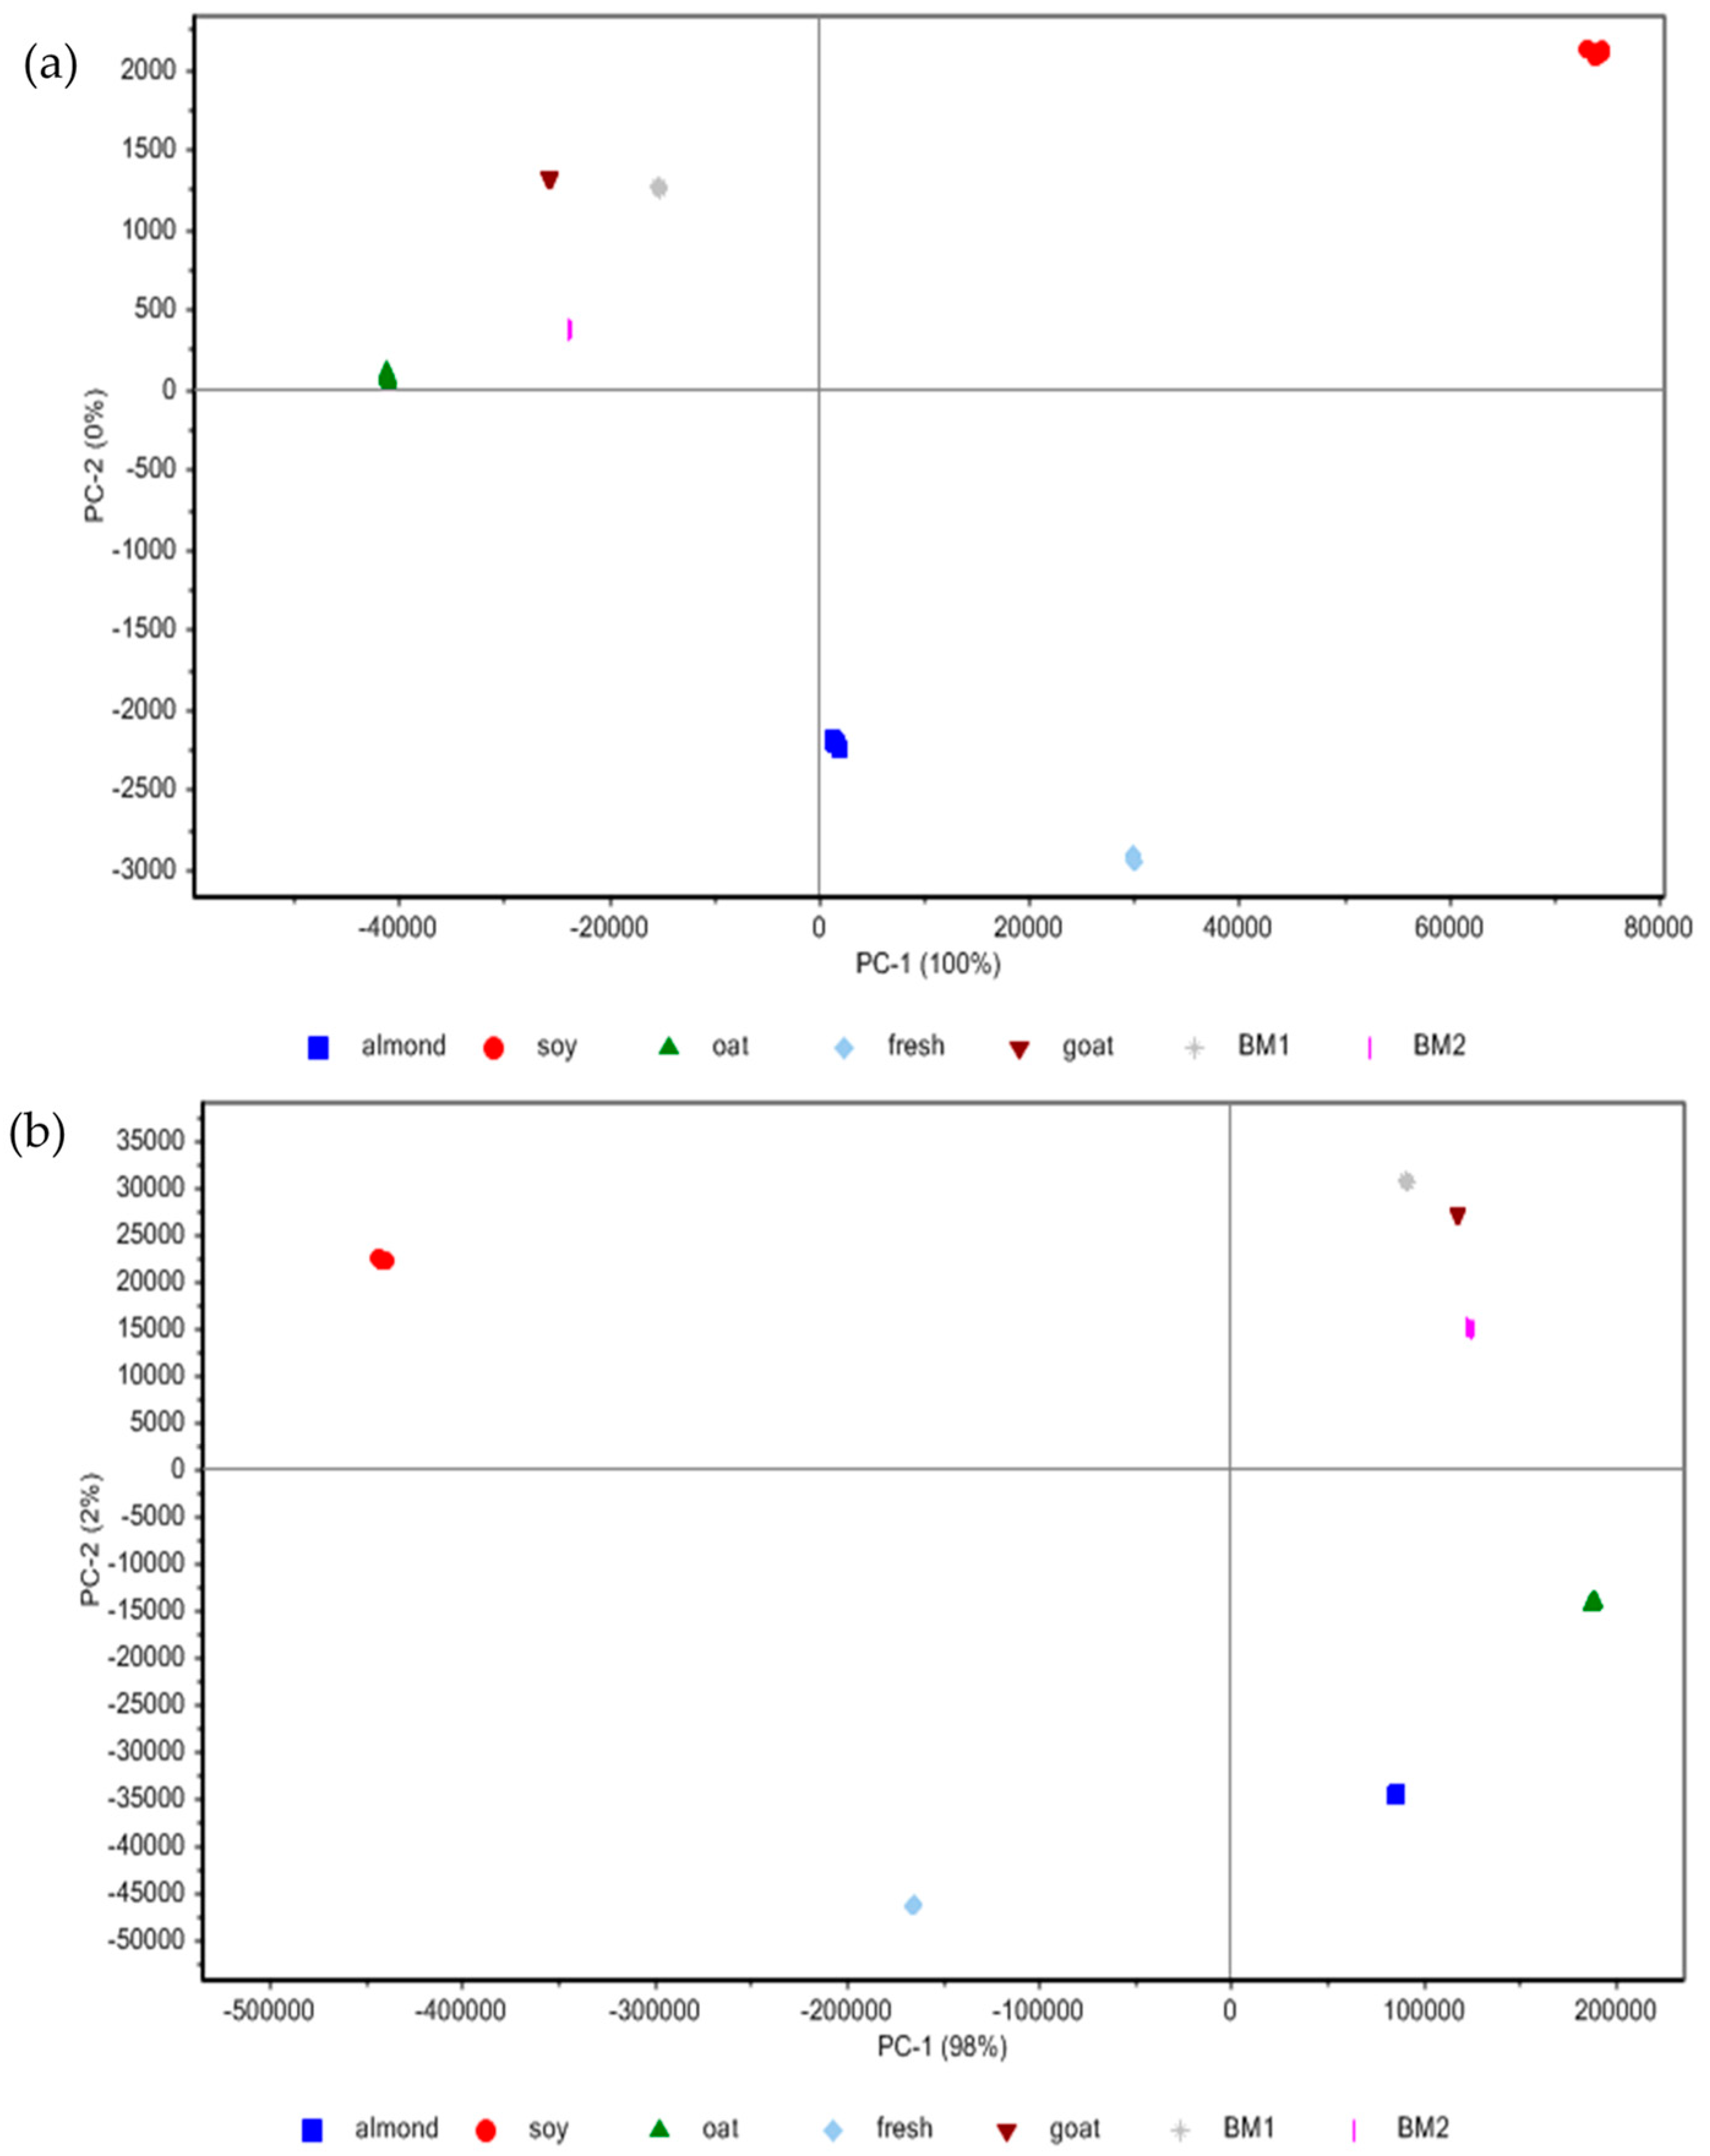
Figure 3 shows the analysis of data from the NIR spectrometer and VIS-NIR spectrometer, using principal component analysis.
Figure 3a,b show that the absorbance spectra of various types of milk, measured by both NIR and VIS-NIR spectrometers, are very consistent and precise. From the analysis, we believe that the experimental data for absorbance are reliable due to the data consistency. Meanwhile, the statistical analysis of fluorescence spectra measured using both spectrometers is shown in
Figure 4.
Figure 4a shows that the fluorescence spectra measured by the NIR spectrometer are spread out, which justifies the inconsistency of the data. Meanwhile, the fluorescence spectra measured by the VIS-NIR spectrometer are precise and consistent (
Figure 4b). Thus, it shows that the fluorescence spectra from the VIS-NIR spectrometer is more reliable compared to the NIR spectrometer. We attribute that to the high variance where a set of numbers is spread out from the average value [
30].
4.3. Theoretical Analysis Results
The aim of the theoretical analysis was to observe the effect of fat content in milk on random-laser properties which consist of multiple emission peaks and lasing threshold. The modeling was performed for four types of milk which consisted of almond milk, fresh milk, oat milk and soy milk, and the results were presented in terms of multiple emission peaks and lasing threshold. Fat content, dye concentration and pump intensities were varied, and results show that fresh milk (animal-based milk) has the lowest lasing threshold for the lowest dye concentration.
4.3.1. Multiple Emission Peaks
The appearance of multiple emission peaks is one of the random-laser properties. Multiple emission peaks will appear when the lasing threshold is achieved.
Figure 5 depicts the emission spectra of random lasers based on almond milk for below, at and above the lasing threshold for different dye concentrations.
The emission intensity increases with the increase of pump energy. There are no emission peaks observed for random lasers below the lasing threshold. By providing sufficient pump energy, multiple emission peaks appear on top of the fluorescence spectrum that indicates the lasing threshold (
Figure 5a). The lasing threshold occurs when the optical gain exceeds the losses in the gain medium. The emission peaks become significant above the lasing threshold. For the lowest dye concentration, 10
−4 M (
Figure 5c), no emission peaks appeared on top of the fluorescence spectrum when the pump energy was increased to ~50 mJ. The emission peaks only appear at the highest pump energy. It is attributed to the least amount of dye molecules to provide light amplification. Random lasers based on fresh milk, oat milk and soy milk show similar characteristics with the random laser based on almond milk where multiple emission peaks appear if the system reaches the lasing threshold.
4.3.2. Lasing Threshold
The lasing threshold can be found when there is a nonlinear decrease of emission linewidth with the increase of pump energy. The emission linewidth is measured by measuring the width of the emission peaks for each pump energy. The pump energy was varied from 10 mJ to 100 mJ, and the concentration of dye was varied from 10
−4 M to 10
−2 M.
Figure 6 shows the emission linewidth for a random laser based on almond milk with various dye concentrations. The blue line is used to estimate the lasing threshold. The lasing threshold is marked using a blue circle.
Table 2 shows the lasing threshold of random lasers based on almond milk, fresh milk, oat milk and soy milk which were obtained with various dye concentrations.
A random laser based on almond milk has a lasing threshold of ~50 mJ for the highest dye concentration, 10
−2 M. The lasing threshold reduces to ~48 mJ when the dye concentration is reduced to 10
−3 M. When the dye concentration is further reduced to 10
−4 M, no lasing threshold is observed. Meanwhile, a random laser based on fresh milk in 10
−2 M of dye concentration has a lasing threshold of ~60 mJ, and it further reduces to ~58 mJ and ~50 mJ for 10
−3 M and 10
−4 M of dye concentration. A random laser based on oat milk shows the lasing threshold at ~60 mJ, ~50 mJ and ~80 mJ for 10
−2 M, 10
−3 M and 10
−4 M of dye concentration, respectively. Furthermore, a random laser based on soy milk shows the lasing threshold at ~50 mJ for the highest dye concentration (10
−2 M), while it increases to ~60 mJ at 10
−3 M of dye concentration. We did not observe any lasing threshold in random lasers based on soy milk in 10
−4 M of dye concentration (
Table 2).
From the modeling results, we found that milk fat from animal and plant sources can be compared based on the lasing threshold. Random lasers need excitation sources (pump energy), optical gain (gain medium) and multiple light scattering (scattering mean free path) to work. The characteristics or properties of random lasers can be affected when the pump energy, gain medium and scattering mean free path are varied. Scattering mean free path can be estimated using Equation (6) where it depends on scatterer density and scattering cross section. In this research, we varied scatterer density based on the mass of fat of each milk, and the scattering cross section of the fat particles was estimated according to Abegaõ et al. [
18]. We suppose that fat content in milk can contribute to the light scattering where a higher amount of fat provides higher light scattering. Indirectly, light scattering can affect the properties of random lasers. Fresh milk has the highest fat content (7.6 g) whereas soy milk has the lowest fat content (3.6 g) among all samples. Thus, a random laser based on fresh milk shows the lowest lasing threshold in 10
−4 M of dye concentration because the fat particles can provide adequate light scattering to complement the lower concentration of dyes (
Table 2).
The modeling results also show that the concentration of dye affects the properties of random lasers. The highest concentration of dye (10
−2 M) provides more light amplification and results in a lower lasing threshold. Meanwhile, a random laser based on soy milk shows no lasing threshold in the lowest dye concentration because sufficient dye concentration is needed to compensate for the lower amount of fat particles inside the gain medium (
Table 2).
5. Conclusions
In conclusion, the objective of the research was achieved as the study could differentiate the properties of milk from animal, plant and human sources based on light propagation and random lasers. The study was conducted on almond milk, fresh milk, oat milk and soy milk through spectrometry experiments, statistical analysis and modeling technique. The spectrometry experiments were performed using VIS-NIR and NIR spectrometers to observe the light absorbance and fluorescence spectra of milk samples within visible and near-infrared wavelengths. The study clearly shows that samples with higher fat content such as fresh milk and soy milk produce higher emission peaks. Besides that, the concentration of milk also affects the propagation of light, as less concentrated milk such as human breast milk and goat milk provide less absorbance and fluorescence spectra. The experimental result was validated using principal component analysis. Analysis of milk was also conducted based on random-laser properties. Particle density, dye concentration and pump energy were varied in the modeling, and the results clearly show that random lasers can be used to compare the fat content in various milk. The modeling can be further upgraded to be used in real random-laser experiments. Thus, we hypothesize that the optical properties of milk from animals, plants and humans can be analyzed in terms of light absorption, fluorescence and random laser. Our proposed study used a non-intrusive and non-invasive method, and the analysis provided can be used as a reference to differentiate milk properties from various sources.
Author Contributions
N.A.I.M.K. performed the investigation, writing and experiment, W.Z.W.I. was responsible for theory, supervision and idea, I.I. and J.J. were responsible for reviewing and resources, and N.S.H. and R.K.R.I. contributed to statistical analysis. All authors have read and agreed to the published version of the manuscript.
Funding
This research received funding from the Ministry of Higher Education Malaysia under the Fundamental Research Grant Scheme (FRGS/1/2018/STG02/USIM/02/2) and (FRGS/1/2021/WAB02/USIM/02/1).
Institutional Review Board Statement
Not applicable.
Informed Consent Statement
Not applicable.
Data Availability Statement
All data presented in this study are available on request from the corresponding author.
Acknowledgments
We would like to acknowledge the Faculty of Engineering and Built Environment, Universiti Sains Islam Malaysia (USIM), for the equipment support and USIM for the publication fees support.
Conflicts of Interest
The authors declare no conflict of interest.
References
- Trailokya, A.; Srivastava, A.; Bhole, M.; Zalte, N. Calcium and Calcium Salts. J. Assoc. Phys India 2017, 65, 100–103. [Google Scholar]
- Lee, Y.-J.; Yeh, T.-W.; Yang, Z.-P.; Yao, Y.-C.; Chang, C.-Y.; Tsai, M.-T.; Sheu, J.-K. A curvature-tunable random laser. Nanoscale 2018, 11, 3534–3545. [Google Scholar] [CrossRef]
- Ismail, W.Z.W.; Kamil, W.M.W.A.; Dawes, J. Enhancement of Random Laser Properties on Solid Polymer Films by Increasing Scattering Effect. J. Russ. Laser Res. 2019, 40, 364–369. [Google Scholar] [CrossRef]
- Ismail, W.Z.W.; Hurot, C.; Dawes, J. Properties of Random Lasers in a hollow core photonic crystal fiber. Laser Phys. 2020, 30, 035002. [Google Scholar] [CrossRef]
- Choubey, P.S.; Sarkar, A.; Varshney, S.K.; Shivakiran Bhaktha B., N. Random laser spectroscopy and replica symmetry breaking phase transitions in a solvent-rich polymer thin film waveguide. J. Opt. Soc. Am. B 2020, 37, 2505–2513. [Google Scholar] [CrossRef]
- Silveira, B.; Gomes, A.; Becker, M.; Schneidewind, H.; Frazão, O. Bunimovich Stadium-Like Resonator for Randomized Fiber Laser Operation. Photonics 2018, 5, 17. [Google Scholar] [CrossRef] [Green Version]
- Popoff, S.M.; Lerosey, G.; Carminati, R.; Fink, M.; Boccara, A.C.; Gigan, S. Measuring the Transmission Matrix in Optics: An Approach to the Study and Control of Light Propagation in Disordered Media. Phys. Rev. Lett. 2010, 104, 100601. [Google Scholar] [CrossRef]
- Veenstra, C.; Every, D.E.; Petersen, W.; Van Goudoever, J.B.; Steenbergen, W.; Bosschaart, N. Dependency of the optical scattering properties of human milk on casein content and common sample preparation methods. J. Biomed. Opt. 2020, 25, 045001. [Google Scholar] [CrossRef] [Green Version]
- Kokotou, M.G.; Mantzourani, C.; Kokotos, G. Development of a Liquid Chromatography–High Resolution Mass Spectrometry Method for the Determination of Free Fatty Acids in Milk. Molecules 2020, 25, 1548. [Google Scholar] [CrossRef] [Green Version]
- Askoura, M.L.; Vaudelle, F.; L’Huillier, J.-P. Experimental Study of Light Propagation in Apple Tissues Using a Multispectral Imaging System. Photonics 2016, 3, 50. [Google Scholar] [CrossRef]
- Singh, H.K.; Meitei, N.C.; Sarkar, S.T.; Tiwari, D.; Bezboruah, T. Truly Nonintrusive Liquid-Level-Sensing Method Based on Lateral Displacement Effect of Light Rays. IEEE Sens. J. 2013, 13, 801–806. [Google Scholar] [CrossRef]
- Forcato, D.O.; Carmine, M.P.; Echeverría, G.E.; Pécora, R.P.; Kivatinitz, S.C. Milk Fat Content Measurement by a Simple UV Spectrophotometric Method: An Alternative Screening Method. J. Dairy Sci. 2005, 88, 478–481. [Google Scholar] [CrossRef] [Green Version]
- Frizzarin, M.; Gormley, I.; Berry, D.; Murphy, T.; Casa, A.; Lynch, A.; McParland, S. Predicting cow milk quality traits from routinely available milk spectra using statistical machine learning methods. J. Dairy Sci. 2021, 104, 7438–7447. [Google Scholar] [CrossRef] [PubMed]
- Peterson, S.; Rezamand, P.; Williams, J.; Price, W.; Chahine, M.; McGuire, M. Effects of dietary betaine on milk yield and milk composition of mid-lactation Holstein dairy cows. J. Dairy Sci. 2012, 95, 6557–6562. [Google Scholar] [CrossRef] [Green Version]
- Abohassan, K.M.; Ashour, H.S.; Abadla, M.M. A 1D binary photonic crystal sensor for detecting fat concentrations in commercial milk. R. Soc. Chem Adv. 2021, 11, 12058–12065. [Google Scholar]
- Kamil, N.A.I.M.; Zakaria, i. H.; Wanismail, W.Z.; Ismail, I.; Jamaludin1, J.; Balakrishnan, S.R.; Sahrim, M. Investigating Light Propagation in Full and Skimmed Milk based on Spectroscopy and Monte Carlo Analysis. J. Eng. Appl. Sci. 2020, 67, 2265–2278. [Google Scholar]
- Kamil, Ν.A.Ι.Μ.; Nor’aini, Z.S.; Ismail, W.W.; Balakrishnan, S.R.; Jamaludin, J.; Ismail, I.; Sahrim, M. Investigating the Quality of Milk using Spectrometry Technique and Scattering Theory. Eng. Technol. Appl. Sci. Res. 2021, 11, 7111–7117. [Google Scholar] [CrossRef]
- Abegão, L.M.G.; Pagani, A.A.C.; Zílio, S.C.; Alencar, M.A.R.C.; Rodrigues, J.J. Measuring milk fat content by random laser emission. Sci. Rep. 2016, 6, 35119. [Google Scholar] [CrossRef] [Green Version]
- Wood, K.; Whitney, B.; Bjorkman, J.; Wolff, M. Introduction to Monte Carlo Radiation Transfer. 2010, pp. 1–20. Available online: http://www-star.st-and.ac.uk/~kw25/research/montecarlo/book.pdf (accessed on 1 October 2021).
- Luan, F.; Gu, B.; Gomes, A.S.; Yong, K.-T.; Wen, S.; Prasad, P.N. Lasing in nanocomposite random media. Nano Today 2015, 10, 168–192. [Google Scholar] [CrossRef]
- Binzoni, T.; Leung, T.S.; Gandjbakhche, A.H.; Rüfenacht, D.; Delpy, D.T. The use of the Henyey–Greenstein phase function in Monte Carlo simulations in biomedical optics. Phys. Med. Biol. 2006, 51, N313–N322. [Google Scholar] [CrossRef]
- Hornbeck, H.; Alim, U. Improved Volume Scattering. In Computer Graphics International Conference; Springer: Cham, Switzerland, 2019; pp. 68–80. [Google Scholar]
- Sabin, A. Problems in Particle Size: Laser Diffraction Observations. Part. Technol. Lab. 2011, 15, 13. [Google Scholar]
- Yiğit, A.A. Animal and plant-based milk and their antioxidant properties. Vet. J. Mehmet Akif Ersoy Univ. 2020, 4, 113–120. [Google Scholar] [CrossRef]
- Shaikh, S.; O’Donnell, C. Applications of fluorescence spectroscopy in dairy processing: A review. Curr. Opin. Food Sci. 2017, 17, 16–24. [Google Scholar] [CrossRef]
- Gowri, A.; Rajamani, A.S.; Ramakrishna, B.; Sai, V. U-bent plastic optical fiber probes as refractive index based fat sensor for milk quality monitoring. Opt. Fiber Technol. 2018, 47, 15–20. [Google Scholar] [CrossRef]
- Choudhary, S.; Joshi, B.; Pandey, G.; Joshi, A. Application of single and dual fluorophore-based pH sensors for determination of milk quality and shelf life using a fibre optic spectrophotometer. Sensors Actuators B Chem. 2019, 298. [Google Scholar] [CrossRef]
- Shetty, S.A.; Young, M.F.; Taneja, S.; Rangiah, K. Quantification of B-vitamins from different fresh milk samples using ultra-high performance liquid chromatography mass spectrometry/selected reaction monitoring methods. J. Chromatogr. A 2019, 1609, 460452. [Google Scholar] [CrossRef] [PubMed]
- Groth, D.; Hartmann, S.; Klie, S.; Selbig, J. Principal Components Analysis; Humana Press: Totowa, NJ, USA, 2013. [Google Scholar]
- Clark, N.R.; Ma’Ayan, A. Introduction to Statistical Methods to Analyze Large Data Sets: Principal Components Analysis. Sci. Signal. 2011, 4, tr3. [Google Scholar] [CrossRef] [PubMed] [Green Version]
| Publisher’s Note: MDPI stays neutral with regard to jurisdictional claims in published maps and institutional affiliations. |
© 2021 by the authors. Licensee MDPI, Basel, Switzerland. This article is an open access article distributed under the terms and conditions of the Creative Commons Attribution (CC BY) license (https://creativecommons.org/licenses/by/4.0/).

 ,
, 


