Article

A Preliminary Assessment of an FBG-Based Hard Landing Monitoring System

1
Department of Adaptive Structures, CIRA (The Italian Aerospace Research Centre), 81043 Capua, Italy
2
FGA (Faculdade do Gama), Universidade de Brasília, Gama 72444-240, Brazil
3
Department of Reliability and Safety of Critical Infrastructure, CIRA (The Italian Aerospace Research Centre), 81043 Capua, Italy
4
Department of Airframe Design and Dynamics, CIRA (The Italian Aerospace Research Centre), 81043 Capua, Italy
5
Aerospace Structure Crash Facility, CIRA (The Italian Aerospace Research Centre), 81043 Capua, Italy
*
Author to whom correspondence should be addressed.
Photonics 2021, 8(10), 450; https://doi.org/10.3390/photonics8100450
Submission received: 30 August 2021 / Revised: 10 October 2021 / Accepted: 12 October 2021 / Published: 17 October 2021
(This article belongs to the Special Issue Optical Sensing)

Abstract

:
In aeronautics, hard landing is a critical condition as the aircraft approaches the runway with a vertical velocity that exceeds 2 m/s. Beyond that level, the energy that should be then absorbed by the whole structure could cause severe damage to the landing gear and the whole structural system. This document reports on the set-up, execution and results of a preparatory test campaign performed on a small landing gear (LG) demonstrator instrumented with a fibre-optic sensor system. In detail, a leaf spring landing gear was released from a drop tower to detect information about the strain state and the related acceleration history of some specific components during the impact. The objective of the present research is the development of a method for assessing whether hard landing is experienced, and to what extent. Deformation measurements through an integrated Fibre-Bragg Grating (FBG) network allowed retrieving impact velocity by a devoted, original algorithm. The proposed preliminary methodology is the base for assessing a more complex procedure to correlate structural response to the energy entering the structure during the touchdown event.

1. Introduction

Flying vehicles’ safety relies on the landing gear system’s robust design based on safe life methods. During their lifetimes, landing gears shall resist any operational load, both in normal and extreme conditions [1].
Loads monitoring during landing gear operations is a crucial subject for safety [2] and for detecting important information on the real fatigue state of a generic structure. The so-called Operational Loads Monitoring (OLM) approach is used to assess the remaining useful safe life of a structure [3]. This can be done by integrating sensors, or sensor arrays, in landing gear systems (LGS) with different objectives, which may include the following: weight on wheel, weight and balance assessments, hard landing detection and even flight management and control or wheel dynamometers. Such kinds of monitoring systems can be also used for the assessment of system vibrations, which may include self-induced and brake-induced oscillations. The aircraft industry and researchers have dedicated many efforts in developing techniques and methods devoted to the measurement of operational loads and have elaborated proper processes for flyable hardware architectures overcoming many obstacles [4,5,6]. Within the following paper, a short bibliography summary of a number of the prevailing solutions for landing gear loads monitoring, for various purposes, is reported.
Weight on wheel (WoW) systems indicate whether the aircraft wheels are or are not loaded and alerts the pilot if the mean does not interact with the ground. Usually, these devices are based on shock absorber stroke movement, using inductive sensors to detect the displacement. An innovative architecture based on strain gauges, which was able to estimate shear stresses and indicate a trigger point lower than traditional systems, was proposed by Airbus, [7]. Weight and balance (W&B) systems should be able to estimate the total weight and the position of the centre of gravity of an aircraft, before take-off, including passengers, baggage and so on. A solution was proposed in [8,9], as fibre optics were integrated in the landing gear complex to measure static strains on-ground, generated by the overall aircraft weight. That information could be used to evaluate the barycentre migration during the load operations and the resulting total mass. Wheel dynamometer systems are able to measure the forces acting on the wheels for the ground testing of aircrafts. Such systems may provide data directly on the aircraft or send them to ground stations. A system composed of four-component strain gauges and using wireless communication was tested on a small aircraft [10]. An example of on-board measurements via strain gauges for various take-off and landing conditions is reported in [11].
Among various operational loads, in this paper, the authors concentrate on the impact loads to detect hard landing conditions. Landing forces are, in fact, the largest forces an aircraft can experience along with its operational lifespan. The Operational Loads Monitoring system of an aircraft can include hard landing detection [3].
Many reasons can cause hard landings, such as severe weather conditions, mechanical problems, excess weight and pilot errors. At present, there are no assessed direct methods for determining whether a landing gear was overloaded during landing or ground manoeuvres; currently, airlines rely on a combination of pilot’s judgment and recorded data [12]. Direct measurements of the hard loads of landing structures by means of different approaches is under investigation by different industries and researchers. One of those approaches is based on a battery-powered strain gauge data logger integrated in the landing gear structure to collect life data without accessing external power sources [13]. Another one implements laser deflection measurement devices, mounted on an axle and made of light emitting and receiving systems [14]. Direct load measurement can be performed via instrumented load pin [4,13]. A harsh landing event recorder for helicopter condition-based maintenance implementing a capacitive transducer was proposed in [15]. Some systems were introduced, whose working principle consisted of determining whether the shock absorber stroke exceeded or not a certain threshold. They were proved to be unreliable as hard landing level is hardly correlated to that displacement [16]. Other suggested devices measured the fluid pressure within the shock absorber, a parameter that is a function of its internal stress, in turn related to the vertical force transmitted to the aircraft. That system however showed to be excessively expensive, requiring substantial changes to the shock absorber architecture. Furthermore, it was sometimes inaccessible, for instance, as shock absorbers are integrated in the landing gear leg. Another appliance employed a piezoelectric accelerometer, which turned on as the landing gear was extended. In that case, it detected all the impinging accelerations, irrespectively of the cause. For fighters, it can be a serious case of false alarms, as they usually experience large vertical accelerations in the “landing gear out” condition. Finally, pure pilot’s physiological detection was considered on the basic assumption that he can actually sense and report strong accelerations. That solution cannot be completely accepted for being excessively subjective and occurring over a very short time. Another method underlay on heuristic algorithms using flight parameters and sensor data to extrapolate impact loads.
Strain gauges have been recently proposed to substitute bulky load cells to monitor landing gears loads, for health assessment [17,18,19]. However, this approach did not solve calibration issues [17], and the need of transferring massive data from the aircraft to the ground for their further exploitation, and long-term retention.
Selection of measuring transducers and installation matters constitute the most critical part of implementing sensor networks integrated in the landing gear because of the limited space available and the severe working conditions in which they operate. In fact, landing gear systems shall afford touchdown shocks (as widely herein recalled), take-off vibrations, large thermal gradients from brake applications, and so on. In addition, they are directly exposed to the external environment on ground, where they experience significant temperature variations, weathering (rain, hail, ice, humidity), wind loads, and so on. Should a sensor network be integrated in a landing gear, it shall not penalize its maintainability and reliability. Being of minimum size, weight, and power consumption, essential issues for any aircraft component, these constraints shall be considered in the development of such a system.
Nowadays, fibre optics technology is used in many structural health monitoring applications. An extensive review [20], analyses different papers to summarize aircraft Structural Health Monitoring (SHM) systems requirements, aimed at identifying suitable architecture to deal with multiple sensor technology, with a specific attention to the use of FBG. The authors did in fact recognise that such a technology was showing a crescent maturity in different fields of application. In the end, an interesting perspective of Fibre Bragg Grating (FBG) sensors implementation was presented and discussed. Fibre Optic Sensors have proven to be a potentially excellent technique for the real-time in situ monitoring of these structures due to their numerous advantages, such as immunity to electromagnetic interference, small size, light weight, durability and high bandwidth, which allows for a great number of sensors to operate in the same system and to be integrated within the material [21]. Apart from static and quasi-static loading, FBG-based systems show in fact good potentiality for use in dynamics (very high deformation rates); interrogation systems for high speed and high strain measurements are reported in [22]. Fibre optic sensing technology for aircraft wing shape measurement has been gradually proven to be a real-time and online dynamic measurement method with many excellent characteristics [23]. In a paper dated 2008 [24], the authors report the design of a twofold FBG-based sensor network for SHM and early fire detection. The application showed a process of individuation of critical locations (the so-called hot spots) where installing a limited number of sensors critical locations, differently distributed along an all-composite prototype aircraft. The experimented system was able to process real-time readings and transmit them to the on-board avionics for further elaborations and included a direct and dedicated user interface. It was the first of its kind on small commercial airplanes. In [25], the authors proposed an embedded FBG network as an element of a Health and Usage Monitoring System (HUMS) for a military Unmanned Aircraft Vehicle (UAV). Sensors were integrated within the wing and the tail boom of the aircraft to detect both the vibration and the strain field. The peculiarity of the system was its ability to work on both time and frequency domains. The reference state was identified, and perturbations from the original configurations allowed understanding the possible overloads and, therefore, potentially dangerous situations. The system was claimed to have run more than 1000 flight hours and hundreds of data logging hours.
The possibility of using Fibre Bragg Grating sensors for monitoring the health state of landing gear systems of various aircrafts has also been investigated. A Fibre Bragg Grating sensor network integrated in the inner face of the landing gear axle is described in [26], aimed at assessing the usability of a landing gear after abnormal events, such as hard landings or off-runway excursions. A Health Monitoring and Management System is a distributed system based on the multiple sensors approach, including FBGs, integrated in the reference architecture and able to prevent and diagnose possible defects or failure occurrences, to analyse its effects and evolution and to trigger the maintenance workflow in order to safely maintain of the aircraft at reduced costs, requiring minimum human intervention only when needed [27]. In [28], an in-flight FBG system was used to measure strains on an aircraft tail boom structure of an ultralight propeller composite aircraft in-flight, thought as a part of a more complex HUMS. The attained data were combined with other flight parameters and used to retrieve information on bending loads or ground impacts during landing, for instance. Recently, it has been investigated the possibility of using Fibre Bragg Grating sensors for the structural health monitoring of innovative composite items for the landing gear, where several FBG strain sensors have been integrated in different locations of the composite item including regions with a high bending radius [29]. With the perspective of developing an integrated monitor system aimed at assessing whether a landing gear has experienced hard impact during the approach, the authors reported in [30] a dedicated method aimed at determining the vertical speed by means of strain measurement via FBG strain sensors. Representative impacts on simple structural elements have been reproduced in the laboratory, as aluminium slender beams of different lengths were dropped from given heights onto a steel plate base. Contact velocities have been estimated by deformation detection.
In the Advanced Landing Gear Sensing and Monitoring (ALGESMO) project [31], developed within the Clean Sky 2 program, the firm Technobis developed a sensor system for measuring load at the landing gear, with the final aim of collecting data useful for being combined with aircraft IVHM, hard landing detection, flight management and flight control systems. The proposed load and torque detection network was based on the use of FBG technology, integrated within an Airbus-patented landing gear. A significant achievement was the assessment of a specific interrogator for this kind of application [32]. More generally, the ALGESMO system was made of a controller, or a Fibre Optic Processing Unit (FOPU), installed in the avionics bay and an acquisition network deployed on the wheel axles and embedded within composite material carriers, specially designed for the reference aircraft [31].
With the objective of assessing whether a landing gear system has experienced a hard landing, the authors performed an experimental activity using a Landing Gear System (LGS) demonstrator as a test article: a leaf spring landing gear being dropped from a drop tower from different heights and impacting on ground with different velocities up to overcoming the value of 2 m/s. In order to study the dynamics of the impacts at different heights, the landing gear was equipped with strain sensors and accelerometers. The strain sensors were both Fibre Bragg Grating (FBG) and traditional strain gauges (SG), in order to compare the different signals.
This paper reports on the development, execution and results of the performed test campaign.
The Smart Landing Gear System is one of the innovations “beyond the state of art” that has been developed in the framework of the ANGELA project, funded by the CS2 platform, Fast Rotorcraft IADP. This activity foresees the design and assessment of a Smart Landing Gear system for Hard Landing detection, based on Fibre Optics to be integrated in the Landing Gear structure. It is intended to assess the relevance of the FBG technology for in-flight testing, and it will be developed up to TRL 5.

2. Materials and Methods
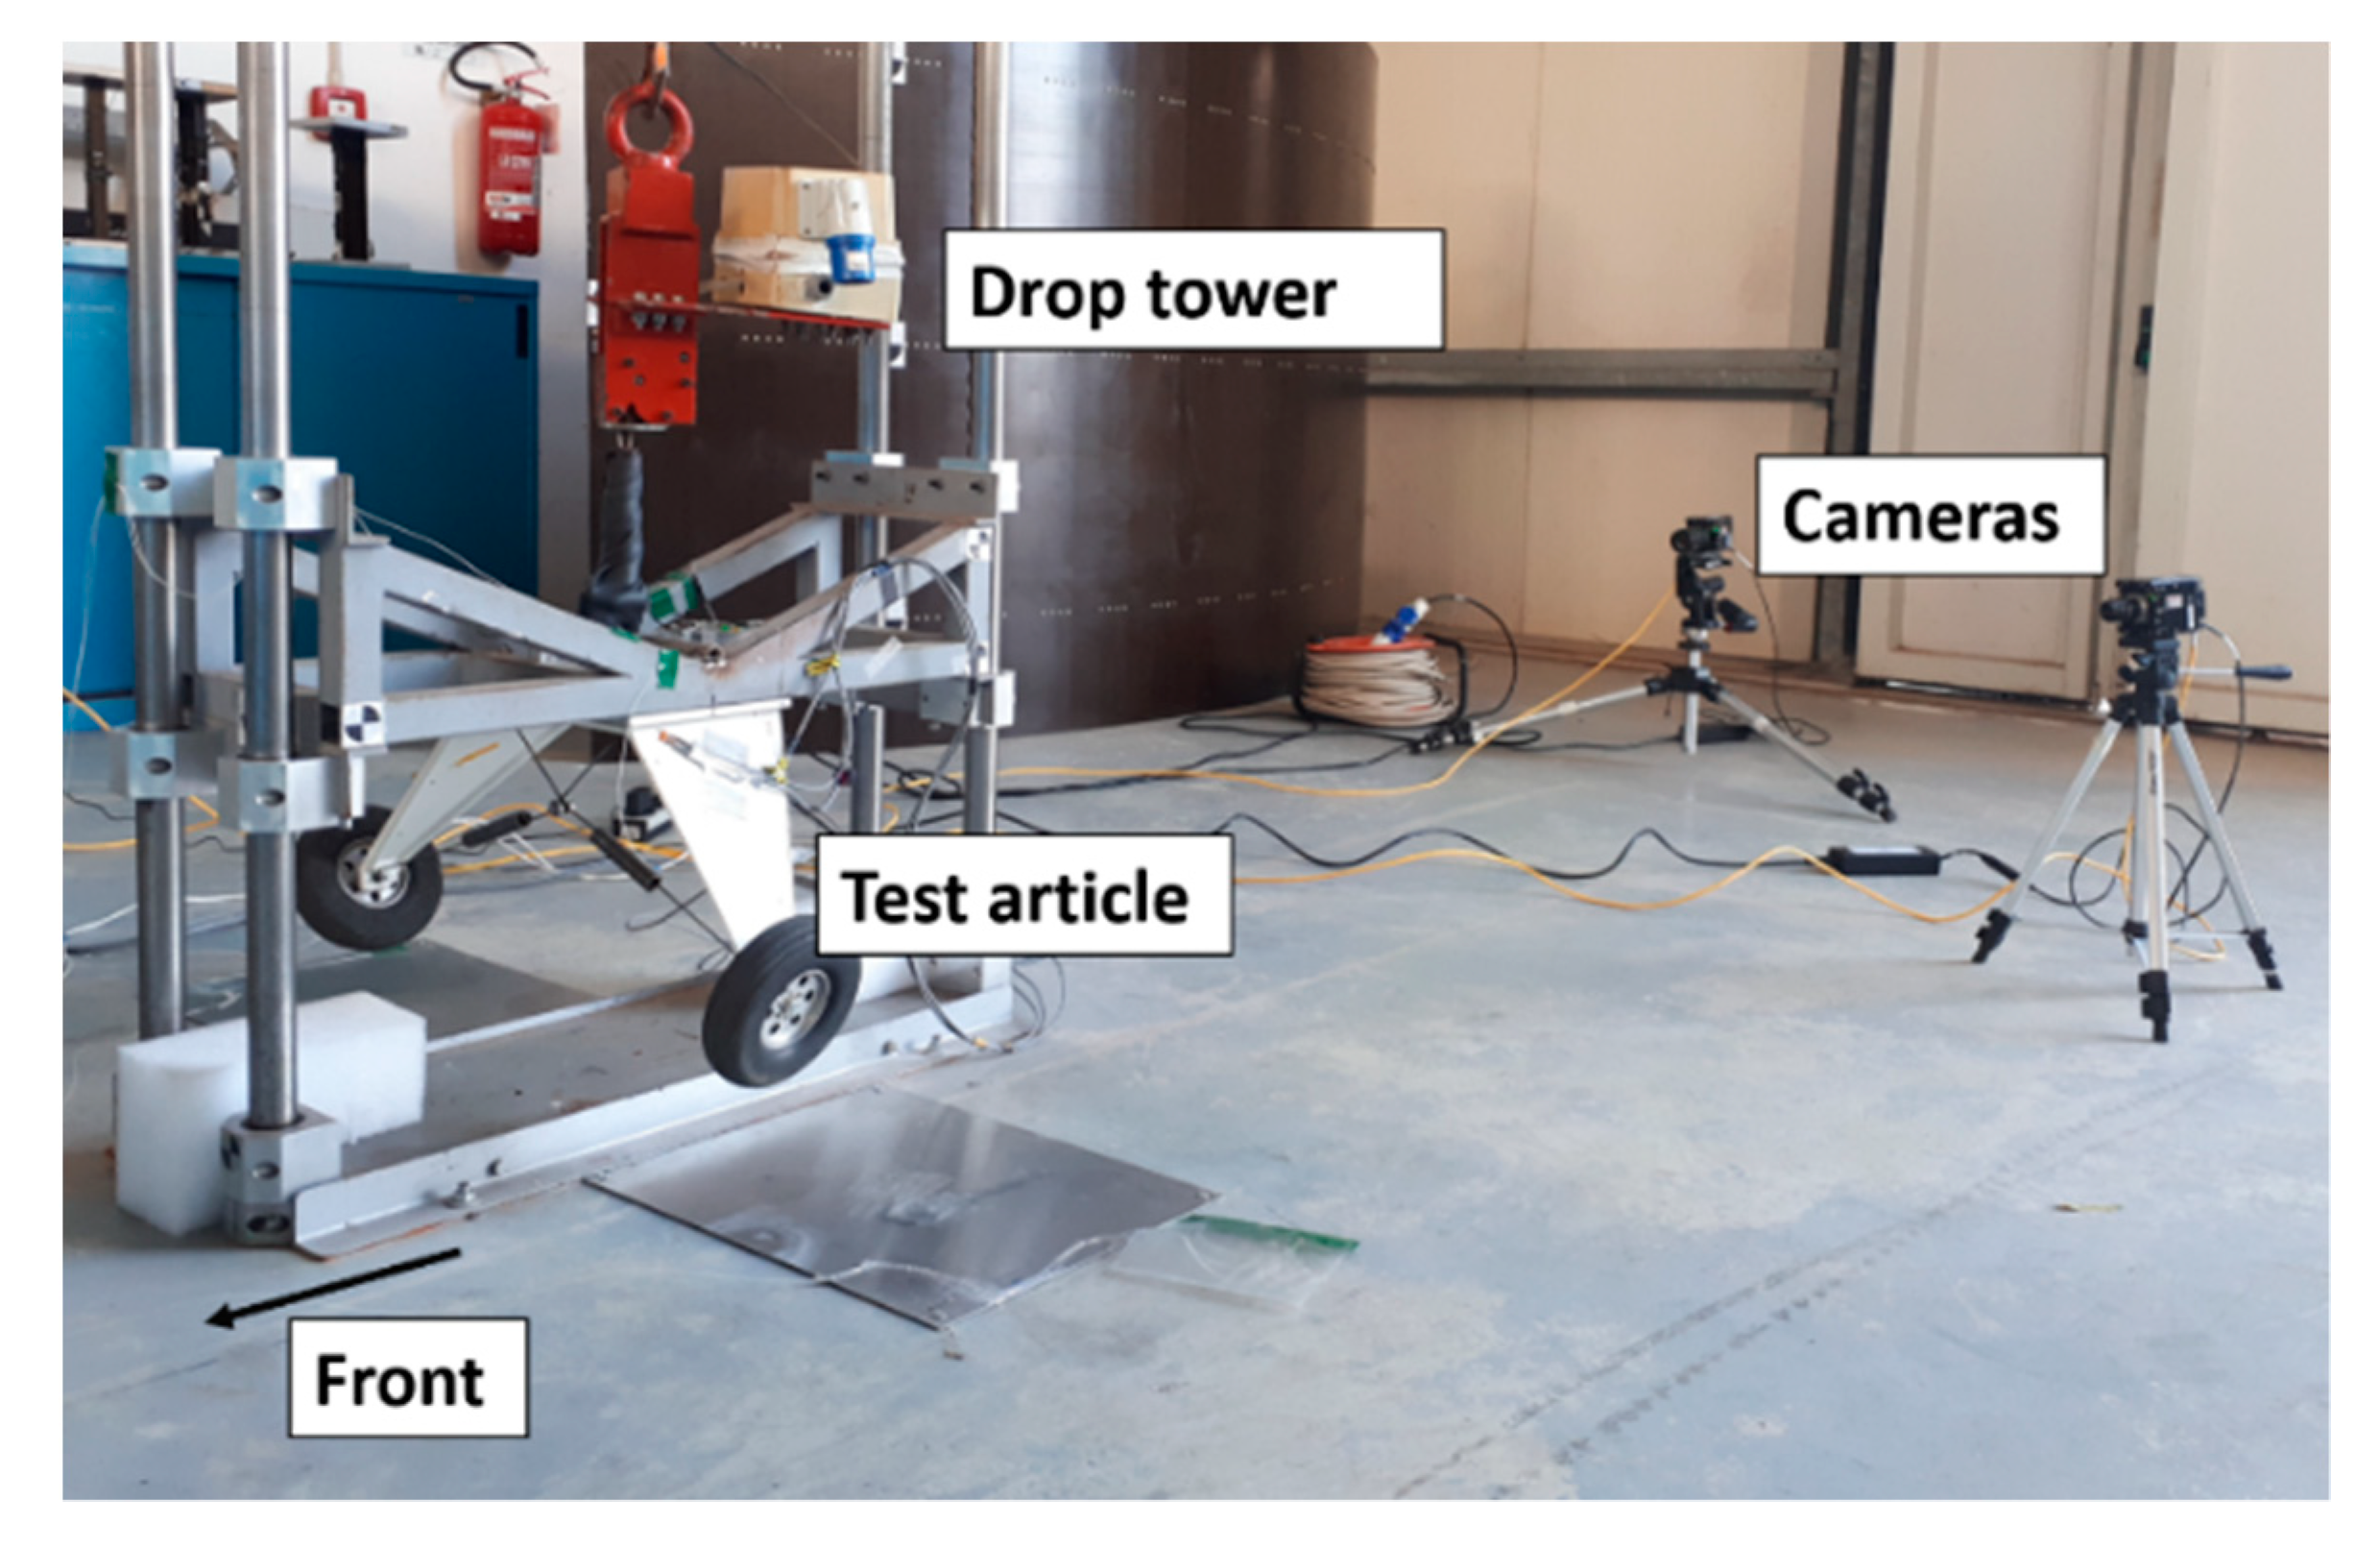
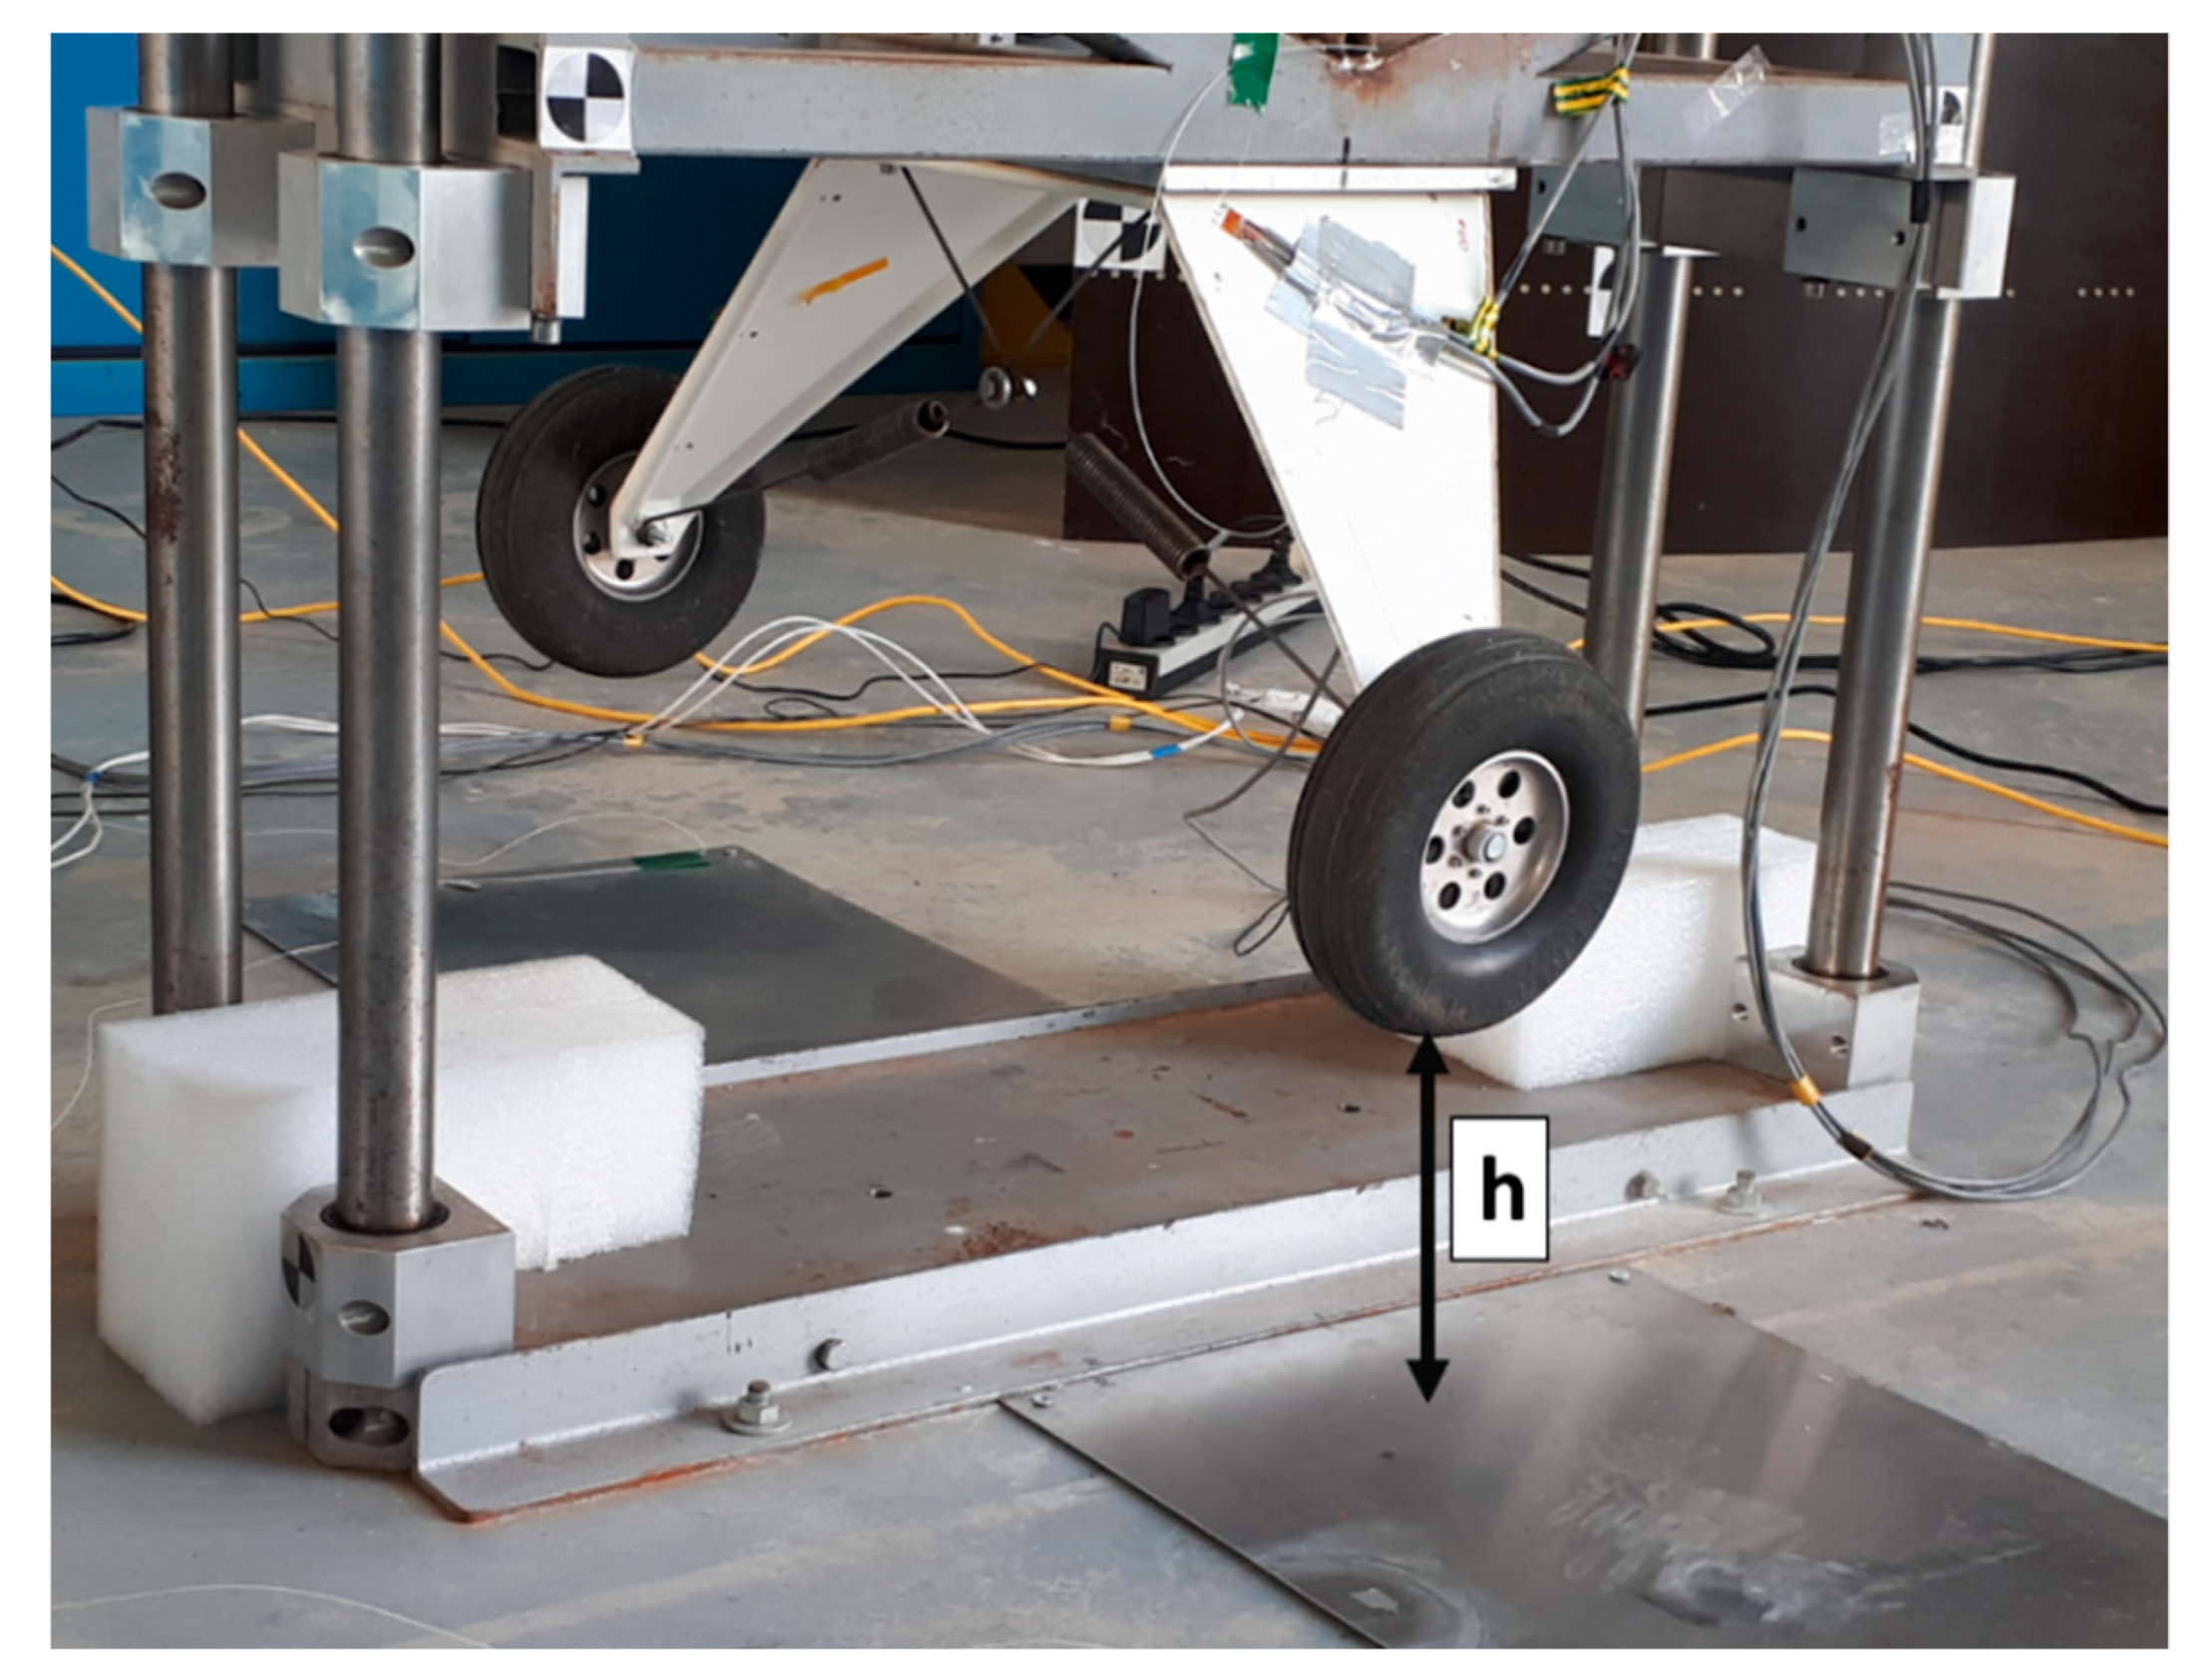
2.1. Hard Landing

Hard landing is an abnormal contact with the runway characterized by a high-energy impact; it can cause severe damage to the landing gear and even to the whole airplane/rotorcraft system. However, faults may also take place in the case of repeated lower intensity occurrences. Since current regulations classify the landing gear as a “necessary system for the flight” (see for instance, EASA CS23 and CS25 [33,34]), maintenance procedures shall be implemented before the next flight, and if applicable, repairs shall be performed to restore flyability. It is therefore essential to have prompt information concerning the rise of those eventualities. Dynamics associated with hard landing is very complex. In the simple case of symmetrical and conventional touchdowns with a small roll angle, negligible lateral load factor, and non-zero pitch angle, landings can be described by pure vertical factors. However, even in that circumstance, normal load factor n=L/W (ratio of the produced lift, L, over the aircraft weight, W) is not sufficient for assessing the severity of the dynamic contact with the ground. Other parameters such as aircraft mass, time duration of the first impact, vertical speed and vertical acceleration shall be considered. These latter two values should be measured right before the touchdown.

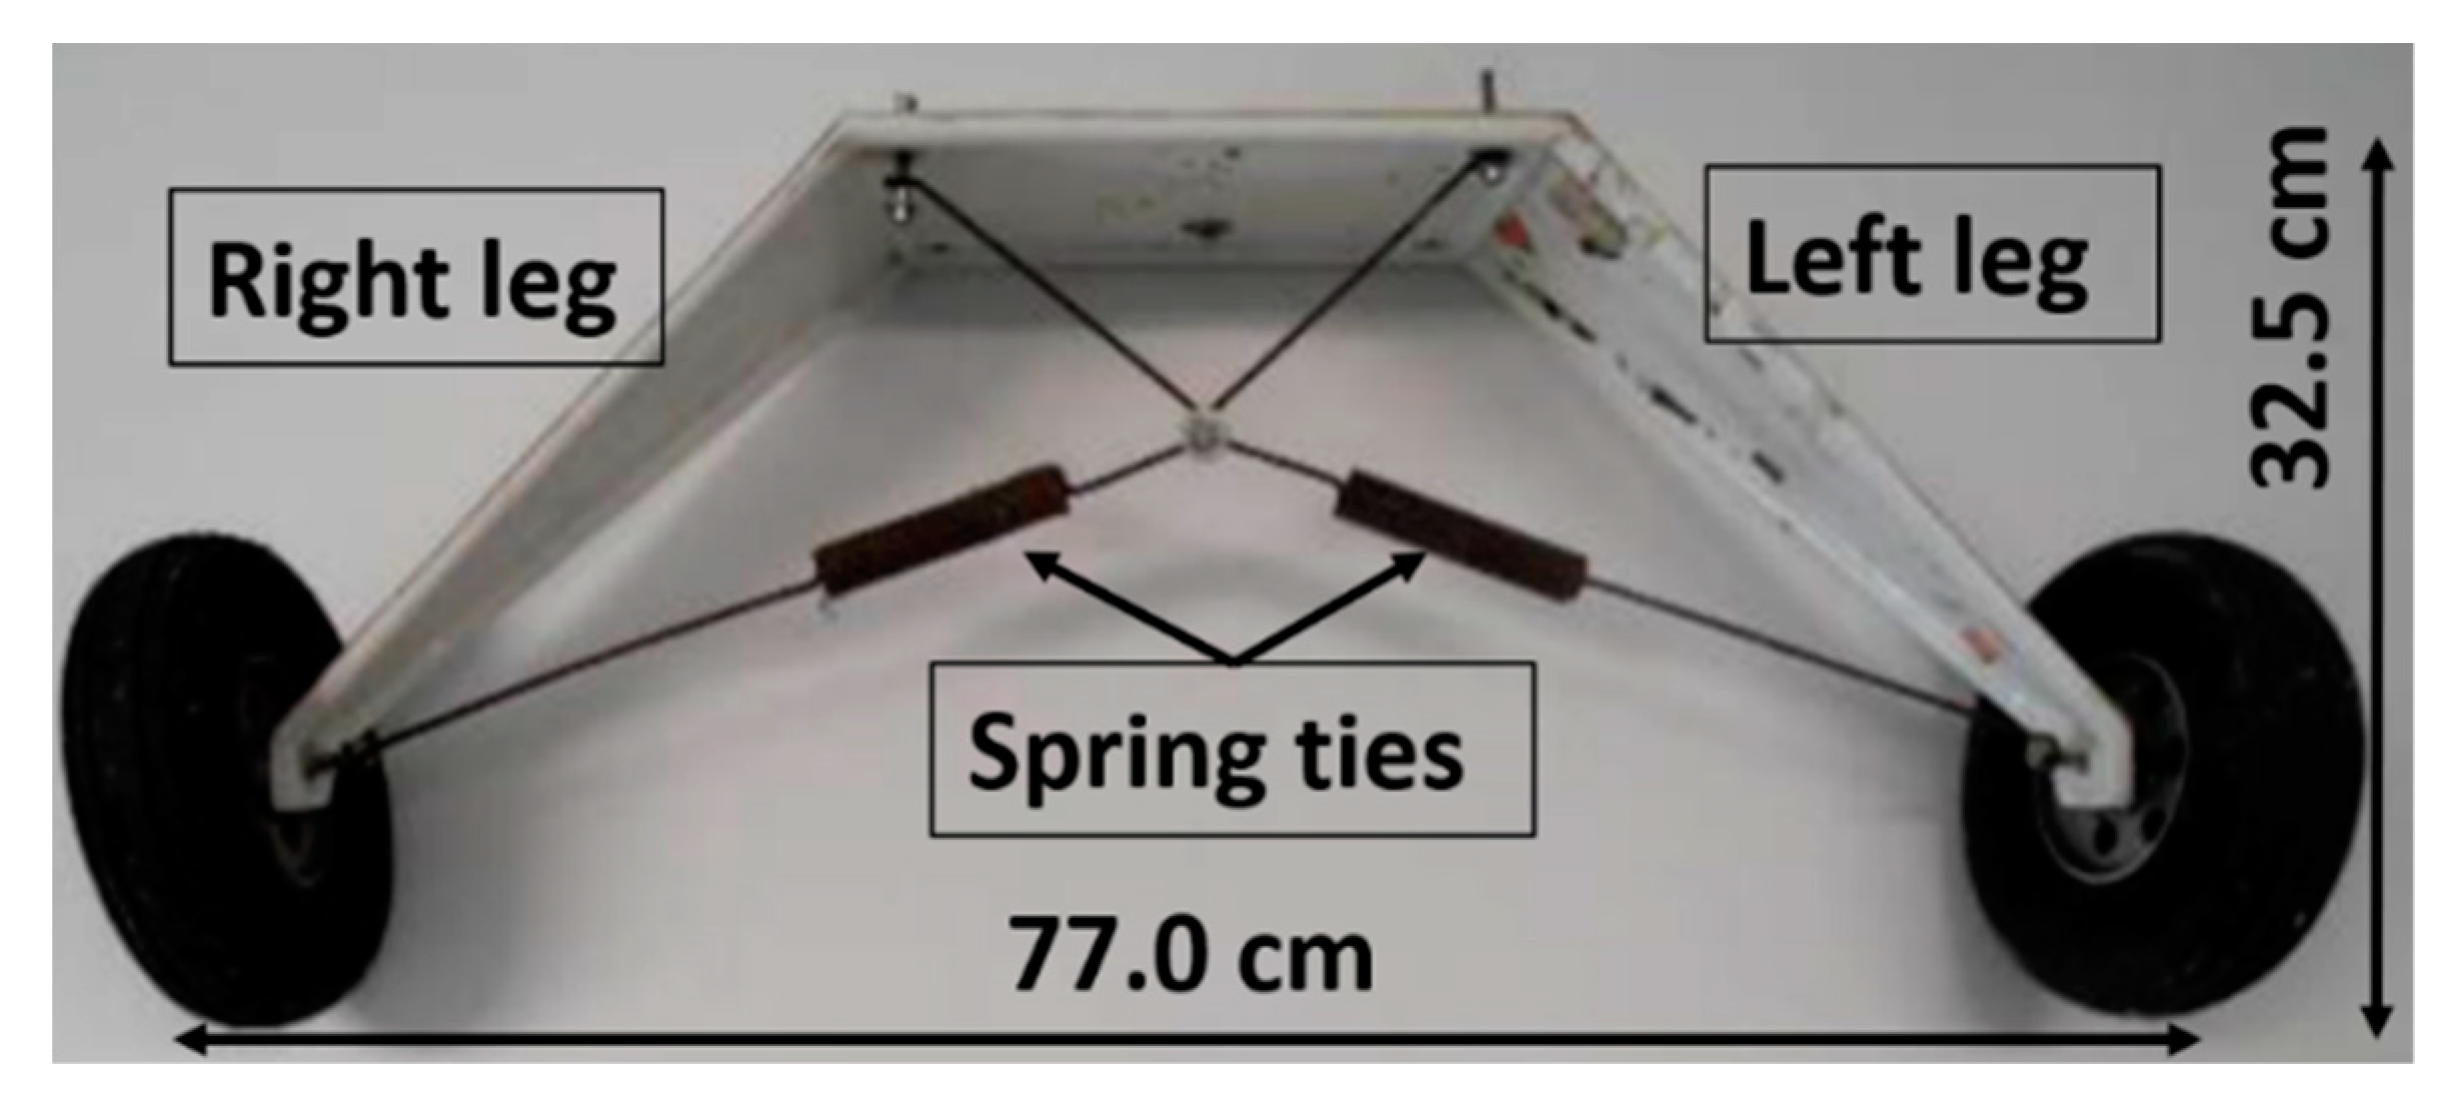
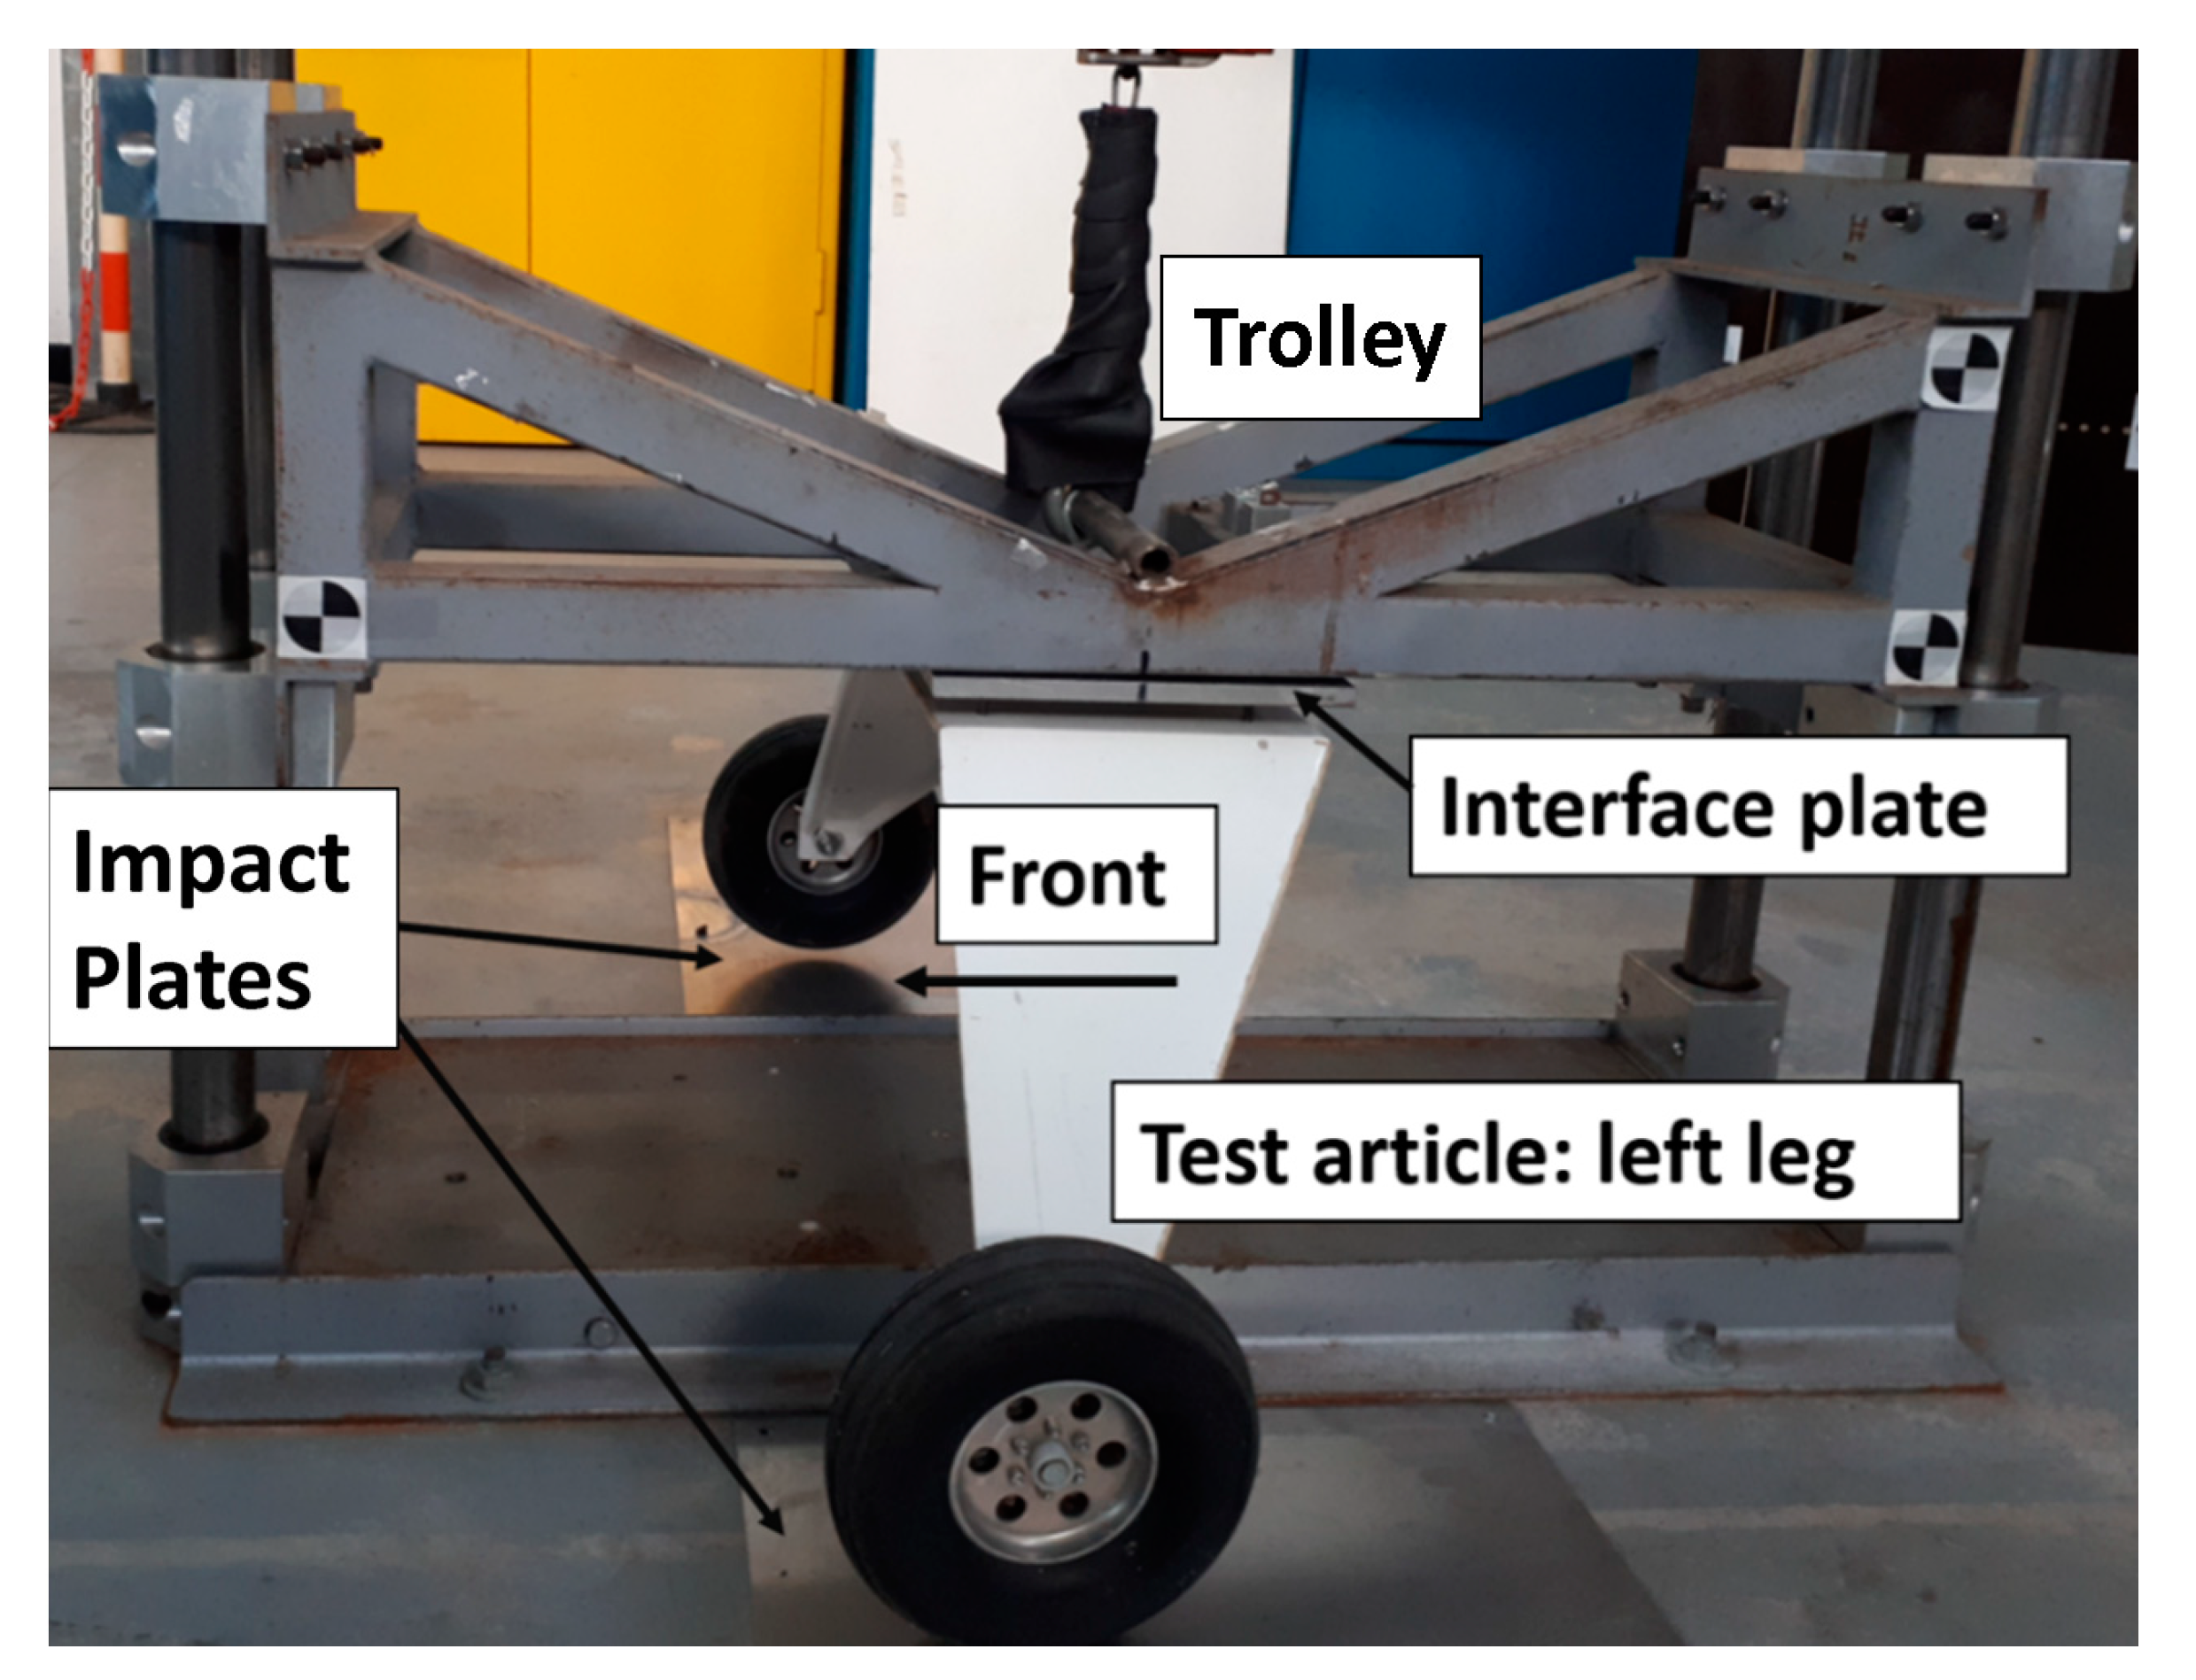
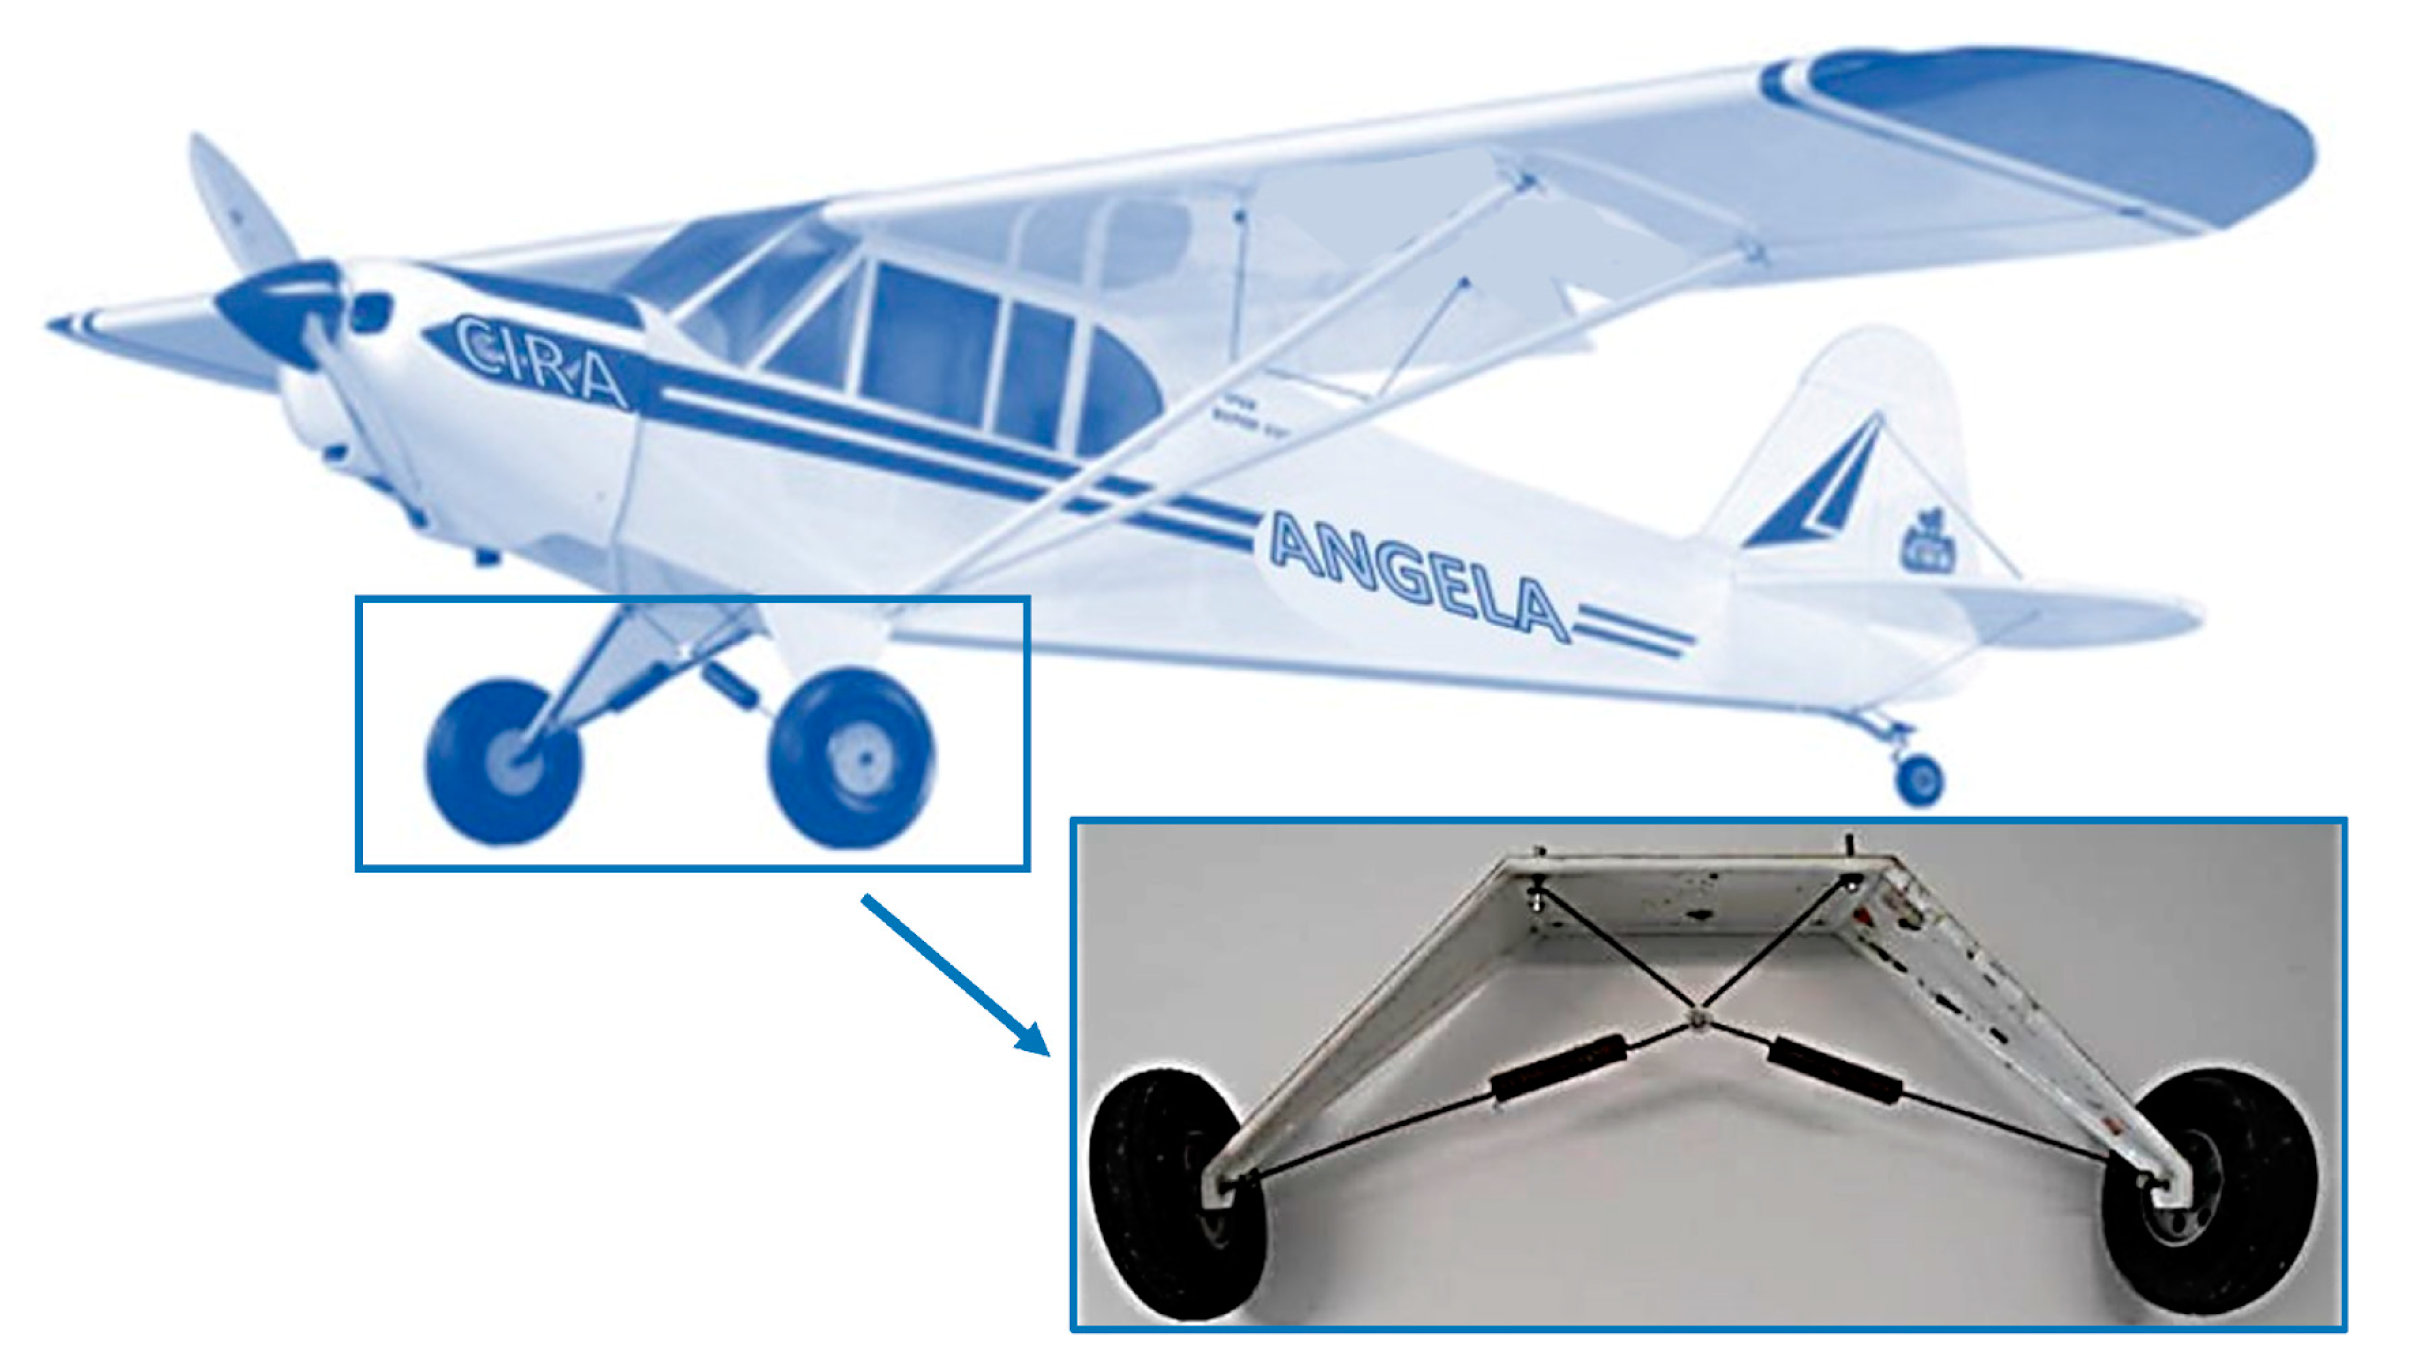
2.2. Test Article: Leaf Spring Landing Gear

In this study, the reference test article to investigate the characteristics of hard landing, defined as above, is a leaf spring landing gear of a Piper PA-18 Super Cub aircraft 1:3 scale model (Figure 1). In the central part, it is equipped with two spring ties which contribute to the energy absorption at landing.
The test article weighs 2.29 kg and is 77.0 cm wide and 32.5 cm high (overall dimensions including wheels, Figure 2). The wheels are solid and have a diameter of 17.0 cm and a tread of 5.0 cm. Tires are considered part of the whole system, some global characteristics of which were extracted from the presented analysis. Their stiffness and damping contributions are therefore embedded within the system ones. How the specific parameters (for instance, tire quality itself, inflating pressure) can have an influence on landing gear hard impact behaviour is the object of further and dedicated investigations.
The leaf spring landing gear is mounted on a small drop tower made of four rigid uprights that guide a trolley in its vertical stroke; such a facility is available at the Crash Test Laboratory of the Italian Aerospace Research Centre (CIRA), Italy. The test rig is bound to the floor on an 80 × 32 cm base and does allow drop heights up to 2 m (Figure 3). In order to achieve the speed of 2 m/s, usually considered as the limit beyond which a landing can be considered “hard”, as reported, for instance, in [35], 20 cm is taken as a reference in this study, since it permits the model to reach that velocity (free fall). Furthermore, since impacts from that height give rise to intense effects, it is established as the max value. At the bottom sides, two stainless steel impact plates are installed on the ground (Figure 4). Impact plates are 1 mm thick and 49 × 38 cm wide. Such elements are introduced to have a further source of information for the impact detection, independent of the analysed system. The floor is not suitable to be used in itself, since it is made of concrete and is characterized by high dissipative properties, conditioning both the signal decay at the impact and the info transmission across the referred area. So, the complication of the test set-up is compensated by the above-mentioned benefits.
The test article is bolted to the tower trolley by means of a dedicated interface plate. The combined weight of the trolley and the interface plate is 25.77 kg; summed to the test article weight, a total of 28.06 kg results. In order to carry out the drop test, such an installation is placed at a certain height from the ground. At a given command, a release system makes it fall freely along the uprights until hitting the impact plates with the tires. Rebounds follow until the mechanical energy is entirely dissipated.
The test article and the rig are equipped with different sensors to monitor and measure deformations (by means of strain gauges and FBG) and accelerations (by means of accelerometers) and to estimate the characteristic impact times. Two further accelerometers are mounted on the top of the trolley (Figure 5), while impact plates are each equipped with an FBG sensor (Figure 6). They are named FP1 and FP2, respectively.

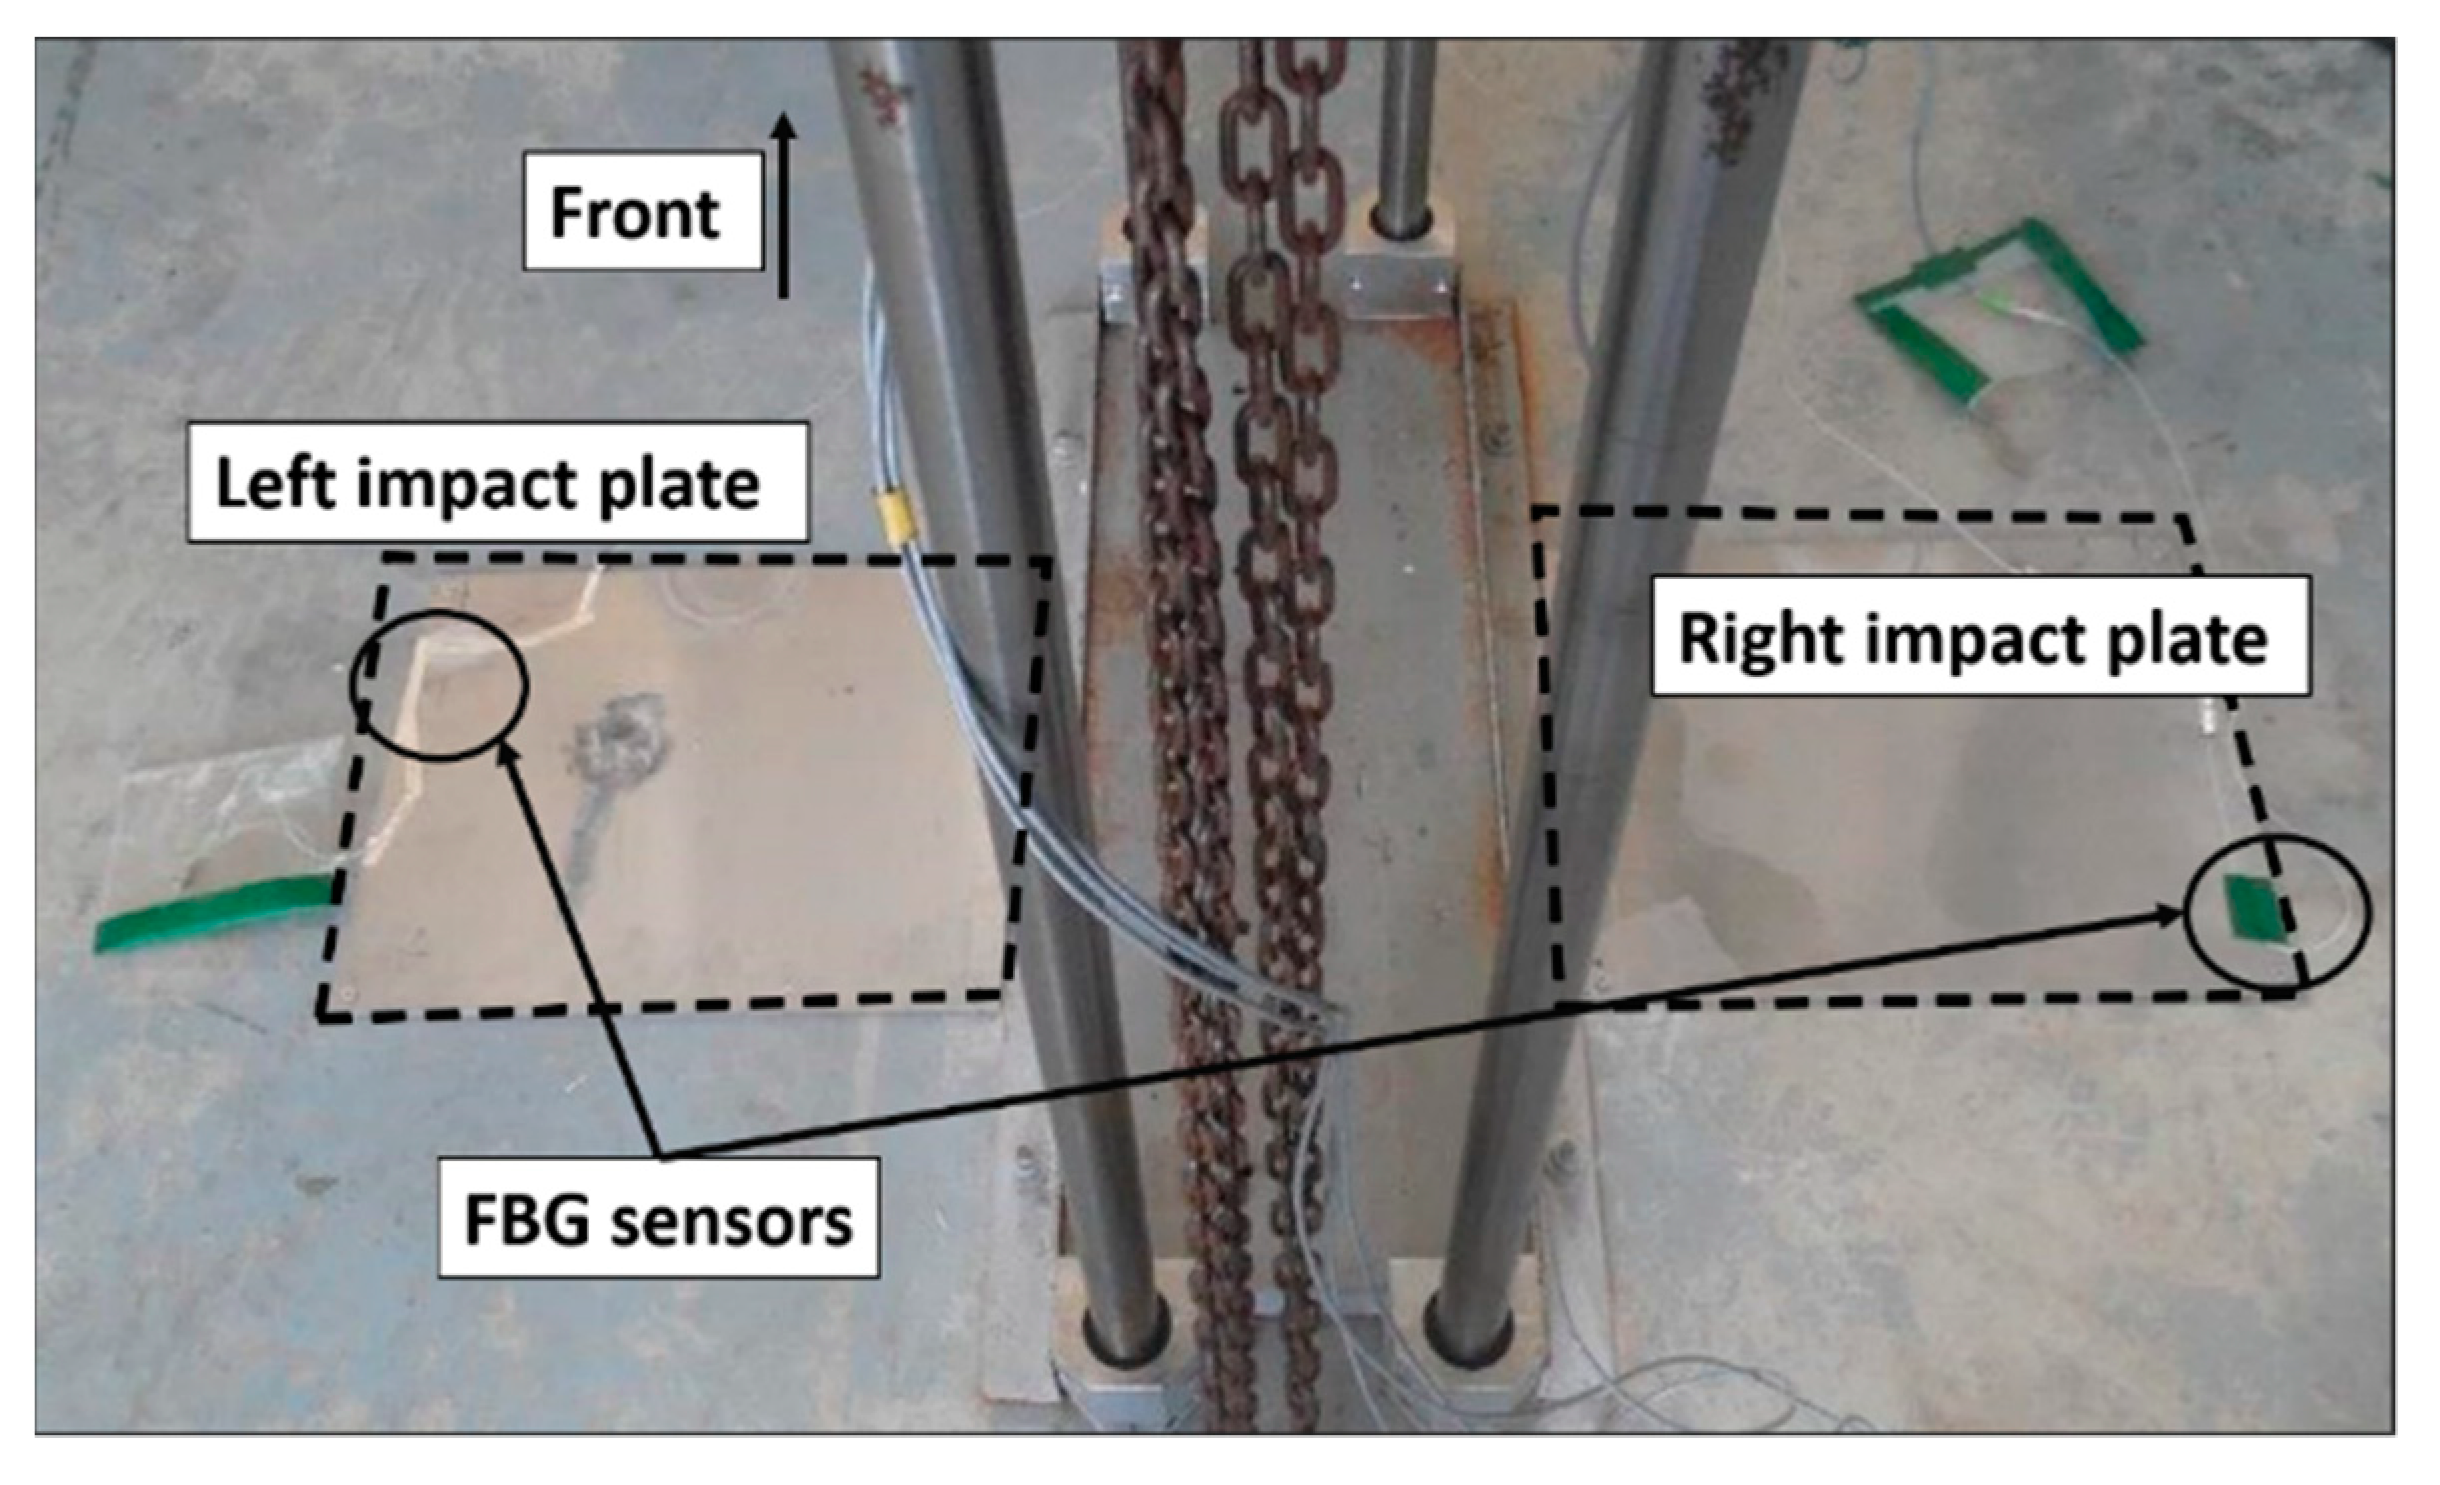
2.3. Fibre Optic Sensors

Fibre optics are excellent candidates for being integrated in landing gear structures to measure strains because of their many advantages, such as high sensitivity, electromagnetic immunity, minimum harness, minimum weight and intrusiveness (typical diameter is around 125 µm) and multiplexing capability. Their use in landing gears is innovative and represents the state of the art. Fibre Bragg Gratings (FBG) [20] represent a largely mature technology for measuring structural deformations [21,36], currently present in many industrial applications. They act as optical filters whose characteristics are defined by the microstructure spatial period and the refractive index of the fibre core. The microstructure works as a wavelength selective mirror: Light signals passing the fibre are partially backscattered, and reflections exhibit narrow-band reflections. Max reflectivity occurs at the so-called Bragg wavelength (λB) and depends on the grating period, Λ, and the effective refractive index, neff, according to the well-known Bragg condition [36]: λB = 2neffΛ. The strain dependence of an FBG can be determined by differentiating the expression above as follows:
Δ λ B λ B = ( 1 + 1 n e f n e f ε ) Δ ε = ( 1 + p e ) Δ ε = β ε Δ ε
In that equation, βε represents the strain sensitivity of the Bragg Grating at a given temperature, and pe is the photo-elastic constant (variation of the core refractive index vs. the axial stress). For most silica optical fibres, the effect of core doping (typically, germanium) can be neglected. Theoretical mechanic strain sensitivity at a given temperature may be expressed as:
S t h e o r = Δ λ B Δ ε = β ε λ B

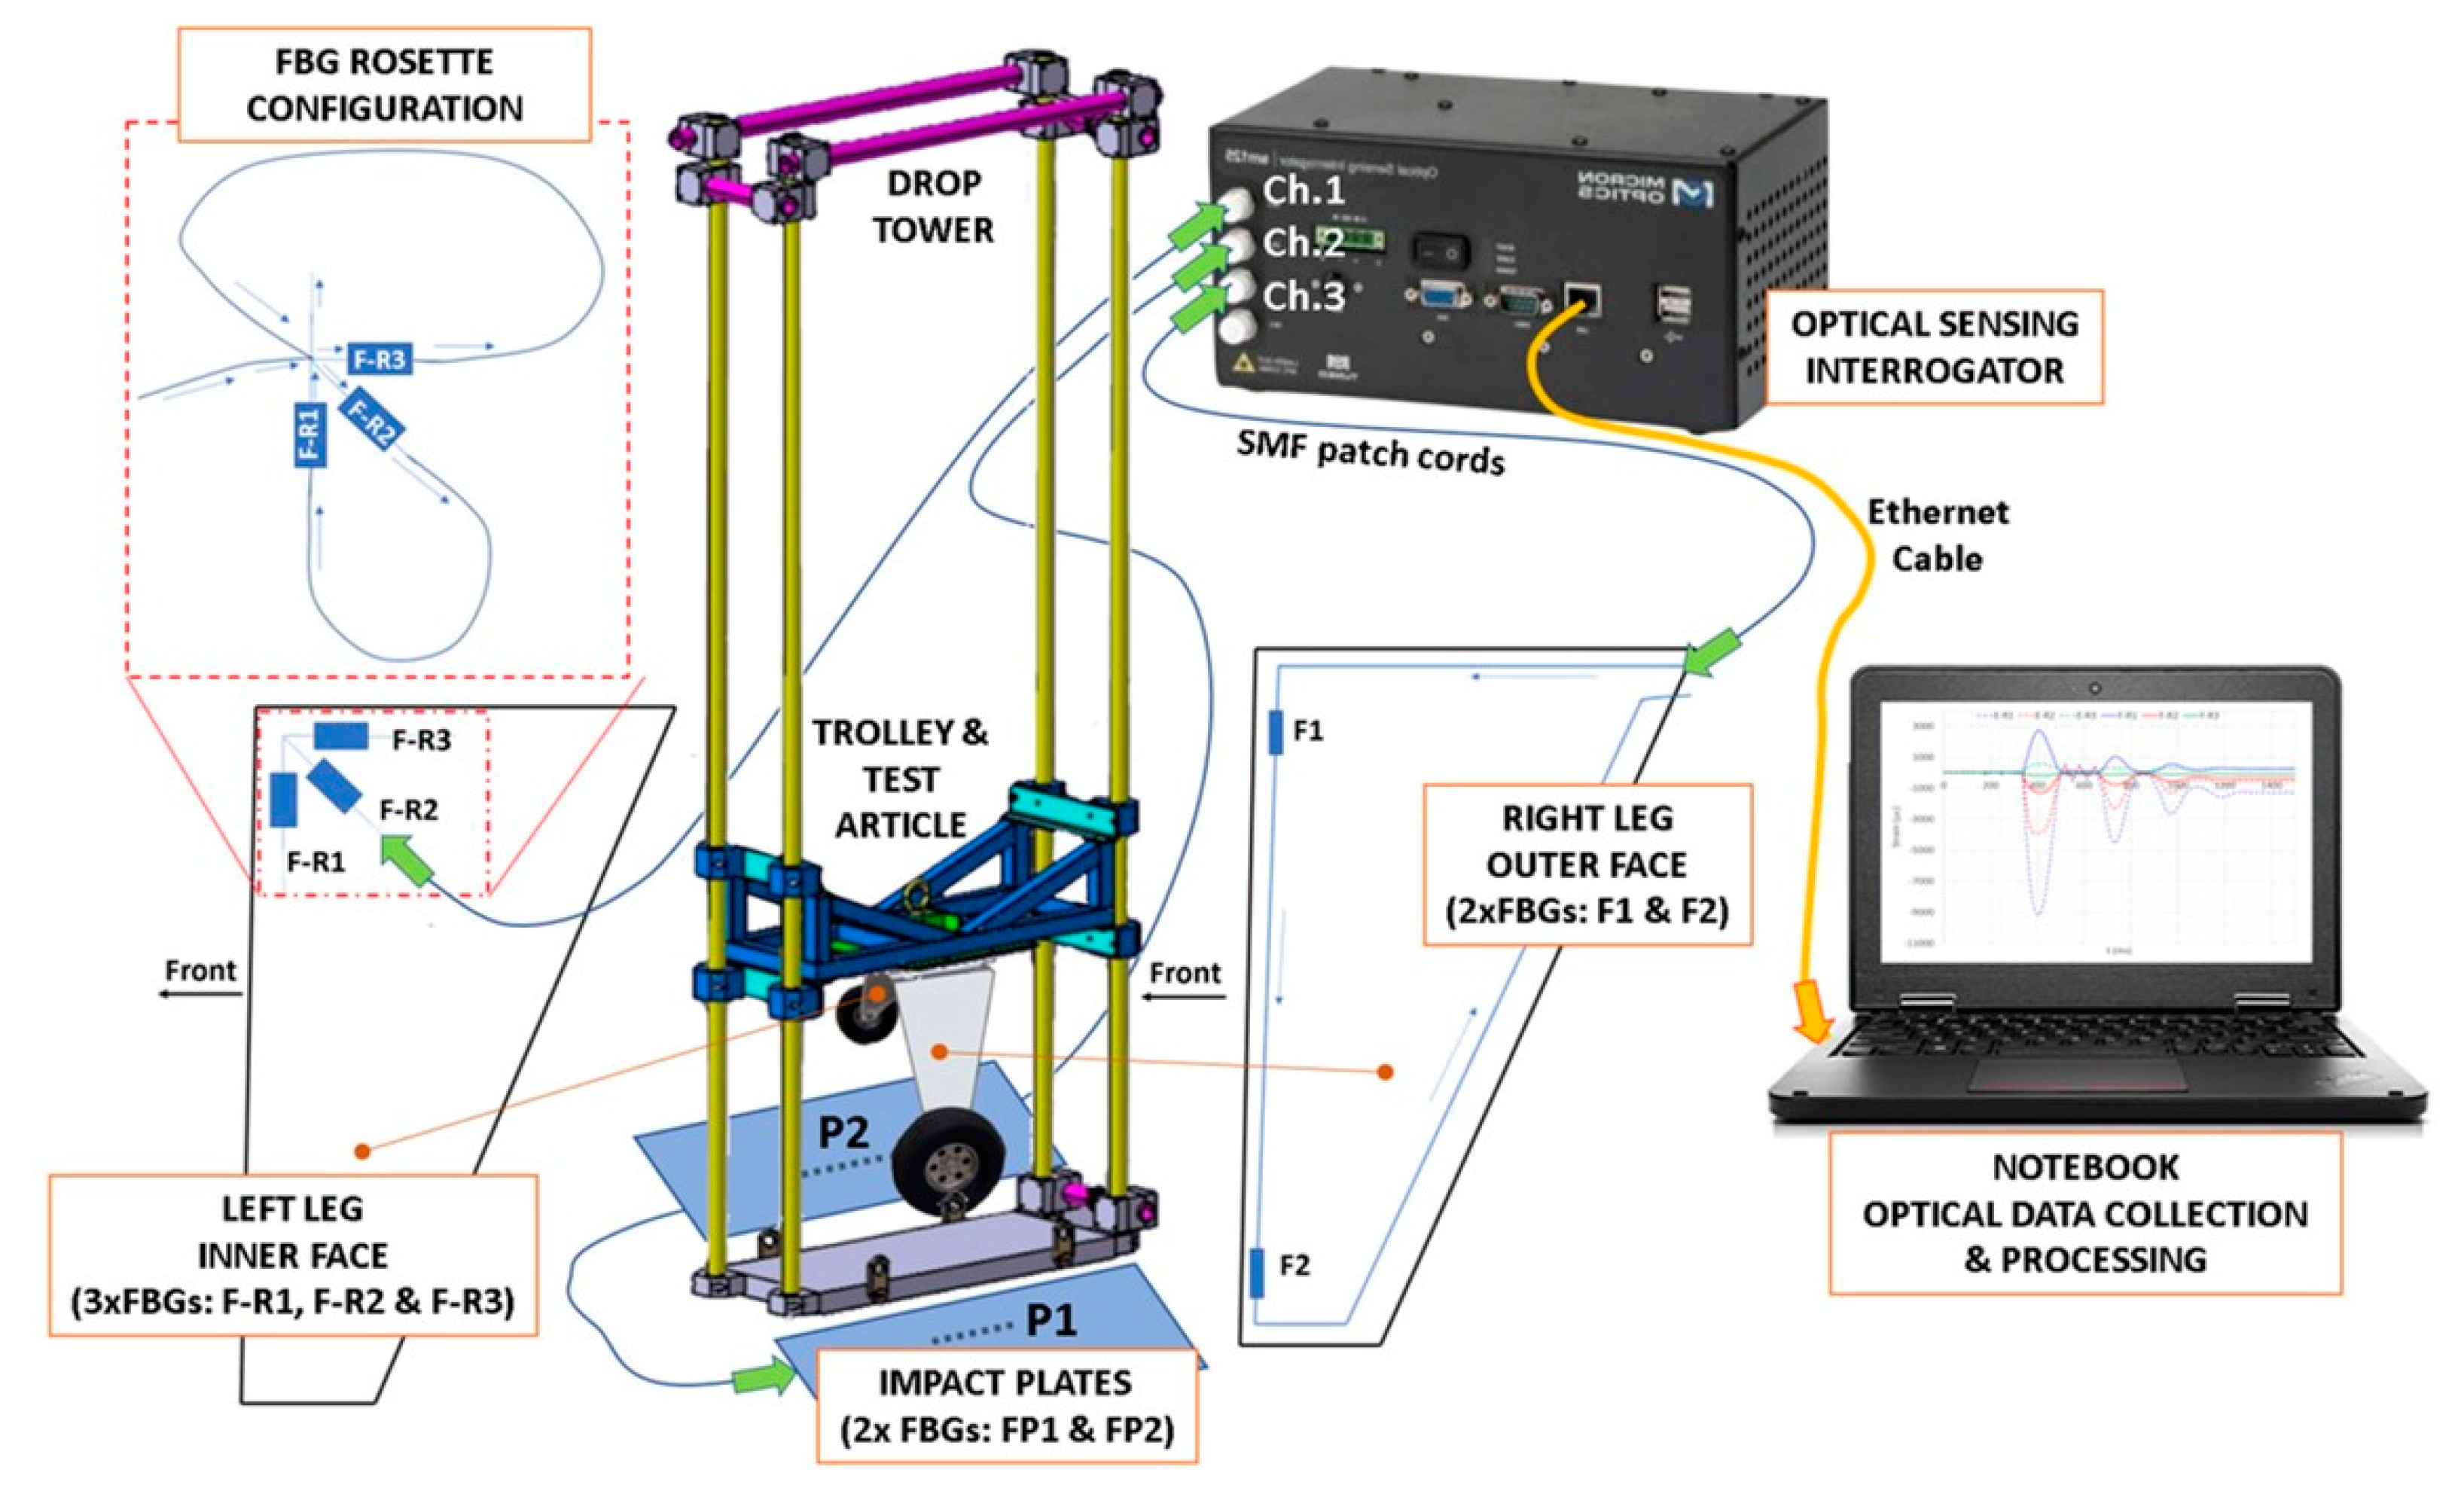
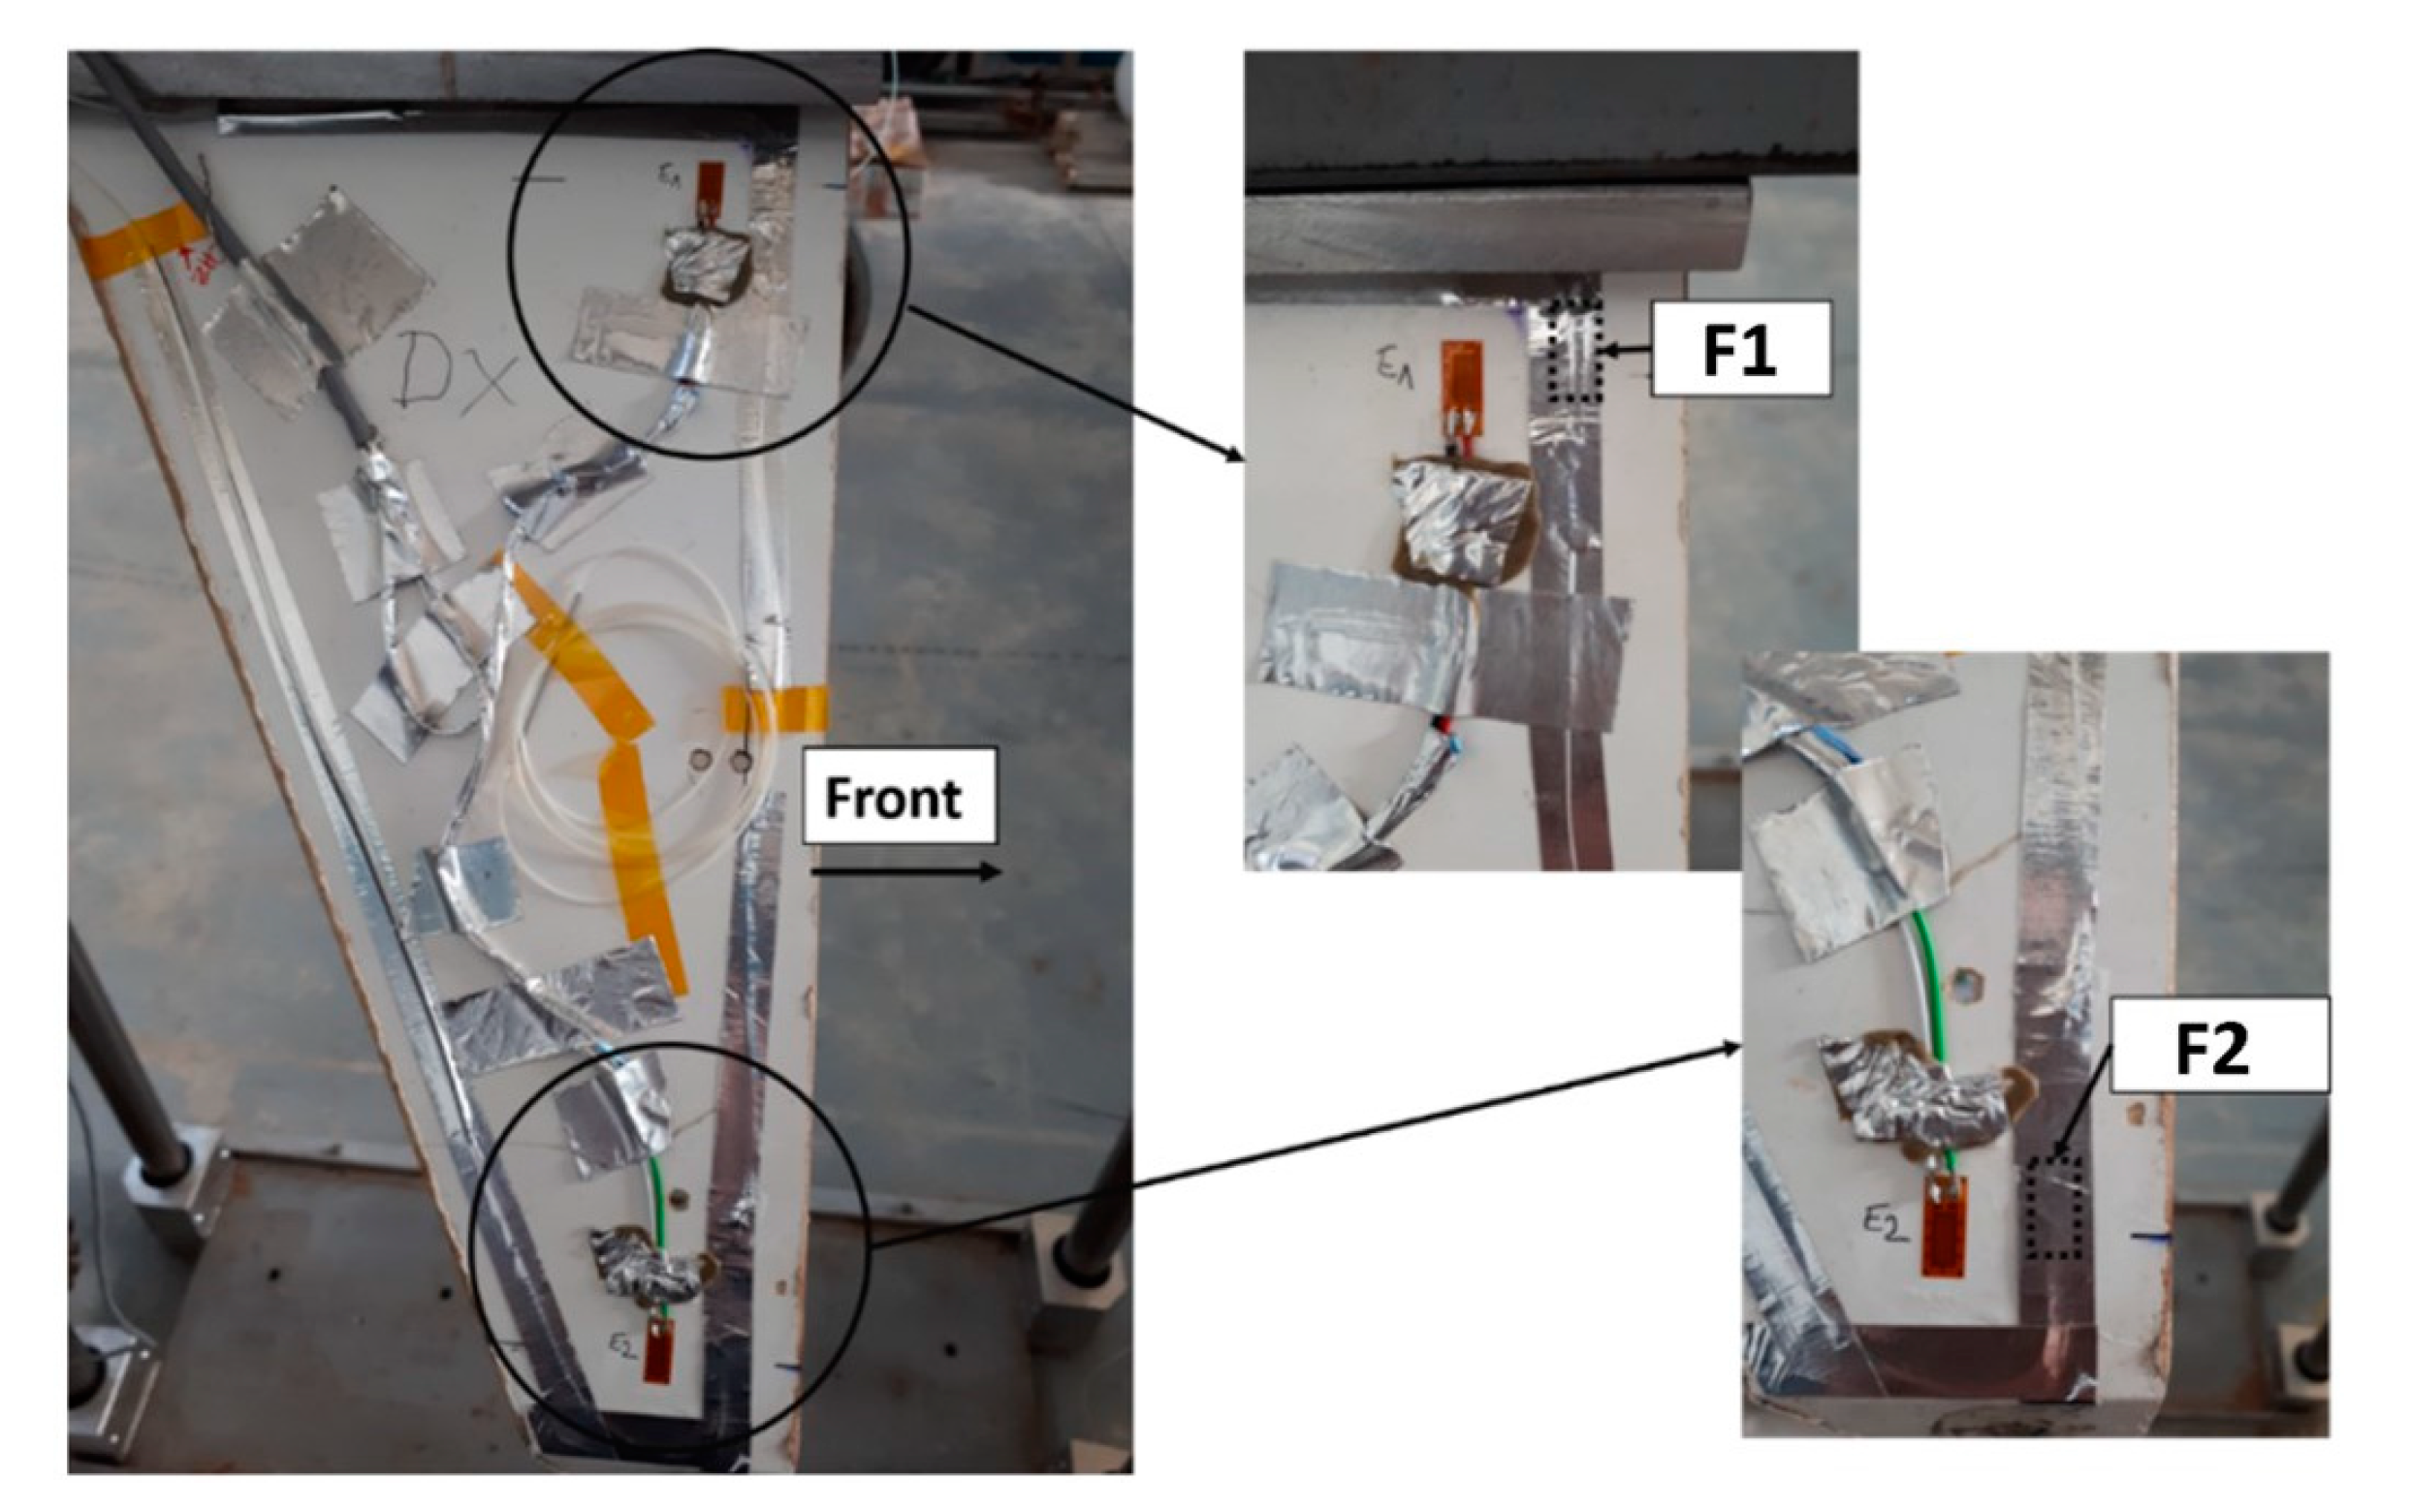
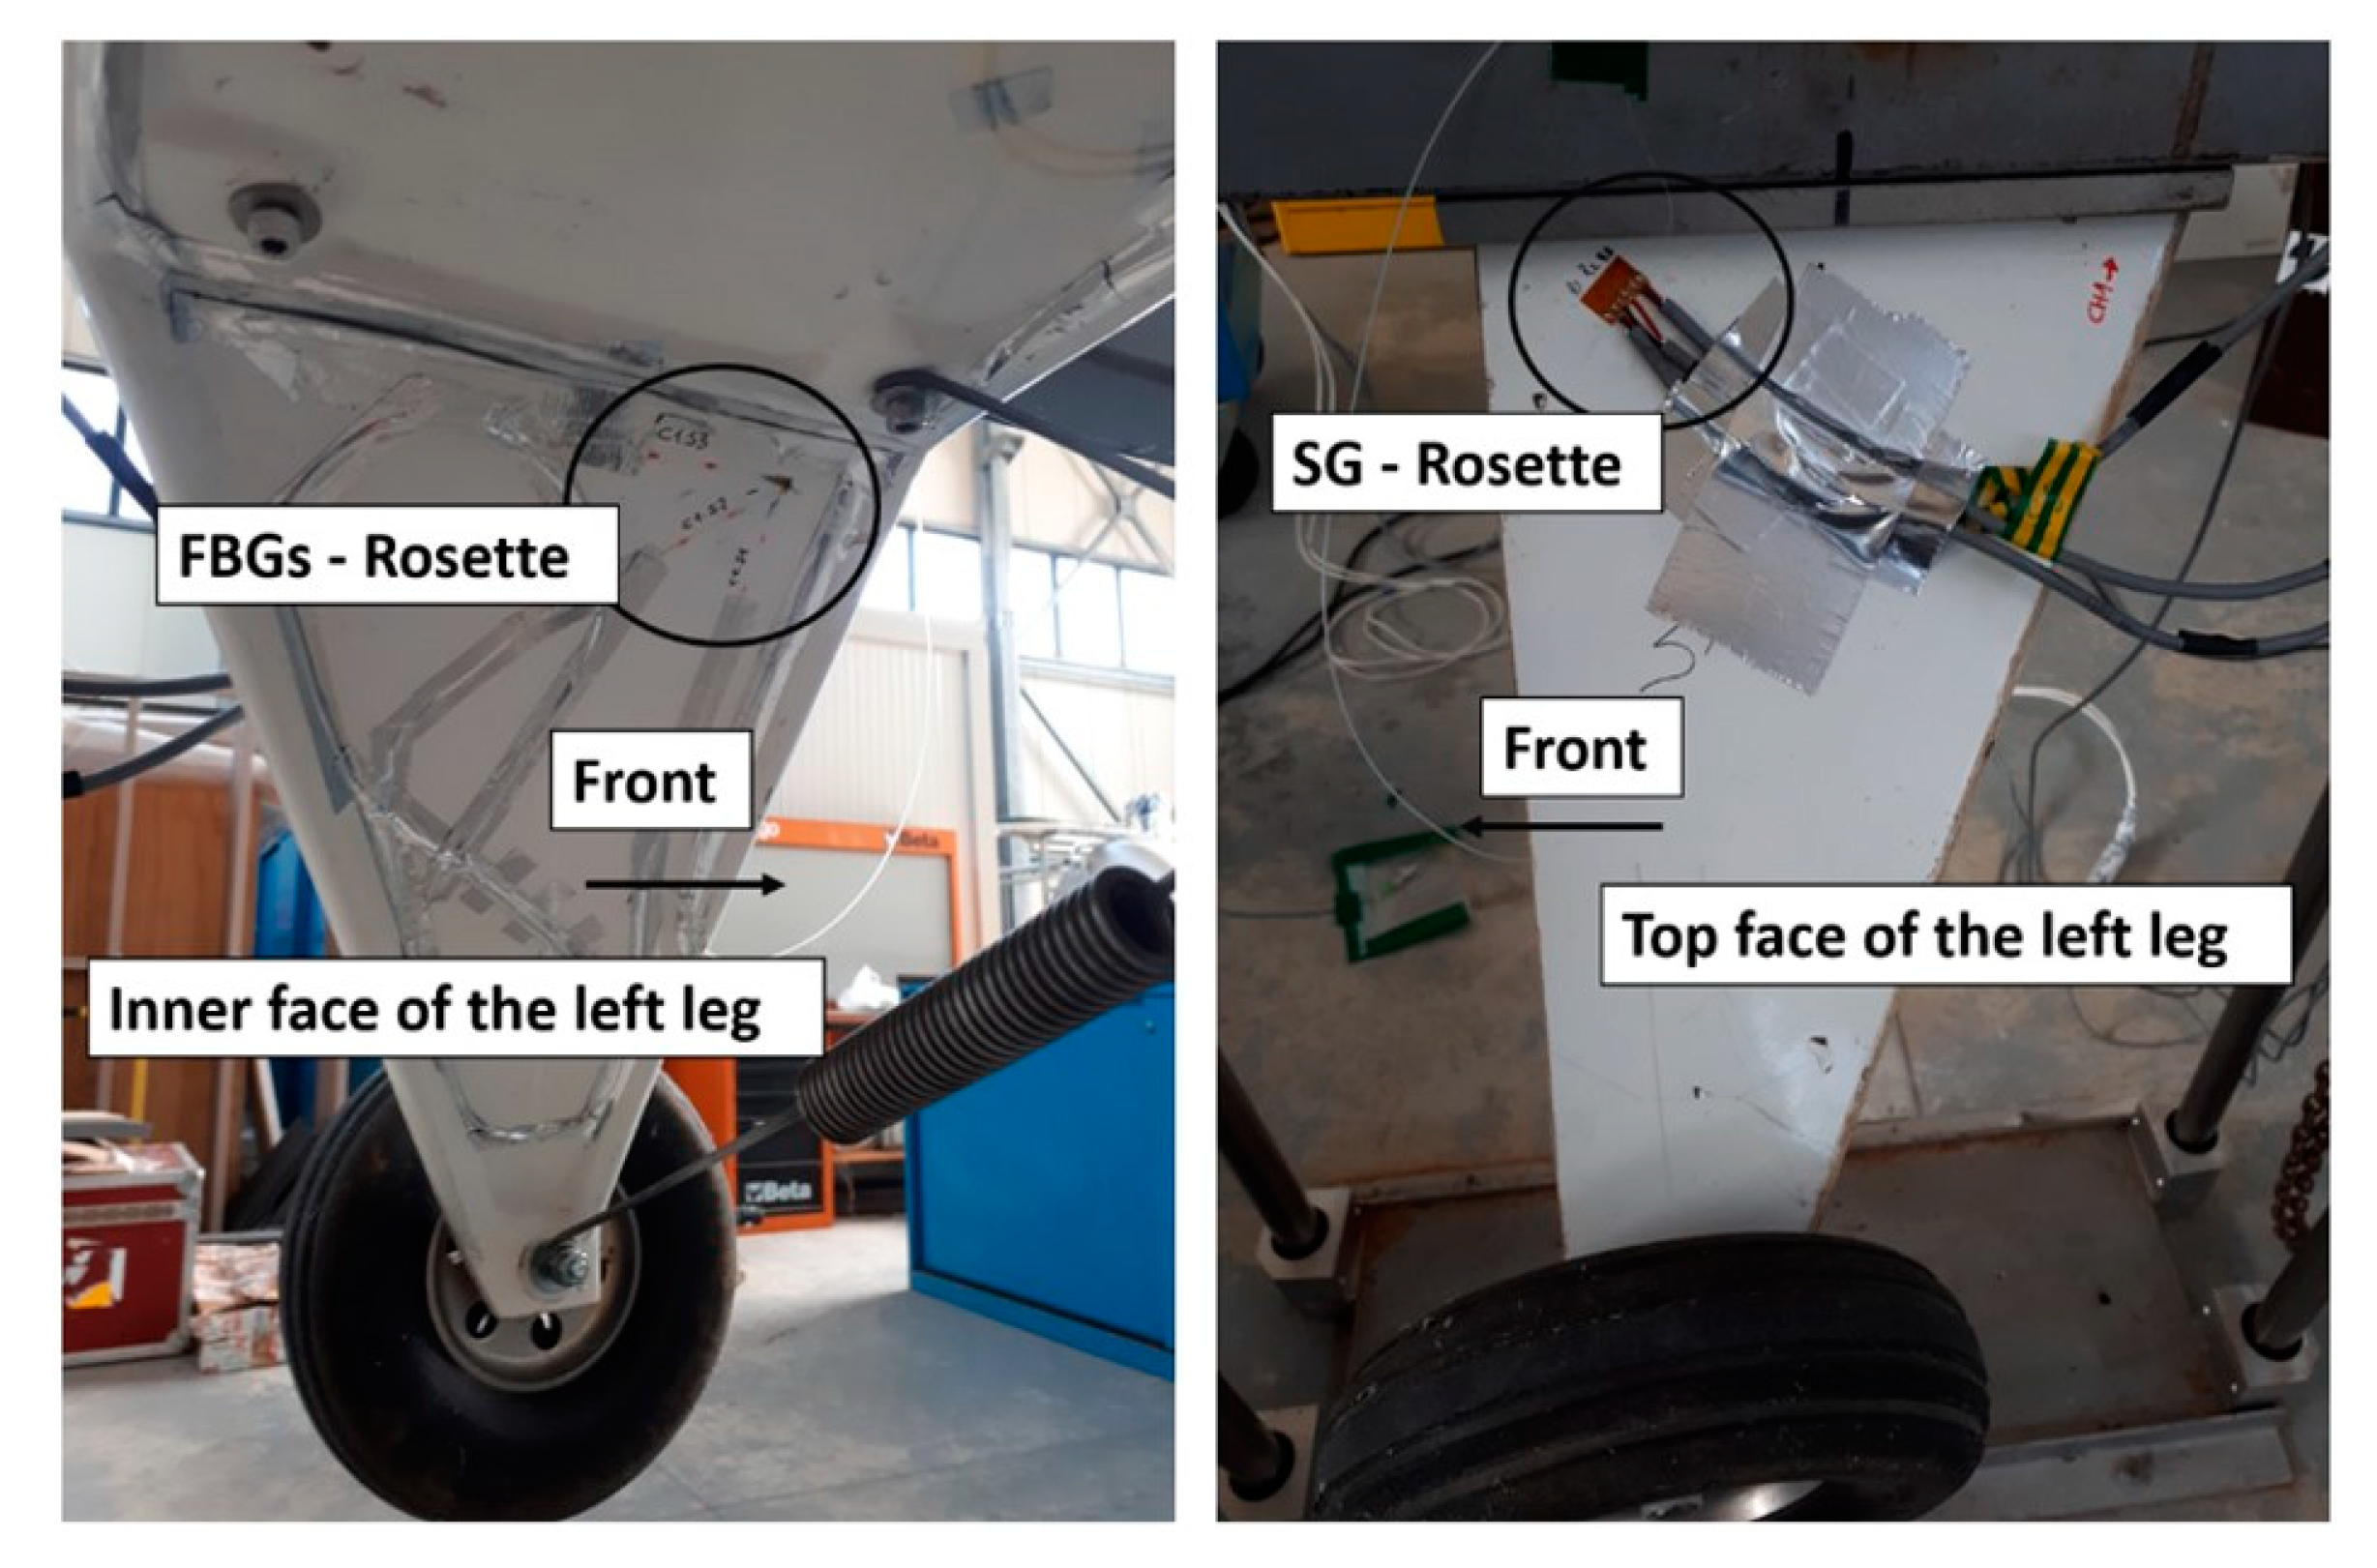
2.4. FBGs and SGs Arrays

Two FBG arrays are integrated in the landing gear, one for each leg. In particular, an array of two FBGs in linear configuration, called F1 and F2, is placed on the top face of the right leg; F1 is installed at the upper part of the leg, while F2 at the bottom and close to the wheel. Three further FBG sensors, called F-R1, F-R2 and F-R3, are placed in a rosette (i.e., a triaxial strain gauge) configuration at 0°, 45° and 90°, respectively, on the inner face of the left leg. F1 and F-R1 are then placed in similar positions on the two legs, and are therefore expected to provide similar signals, although in opposition. The FBG set is completed by a pair of sensors (FP1 and FP2) installed on the impact plates, one for each plate. The test rig is resumed in Figure 7.
The landing gear legs are also equipped with strain gauges (SG) in order to catch signals similar to the ones provided by the FBG sensors. The SG positions are determined by the geometrical configuration and size of the legs, the sensors and the cabling. Two SG sensors, called E1 and E2, are placed on the right leg, close to F1 and F2, respectively (Figure 8). An SG rosette (E-R1, E-R2 and E-R3) is instead located on the left leg, on the opposite face to the one where the FBG rosette is deployed. In fact, due to the bulky cabling of the SG, the two rosettes cannot be placed on the same face (Figure 9). Since the collocation of the two rosettes is not perfect, some misalignments are present; moreover, a frame at the inner part of the leg structure produces a stiffening that can introduce some further discordance between the respective signals. The experiments are carried out in a lab under controlled conditions of temperature (T) and humidity (RH%). Clean and safe test conditions are implemented and assumed. Each test takes a few seconds. For both these reasons, it is possible to avoid thermal compensation. Indeed, the contemporary use of other types of sensors allows further independent comparisons of the achieved results, increasing their confidence. Such lab tests are therefore carried out in a very different environment with respect to the operational one, coherent with the TRL of this phase of investigation (3–4). Accordingly, a typical laboratory bonding process is used, coherent with other different experiments, and performant enough to replicate actual adhesion quality in that environment.

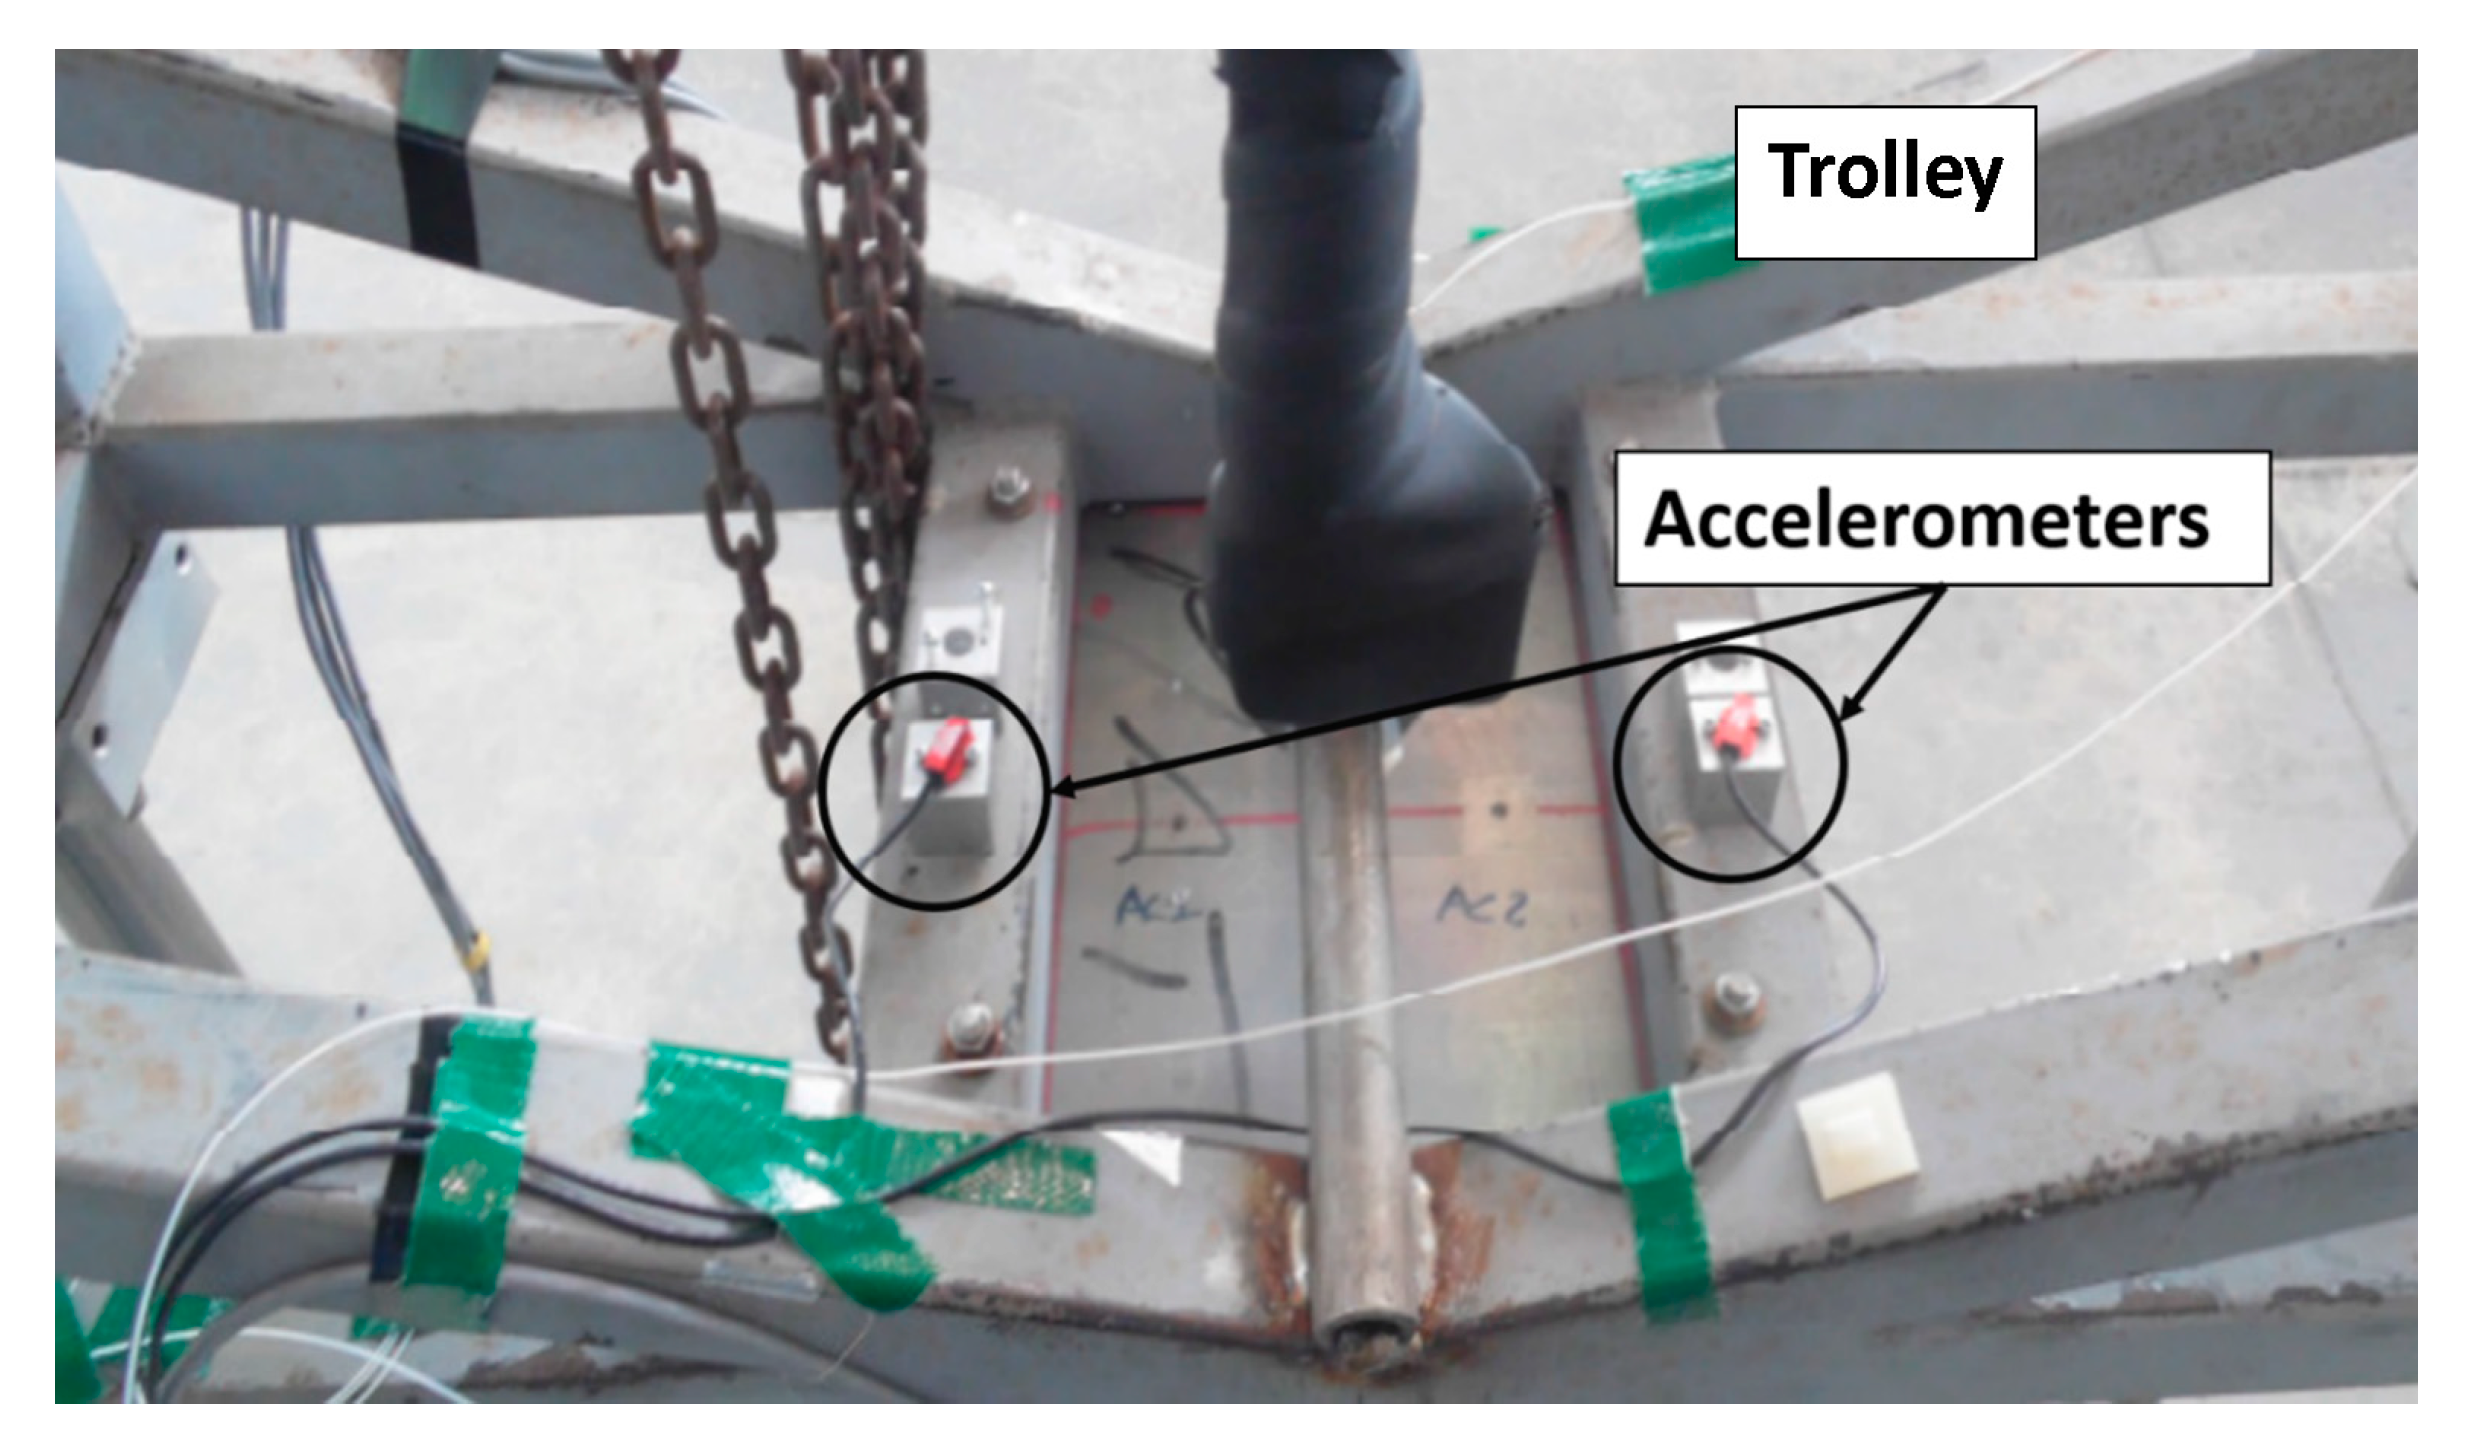
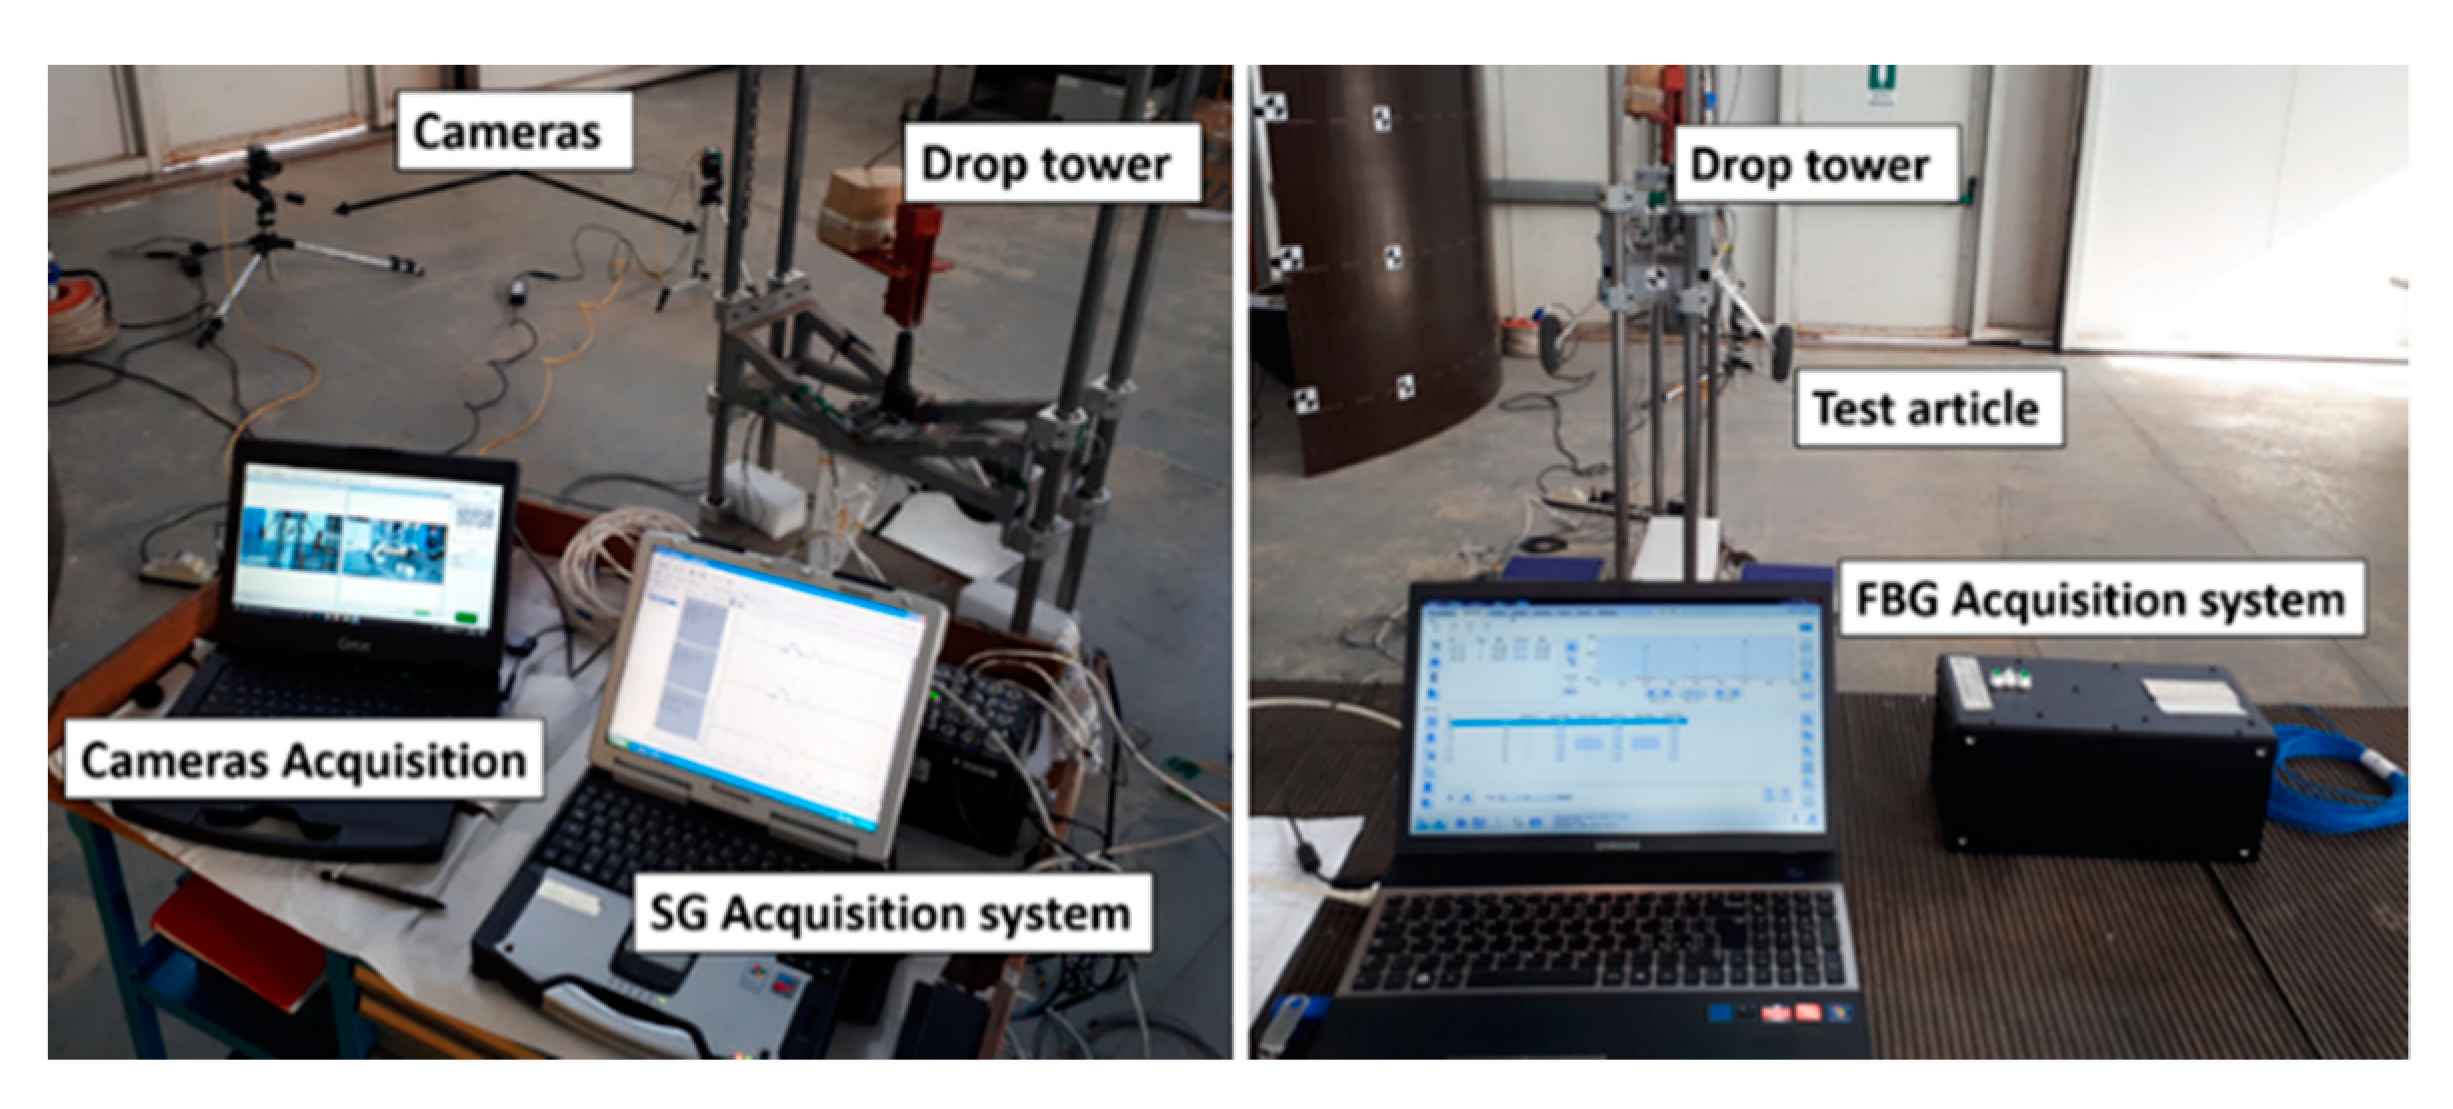
2.5. Acquisition Systems

The FBG signal acquisition system consists of a 4-channel optical interrogator (Micron Optics sm130 Optical Sensing Interrogator) with an acquisition rate of 1 kHz, connected via Ethernet to a PC. An optical fibre is used for each channel, which transmits the signal to and from the FBG sensors integrated on the test article and the impact plates; a total of 3 channels are used, one for each FBG sensor array (Table 1).
Signals from the SG and the accelerometers are acquired by a dedicated system at a 10 kHz sampling rate. In addition, each test is filmed in rear and transverse views with a high-speed camera system, the Phantom MIRO C210 at 1000 fps (Figure 10 and Figure 11).

3. Results

3.1. Generalities

In order to assess the ability of the FBG sensors to monitor the LG structural strains at different impact velocities up to 2 m/s, drop tests are carried out by placing the landing gear at the generic height “h” (Figure 12), measured from the bottom wheels to the grounded plates. The impact speed is evaluated as any tire touches their surface.
At each drop test, the landing gear falls freely as it is released by a dedicated device and finally impacts the plates. Then, it bounces and the cycle (free fall, impact and rebound) is repeated until the mechanical energy is completely dissipated (Figure 13). Since the cameras film the test article from behind (Figure 11), impact plates 1 and 2 are shown on the right and the left of the reported photograms, respectively.
The typical signal trends of the two accelerometers mounted on the trolley, and the two FBGs bonded to the impact plates clearly point out the different phases shown above (Figure 14 and Figure 15).

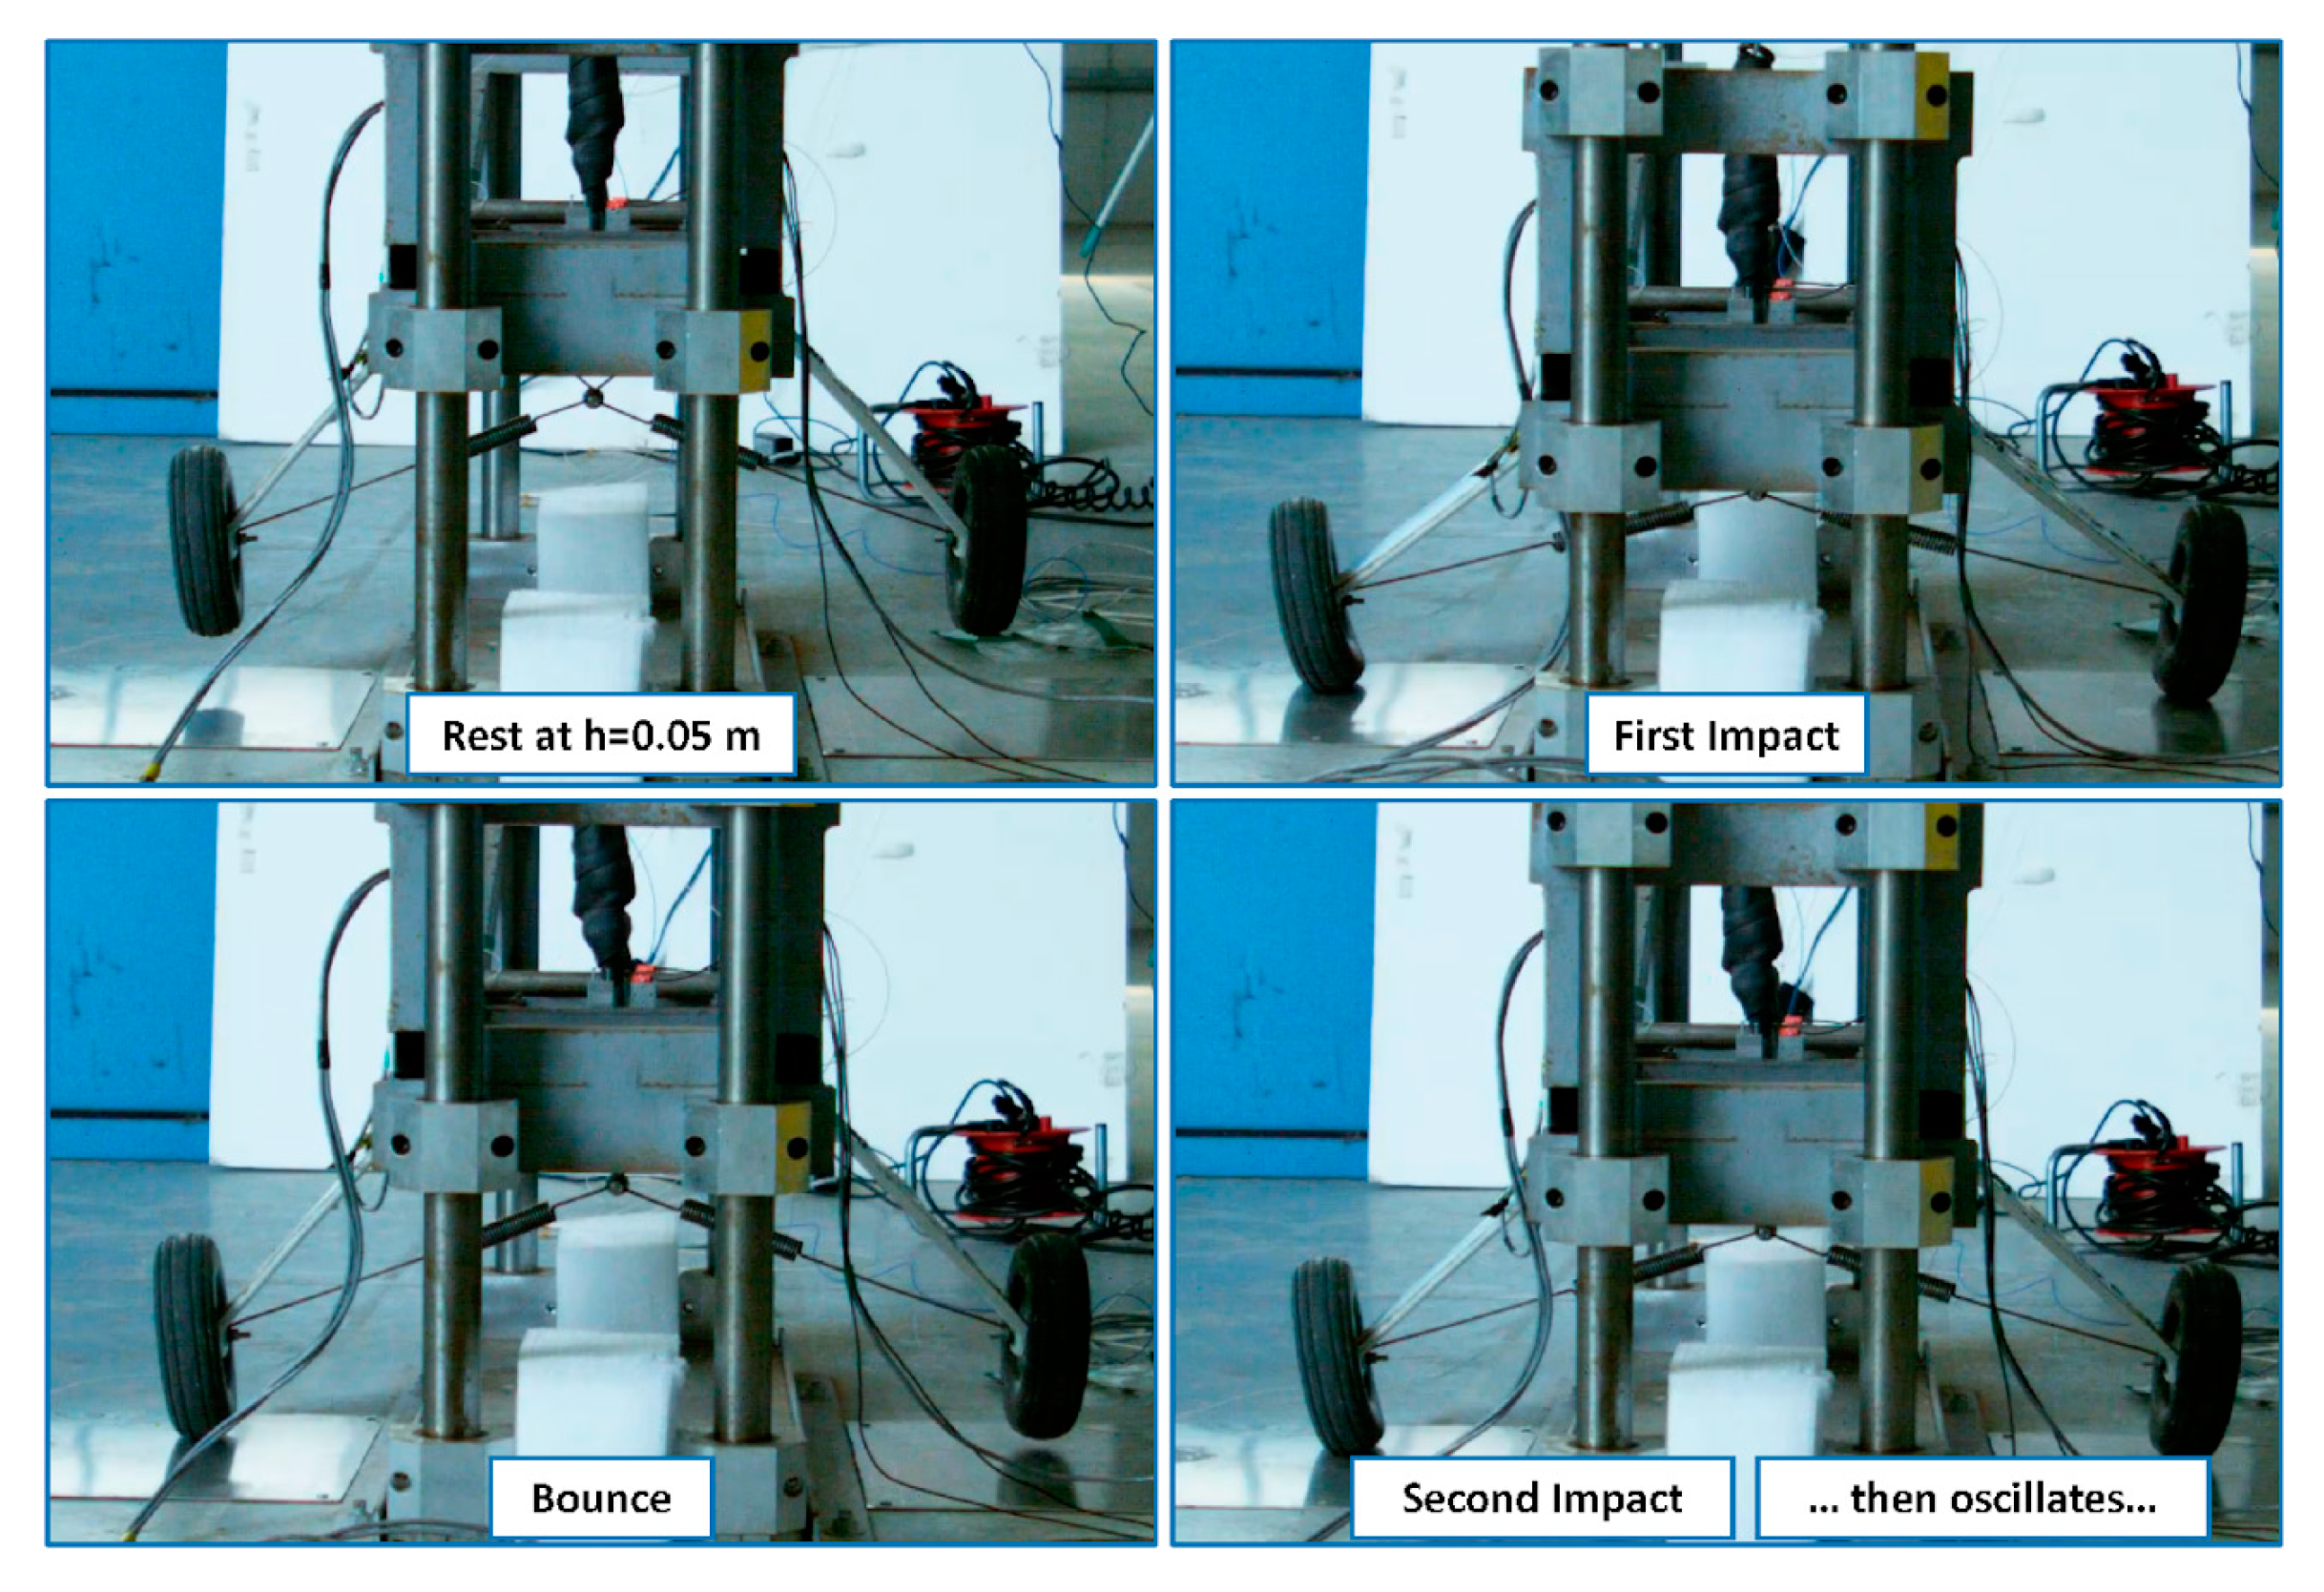
3.2. Elementary Kinematics

As the test article falls from the generic height h, moving from rest, its gravitational potential energy (U = mgh) is gradually converted to kinetic energy (K = ½ mv2). The application of the energy conservation principle allows the prediction of the impact velocity as follows:
v = 2 gh
Classical kinematics equations for uniformly accelerated motion permit us to compute the freefall period, i.e., the time interval elapsed from the fall start to the impact as follows:
t = v g
The dropping heights, corresponding impact velocities and free fall times are listed in Table 2. There, the theoretical time calculated through Equation (4), the theoretical free fall time (TFFT), is compared with the respective experimental value, the experimental free fall time (EFFT), which is detected by elaborating the signals provided by the accelerometers installed on the trolley.

3.3. Data Extraction

In the accelerometer graphs (Figure 14), the free fall segment is quite evident. After a first (short) phase during which the signal is characterized by the power line frequency noise at 50 Hz, it steps to the value of 1 g (plus noise) at the instant of release (drop) and jumps to an ordinary signal track, characterized by a periodical-like oscillation until the first rebound (Figure 13). Things are a bit different as the signals derived from the FBG mounted on the impact plates are analysed (Figure 15). In that case, the signal is flat until the touchdown; then, structural oscillations are detected, obtaining a further impulse at the second rebound until the complete elastic energy dissipation is attained.

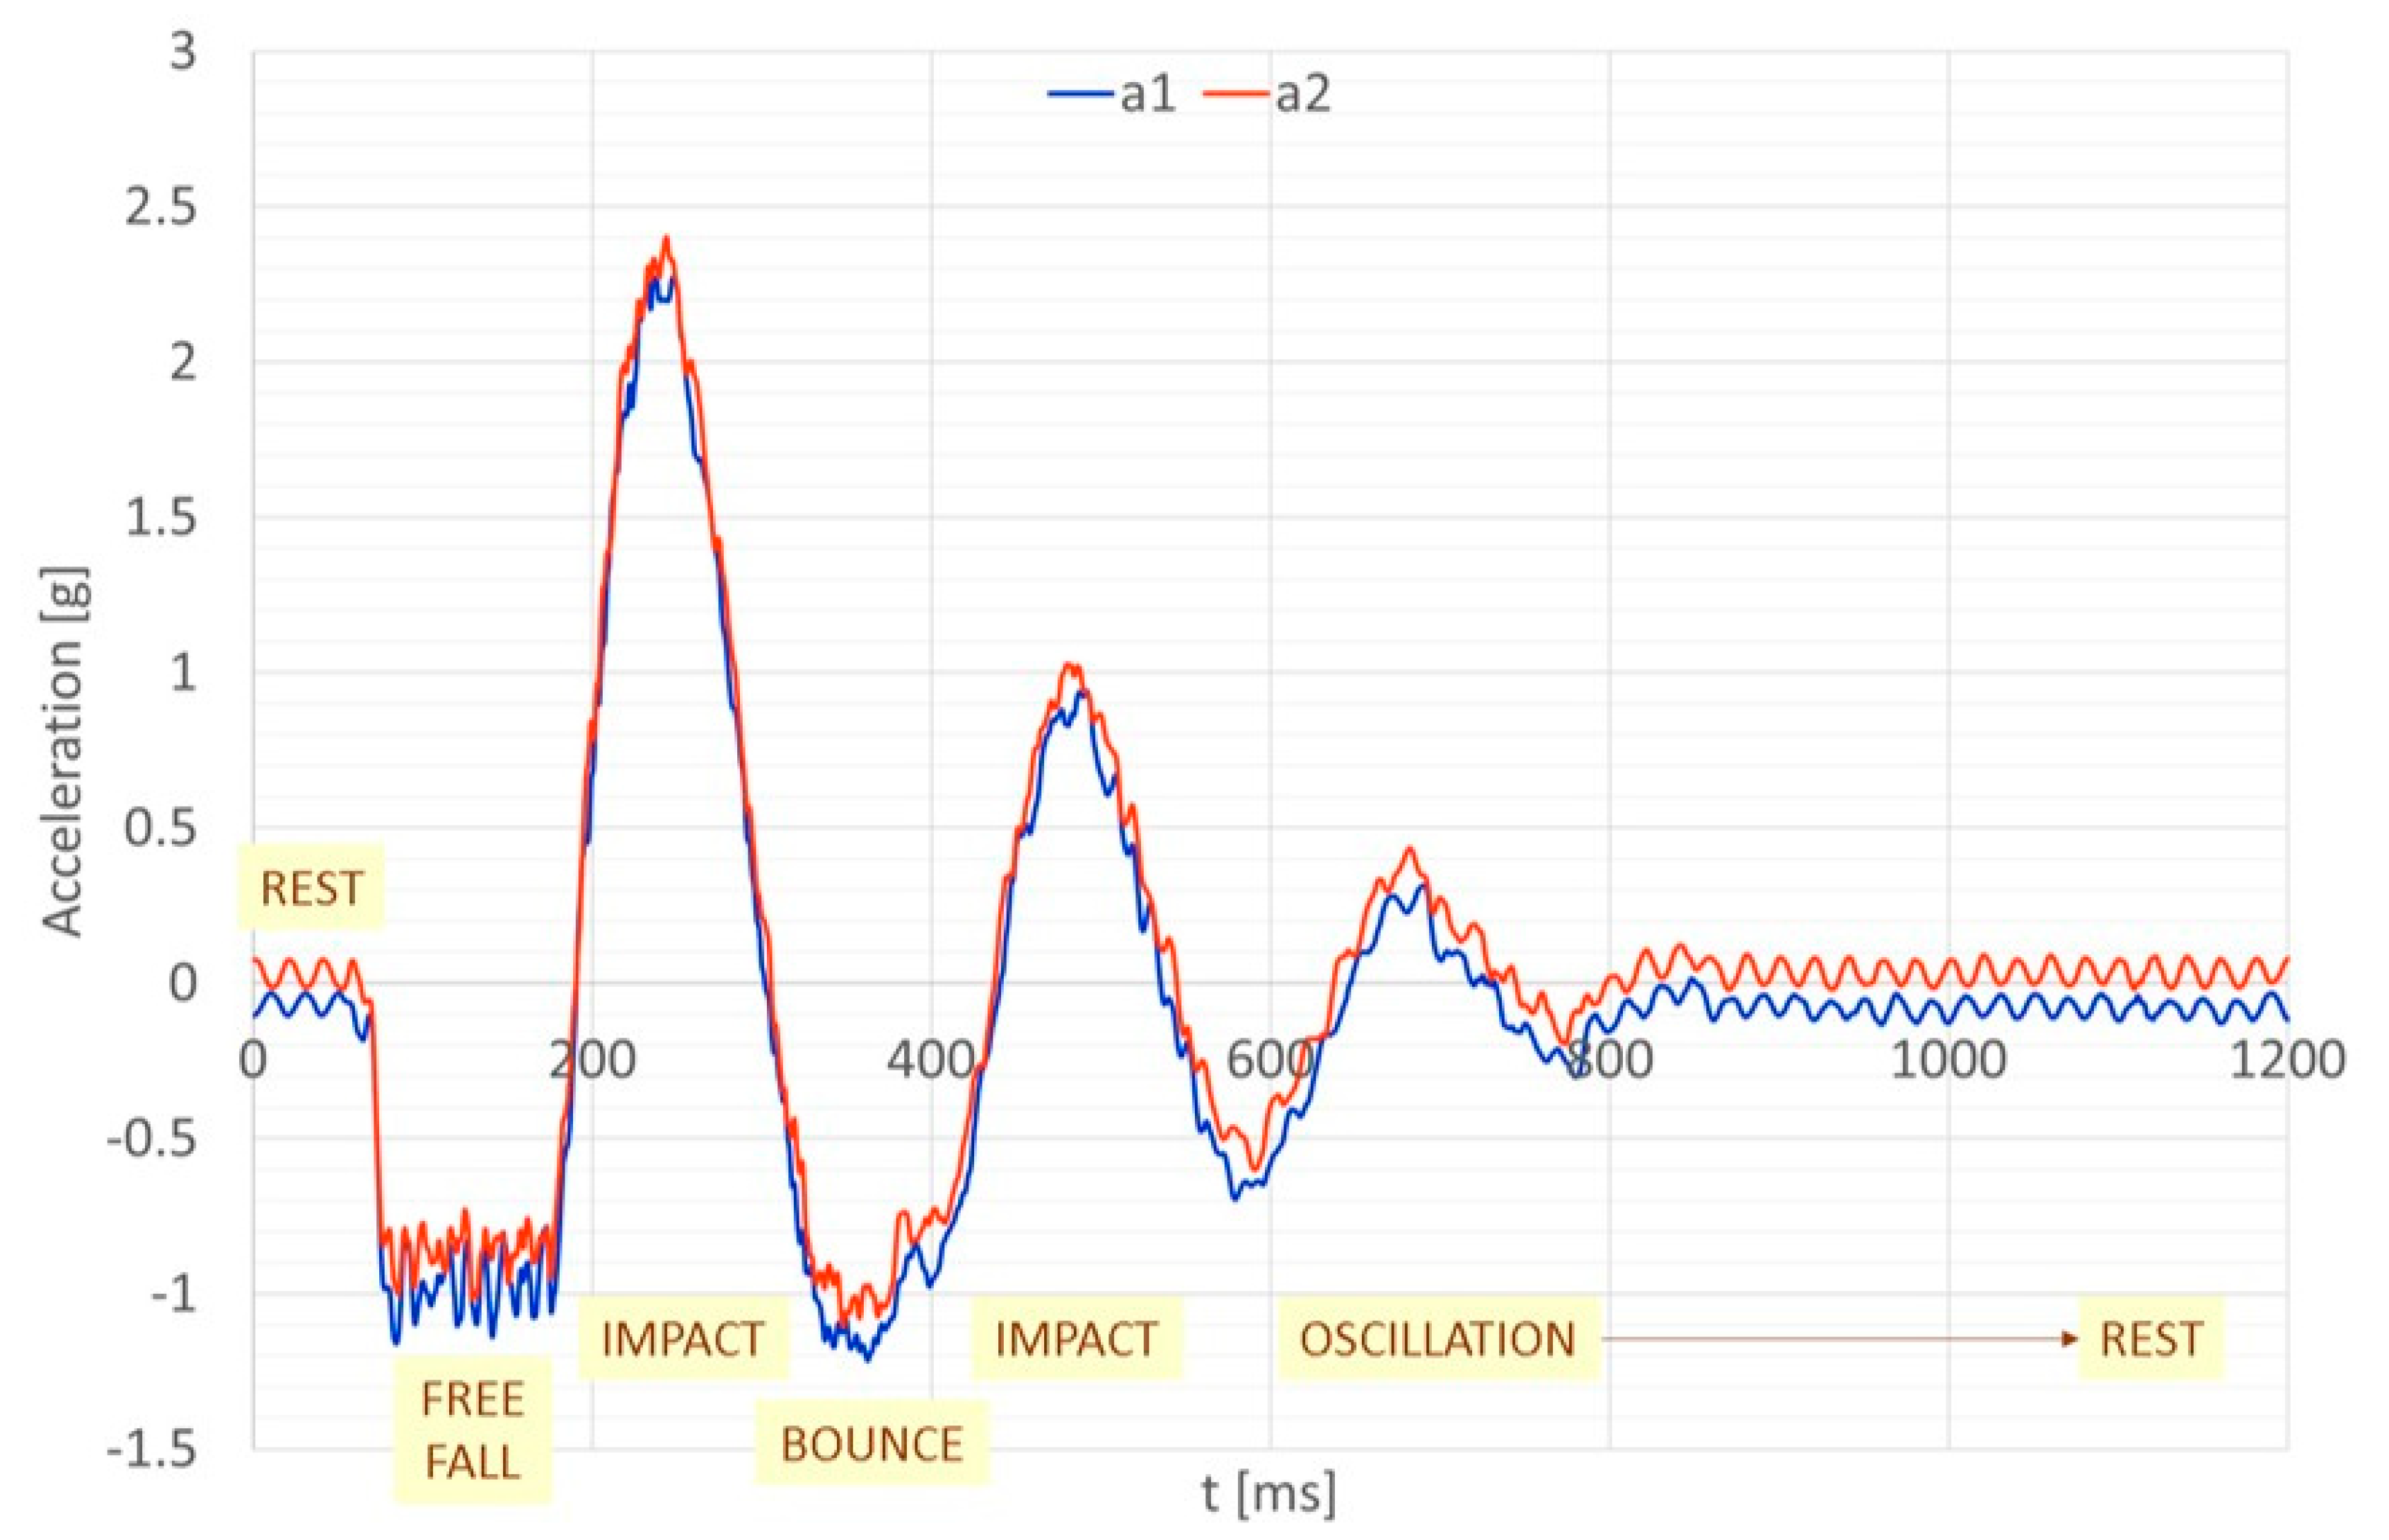
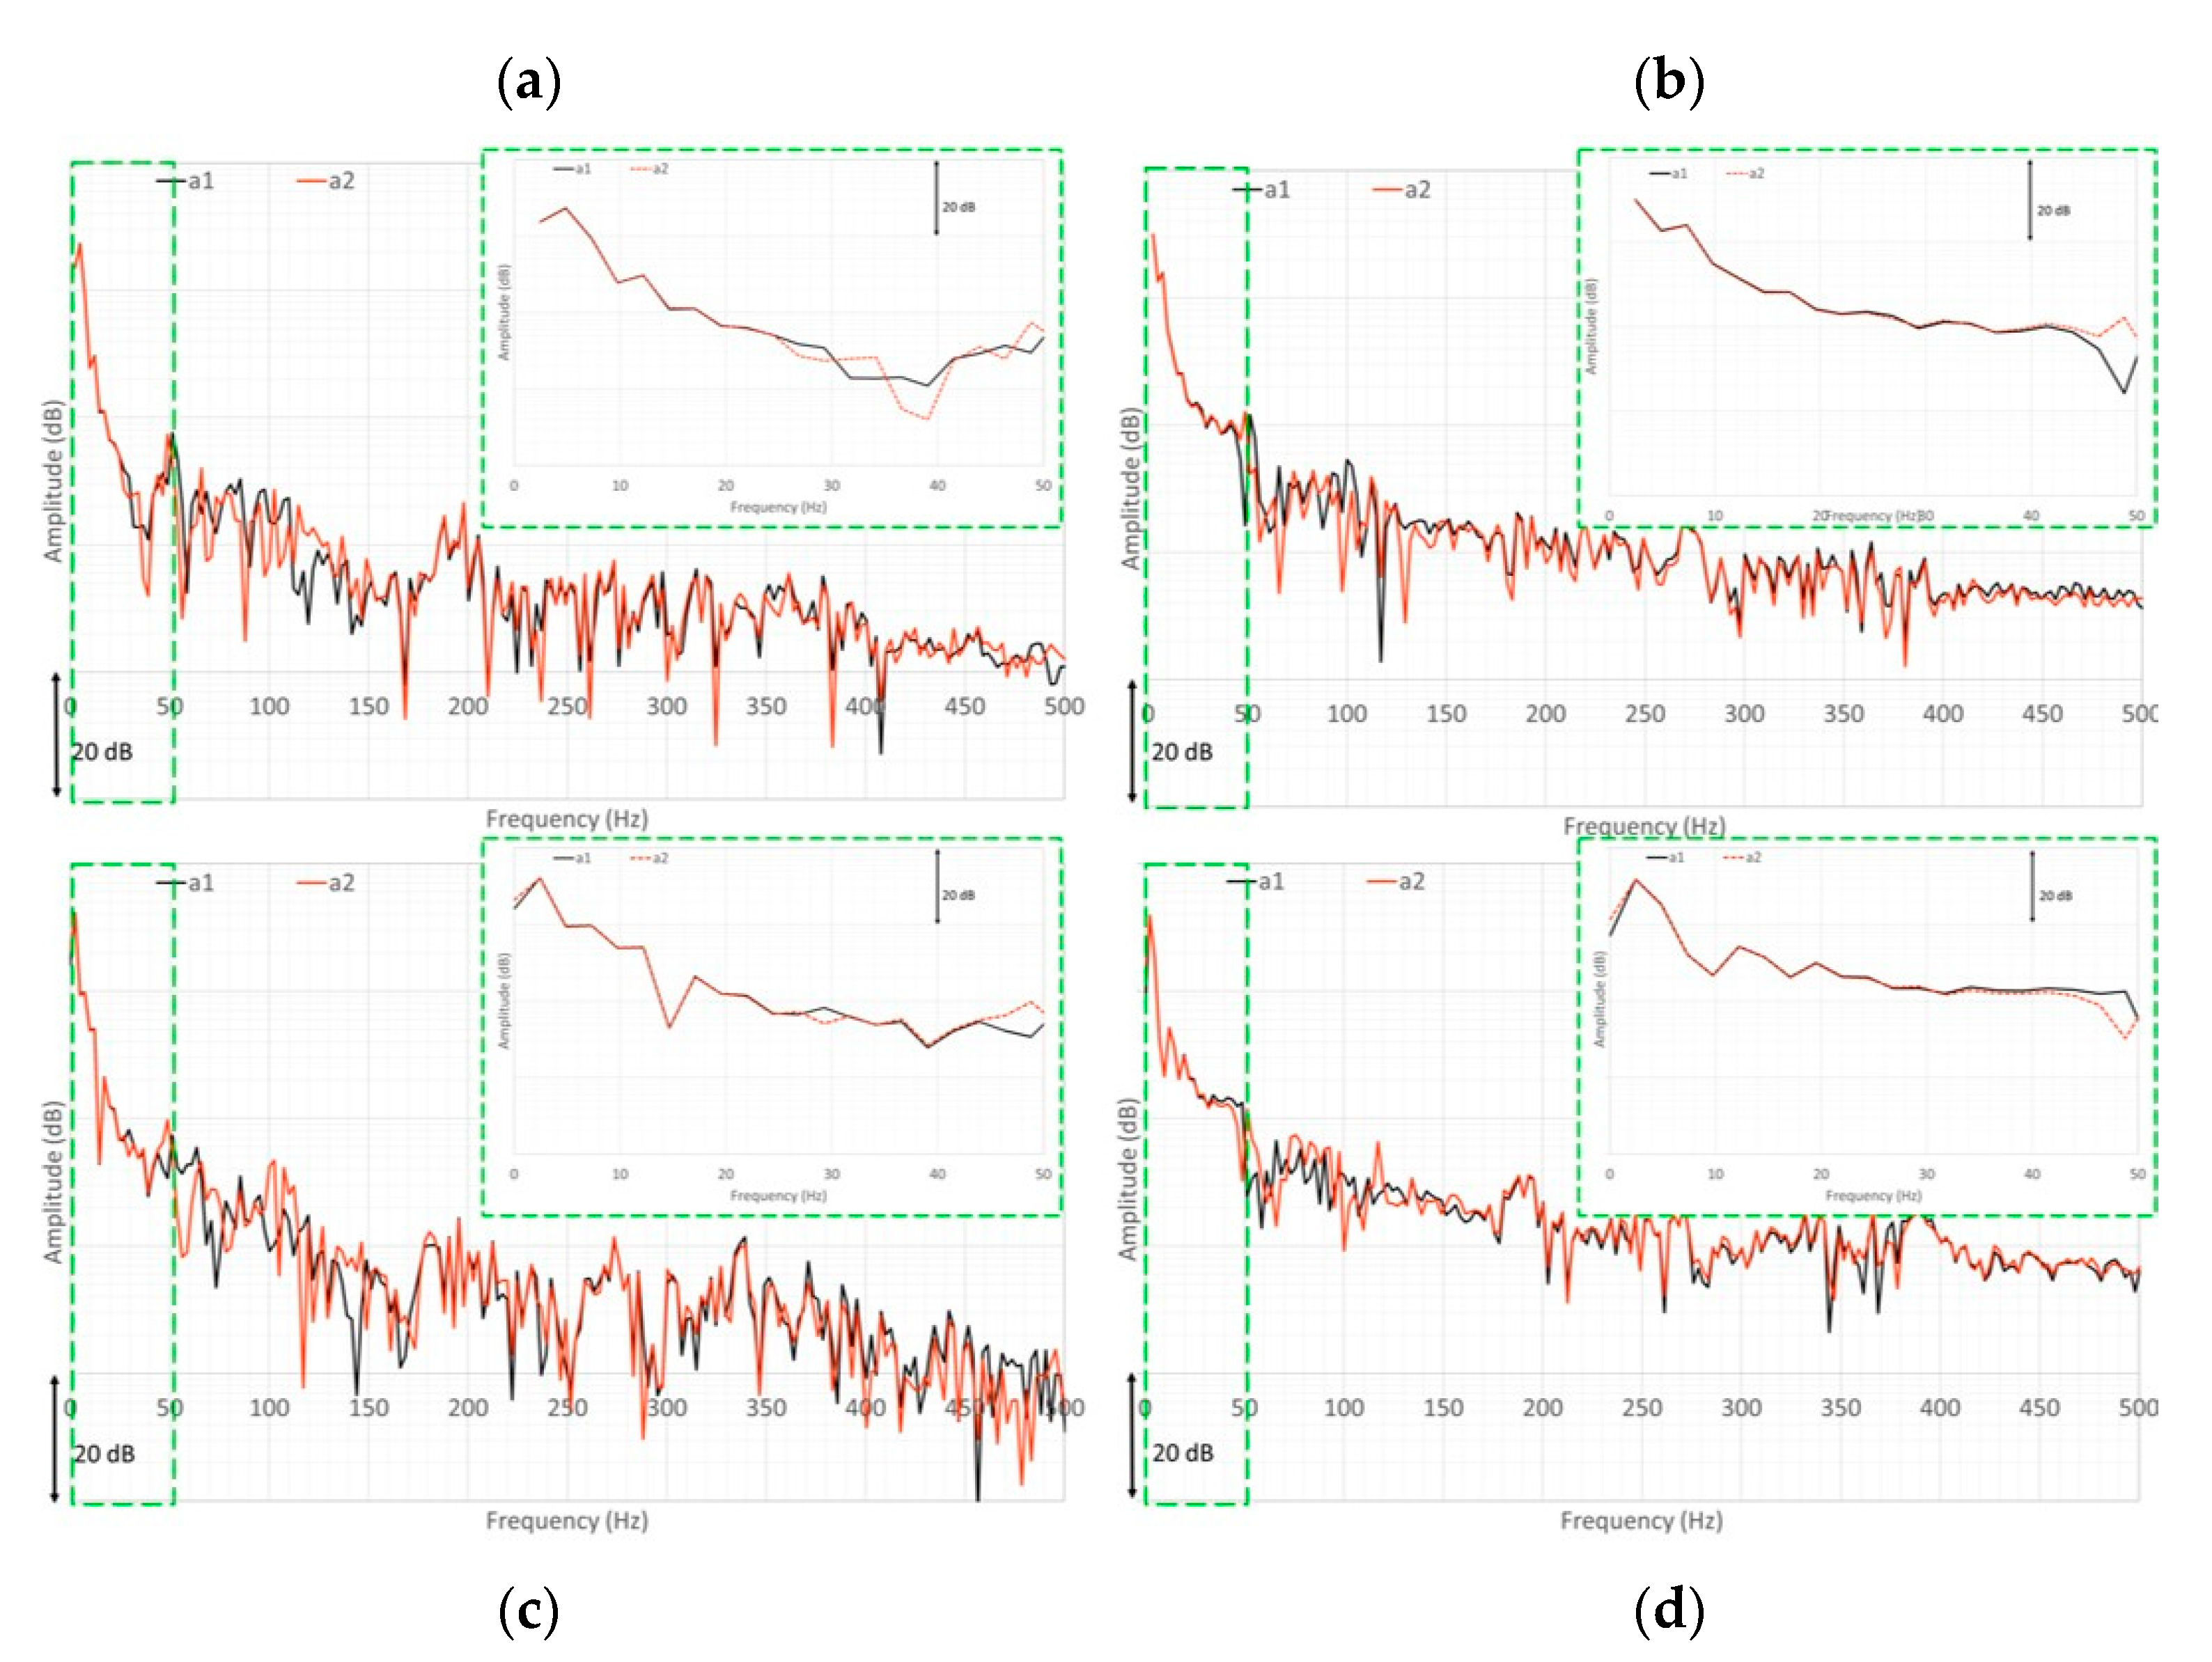
3.4. Accelerometer Signals

The trends shown in Figure 14 and Figure 15 are repeated for the four starting heights. As the drop height is increased, the accelerometer plots show an augmented amplitude of the curves indicating the first impact, rebound, and subsequent impacts (Figure 16 and Figure 17). The impact transforms kinetic energy into elastic energy, transferred to the test article and to the plates (Figure 18). At the impact, the elastic energy mainly activates the first mode of the structural system made of the test article and the trolley, corresponding to a simple supported configuration (i.e., the system pinned on the tires), generating the first curve peaks. The eigenmode is characterized by the vertical movement of the mass system made of the landing gear and the installation plate, oscillating over the two legs, which work as concentrated springs. Such a behaviour may be detected by both the accelerometers and the FBG. After the first rebound, the first mode of the free-free structural system is instead activated, dominated by the oscillations of the two legs of the test article. In this case, the two systems work as clamped beams, each with a concentrated mass at the free end (tire structure). This phenomenon is repeated almost perfectly for the four cases analysed herein (Figure 16). First, the supported mode oscillations do refer to the larger amplitude curve, and they are repeated for the subsequent rebounds. Along the main outline, further oscillations may be observed, characteristic of the higher modes for the same configurations (region A). This same behaviour may be detected for the free-free modes (rebound, i.e., as the test article is in a free-flight condition, as it does not interact with the ground), where the dominant curve outline does present further oscillations related to the high-order eigenvalues (region B). The impact time may be preliminarily estimated as half the period of the first vibration mode (system pinned at the tires).
As a consequence of the produced statements, the first region (A, impact time) should have the same duration, irrespective of the rebound sequence (first impact, second rebound, and so on), and should be independent of the fall height. This occurrence is confirmed by the analysis of the accelerometer time histories. Instead, the free rebound time shall be strongly dependent on the energy that is accumulated and that determines the free travel of the system (i.e., the period along which it is detached from the ground). Such a period is expected to be strongly dependent on the fall height and on the rebound series (first impact, second rebound, and so on). Even this intuitive phenomenon is confirmed by the analysis of the graphs. For a better visualization of the mentioned dynamics, the curves have been superposed in Figure 17; for the sake of clarity, the comparison among the falls from the four different heights are reported for a single accelerometer (a1). The equivalent system viscous damping, which can be roughly estimated through the measure of the half-life of the oscillation, results are independent of the fall height, confirming that the system is linear within the observed domain [37].

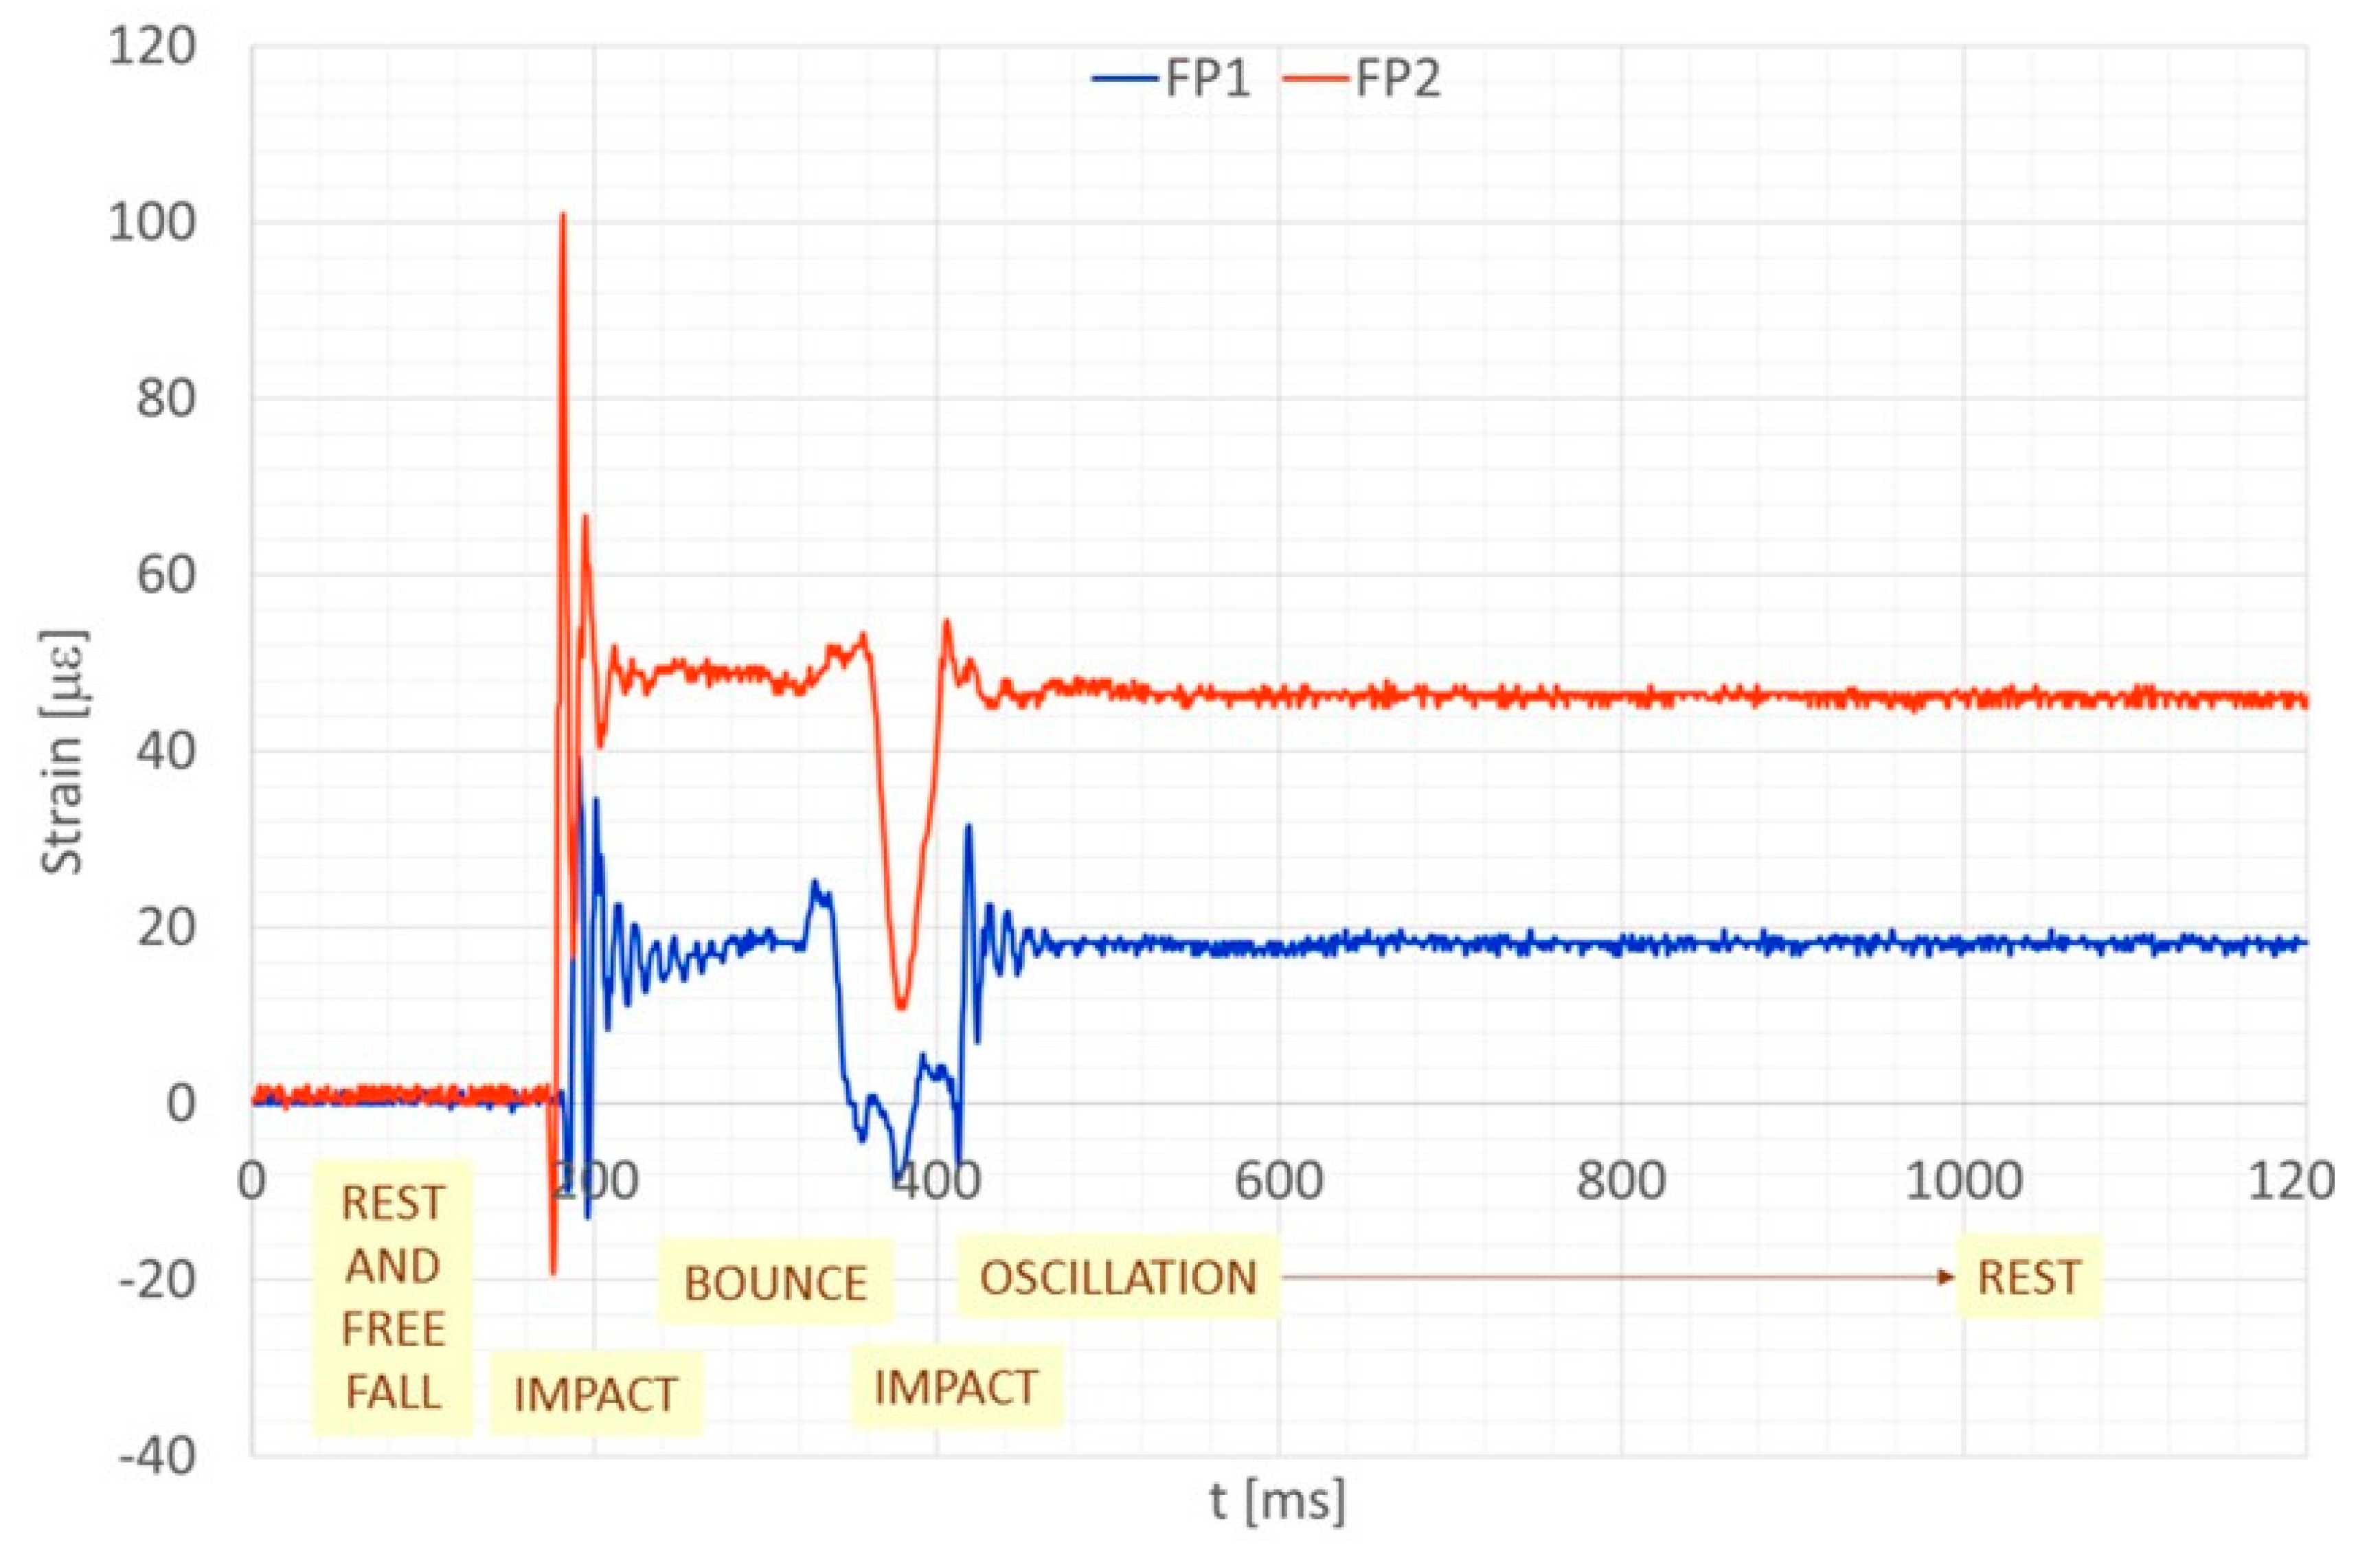
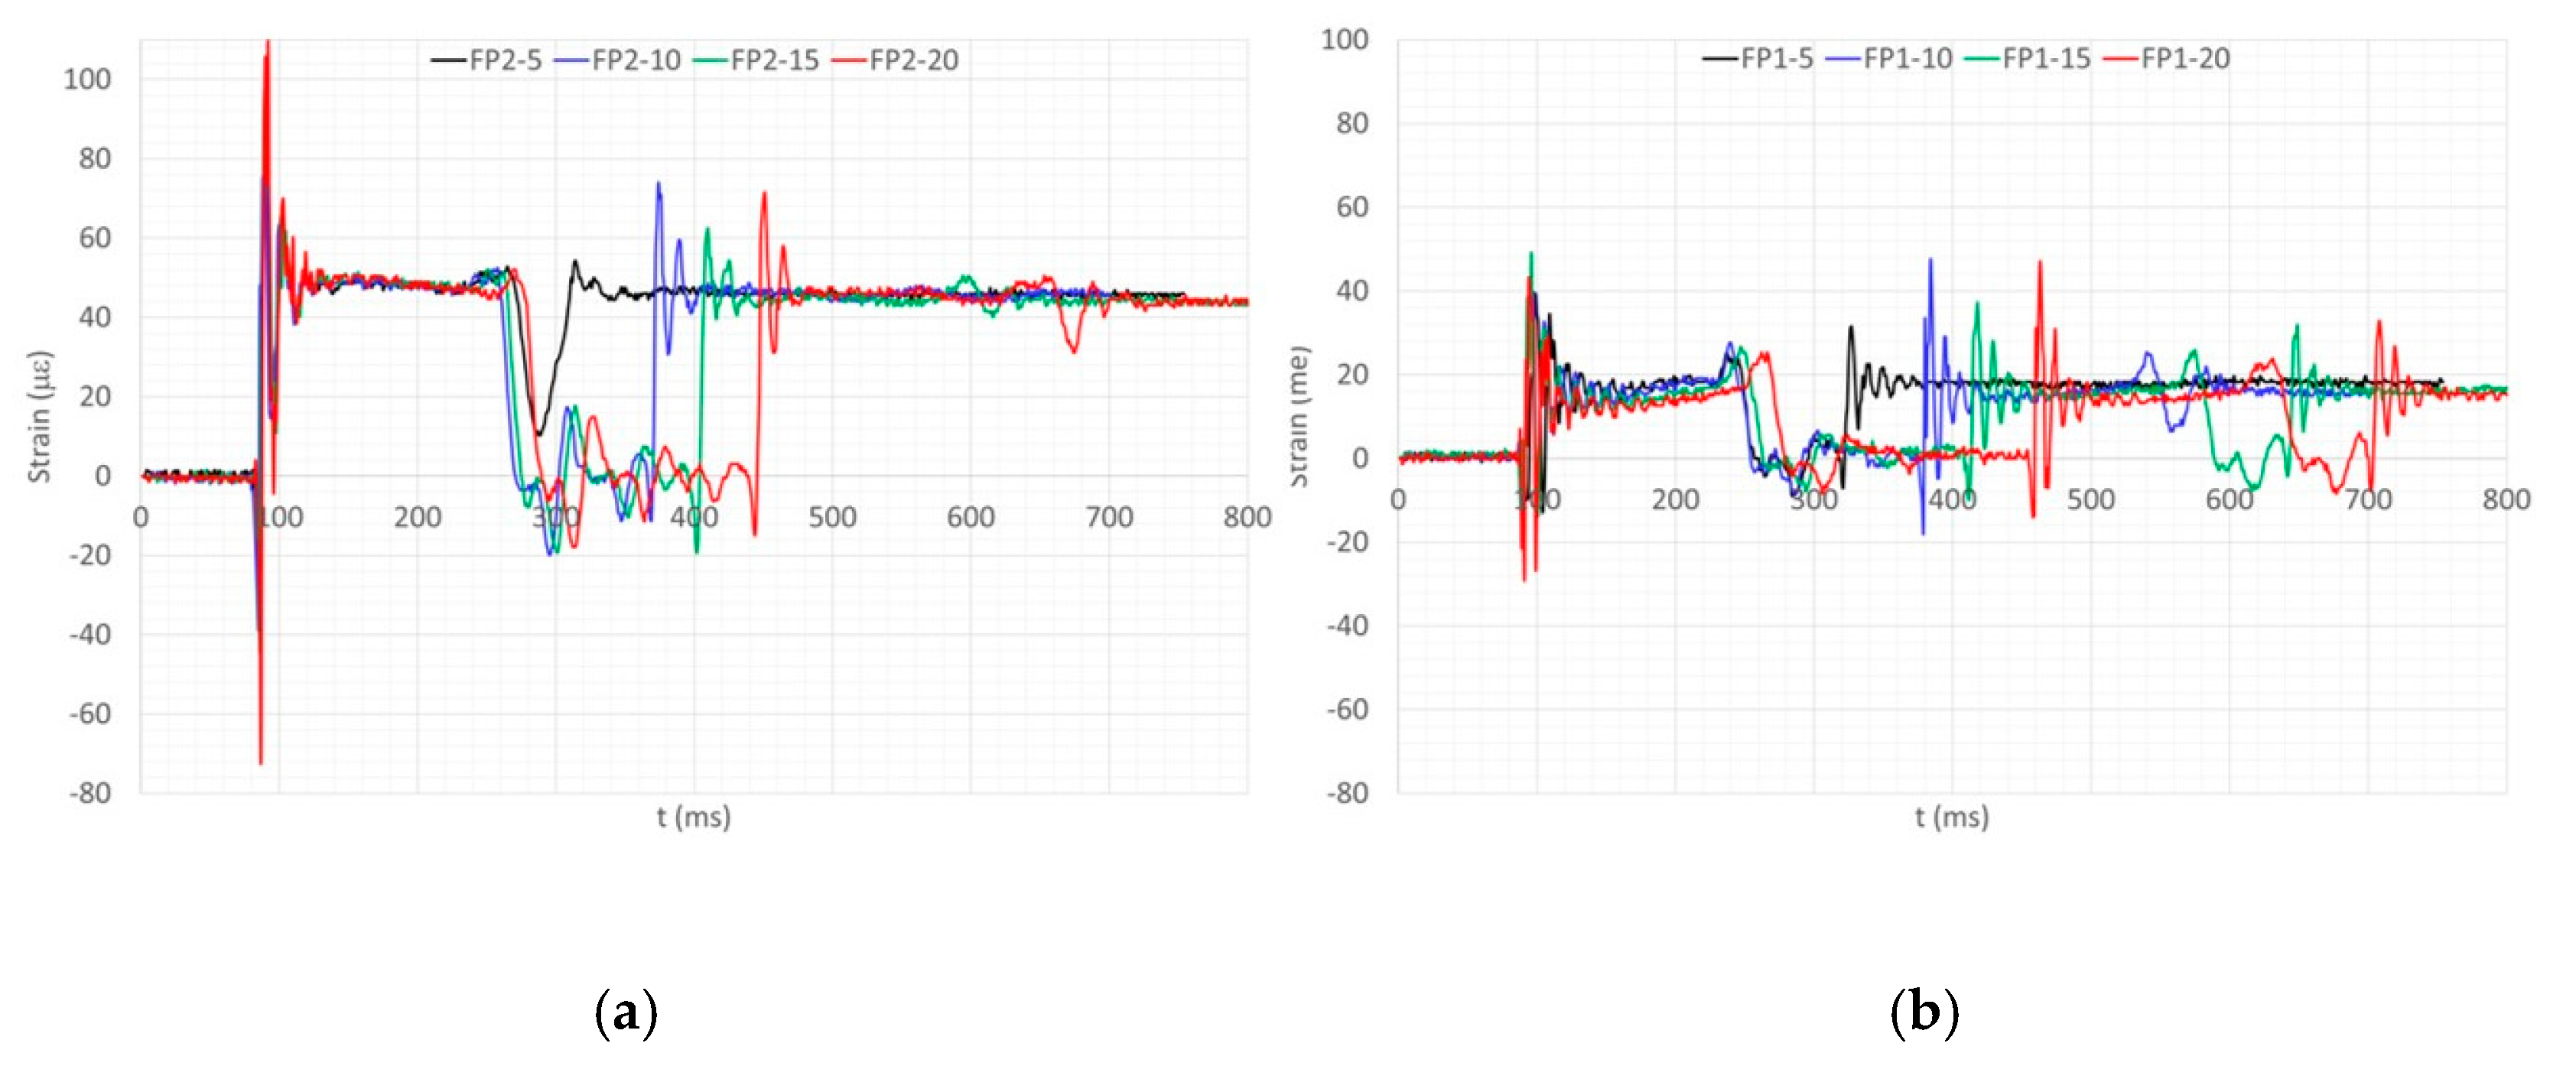
3.5. Plate-FBG Signals

The same trends are evidenced by the analysis of the signals derived from the FBG mounted on the impact plates (Figure 18). In this case, however, further considerations may be performed. The plates are constrained to the ground by means of four screws placed at their corners. Each grating is installed on the exposed surface of the plates, at the furthest point from the wheel impact area. At the impact, the gratings register a first almost instantaneous compression (negative strain value), which soon after converts to extension (positive strain value). After that impulse, the plates continue oscillating according to a classical unloaded response until the first rebound (new impact) occurs; at that point, a new free response is recorded, and so on. Once the series of rebounds and related induced structural systems oscillations are over, the FBG strain measurements exhibit a non-zero value, proportional to the weight of the test article standing on the plates. It may be taken as a new offset of the signal vs. the nominal zero (unloaded plates) (Figure 18).
The difference in amplitude between the signal recorded by FP1 and FP2 is likely due to the slight configuration asymmetry (Figure 13). The left side of the test article appears a little tilted with respect to the normal axis, resulting in a different impact time of the left and the right wheel. In particular, the former touches the ground before the latter. Furthermore, the asymmetry induces a different load on the two legs, larger on the left side. The analysis of the signals recorded indicates that the left grounds a few milliseconds earlier than the right wheel, then absorbs most of the impact energy. Then, the landing gear rotates, the second wheel touches the plate in turn and, finally, the system rebounds, moving away from both the plates. Moving along the scale of the times, and referring to the FP2 sensor, several regions can be identified (Figure 18 left; for the sake of clarity, areas of interest refer to the “red” curve, i.e., the fall from the larger height):
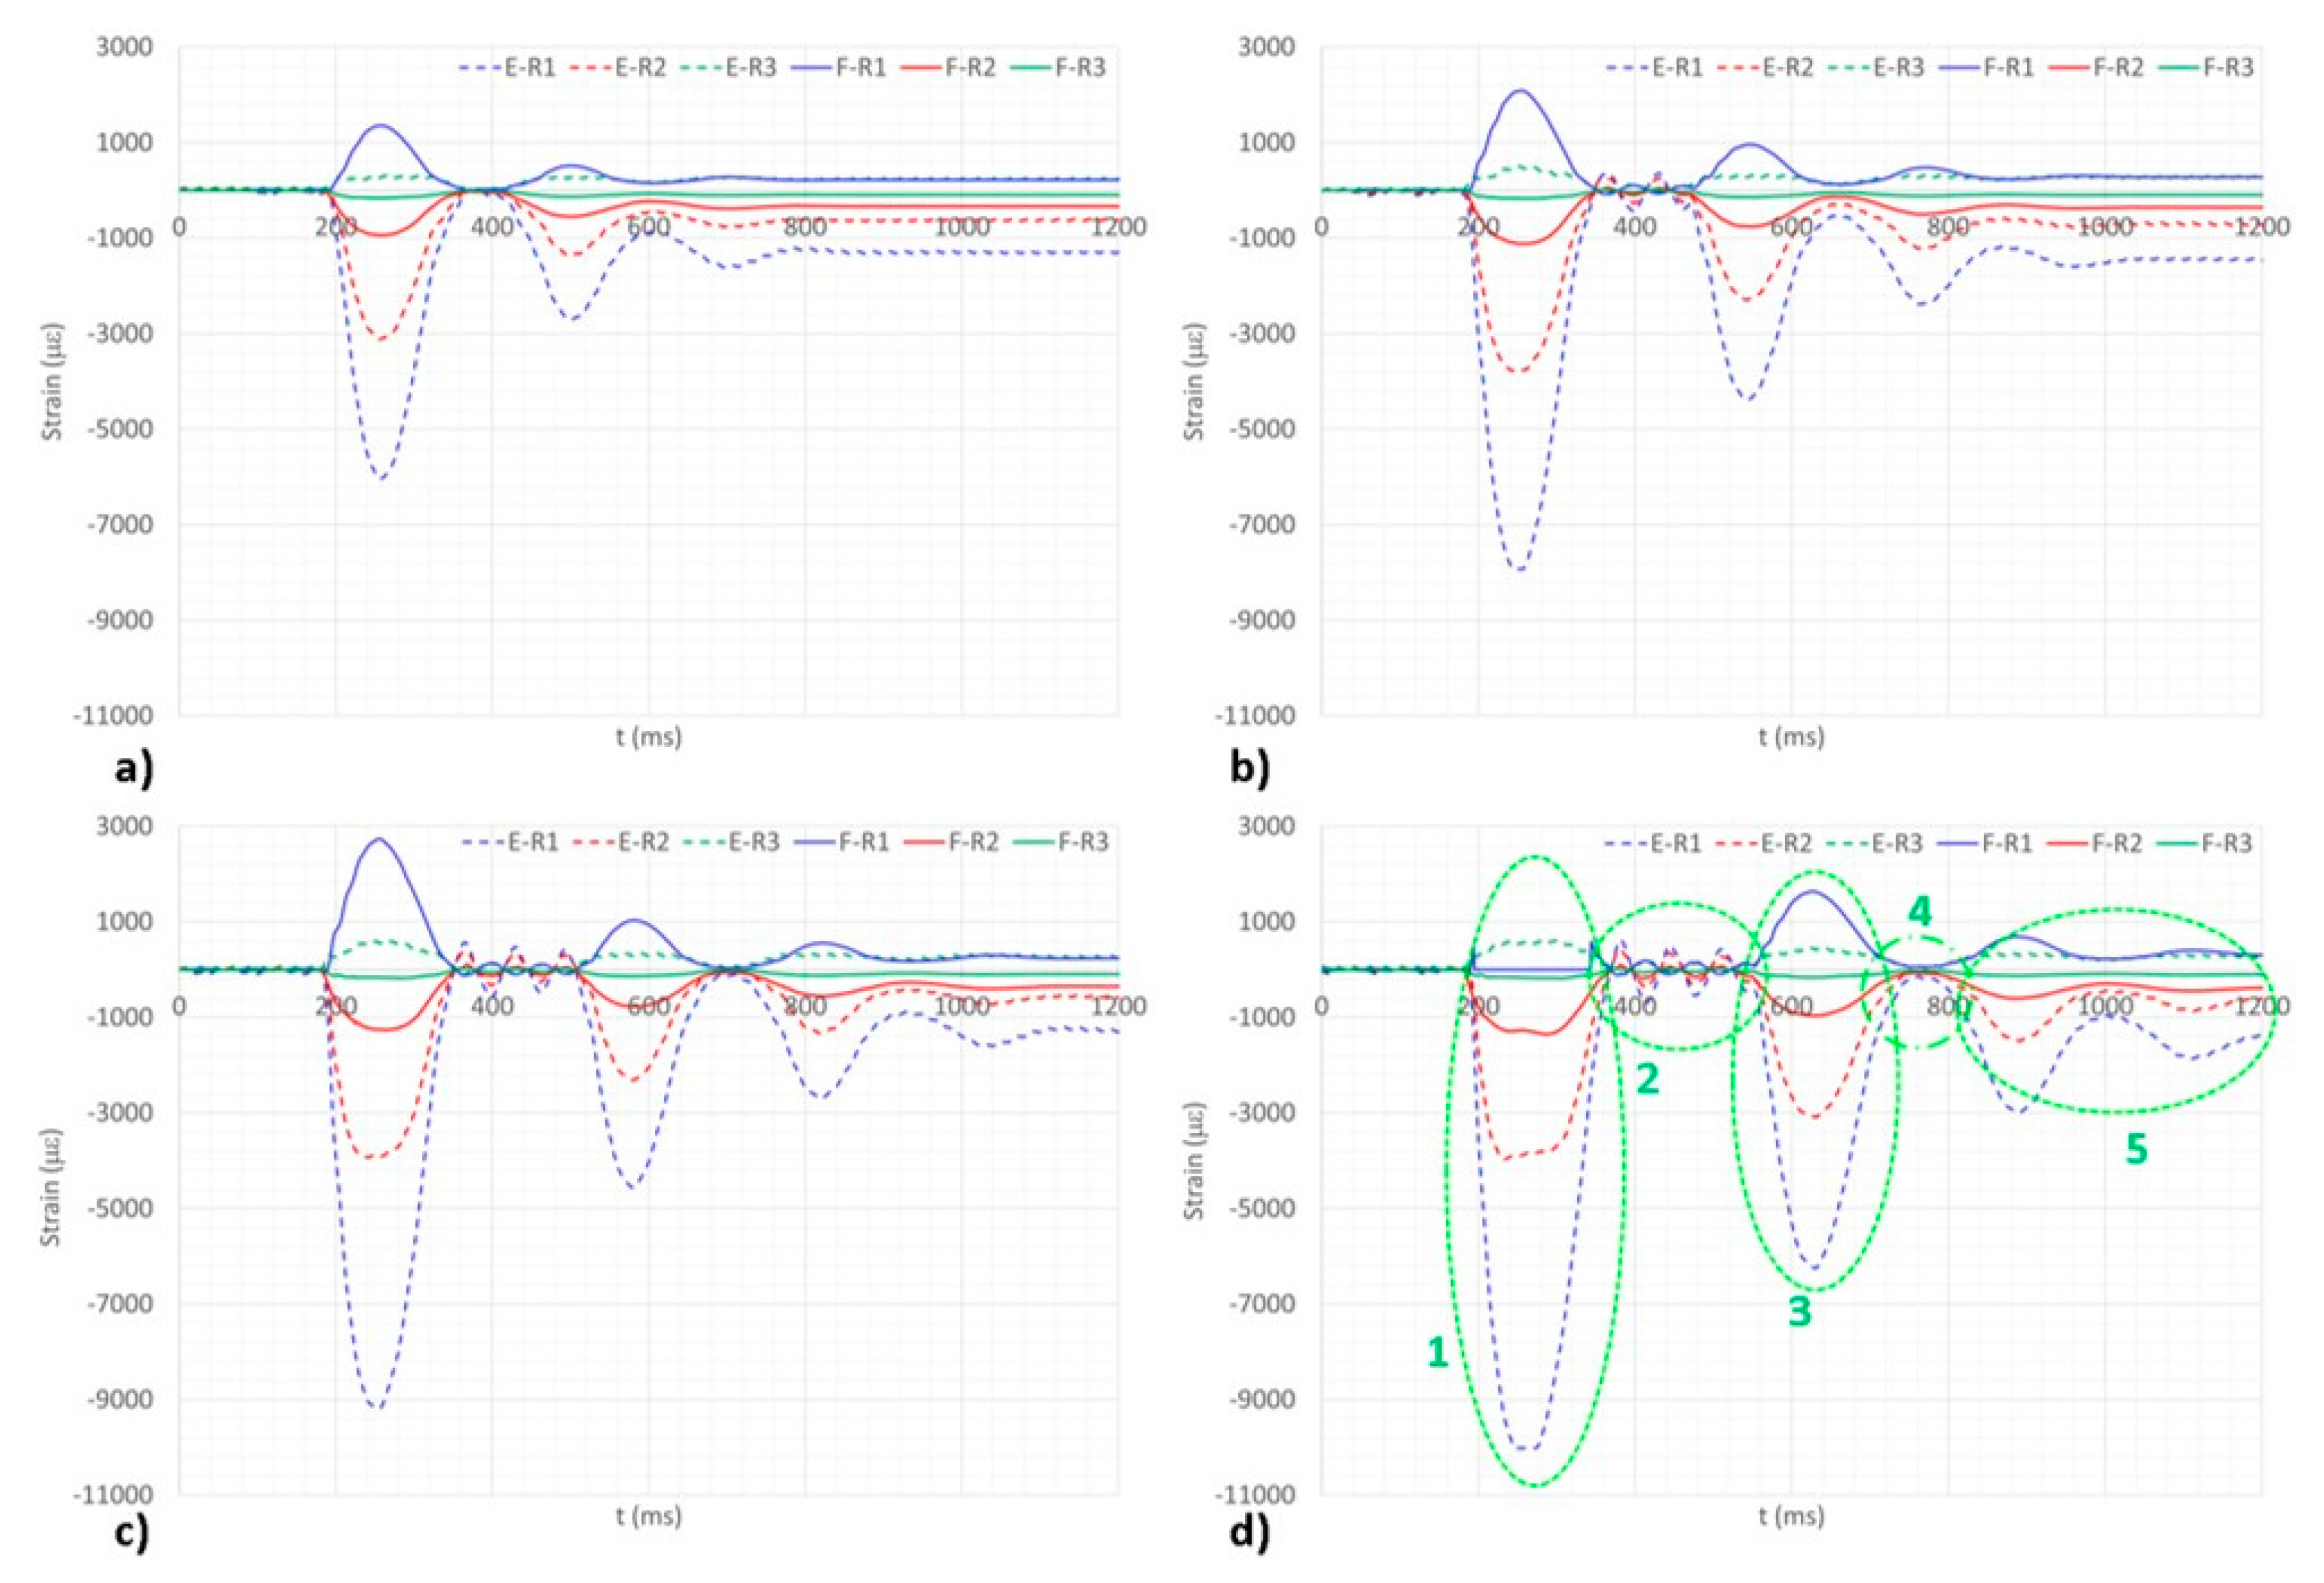
  • Region 1: It represents the signal history recorded while the wheel is in contact with the ground. The oscillation appears significantly dampened due to the effect of the inflated pneumatic absorption. It is relevant to note that the vibrations experience a homogeneous reduction, until the system starts to rebound and prepares to leave the plates.
  • Regions 2: The effect of the rebound is seen as a novel, negative impulse for the plate, which starts to vibrate again in a different way. Two main differences are associated with this behavior: Damping is lower, because there is no damping generator on the plate, as the wheels are detached from it; frequency is considerably lower since the wheel absence determines a drastic diminution of the structural constraints.
  • Region 3: It is analogous to region 1, with the relevant difference of a smaller vibration amplitude since the rebound is associated with reduced heights; therefore, the energy release is less than before. It is relevant to note that as the damping levels are substantially the same as before and, as already mentioned (it is associated with the first pinned mode of the system), the impact time is the same.
  • Region 4: It is characterized by a very small time-segment. In this case, it is understood that the landing gear does experience just a partial rebound, not coming to a complete separation from the plate. It does manifest, then, into a relaxation of the vibration period between two full-contact configurations (regions 3 and 5) and a very short duration.
  • Region 5: It does correspond to the very end part of the dynamic response history until vibration vanishes. After that period, the landing gear is at rest, and the FBG sensors record a strain that is proportional to the weight fraction that stands on it.
It may be of some interest to compare the different behaviours among the two FBG sensors, deployed on their respective plates. As aforesaid, the input energies are different for the two slabs since the impact occurs differently for the two sides. The damping levels seem pretty equal and in any case very close to each other. They cannot be equal since the impact points are different for the two elements, and therefore, the way the rubber wheel extracts energy from the ground is different. Surprisingly enough, the effects of the impact occurring after the rebound is apparently analogous for the two wheels. In that case, the rotation induced by the non-symmetrical impact leads to a harmonic rotation of the system that can balance the larger force at the first impact. The excited frequencies are clearly not the same in the two circumstances (left and right plates). This can be due to the different relative position of the wheel with respect to the respective plates, generating nominally a different dynamic structural system by changing the boundary conditions. A further effect of the non-symmetric impact is the presence of an almost full rebound on the right than on the left wheel. Since this leg works as a fulcrum in the induced rotations, the additional velocity associated with the right wheel may be significant, while it can be neglected on the former. This then causes a larger energy that shall be dissipated on the right leg. The signals, read for the four falling heights, are instead very similar for each plate. The impact duration being mainly associated with the first vibration mode of the system, it does not change in the various configurations. What is instead modified is the suspension time, which is larger for larger heights. The after-rebound vibration levels appear almost equal for the four setups, as if the larger part of the impact energy is dissipated during the first cycle while the residual is almost characteristic of the analysed system.

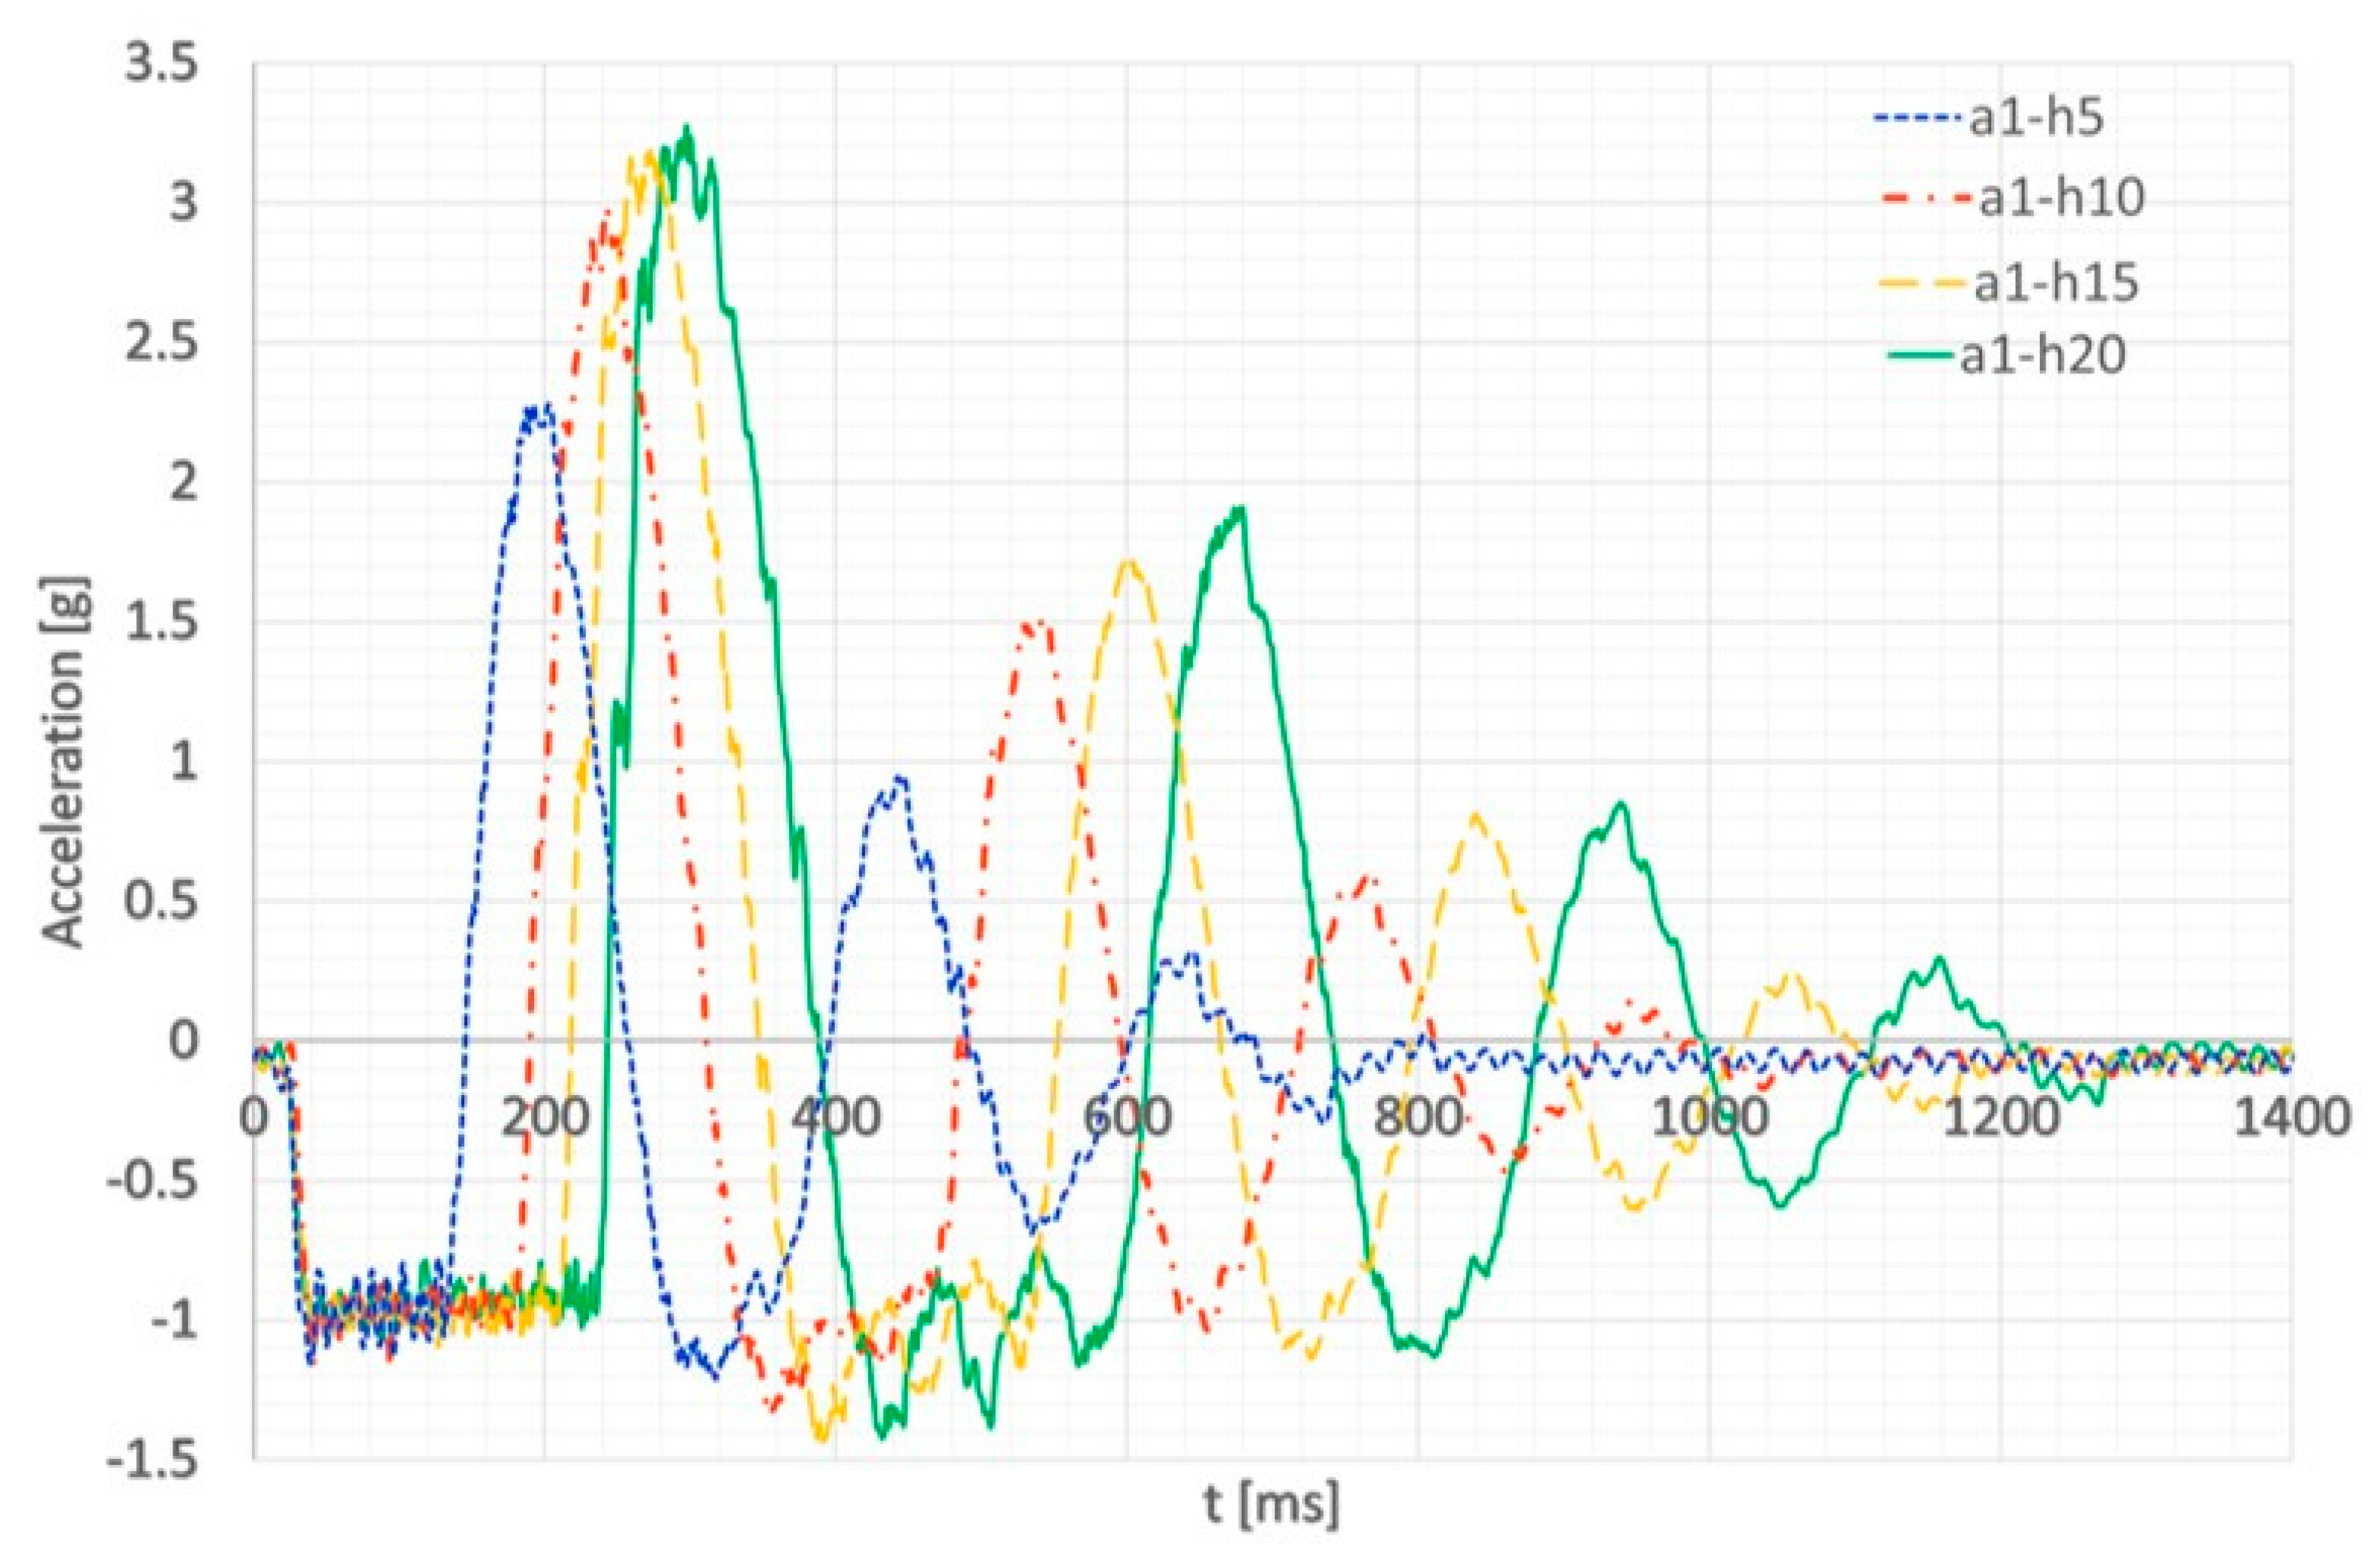
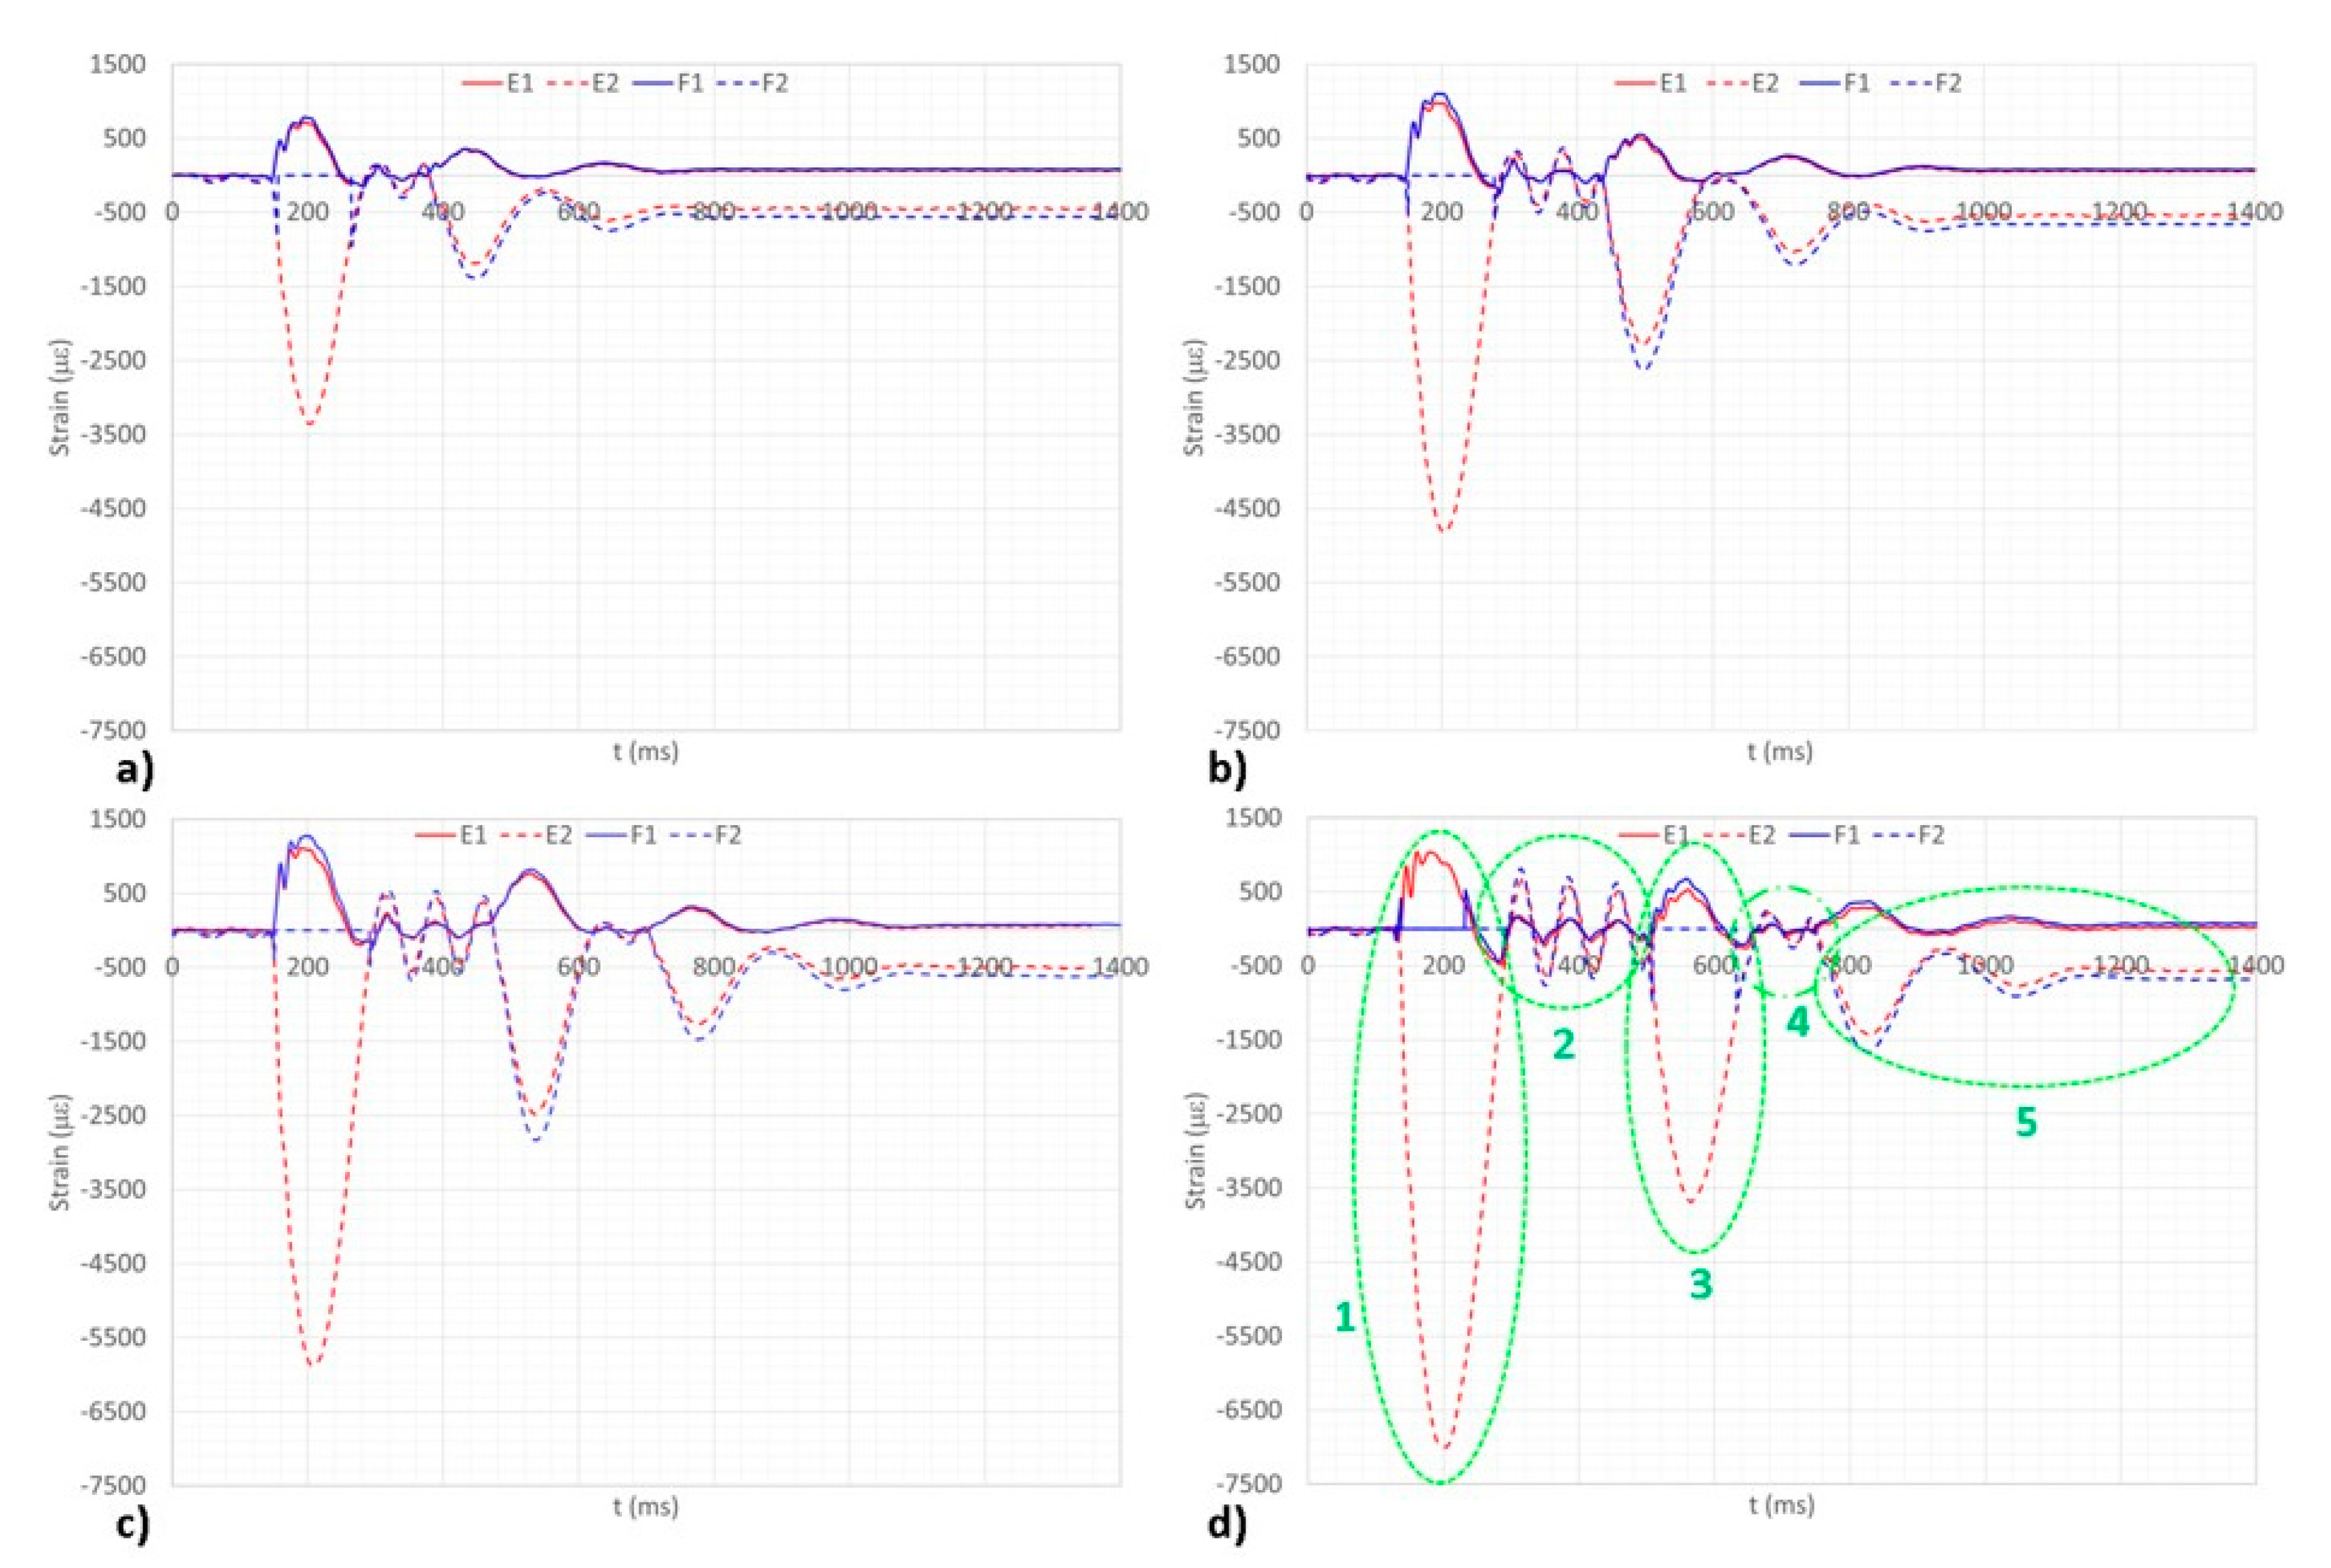
3.6. Test Article FBGs’ Arrays

As illustrated in Section 2.4, two SGs and a two-FBG array are placed on the right leg of the test article, on the outer surface, close enough to reproduce similar deformation signals (Figure 7 and Figure 8). A rosette of SGs and a three-FBG array are instead deployed on the left leg, on the outer and inner surfaces, respectively, trying to replicate a similar configuration on both sides (Figure 7 and Figure 9). A comparison of the measures confirms the congruence of the signals derived from the different sensors at the different heights (Figure 19 and Figure 20). For a correct interpretation of the performance of the installed sensors, it is worth making some preliminary considerations about the geometry of the test article and the two legs, specifically. The latter have a triangular shape similar to tapered wings and are constrained to the interface plate at the top and to the wheels at the bottom side. Inside, two crossed springs connecting the alternate tops of the legs and the wheels, preventing excessive straddle at the impact and providing additional damping to the whole system (Figure 2). At touchdown, the legs deform, assuming an “S” shape coherently with the trend recorded by the sensors. At that instant, in fact, the weight is distributed between the two wheels, making an inward inflection of the legs in the lower segment, causing in turn a compression of the structure in the corresponding external area and an outward deflection in the higher region, producing instead an extension. In this way, the top sensors are expected to provide positive strain values, while the bottom sensors are predicted to return negative strain values. The largest deformation levels are guessed to occur at the lowest region, where the connection with the wheel axis induces a greater bowing compared to the stiffer constraint with the horizontal, massive interface plane. Compressed sensors should therefore produce higher levels of strains, if compared to expanded sensors. A further consideration shall regard the wheels position, which are advanced with respect to the centre of gravity of the test article. This configuration causes an additional compressive component of deformation, by the action of the momentum that is generated at the impact, with respect to what happens at the upper constraint. After these basic considerations, an excellent overlap between the signals recorded by the FBG and SG is revealed at the right leg (Figure 19), evidencing a perfect exchangeability of the two devices, while a less good correlation may be reported for the right leg sensor signals (Figure 20). Previous observations and the actual sensor system layout (Figure 9) may further explain that behaviour. While the FBG array and the SG rosette maintain the same orientation, their position is not fully congruent. Reality of the installation forces to install the two systems in areas that are not properly collocated. In fact, some stiffeners are present on the inner face, reducing the allowable area for bonding the fibre optics; the same hardening makes that region less deformable, preventing the FBG to attain the same values as the SG. A further remark considers the sign of the recorded deformation: While it is expected that the two groups provide opposite values (positive or negative, depending on the side where they are attached), two single sensors denote the same behaviour (compression). In this case, this is due to the placement of the FBG in an inner part of the leg, where some modulation of the strain does occur (Figure 20).
The description of the test execution and the relative information extraction refer to the higher height for the sake of simplicity and clearness of vision (Figure 19 and Figure 20). A fundamental foreword shall address the graph representation: Since the interrogator has a 1 kHz bandwidth, the higher frequencies cannot be detected. Therefore, the time curves are apparently cleaner than the respective ones, produced by the accelerometers mounted on the slide system. In the rest-phase, when the test article is hanging in the drop tower, the sensors oscillate around the equilibrium value. In the free-fall phase, there is a slight increase in the amplitude of this oscillation, but the phenomenon is not comparable with the accelerometer output. In this case, related frequencies cannot be detected by the optical sensor, while a better isolation seems to be verified for the strain gauges.
  • Region 1: The first impact is the one causing the largest deformation levels, as expected: All the fall energy is converted into elastic energy, partly transferred to the landing gear system and partly to the impact plates. The first mode of vibration of the LG is clearly detected and, as evident from the pictures, is equal for all the tested heights. This mode, as already stated, is the one characterized by a large displacement of the top interface plate and large straddle of the LG legs and is coherent with the outline of the system pinned at the wheels.
  • Region 2: The structure detaches from the ground and moves freely in the air. The detected strain oscillations refer to the first mode of the free-free LG; it is characterized by a large motion of the two legs, behaving similar to a clamped beam with a concentrated mass at its free end. In both the cases, it is evident as the strain curve is much clearer than the previous acceleration graphs. This is a direct outcome of the filter imposed by the acquisition system at 1 kHz.
  • Region 3: The LG strikes once again the ground (first rebound). The first pinned mode is again excited, for the same time interval but for a lower amplitude.
  • Region 4: The system is shown to leave once again the ground, but just partially, according to the illustrated curves; this frame is somehow characterized by a mixed behavior between the pinned and the free motion and lasts for a very short time.
  • Region 5: Pinned oscillations are evident: They correspond to a sort of structure relaxing around the first mode, whose amplitude slowly vanishes until rest. One of the two sensors (Figure 19) approaches zero again at the end of the dynamic history. This is just a case, indicating that the deformed shape of the system under its own weight, and for the cited boundary constraints, presents a node at the SG/FBG positions.
It may be of some interest to report a minor occurrence, verified at the top area of the right leg (Figure 19). At the impacts, a peak in the strain is present in both the upper and bottom locations on the leg, while the peaks corresponding to the sensors located at the upper part are bigger and steeper. In spite of the perfect alignment of the local structural response tracked by F2 and SG2, F1 does present some leaks at the major impact, while maintaining an almost perfect congruence along the remaining part of the time history. Such an occurrence is interpreted as an index of some kind of fault existing in the fibre. In addition, since it continues to work for low excitation values, that damage should have not been able to interrupt the light signal in any condition but just in some of them, characterized by high levels of strain. A visual inspection on the fibre path, carried out by means of a Visual Fault Locator (VFL), highlights a minor local flaw, Figure 21. A manual inspection permits verifying that the optics are not macroscopically broken; detected microcracks generate a signal loss only if mechanical deformation exceeds a certain threshold. Otherwise, the microcrack shuts, and the light may travel inside without significant leaks.
At this stage, repeatability tests are not carried out. In fact, the nature of the experiments leads to performing systematic and full-maintenance interventions after each test, with the opportune verifications of the implemented adjustments. On the other side, the redundancy of the sensors (strain gauges, accelerometers and FBG) ensures the coherence of the achieved information to a certain extent. Furthermore, the coherence among the data retrieved from different heights is considered a further guarantee of the goodness of the achieved results. Finally, it shall be reported that the integrity of the sensor networks is checked before and after each test, as the initial “zero” is recovered.

3.7. Spring Ties Effect

All sensors installed on the test article show an interesting dynamic response following the first impact that is represented by the oscillations occurring during the first peak and immediately downstream, representing the first modes of vibration of the system at the different boundary conditions, pinned and free, respectively (Figure 16, Figure 19 and Figure 20), whose amplitudes increase as the drop height increases. For the second configuration, due to the larger energy present, the number of oscillations increases because of the larger suspension time (interval between two rebounds). These modes are mainly driven by the two spring-ties (Figure 2) acting as both a damping and a stiffening system. During the impact history, the springs recall the two arms of the wheels, absorbing part of the energy of the impact in terms of elastic energy (compression of the two springs) and then immediately releasing it back to the structure (extension of the two springs).
The greater the height of the fall, the greater the energy absorbed by the springs that will be returned to the structure (test article). This phenomenon is investigated by means of a first FFT, performed on the accelerometers’ signals, over a 4096-ms window, indicated by a rectangle dashed in green in Figure 16, which identified the fundamental frequencies of the two configurations at 4.88 and 12.2 Hz (presented in Figure 22). The second FFT was carried out on the signals of the FBGs installed on the test article, covering the whole dynamics shown in Figure 20. For the sake of clarity, the FFT performed on FBG F-R2 (second FBG of the rosette installed on the left leg) is presented in Figure 23, confirming what has been previously stated.

4. Conclusions

This document reports on the development, execution and results of a preparatory test campaign performed on a small LGs demonstrator. The test campaign has been carried out in order to assess the capabilities of the optical technology based on Fibre Bragg Gratings to measure strain variation in the landing gear structure at landings.
The performed experimental activities confirmed our expectations on the capabilities of the FBGs to measure strain for the considered application and demonstrated its relevance.
Some basic considerations may be drawn after the reported experiences and are herein summarized:
  • The three sets of used sensors provide the same kind of information so that it is possible to state that the networks are exchangeable. The actual difference may be identified in the frequency bandwidth of the acquisition systems. Namely, the impact dynamics involve all the vibration modes of the system under investigation. Therefore, it shall be calibrated with reference to the specific landing gear. Generally, a good conservative target for structural systems may be set at 1 kHz. In this case, we shall state that an optical interrogator showing a 4 kHz band per channel can be sufficient to the scope.
  • The vibration modes that shall be considered at that aim are both the pinned ones (representing the landing gear supported by the wheels) and the free-free configuration, as the complete system experiences rebounds and it detaches from the ground. However, this is a minimal requirement since in reality many other occurrences can be experienced (non-symmetrical landing with just one or two, out of the three legs on the ground and so on), making the assessment of this spec really hard to be defined.
  • Accelerometers may provide excellent information on the system dynamics, being able for definition to provide data also for the free-fall state (gravity driven), something that strain sensors are only partially able to produce (static strain response to gravity load, usually very low). However, accelerometers have strong weaknesses that make their choice as point descriptors hardly feasible: For instance, their number should be excessive to catch the dynamics of the landing gear system, and the related cabling could be easily impracticable; also, the output data do not give direct information on the system stress state that shall be in turn extrapolated. The second point could be overcome by the use of strain gauges, which, however, are not suitable to bypass the first issue. Fibre optics are able to overcome both of these points and present the well-known advantages of being insensible to electromagnetic fields and having minimum intrusiveness and weight penalty, among the others.
  • A further basic benefit comes directly for FBG and fibre optics’ minimal size, which allows the sensor system to be embeddable within the reference structure. This may faces some difficulties for metal structures but can be simple in a certain measure for composite structures, where a lot of activities have been presented in the literature [38,39]. This process, apart from the forecast cleanness of the resulting system, makes it more robust to external accidents, either due to normal operations or randomness. In that sense, the reported experience evidences once more the fibre optics as one of the showstoppers for actual aeronautic implementation.
  • The sensor system, including the gauges network and the acquisition instrumentation, shall be flyable. FBG interrogators have owned this characteristic for a long time with respect to traditional architectures, while many other solutions have been recently presented, enlarging the number of sensors deployable on a single line, significantly. Other technologies, based on distributed architectures, do not have the maturity to be installed on-board aircrafts yet, but further developments are expected in the current decade as different proposals are being presented on the market.
  • Since FBG networks allow just a limited number of sensors, namely, 64 for typical 4-channel interrogators, the retrieved information shall necessarily pass through some model of the reference structure that, combined with information allowing to reconstruct the landing conditions, can give a representation of the actual strain map and, therefore, of the mechanical energy entering the gear structure. It may be objected that, also currently, the number of channels may be simply enlarged by increasing the number of interrogators. This kind of solution, however, is accompanied by amplified safety, maintenance, cost and even architectural issues, as it is easy to imagine.
Given the factors above enunciated, the authors present the following steps to refine and expand the results of the study herein presented:
  • Enrich the available tools with a detailed FEM of the system, including the instrumented Landing Gear, the plates and partially the sliding system;
  • Introduce a denser network on the structure, in order to increase the accessible data, even using special measures to compact its outline and different optical sensors;
  • Develop a correlation between the numerical model and the achieved data, trying to assess a tool for retrieving the overall configuration from the limited experimental info, for instance, based on Artificial Neural Networks;
  • Develop, as a complement to the point above, an optimization tool for deploying the sensor networks in the most effective points, for instance, based on Genetic Algorithms, to maximize the strength of the extrapolation;
  • Resume and expand some preliminary and independent engineering tools that the authors set and published in some recent work [30] to correlate strain information to energy directly to further augment the predictability power.

Author Contributions

Conceptualization, A.B.; methodology, C.V.; software, C.V.; validation, A.B. and C.V.; formal analysis, A.C.; investigation, M.I. and V.F.; resources, L.D.P., L.T. and M.I.; data curation, C.V. and V.F.; writing—original draft preparation, A.B. and C.V.; writing—review and editing, A.C.; visualization, A.B. and C.V.; supervision, L.T.; project administration, L.D.P.; funding acquisition, A.C. and L.D.P. All authors have read and agreed to the published version of the manuscript.

Funding

The research leading to these results has gratefully received funding by Clean Sky 2 Joint Undertaking under the European Union’s Horizon 2020 research and innovation programme under Grant Agreement for members No. 807090, and following extensions.

Institutional Review Board Statement

Not applicable.

Informed Consent Statement

Not applicable.

Data Availability Statement

The data are not publicly available due to confidentiality reasons.

Conflicts of Interest

The authors declare no conflict of interest.

References

  1. Howe, D. Aircraft Loading and Structural Layout; Professional Engineering Publishing Limited: London, UK, 2004; ISSN 1743-386X. [Google Scholar]
  2. MC Gehee, J.R.; Carden, H.D. Analytical Investigation of Landing Dynamics of a Large Airplane with a Load-control System in Main Landing Gear. NASA Tech. Pap. 1979, 1555, ADA078613. [Google Scholar]
  3. Gorinevsky, D.; Gordon, G.A.; Beard, S.; Kumar, A.; Chang, F.K. Design of Integrated SHM System for Commercial Aircraft Applications. In Proceedings of the 5th International Workshop on Structural Health Monitoring, Stanford, CA, USA, 12–14 September 2005. [Google Scholar]
  4. Forrest, C.; Wiser, D. Landing gear structural health monitoring (SHM). Procedia Struct. Integr. 2017, 5, 1153–1159. [Google Scholar] [CrossRef]
  5. Cowan, S.J.; Cox, R.L.; Slusher, H.W.; Jinadsa, S. Airplane Hard Landing Indication System. U.S. Patent 6,767,075, 13 January 2004. [Google Scholar]
  6. Pritchard, J. Overview of Landing Gear Dynamics. J. Aircr. 2001, 38. [Google Scholar] [CrossRef] [Green Version]
  7. Tripero, A.; Arevalo, J. Weight on wheel system based on strain gauges. In Proceedings of the ICAS, Brisbane, Australia, 23–28 September 2012; ISBN 978-0-9565333-1-9. [Google Scholar]
  8. Brindisi, A.; Ameduri, S.; Concilio, A.; Ciminello, M.; Leone, M.; Iele, A.; Consales, M.; Cusano, C. A multi-scaled demonstrator for aircraft weight and balance measurements based on FBG sensors: Design rationale and experimental characterization. Measurement 2019, 141, 113–123. [Google Scholar] [CrossRef]
  9. Iele, A.; Leone, M.; Consales, M.; Persiano, G.V.; Brindisi, A.; Ameduri, S.; Concilio, A.; Ciminello, M.; Apicella, A.; Bocchetto, F.; et al. A fiber optic sensor system for load monitoring on aircraft landing gears. In Proceedings of the SPIE 11199, 7th European Workshop on Optical Fibre Sensors, 111990L, Limassol, Cyprus, 1–4 October 2019. [Google Scholar] [CrossRef]
  10. Pytka, J.; Jozwik, J.; Lyszczyk, T. Embedded Wheel Force Sensor For Aircraft Landing Gear Testin. In Proceedings of the 5th IEEE International Workshop on Metrology for Aerospace, Rome, Italy, 20–22 June 2018. [Google Scholar]
  11. Jebacek, I.; Horak, M. Measuring of a Nose Landing Gear Load during Take-Off and Landing. In Proceedings of the 21st International Conference Engineering Mechanics, Svratka, Czech Republic, 11–14 May 2015; pp. 120–121. [Google Scholar]
  12. Baird, B.W. Overload Detection/Health Monitoring Landing Gear Sensor System Proposal. Master’s Thesis, Ryerson University, Toronto, ON, Canada, 2008. Paper 1157. [Google Scholar]
  13. Schmidt, R.K. Monitoring of aircraft landing gear structure. J. Aircr. 2008, 112, 275–278. [Google Scholar] [CrossRef]
  14. Schmidt, R.K.; El-Samid, N.A. Structural Deflection and Load Measuring Device. Patent WO 2006/024146 A1, 9 March 2006. [Google Scholar]
  15. Sagi, O.T.; Maynard, D.; Enikov, E. In Proceedings of the Capacitive Transducer for Condition Based Maintenance after Harsh Landing Events, Baltimore, MD, USA, 12–15 September 2011.
  16. Finance, R.J. Device for Detecting Hard Landings. USA Patent US4278219A, 14 July 1981. [Google Scholar]
  17. Anì, T.; Ting, Z.Z.; Tao, C.J. A technique of landing gear loads calibration with strain gauges. In Proceedings of the 27th International Congress of Aeronautical Sciences, Nice, France, 19–24 September 2010. [Google Scholar]
  18. Schmidt, R.K.; Sartor, P.N. Landing Gear. In Encyclopaedia of Structural Health Monitoring; Boller, C., Chang, K.F., Fujino, T., Eds.; John Wiley & Sons, Inc.: Hoboken, NJ, USA, 2009; pp. 1983–1994. ISBN 978-0-470-05822-0. [Google Scholar]
  19. Schmidt, R.K. System and Method for Determining Aircraft Hard Landing Events from Inertial and Aircraft Reference Frame Data. U.S. Patent 7,589,645, 11 January 2009. [Google Scholar]
  20. Zhou, Y.; Liu, D.; Li, D.; Zhao, Y.; Zhang, M.; Zhang, W. Review on Structural Health Monitoring in Metal Aviation Based on Fiber Bragg Grating Sensing Technology. In Proceedings of the 2020 Prognostics and Health Management Conference (PHM-Besançon), Besancon, France, 4–7 May 2020; pp. 97–102. [Google Scholar] [CrossRef]
  21. Di Sante, R. Fibre Optic Sensors for Structural Health Monitoring of Aircraft Composite Structures: Recent Advances and Applications. Sensors 2015, 15, 18666–18713. [Google Scholar] [CrossRef] [PubMed]
  22. Rodriguez, G.; Sandberg, R.L.; Lalone, B.M.; Marshall, B.R.; Grover, M.; Stevens, G.; Udd, E. High pressure sensing and dynamics using high speed Fiber Bragg Grating interrogation systems. Fiber Opt. Sens. Appl. XI 2014. [Google Scholar] [CrossRef]
  23. Ma, Z.; Chen, X. Fiber Bragg Gratings Sensors for Aircraft Wing Shape Measurement: Recent Applications and Technical Analysis. Sensors 2019, 19, 55. [Google Scholar] [CrossRef] [Green Version]
  24. Chandler, K.; Ferguson, S.; Graver, T.; Csipkes, A.; Mendez, A. On-line structural health and fire monitoring of a composite personal aircraft using an FBG sensing system. SPIE Proc. Smart Sens. Phenom. Technol. Netw. Syst. 2008, 6933. [Google Scholar] [CrossRef]
  25. Kressel, I.; Balter, J.; Mashiach, N.; Sovran, I.; Shapira, O.; Shemesh, N.Y.; Glamm, B.; Dvorjetski, A.; Yehoshua, T.; Tur, M. High Speed, In-Flight Structural Health Monitoring System for Medium Altitude Long Endurance Unmanned Air Vehicle. In Proceedings of the EWSHM 7th European Workshop on Structural Health Monitoring, IFFSTTAR, Inria, Université de Nantes, Nantes, France, 8–11 July 2014. hal-01020352. [Google Scholar]
  26. Briancourt, S.; Seymour, T. Aircraft Landing Gear Load Sensor. USA Patent US 8,235,326 B2, 7 August 2012. [Google Scholar]
  27. Petroneb, G.; Brunoa, M.; Bocchettoa, F.; Bregliob, G.; Puglieseb, M.; Caldarab, A.; Cavallaric, A.N.; Moriellod, S.S.L.; Capuano, G. An Innovative Health Monitoring System for Aircraft Landing Gears. In Proceedings of the 8th European Workshop On Structural Health Monitoring (EWSHM), Bilbao, Spain, 5–8 July 2016. [Google Scholar]
  28. Kwon, H.; Park, Y.; Shin, C.; Kim, J.-H.; Kim, C.-G. In-Flight Strain Monitoring of Aircraft Tail Boom Structure Using a Fiber Bragg Grating Sensor Based Health and Usage Monitoring System. Int. J. Aeronaut. Space Sci. 2021, 22, 567–577. [Google Scholar] [CrossRef]
  29. Iadicicco, A.; Natale, D.; Di Palma, P.; Spinaci, F.; Apicella, A.; Campopiano, S. Strain Monitoring of a Composite Drag Strut in Aircraft Landing Gear by Fiber Bragg Grating Sensors. Sensors 2019, 19, 2239. [Google Scholar] [CrossRef] [PubMed] [Green Version]
  30. Brindisi, A.; Vendittozzi, C.; Travascio, L.; Di Palma, L.; Concilio, A. Landing gear hard impact: Preliminary study on optic monitoring system. Proc. Inst. Mech. Eng. Part C 2020, 1–12. [Google Scholar] [CrossRef]
  31. Cordis, AlGeSMo (Advanced Landing Gear Sensing and Monitoring). Available online: https://cordis.europa.eu/project/id/717179/results (accessed on 30 September 2021).
  32. Technobis, Landing Gear Load Sensing. Available online: https://www.technobis.com/files/6315/3259/9099/5.pdf (accessed on 30 September 2021).
  33. EASA, CS23 Easy Access Rules for Normal-Category Aeroplanes (CS-23) (CS Amendment 5, AMC/GM Issue 2). Available online: https://www.easa.europa.eu/document-library/certification-specifications/cs-23-amendment-5 (accessed on 1 August 2021).
  34. EASA, CS25 CS-25 Amendment 24. Available online: https://www.easa.europa.eu/document-library/certification-specifications/cs-25-amendment-25 (accessed on 1 August 2021).
  35. Boeing, Conditional Inspections. Available online: https://www.boeing.com/commercial/aeromagazine/aero_14/conditional_story.html (accessed on 1 October 2021).
  36. Measures, R.M. Structural Monitoring with Fiber Optic Technology; Academic Press: San Diego, CA, USA, 2001; ISBN 0-12-487430-4. [Google Scholar]
  37. University of Maryland, Jim Hetrick’s Homepage, Oscillations. Available online: https://www-personal.umd.umich.edu/~jameshet/IntroLabs/IntroLabDocuments/150-11%20Oscillations%5b2%5d/Oscillations%5b2%5d%2012.0.pdf (accessed on 1 October 2021).
  38. Waite, S.R. Use of embedded optical fibre for significant fatigue damage detection in composite materials. Composites 1990, 21, 225–231. [Google Scholar] [CrossRef]
  39. Bednarska, K.; Sobotka, P.; Wolinski, T.R.; Zakrecka, O.; Pomianek, W.; Nocon, A.; Lesiak, P. Hybrid Fiber Optic Sensor Systems in Structural Health Monitoring in Aircraft Structures. Materials 2020, 13, 2249. [Google Scholar] [CrossRef] [PubMed]
Figure 1. Drawing of a PiperPA-18 Super Cub aircraft. Detail: Front view of the test article: the leaf spring landing gear.
Photonics 08 00450 g001
Figure 2. Test article’s overall dimensions.
Photonics 08 00450 g002
Figure 3. Small drop tower at the Crash Test Facility, CIRA.
Photonics 08 00450 g003
Figure 4. Test article/interface plate/trolley system, as it touches the two impact plates mounted on the ground.
Photonics 08 00450 g004
Figure 5. The two accelerometers placed on the top of the trolley.
Photonics 08 00450 g005
Figure 6. The FBG sensors mounted on the impact plates.
Photonics 08 00450 g006
Figure 7. FBG-based hard landing monitoring system test rig.
Photonics 08 00450 g007
Figure 8. Top face of the right leg of the landing gear equipped with FBG and SG sensors.
Photonics 08 00450 g008
Figure 9. Inner face of the left leg with the FBG rosette (right); top face of the left leg with SG rosette (left).
Photonics 08 00450 g009
Figure 10. SG and cameras acquisition systems (left); FBG acquisition system (right).
Photonics 08 00450 g010
Figure 11. Camera layout.
Photonics 08 00450 g011
Figure 12. Test article placed at the generic height h.
Photonics 08 00450 g012
Figure 13. The four main stages of the drop test.
Photonics 08 00450 g013
Figure 14. Typical accelerometer signals, as recorded during the drop tests. In this case, the starting height is set to 0.05 m.
Photonics 08 00450 g014
Figure 15. Typical impact plate-mounted FBG (FP1 and FP2) signals, as recorded during the drop tests. In this case, the starting height is set to 0.05 m.
Photonics 08 00450 g015
Figure 16. Accelerometer signals recorded at four different heights. (a) h = 0.05 m; (b) h = 0.10 m; (c) h = 0.15 m; and (d) h = 0.20 m.
Photonics 08 00450 g016
Figure 17. Example of accelerometer signals’ superposition at four different heights (accelerometer a1). (a1-h5) h = 0.05 m; (a1-h10) h = 0.10 m; (a1-h15) h = 0.15 m; and (a1-h20) h = 0.20 m.
Photonics 08 00450 g017
Figure 18. Occurrences recorded by the two FBGs bonded to the impact plates during the four drop tests. (a) FP1 (right plate) and (b) FP2 (left plate). The drop from h = 0.05 m is represented by a black line, from h = 0.10 m is in blue, from h = 0.15 m is in green, and from h = 0.20 m is in red.
Photonics 08 00450 g018
Figure 19. Right leg FBGs array signals recorded at four different heights. (a) h = 0.05 m; (b) h = 0.10 m; (c) h = 0.15 m; and (d) h = 0.20 m.
Photonics 08 00450 g019
Figure 20. Left leg FBGs rosette signals recorded at four different heights. (a) h = 0.05 m; (b) h = 0.10 m; (c) h = 0.15 m; and (d) h = 0.20 m.
Photonics 08 00450 g020
Figure 21. Light escaping the fibre at a microcrack; visibility produced by the VLF.
Photonics 08 00450 g021
Figure 22. FFT of accelerometers signals in the 4096-ms time windows indicated in Figure 17. The graphs indicated four different heights. (a) h = 0.05 m; (b) h = 0.10 m; (c) h = 0.15 m and (d) h = 0.20 m.
Photonics 08 00450 g022
Figure 23. FFT of the FGB signal (F-R2) in the 1024-ms time window encapsulating all the dynamics of the drop test, i.e., the drop phase, first impact, bounce, second impact and subsequent oscillations until damping. The graphs indicated four different heights: (a) h = 0.05 m; (b) h = 0.10 m; (c) h = 0.15 m and (d) h = 0.20 m.
Photonics 08 00450 g023
Table 1. FBGs arrays’ configurations.
ChannelPositionSensor Nameλ (nm)
Ch 1Left LegF-R1 @ 0°
F-R2 @ 45°
F-R3 @ 90°
1530.126
1550.011
1570.167
Ch 2Impact PlatesFP1 (right)
FP2 (left)
1530.176
1570.003
Ch 3Right LegF1
F2
1530.124
1570.001
The strain sensitivity of the gratings that were used in the test campaign is βε = 0.89 με1. Therefore, according to Equation (2), for a central wavelength of 1550 nm, the sensitivity is Stheor = 1.38 pm/με [36].
Table 2. Impact velocities and free fall intervals.
h (m)v [m/s]TTFFT (s) *TEFFT (s) *ε% **
0.050.9900.1010.1064.99%
0.101.4010.1430.1536.94%
0.151.7160.1750.1908.59%
0.201.9810.2020.2219.30%
* TFFT is the theoretical free fall time; EFFT is the experimental free fall time. ** ε% is the ratio between the time intervals difference and its theoretical value.
Publisher’s Note: MDPI stays neutral with regard to jurisdictional claims in published maps and institutional affiliations.

