1. Introduction
Three-dimensional measurements (i.e., length, width, area, and depth) are useful tools to accurately monitor wounds [
1,
2]. Measurements obtained with computer vision-based methods are noninvasive and more reliable than those obtained manually [
3,
4]. In addition, reconstructed 3D virtual color models allow for remote consultation and tracking history [
5]. However, a complete wound assessment is necessary for clinicians to choose better treatments, and this requires not only volumetric metrics but additional information.
Temperatures related to the outside of the wound, such as periwound temperature and wound bed temperature, appear to be useful for clinical wound assessment [
6,
7]. Viewing these zones independently or in relation to other zones would serve to identify cases of stagnant or infection-prone wounds. For example, an increased peripheral wound temperature has been found to be associated with infection [
8], and wound temperature correlates to a wound bed score, which combines several wound characteristics and has been validated as a useful predictor of wound closure [
9].
In addition, temperature comparisons between different areas of the wound bed and outside the wound also provided valuable information. A temperature difference of 4 °C or more between the wound bed and normal reference skin is associated with infected wounds and may be useful in differentiating them from normally inflamed wounds [
10]. On the other hand, the difference in temperatures between the peripheral area of the wound and normal skin temperature can help identify a tendency of non-healing, and a large variation in the wound bed temperature also seems to indicate a tendency of non-healing [
11]. A more recent study proposes calculating an area indicator based on the temperature pattern [
12]. Wound thermal areas are then used to create area ratios between two consecutive weeks, and these appear to be useful for predicting the healing status at week four.
The 3D model and the thermal surface distribution can provide geometrical (areas and volume) and thermal metrics in addition to a visualization that helps raise patient awareness of their wound status. Most studies show the feasibility of creating 3D surface thermography using expensive devices and cameras in static positions [
13,
14]; however, thermography from a static viewing position limits the observation and analysis of wounds to a single view and underexploits the 3D component.
The use of a single thermal image provides limited analysis of a wound and is a problem in the case of large wounds, multiple wounds or wounds located in areas that are too curved, such as the contour of the foot. In these cases, a single view provides only partial information about the inside and outside of the wound. In curved areas, the emissivity of the skin, which is estimated at 0.98 from a frontal view, changes depending on the angle from which you look at it, and this can result in temperature estimation errors of up to 4 °C [
15,
16,
17]. Therefore, multiple thermal images are needed to provide a detailed and reliable measurement of the examination region.
Although large wounds or multiple wounds in the same area require more than just a single view for a better analysis, most previous work has used single-view static cameras. Thus, an interesting alternative is the use of portable thermal devices [
18,
19]. Moghadam presents a new device that allows to put three devices together: a thermal camera, a light projector, and a depth camera [
18]. On the other hand, Xu et al. propose a calibration between portable thermal cameras and depth imaging [
19]. Both alternatives are quite interesting as they can be used in handheld mode, but require the use of non-commercially available devices which could be expensive or difficult to obtain, especially in hospitals in remote locations.
In this work, we propose a set of comprehensive processes to create a multiview and multimodal, thermal and color, 3D model using low-cost commercial devices to facilitate wide deployment in hospitals and remote care centers. The contributions of the study could be summarized as follows:
The process of creating a 3D surface thermography from scratch using only portable devices: a mobile device and a low-cost portable thermal camera.
A novel approach to adjust the poses of the multiple views captured with the thermal camera to have an accurate mapping of thermal data on the 3D model surface.
The fusion of temperatures from multiple 2D thermograms to create a robust analysis of thermography using compelling 3D surface thermal mapping.
2. Materials and Methods
2.1. Data Acquisition
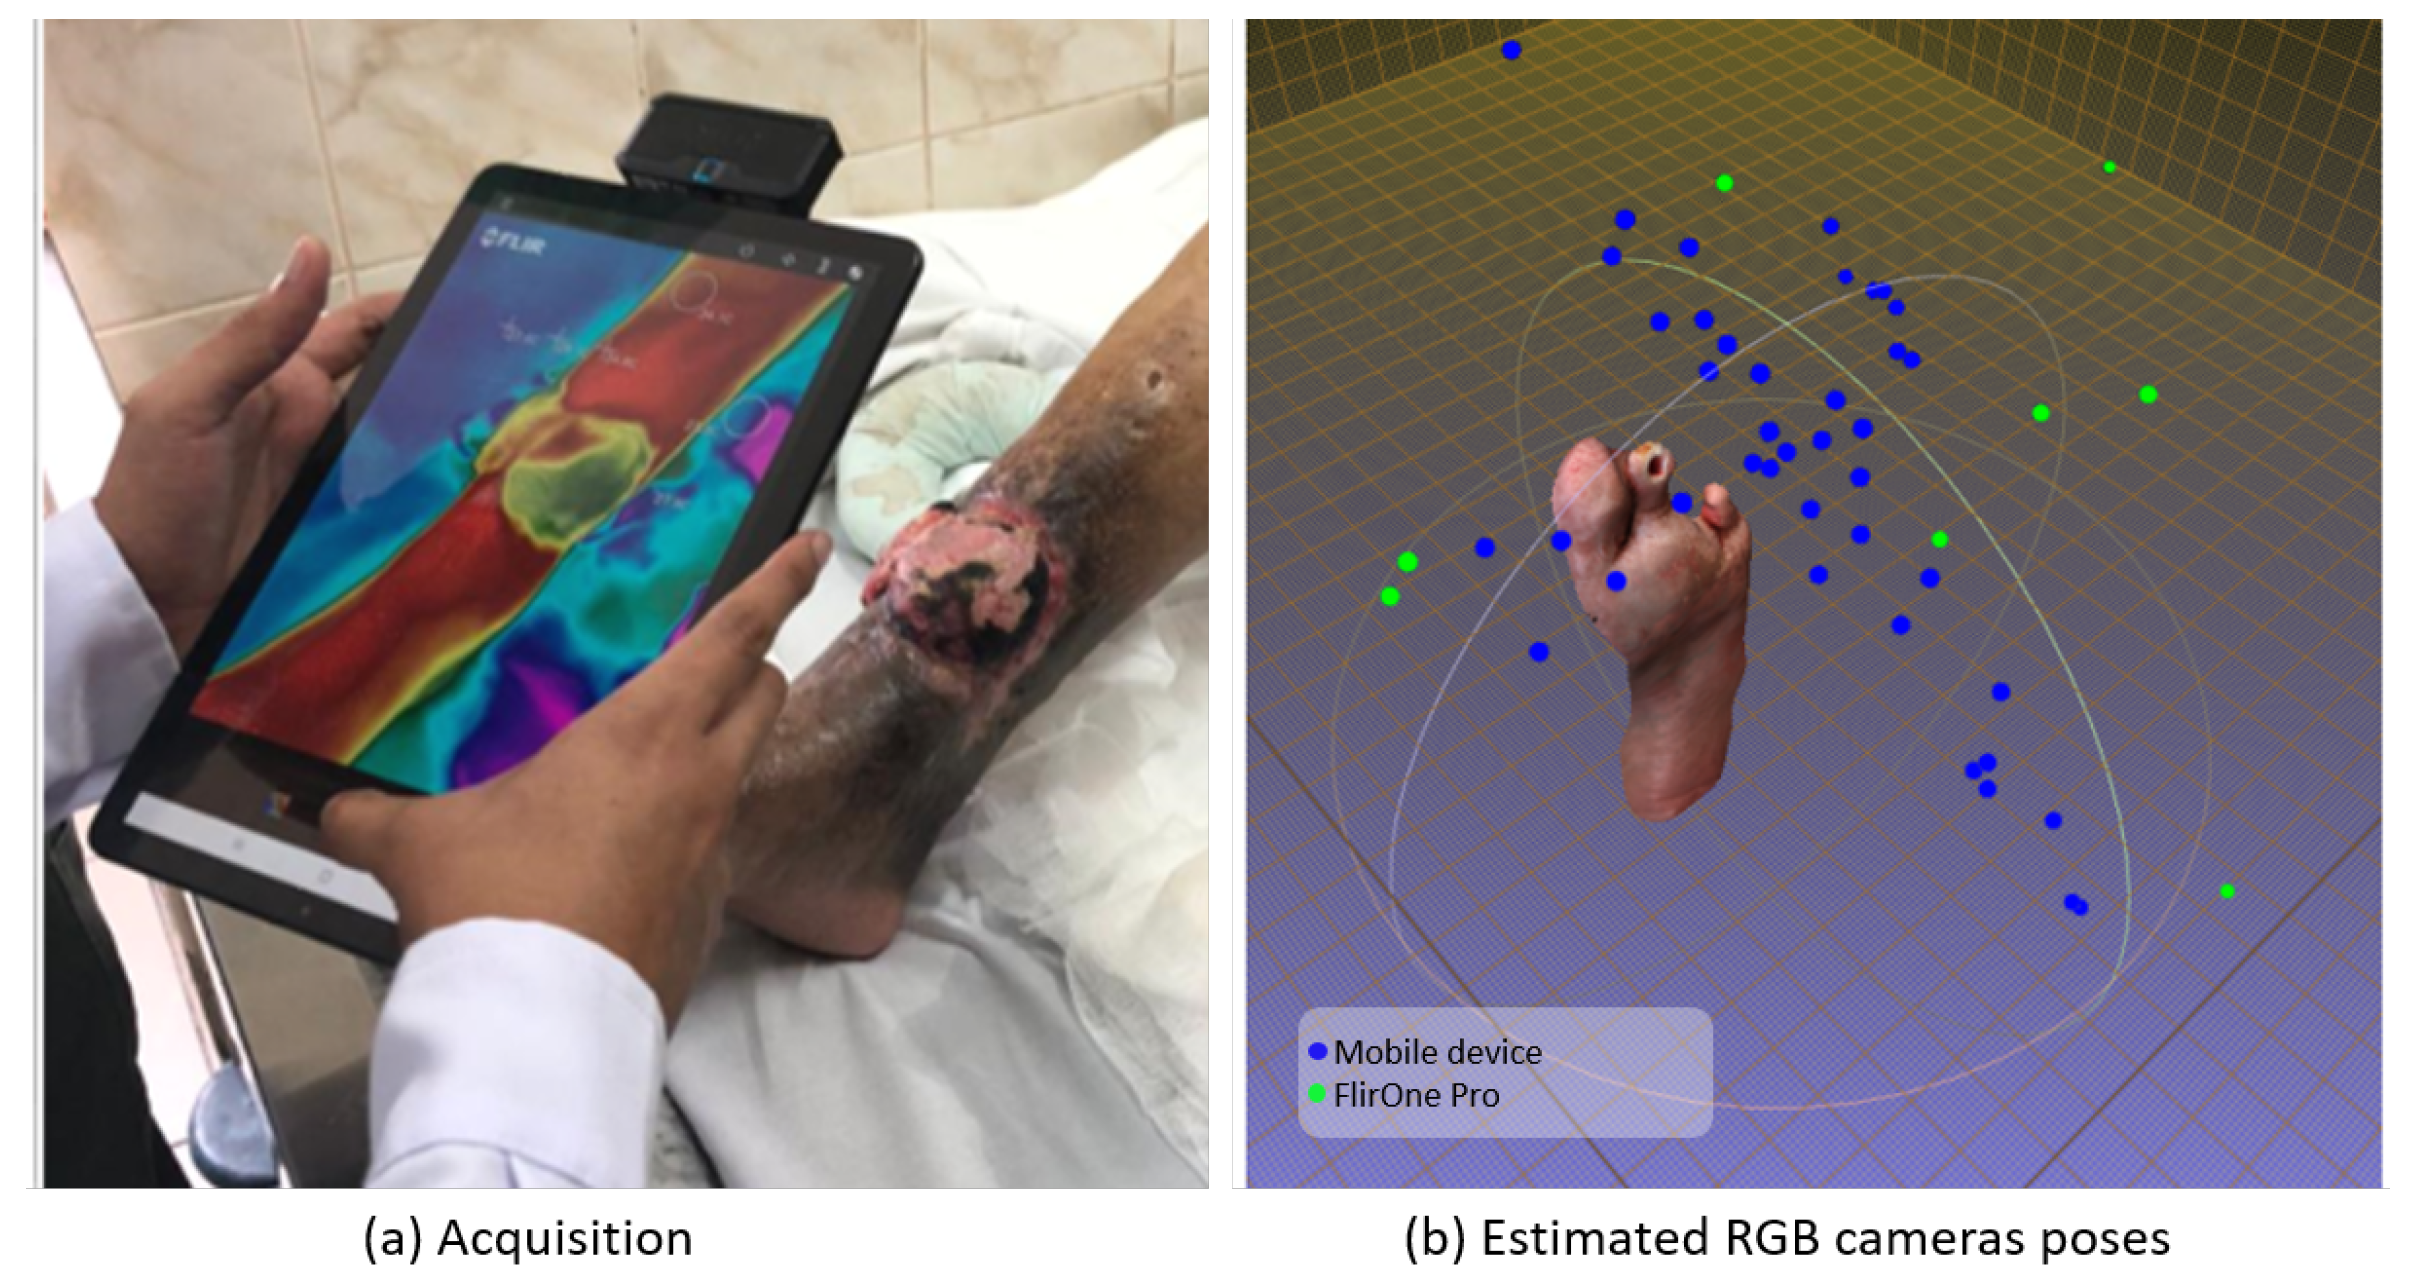
Images were acquired using a low-cost commercial thermal camera, FlirOne Pro (FLIR Systems, Inc., Wilsonville, OR, USA), and a mobile device, Samsung Galaxy Tab S4, at the hospital, Hipólito Unanue Hospital in Lima (Peru). The FlirOne Pro thermal camera is able to capture a pair of images in one shot: a 1080 × 1440 pixels RGB image, and a 480 × 640 pixels thermal image. The thermal accuracy of the FlirOne Pro, according to technical specifications, is or with 70 mk thermal sensitivity and a spectral range of 8–14 µm. On the other hand, the mobile device provides high-resolution RGB images: 4000 × 3000 pixels.
Prior to acquisition, patients were informed, and their consent to participate was obtained. Patients were asked to remain in a comfortable position, and a reference card was placed near the wound to adjust the scale of the 3D model.
Acquisition is performed handheld and starts with high-resolution color images acquired with the mobile device. Around 40 images are captured from different views following a classical acquisition for photogrammetry, where the device moves using a recommended arc-shaped motion with the camera always oriented towards the center of the wound. The goal of this acquisition is to have a variety of overlapping views to build a detailed 3D model. Thus, in larger wounds, the number of images can be increased in order to cover the entire wound with multiple views.
Next, with the thermal camera device also in handheld mode, around 8 images are obtained from different views using an arc-shaped motion similar to the previous one. In addition, to have a reference view of the temperature distribution in the wound and surrounding skin, a frontal thermal view of the wound was also captured approximately 10 cm further away than the other thermal images. This farthest frontal image was taken at the time chosen by the operator, i.e., it is not necessarily the last one taken.
Figure 1 shows an example of the acquisition performed with the mobile devices in handheld mode and the camera poses used.
The goal of the various thermal images is to capture the thermography of the wound and the surrounding area from various perspectives in order to combine them and map the temperatures to the surface of the 3D model. Not as many images are needed as those obtained in color; however, a larger number of images from different views could be useful to cover a more extensive surface of the 3D model with thermography. Additionally, as this is a manual acquisition, note that the operator may take a few more color or thermal images than requested if he inadvertently presses the camera shutter button during the acquisition process. This is not a problem as more images of the wound and surroundings will help in the reconstruction of the 3D model and creating the 3D surface thermography. The entire image acquisition process usually takes about 2 min and depends on the operator’s ability to take the pictures.
2.2. Thermal Mapping on 3D Model
From a 3D point cloud and a single thermal image with a known camera pose, temperatures can be assigned to the surface of the 3D model. For this, the 3D point cloud is projected onto the 2D thermal image plane, and the temperatures of each pixel are mapped to the projected points.
The 3D model is created using the Structure from Motion (SfM) technique as it only requires a set of color images to create the point cloud, mesh, and texture of an object in 3D. This technique is particularly useful since it allows the use of any commercially available camera to take multiple images from different perspectives and provide useful geometrical metrics for wounds [
20]. In this work, an incremental SfM pipeline is used that allows using images from cameras with different internal calibrations: the color images obtained with the mobile device and the color images obtained with the FlirOne device [
21]. The whole process is performed using Meshroom software [
22].
The registration of the 2D temperature to the 3D point cloud is accurate when the color and thermal cameras are in a fixed relative position, and the captures are performed at the same time. However, when working with a handheld mode acquisition, despite having the cameras in a fixed relative position on the device, the captures are performed asynchronously with a small delay between them; therefore, problems in accurately matching 2D to 3D surface thermography arise. To address this problem, we propose to use a baseline registration between the FlirOne color and thermal pair of images based on multimodal calibration, then refine the infrared (IR) camera pose by optimizing the correlation of temperatures mapped from different thermal views.
2.3. Baseline Registration
The pair of sensors of the FlirOne thermal device, color and infrared image sensors, are separated by a small distance inside the thermal camera device. When obtaining the camera pose from 3D modeling, the poses of the FlirOne’s color image sensor are acquired. Thus, to estimate the baseline pose of the corresponding thermal image sensor, a geometrical transformation has to be performed: a rotation and translation transformation.
The rotation (
) and translation (
) required for the geometrical transformation are obtained through a multimodal calibration using a thermal checkerboard created in our previous work [
23]. The transformation is then applied to the extrinsic camera pose parameters of the i-th color image (RGB image) estimated by SfM. Let
and
be the extrinsics parameters of the i-th color image. To obtain a baseline estimate of the i-th thermal camera pose, the following transformation will be used:
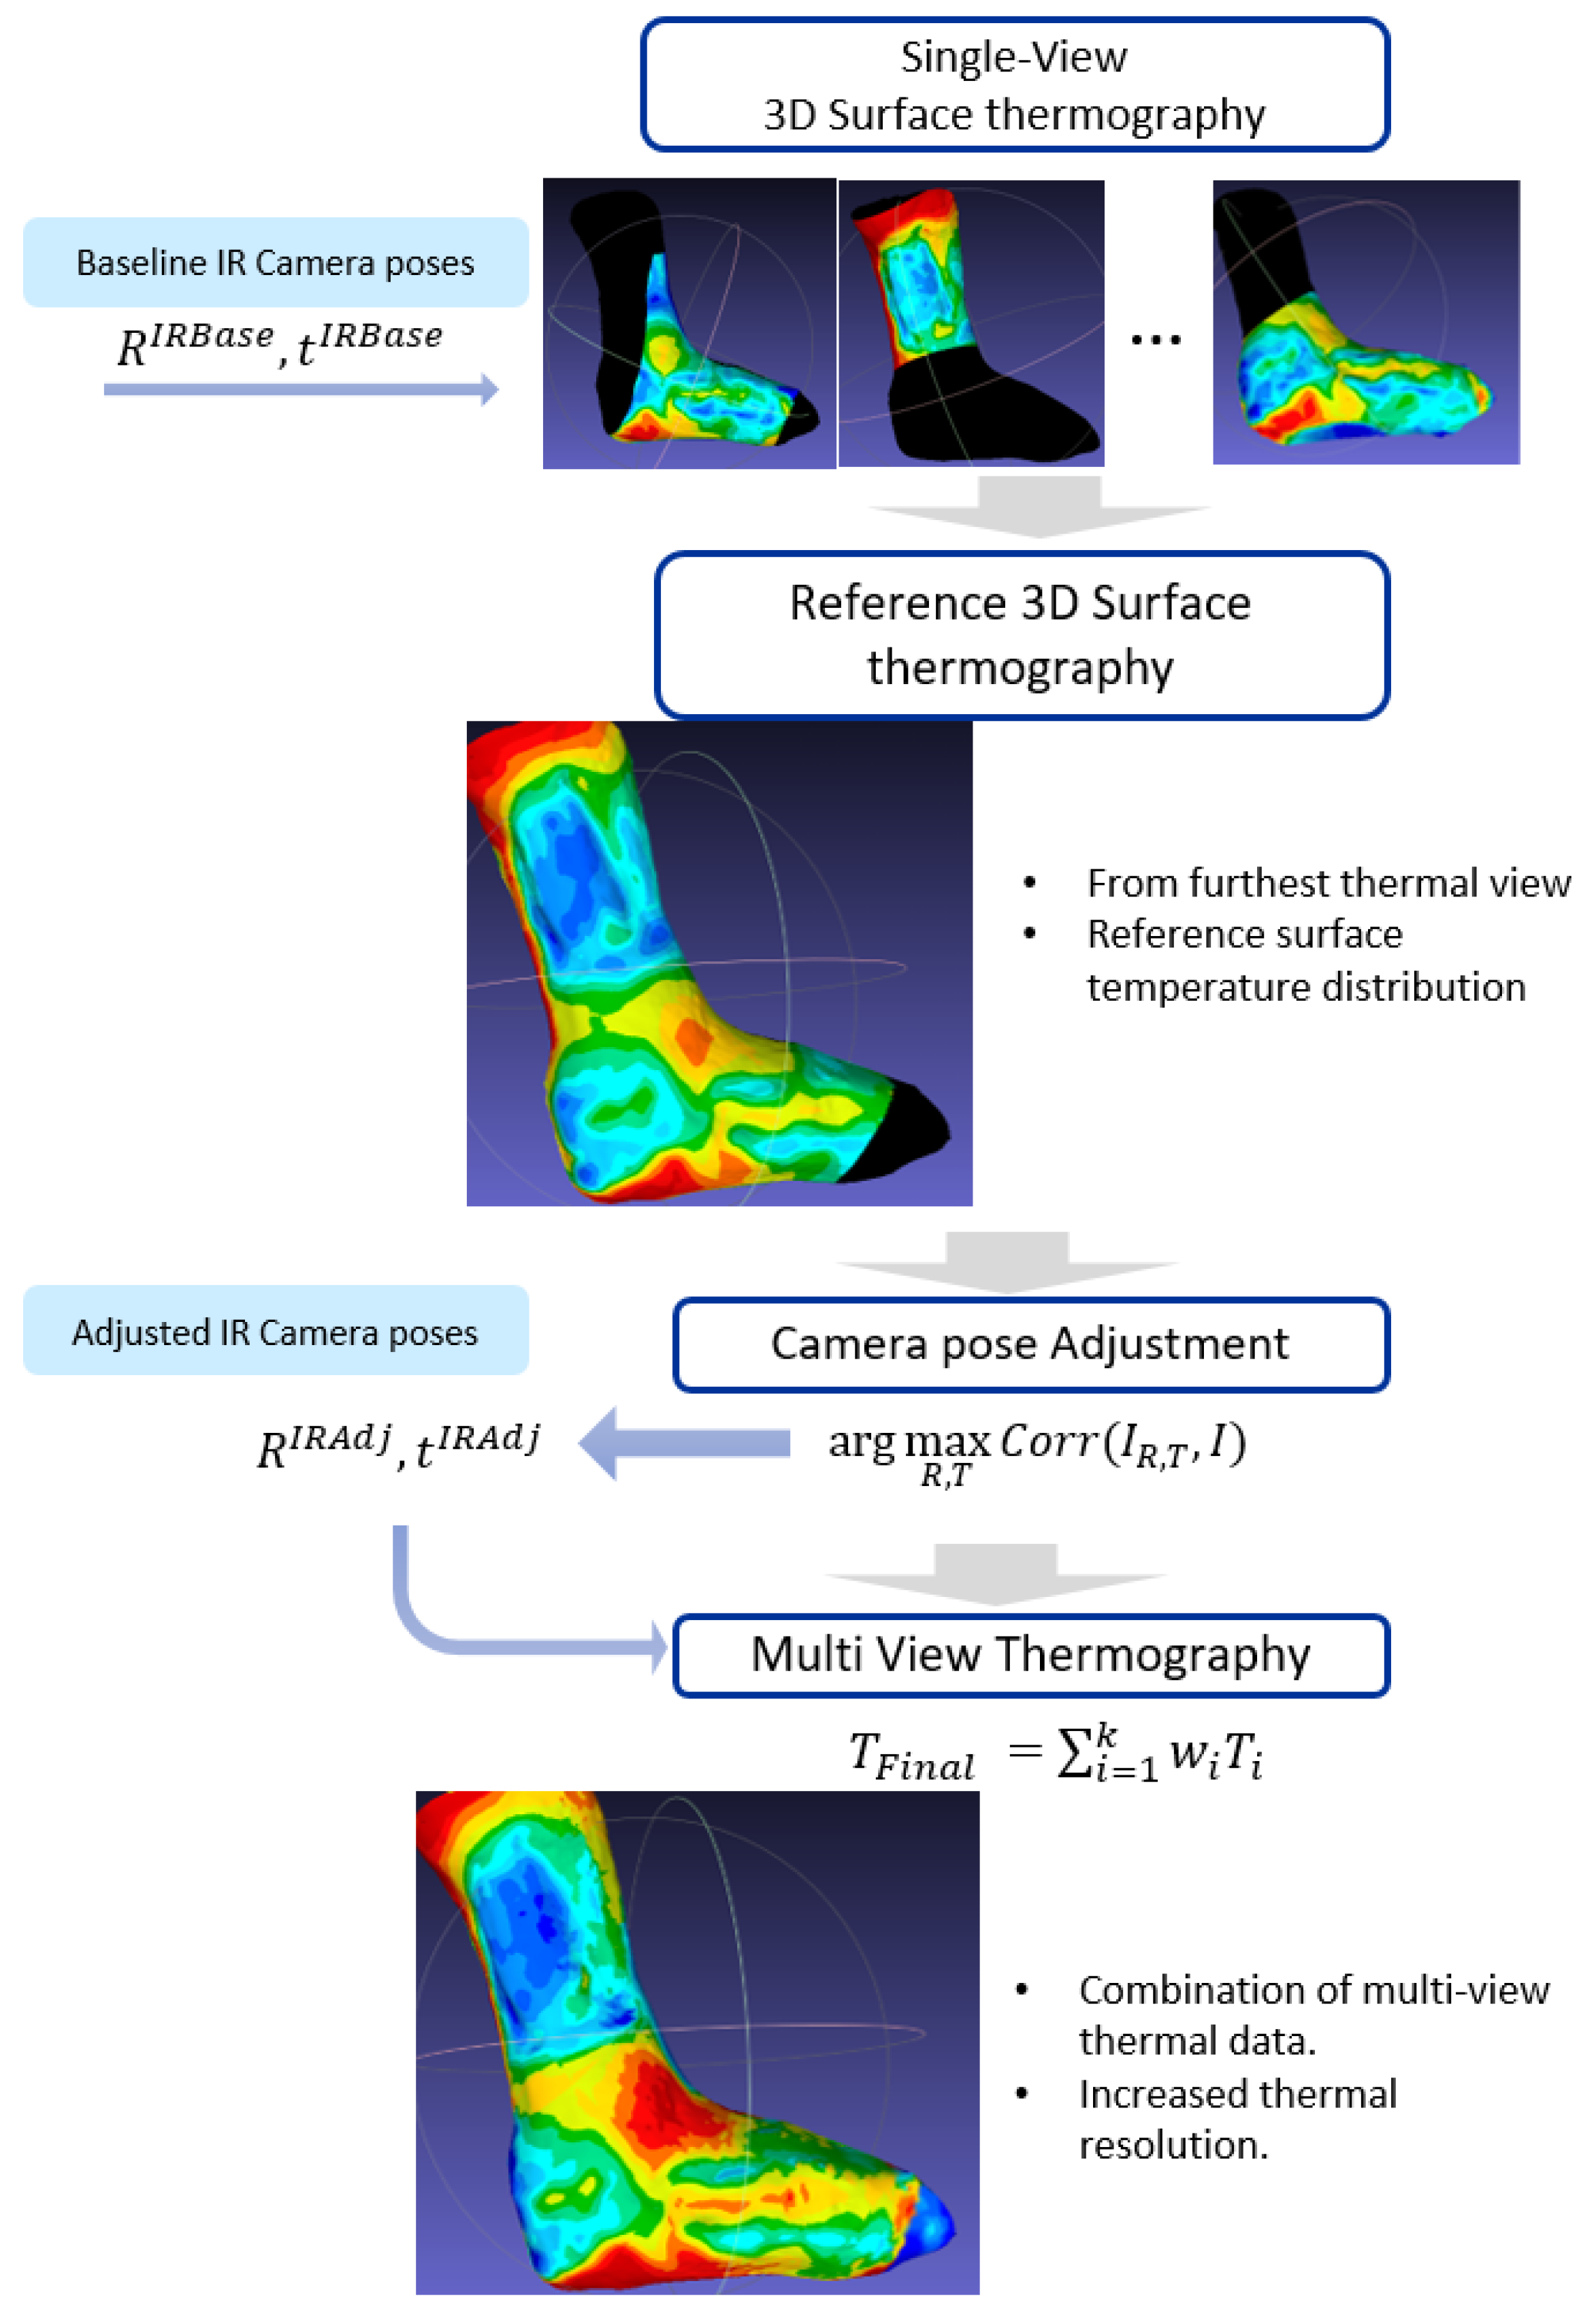
2.4. Multiview Thermography
The creation of a multi-view 3D surface thermography consists of three steps: First, a selection of a reference thermal mapping. Then, an adjustment of the camera poses according to the reference mapping; finally, a combination of the thermal mapping information from different views. The result is a multi-view thermal mapping of the 3D surface, which has a higher resolution and can cover a larger area compared to single-view thermal mapping. The workflow is presented in
Figure 2.
2.4.1. Reference Surface Thermography
The reference surface thermography or reference view in this study is the surface thermography associated to a reference thermal frame: the thermal image taken from the farthest frontal view of the wound.
The reference thermal frame is automatically selected from all thermal frames by calculating the angles and distances between each camera and the wound. To do this, we use the following process: For each thermal image, a wound segmentation is performed on its corresponding RGB image; then the 2D segmentation is passed onto to the 3D model surface; and finally, the distance and angle between the thermal camera and the wound region are calculated. The distance and angles calculated in this step are used to automatically select the furthest frontal frame, i.e., the reference thermal frame. The automated 2D wound segmentation process was performed based on a deep learning model developed in a previous study by the same research group [
24].
The reference surface thermography provides an overview of the temperature pattern of the wound and its surroundings. Though this surface thermography does not contain detailed information, it serves to fine-tune the camera poses of the remaining views, which will provide finer temperature details in the final 3D surface thermography.
2.4.2. Thermal Camera Pose Adjustments
The relative baseline transformation between the cameras, denoted as (rotation) and (translation), give an estimate of the position of the thermal sensor that must be adjusted. For this adjustment, the reference view, i.e., the reference 3D surface thermography, is proposed to be used as the basis. The thermal camera poses are adjusted to ensure similarity between the temperatures from the projection of the reference view and each thermal image.
The adjustment of the camera poses is performed for each of the individual frames obtained with the thermal camera. It starts by projecting the reference view to a thermal image plane using the baseline thermal camera pose. Then, an optimization is performed by adjusting the thermal camera pose in order to maximize the similarity in temperatures between the synthetic thermal image (projected reference surface thermography) and the real thermal image. Since both synthetic and real thermal images are in the same modality, the similarity indicator chosen to perform this optimization is the intensity-based 2D correlation coefficient [
25,
26]. Moreover, the 2D correlation coefficient provides an indicator that is easy to interpret: the closer it is to one, the more similar the images are.
where
is a one-dimensional vector of temperature values from the synthetic thermal image created with the camera pose
R and
t.
I is a one-dimensional vector of temperature values from the real thermal image.
2.4.3. Combining Multi-View Thermal Data
The thermal mapping to the 3D model surface is performed for each of the thermal images using the refined camera poses obtained after the camera pose adjustment. The 3D point cloud projected onto the 2D thermal image plane is used to map temperatures from pixels to points. As a result, multiple thermal data measurements are obtained for each of the points on the surface of the 3D model.
Multiple data measurements for each point are combined with a weighted average to obtain a temperature summary for each point on the surface. The weighted average of the temperatures from multiple views is performed with an algorithm similar to the one proposed by Vidas et al. [
27]. In our case, the weighted average takes into account the distance and viewing angle between the camera and each point. The distance between the camera and each point is calculated from the camera pose. The angle between the camera and each point is calculated between the principal axis of the camera and the normal of each point—the latter estimated via principal component analysis for the covariance matrix of the nearest neighbor points. Distance and angle calculations are computed with the open3D library in Python [
28].
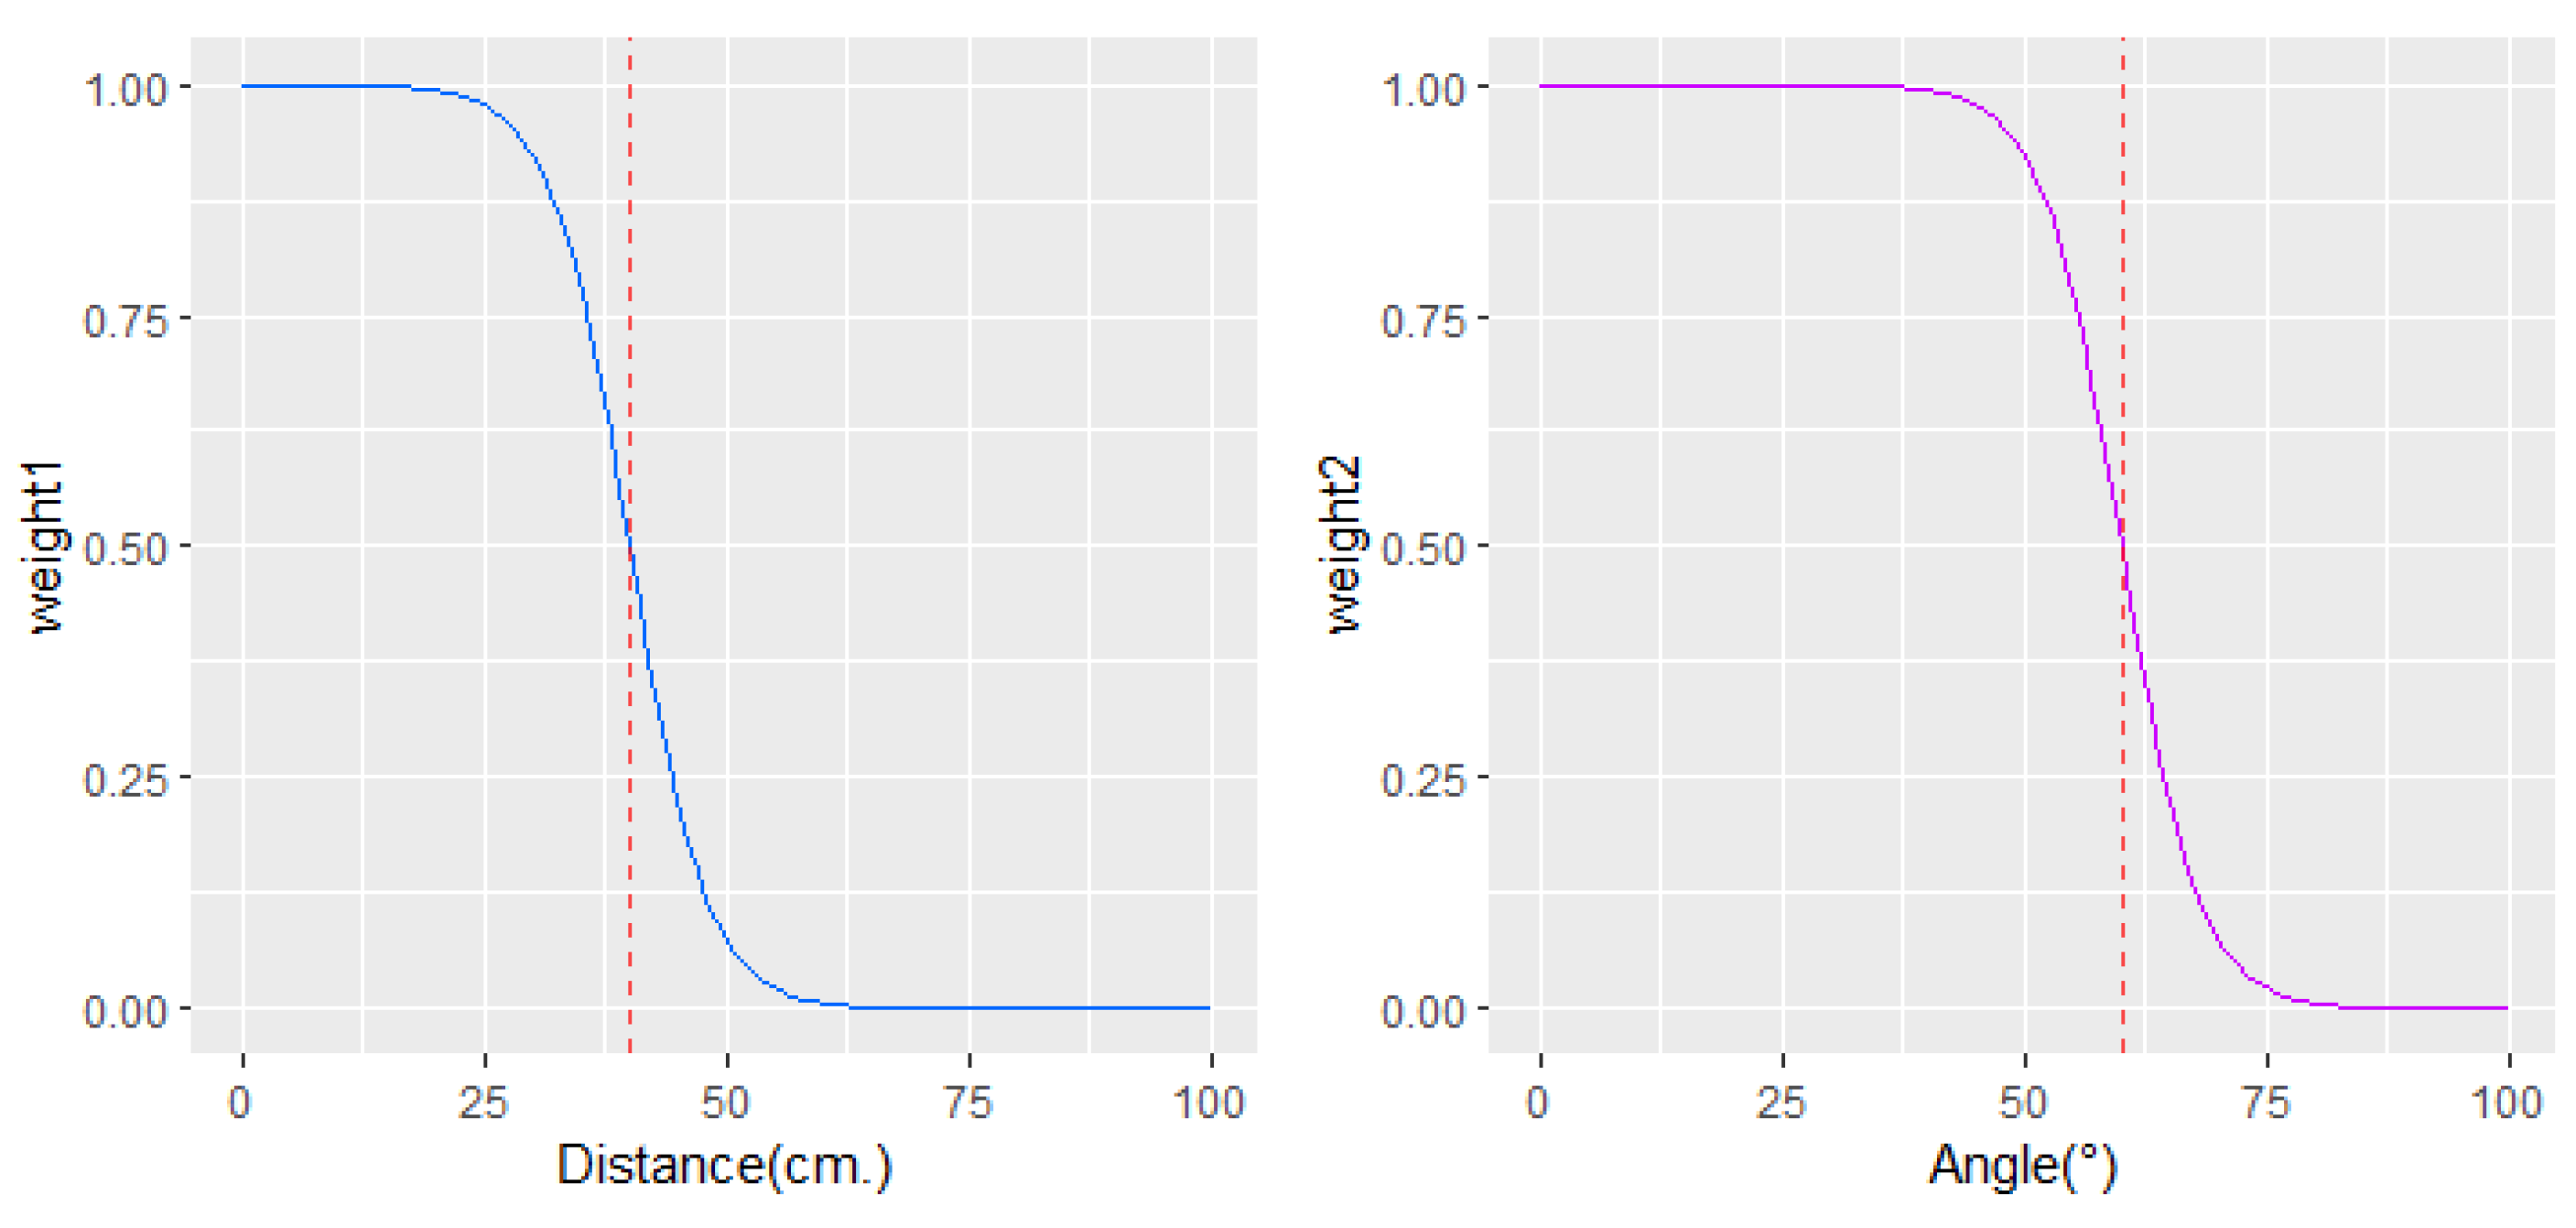
Experimentally and theoretically, it has been proven that the viewing angle of a surface influences the emissivity of the surface, and consequently, errors in temperature measurements can be recorded [
15,
16]. When the viewing angle is less than about 40°, no significant changes in skin emissivity are reported, and therefore, no significant errors in temperature measurements are observed. However, much wider angles are affected by a measurement error. Between 40° and 60° in the viewing angle, about 2 °C or less of measurement error can occur; and as the angle moves away from 60°, larger errors in temperature measurements occur.
Similarly, errors in temperature measurements appear as the distance between the skin and the camera increases [
17]. Environmental conditions, reflection from other surfaces, and ambient radiation are factors that contribute to error when imaging at long distances. Therefore, thermographic images obtained at short distances, below 40 cm, are considered more reliable than those farther away.
Thus, in the process of temperature fusion from different views that we propose, higher priority is given to thermal information obtained at a distance of up to 40 cm and a viewing angle of less than 60° between the camera and the skin. The weights are inversely associated to distance and angle via inverse logistic function to set high weights on distances before 40 cm and angles below 60°. The weighting functions used to prioritize information obtained from different angles and distances are shown in
Figure 3. Weighted averaging to combine the information of
k thermal images from different perspectives is performed at each point in the 3D point cloud as follows:
where
is the final temperature for a point in the 3D point cloud, and
is the final weight of the thermal information at a point, obtained with the
i-th of the
k thermal images.
and
are the weights of the information obtained from the
i-th thermal image according to the camera-point distance and angle.
2.5. 3D Wound and Periwound Area
The wound and periwound area definition in the 3D model is necessary to calculate the summary of temperature measurements inside and outside the wound (periwound). In this section, we explain how the wound and periwound area are defined in the 3D model.
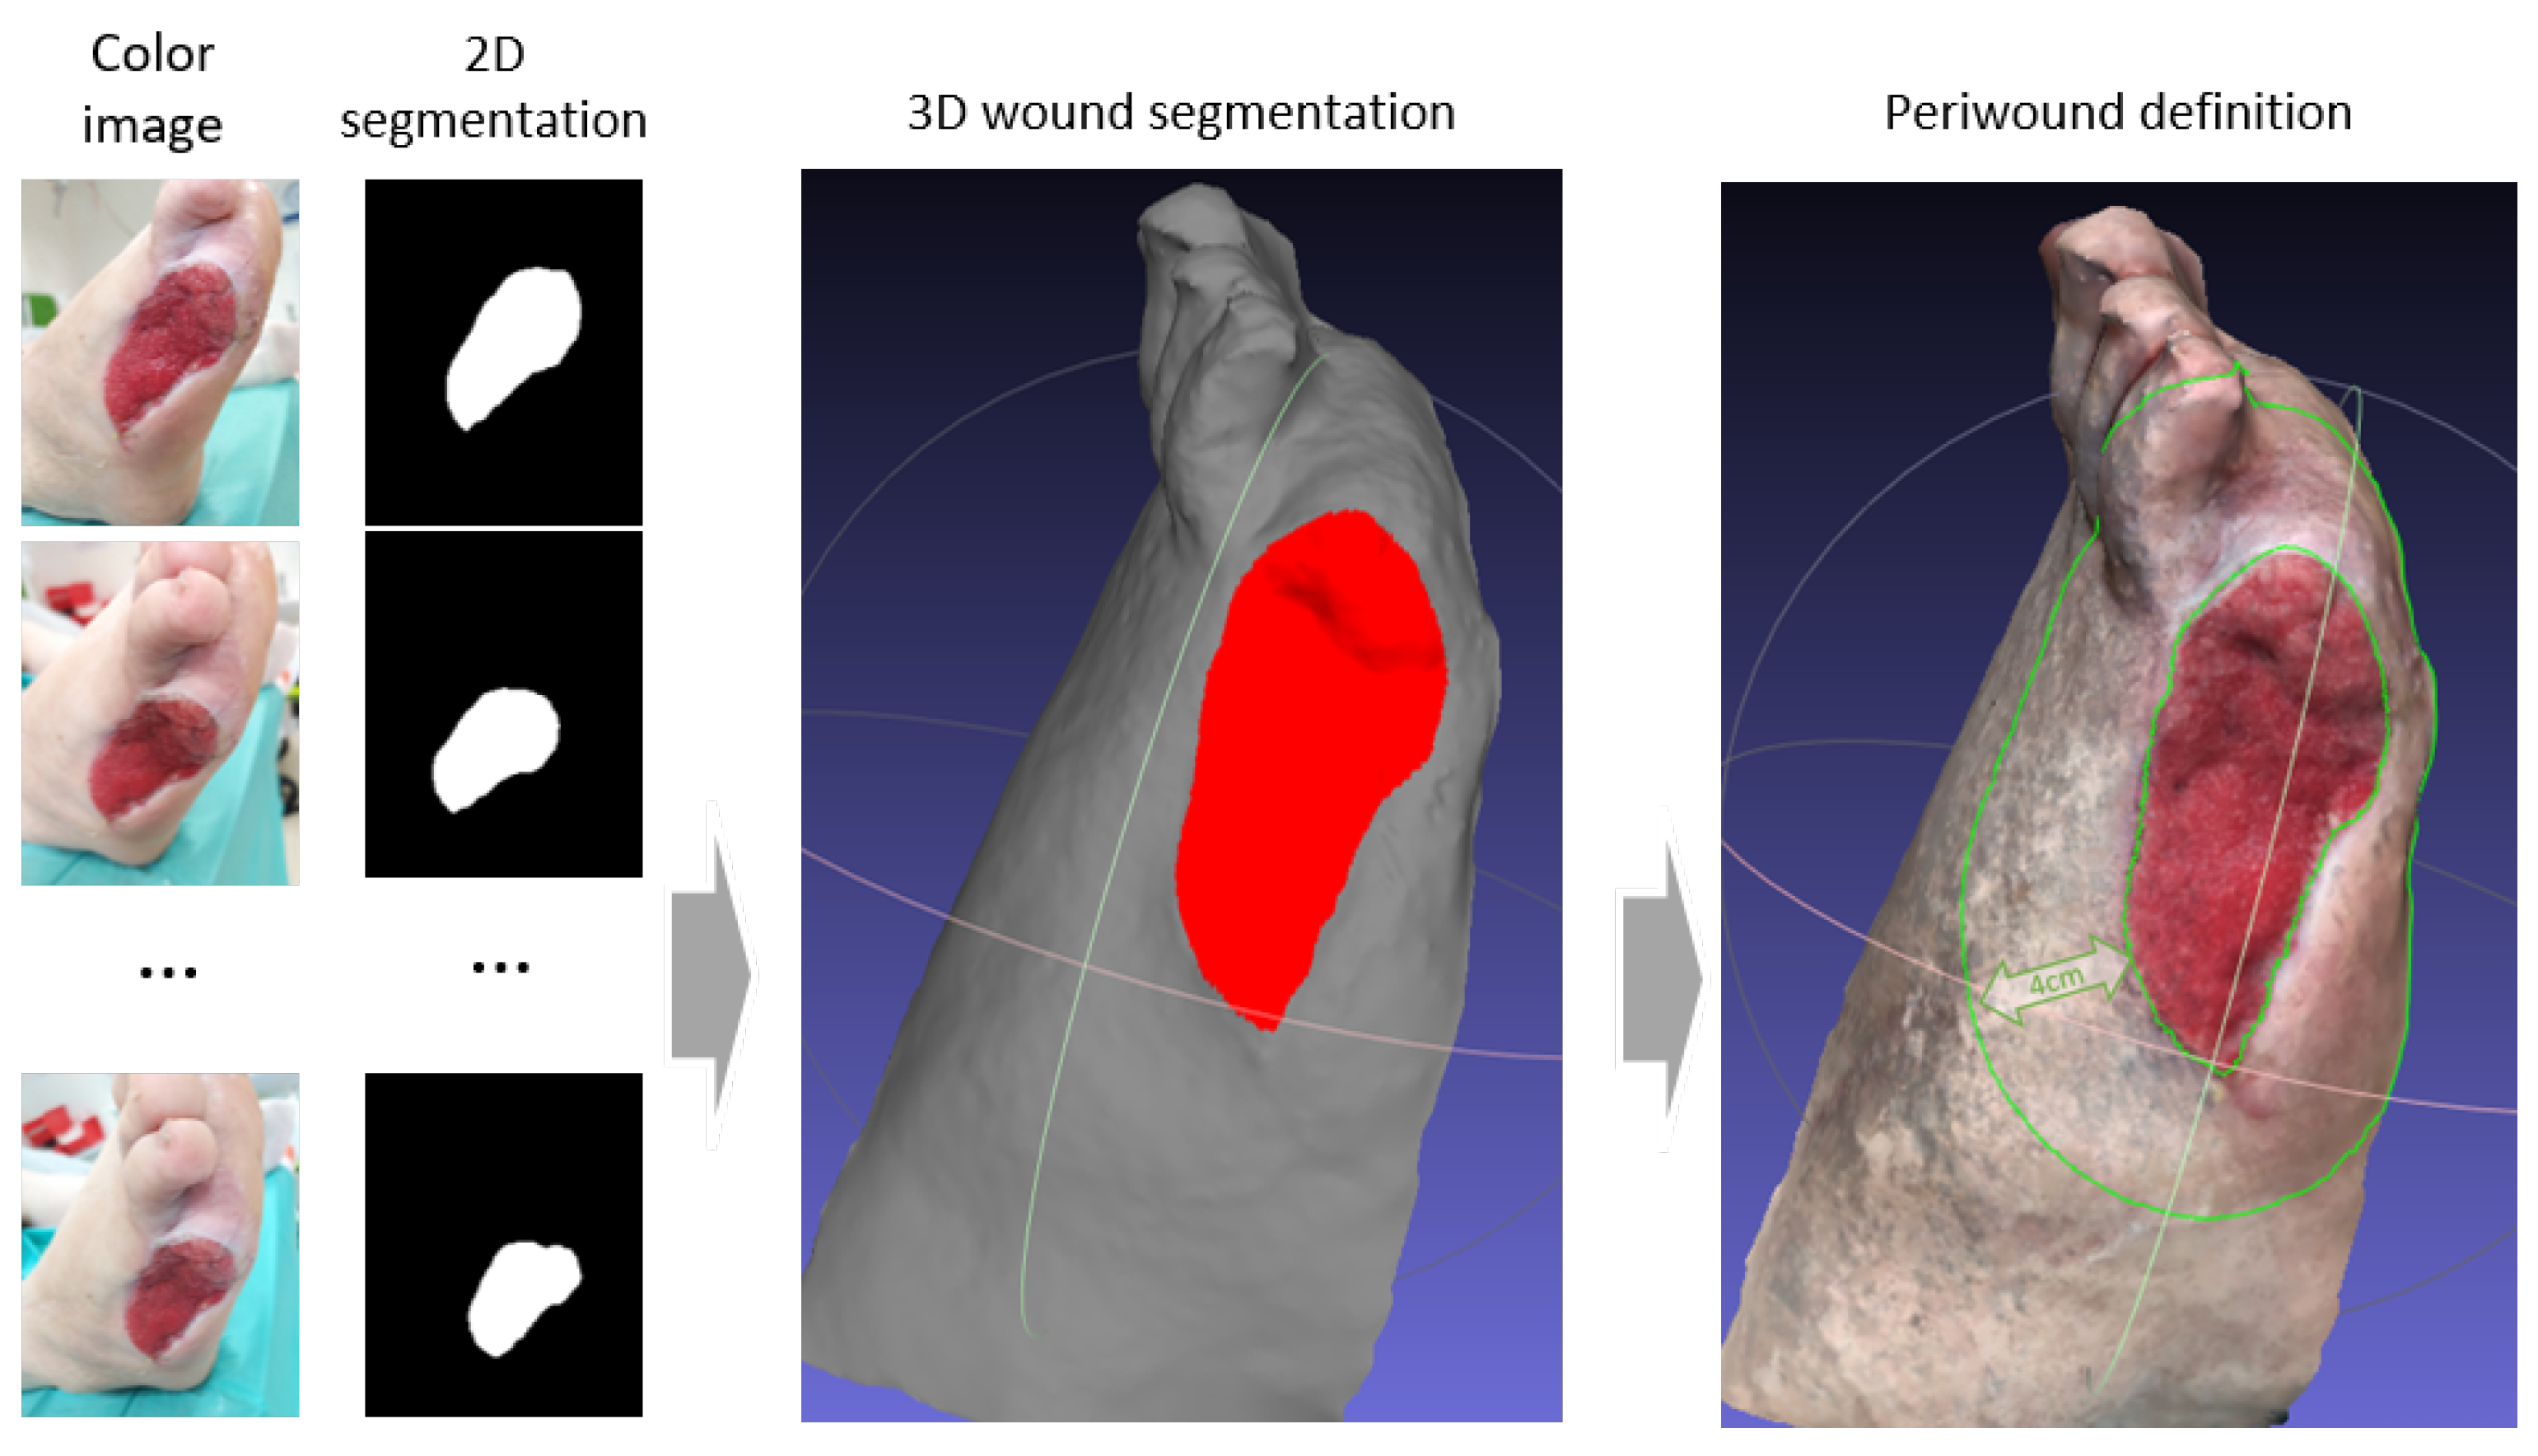
The wound segmentation in the 3D model was created from segmentations of the 2D color images. The 2D segmentation was performed using a deep learning model previously developed by the same research group [
24]. All 2D segmentations were reprojected to the 3D point cloud in order to create the wound segmentation in 3D. Discrepancies between multiple segmentations were resolved according to the majority vote of the multiple views at each point in the cloud.
The periwound was then defined as the area outside the wound with a distance of up to 4 cm from the wound edges. For the calculation of the distances, the geodesic distance was used to account for the curvature of the body.
Figure 4 illustrates the 2D wound segmentation, the 3D wound segmentation, and periwound area definition.
3. Results
The proposed methodology was successfully applied to wound images from six different patients.
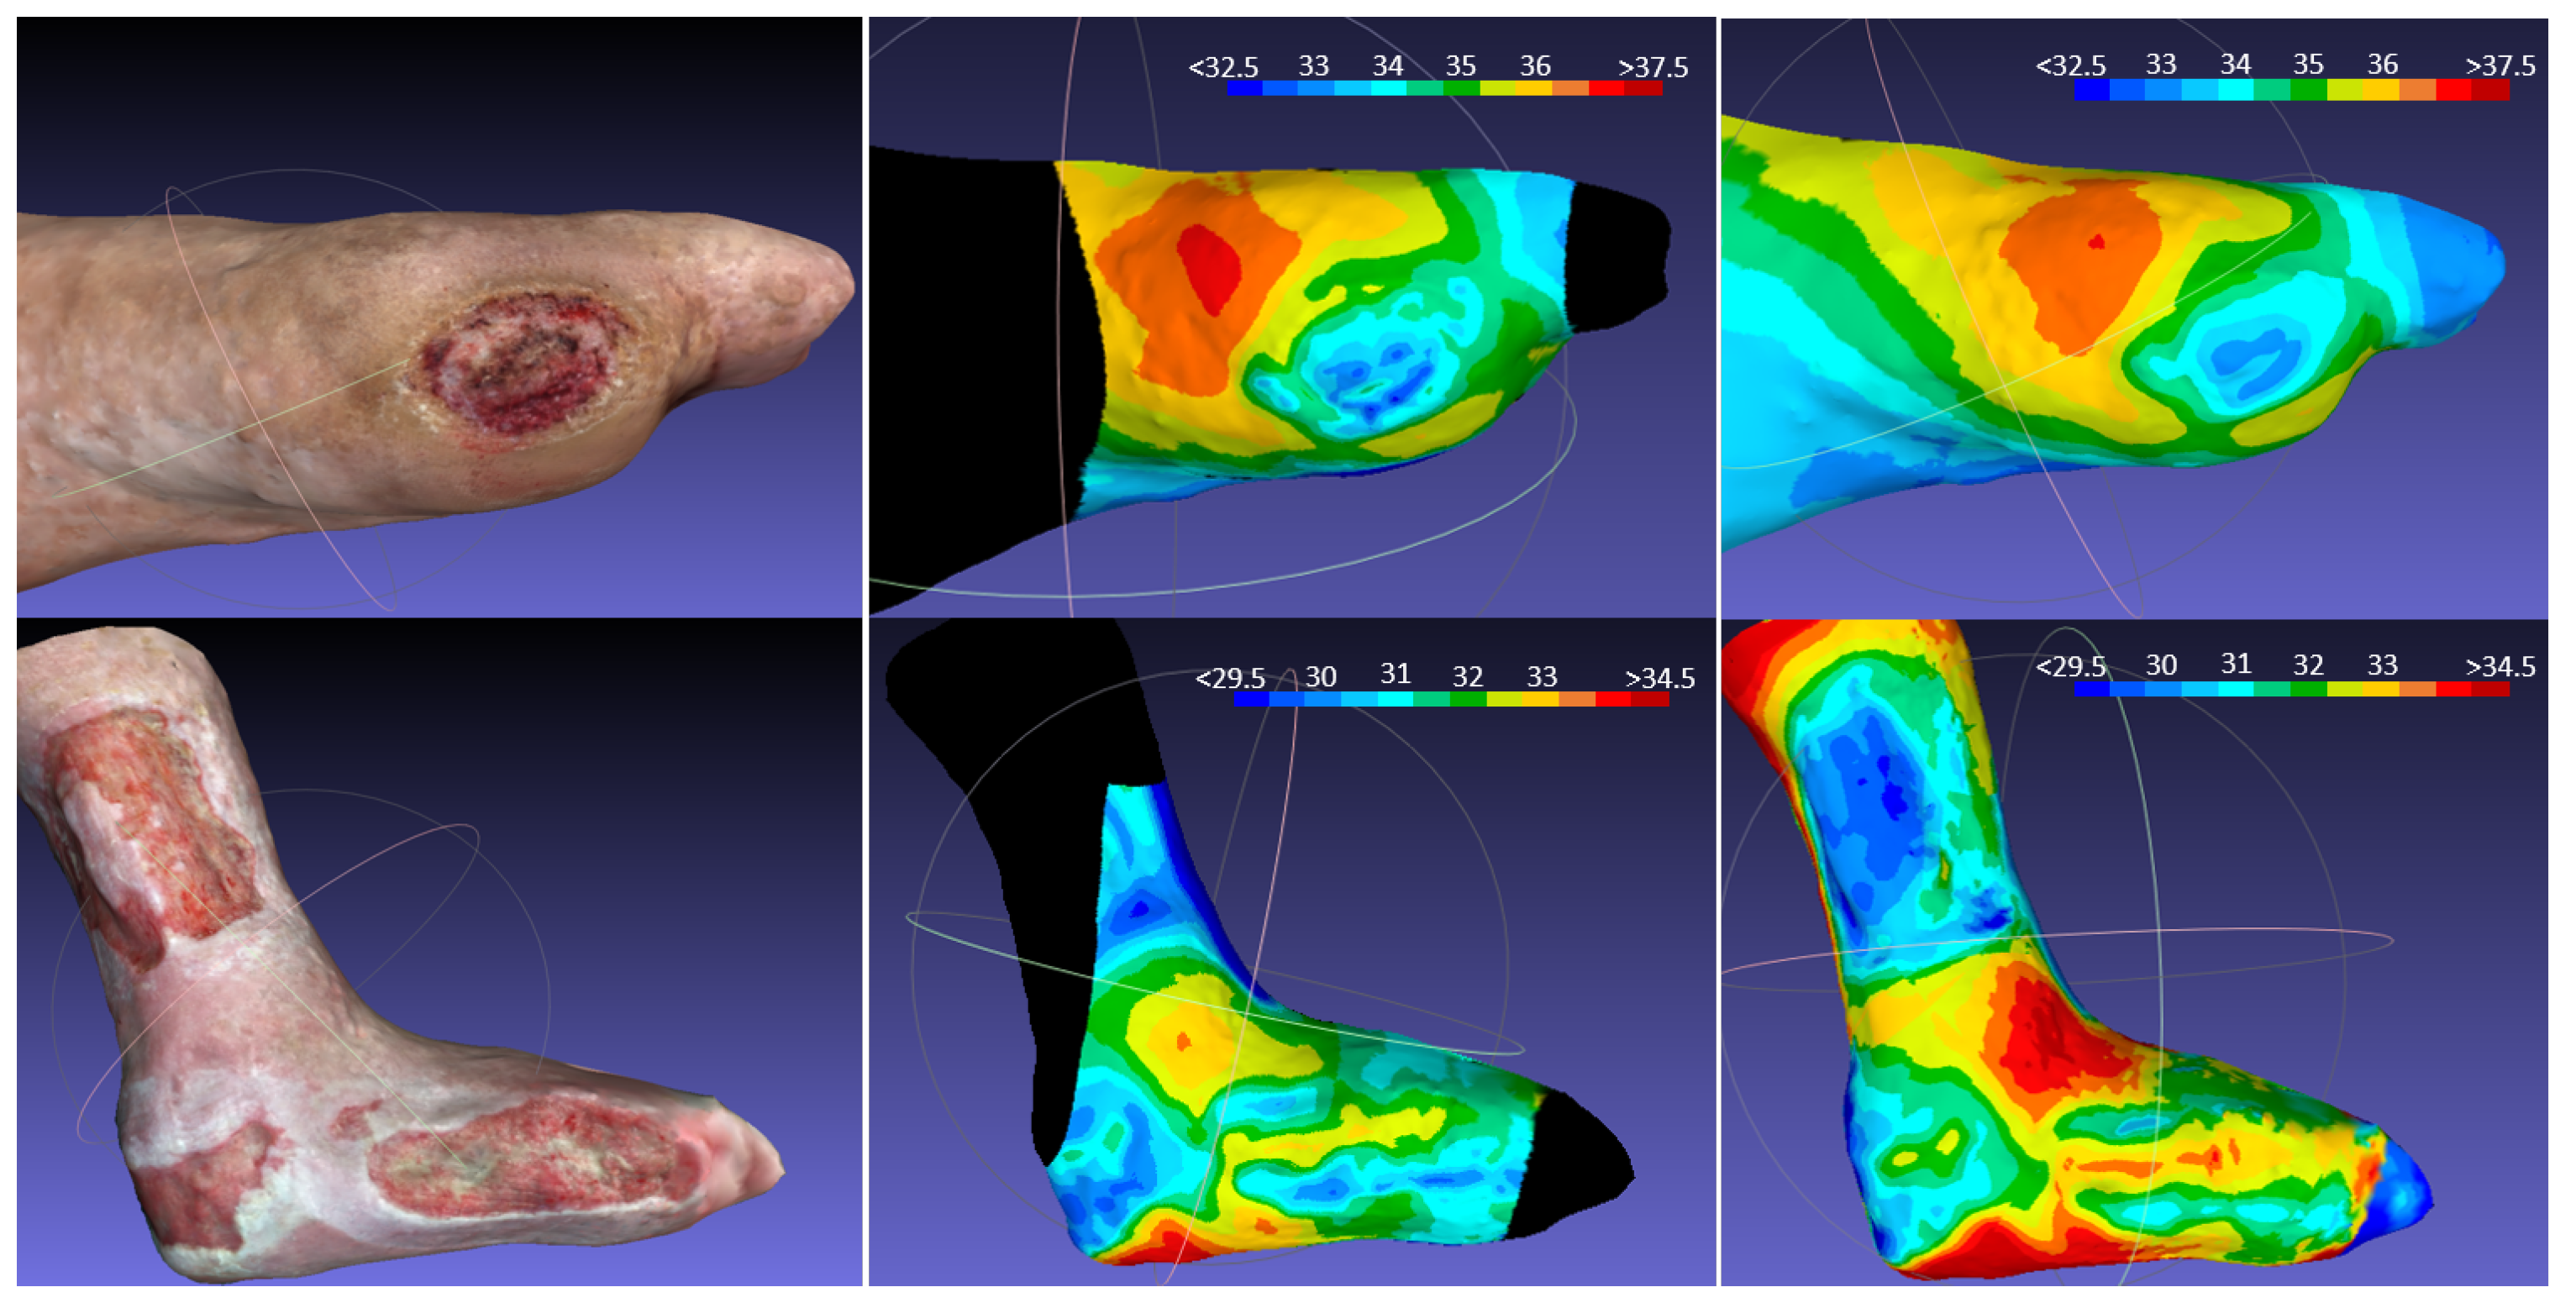
Figure 5 illustrates the multiview thermal models in two cases of wounds: one located in a curved area and the other with multiple wounds in the same area. By using a multiview thermography with the proposed methodology, a more extensive area of the skin can be covered with thermal information, making it possible to obtain thermal metrics of the wound bed and periwound.
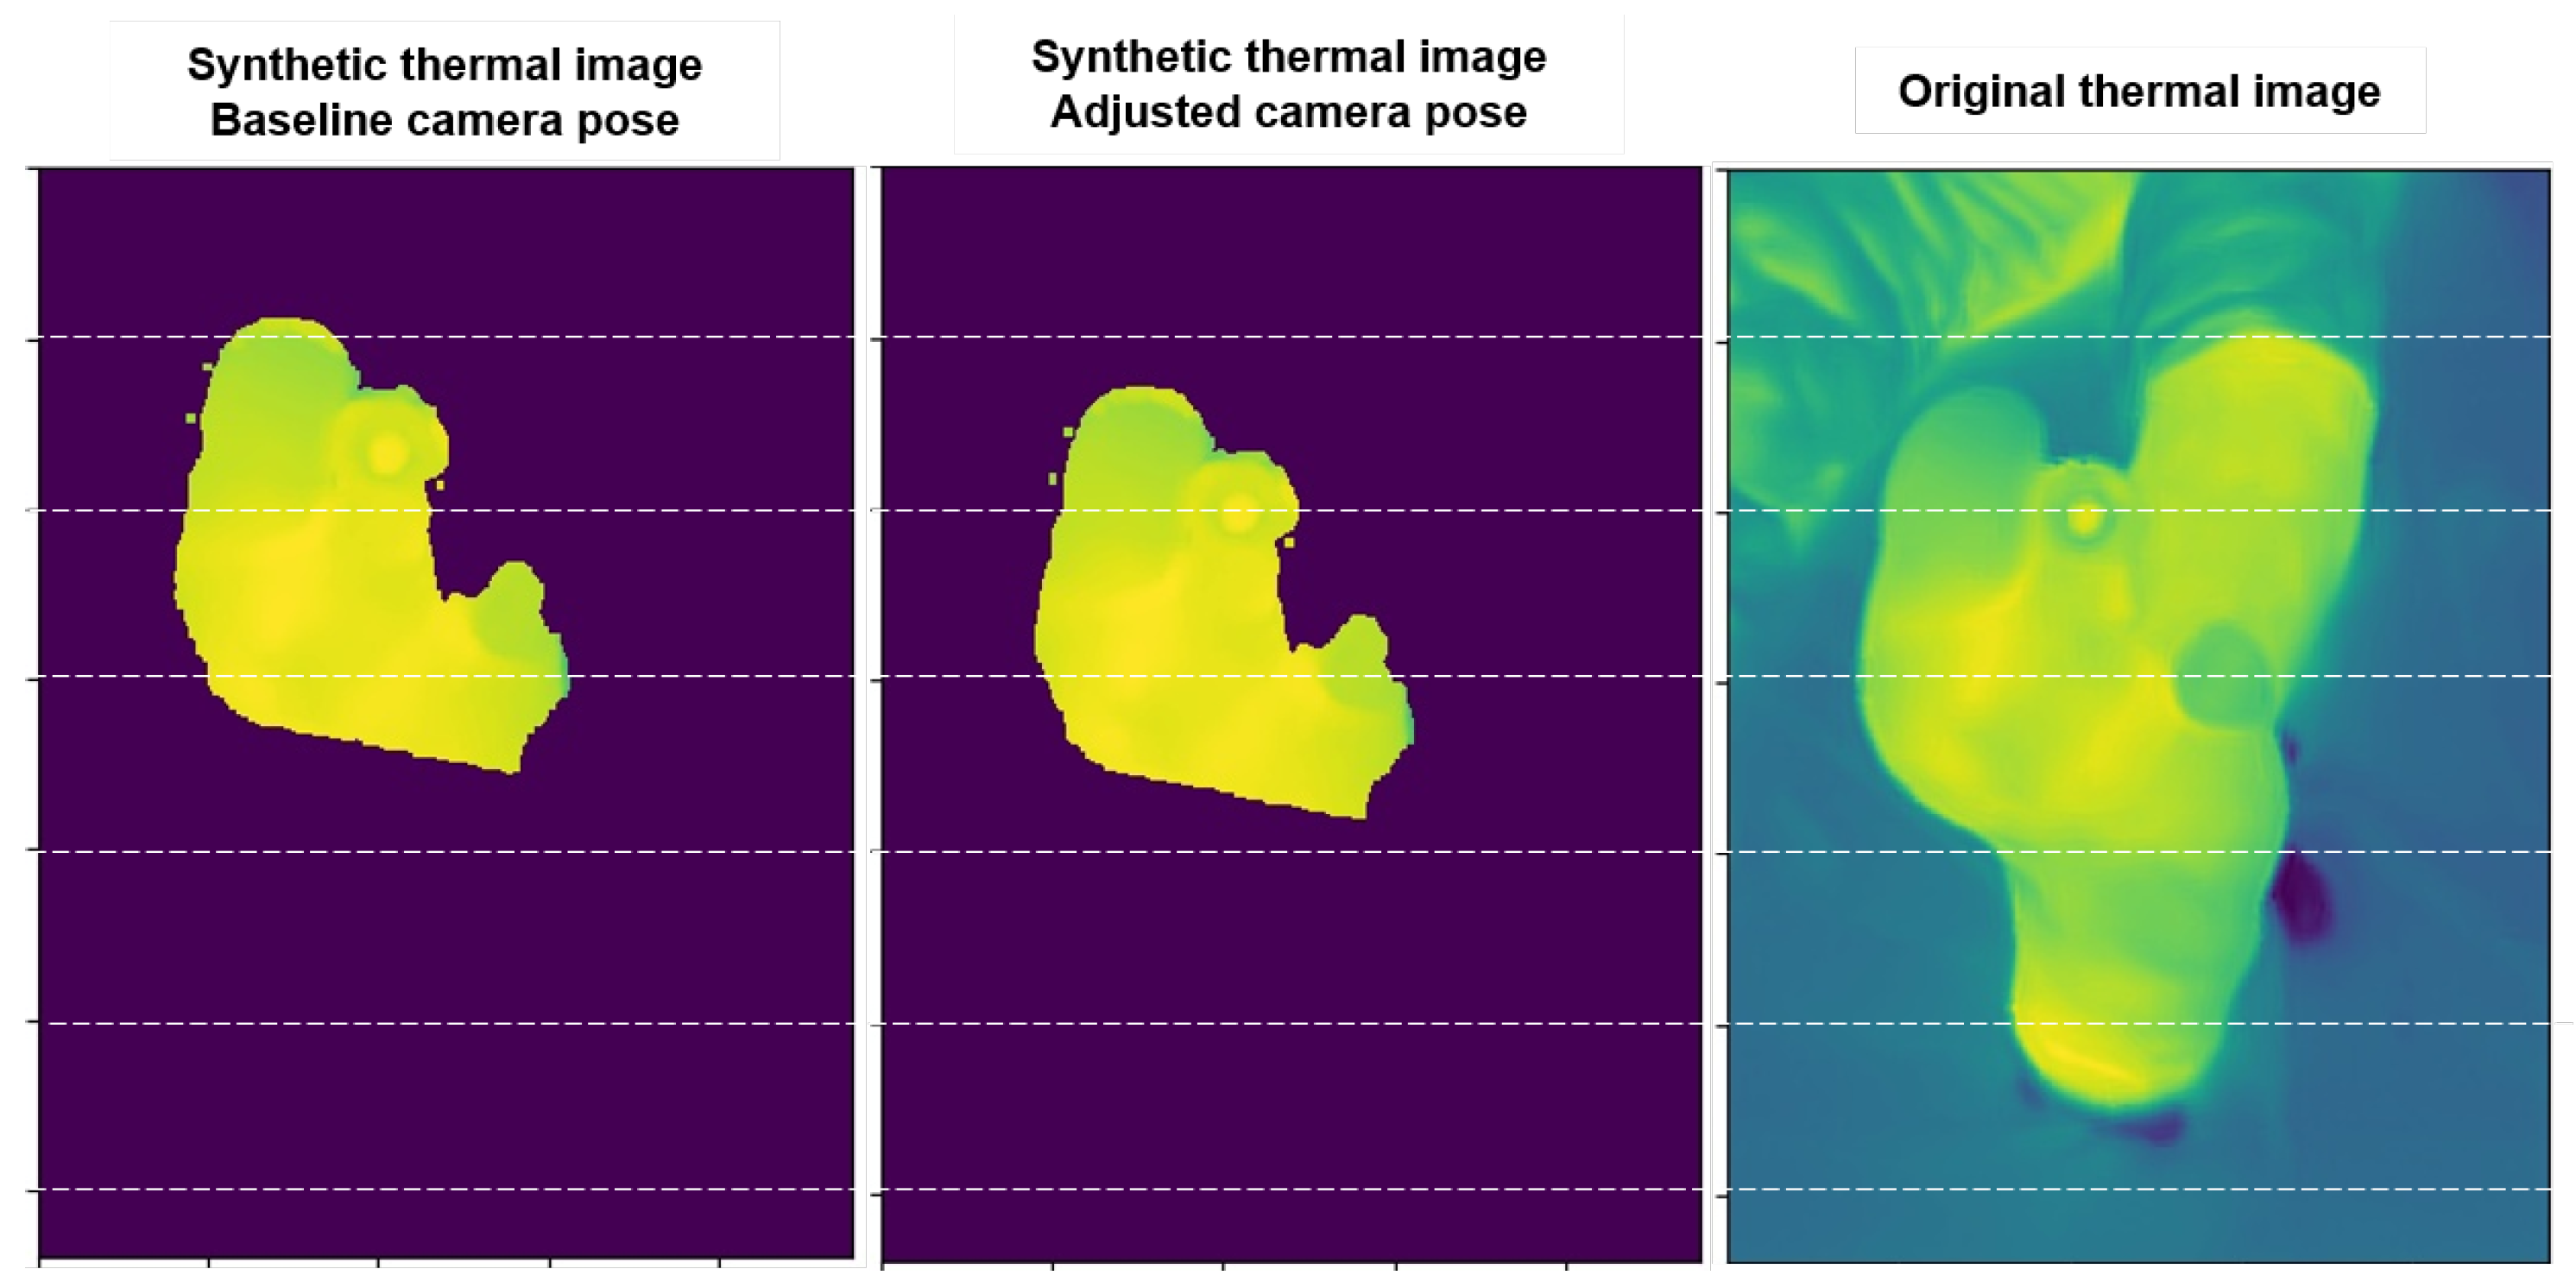
During the pose refinement algorithm, the 2D correlation usually improves from 0.5 or less with the reference poses to 0.75 or more with the proposed pose refinement. Pose refinement improvements are observed by projecting the reference 3D surface thermogram onto each 2D view using camera pose estimation and comparing them with the original thermal images, as in
Figure 6. In this figure, we can see examples of synthetic thermal images created from the projection of the reference 3D surface thermography using the baseline and the adjusted camera pose, respectively. The synthetic image created with the adjusted pose is clearly closer to the original thermal image.
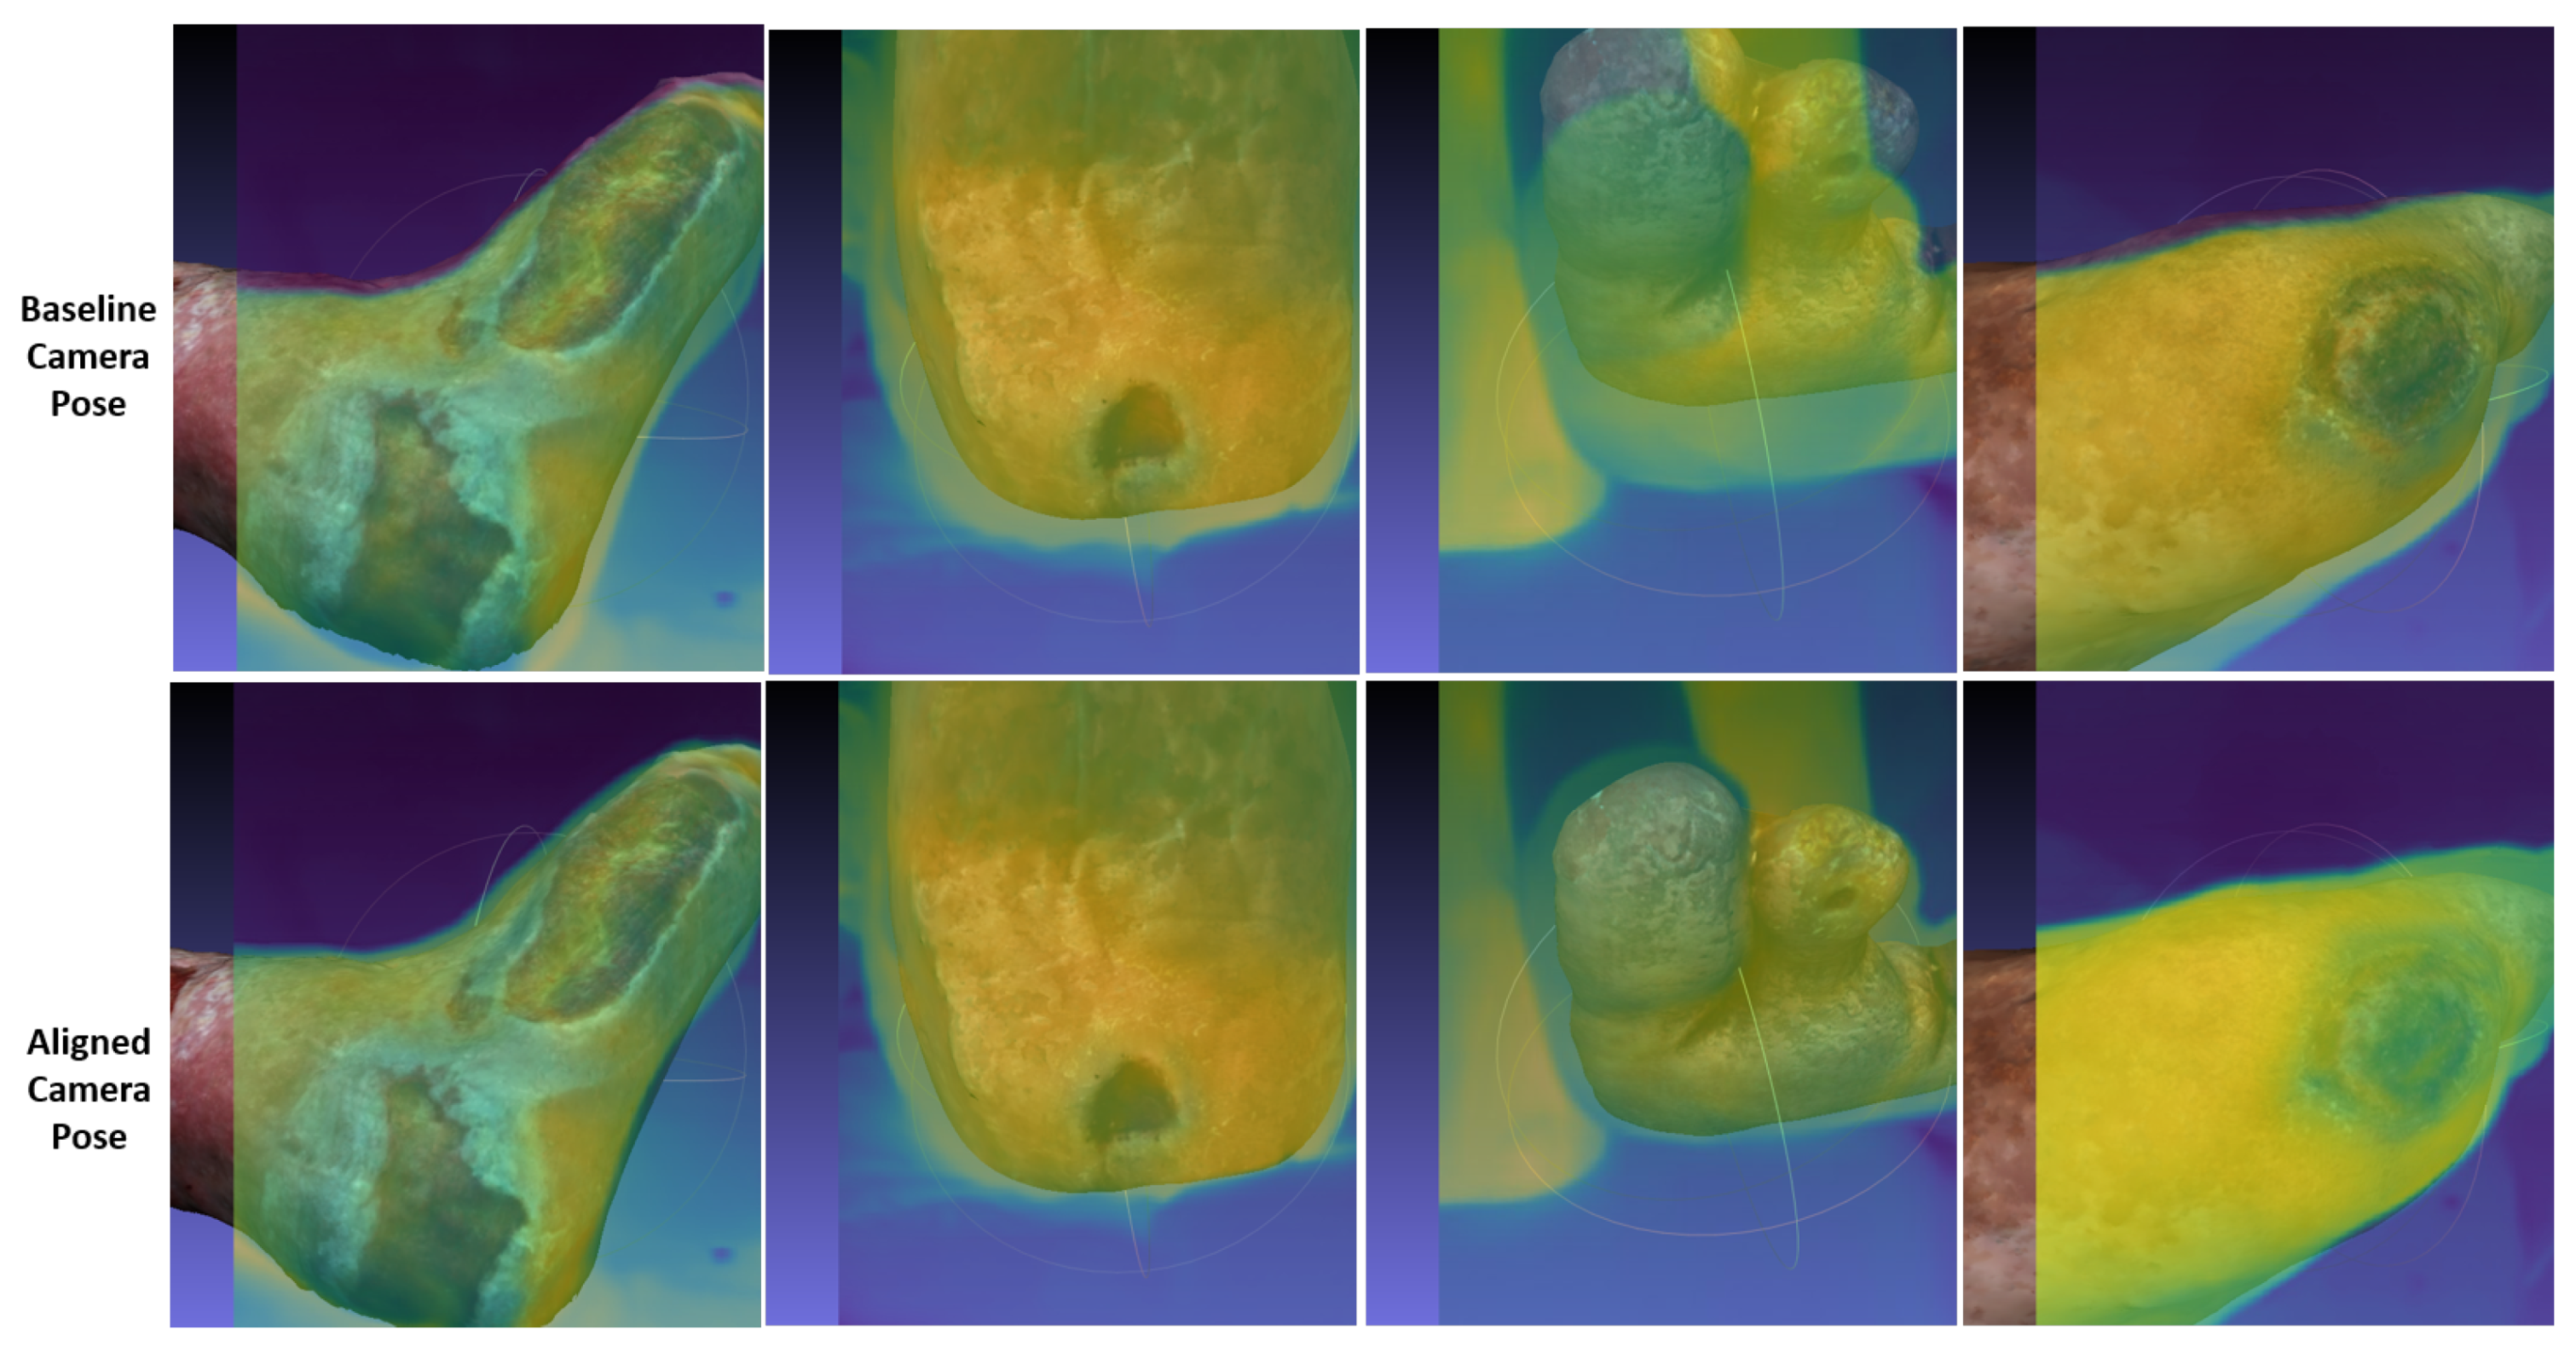
Another way to observe these improvements is to look at the 3D model from the thermal camera perspective and overlay the thermal image to see if there is a correspondence between them.
Figure 7 illustrates examples of the thermal images superimposed on the 3D model view according to the estimated camera pose with the baseline and adjusted camera pose. A better correspondence between the thermal image and the 3D color model is observed with the adjusted poses than with the reference poses. However, small offsets could remain. For example, the second case from left to right in
Figure 7 shows an improvement in the vertical alignment but no improvement in the horizontal axis.
Furthermore, to quantitatively assess camera pose improvement, we used an indicator of consistency between temperatures mapped from multiple views: the Intraclass Correlation Coefficient (ICC), a widely used consistency index [
29]. Unlike the correlation coefficient used within our process, which evaluates the similarity between the temperatures of each image with the reference thermal view at the pixel level, the ICC gives us a summary measure of the overall consistency between the multiple temperatures measurements assigned to each point in the 3D point cloud.
Table 1 shows the ICC index to address consistency between temperatures from different thermal views using the baseline and adjusted camera poses. The ICC improves overall from moderate consistency (0.67 on average) with the baseline poses to good consistency (0.87 on average) with the adjusted poses. We also observed larger ICC improvements for those patients who have a moderate consistency among thermal data (baseline ICC of 0.65 or lower): patients P1, P2, and P4. Patients with a baseline ICC of 0.85 or higher show only slight or no improvement in consistency. Patient P5 is the only case where the consistency does not improve. This means that adjusting the camera pose did not improve the consistency between the different thermal views. However, note that the initial ICC consistency was already high with the baseline pose (ICC = 0.89). In such cases, it could be decided not to use the adjusted poses and to continue the combination of multiple thermal views using the baseline poses.
Finally, the 3D models and thermal surface distribution created with the proposed methodology are used to obtain metrics of the inside and outside of the wound.
Table 2 shows the results of the visual inspection of the wounds, an evaluation that is usually performed for the follow-up of these wounds in the hospital; on the other hand, the quantitative metrics obtained from the 3D models and thermography created with our methodology are shown in the
Table 3.
The results show a diversity of patterns in patient measurements, in particular, in temperature differences between the wound bed and the periwound zone, which may help to evidence proper healing or problems around the wound. For example, patient P4 has a lower periwound temperature, which may suggest problems with wound progress. This result could also be related to suspected bone contact, as evidenced by visual inspection in
Table 2.
In addition, variability is also observed in the standard deviation of temperature at the periphery. Patients with clinical observations are those with the greatest standard deviation in temperature around the wound of 1 °C or more. These results may be related to problems in the circulation around the wound. The results encourage us to further analyze more cases and evaluate all these measurements.
4. Discussion
In this article, we present the process of creating 3D thermal models that help evaluate large wounds or multiple wounds in the same area. For the first time, a methodology is presented for integrating information from the visible and infrared spectra into 3D wound models using low-cost, portable commercial devices.
In addition to the importance of visible and geometric indicators for objective wound monitoring (such as areas, volume and different tissue segmentation), thermography could also provide other types of indicators in the non-visible spectrum that could help distinguish normal inflammation from wound infections or predict wound evolution [
6,
7,
8,
9,
10,
12]. Thus, our work expands the range of options for creating multimodal 3D thermal and color models, which currently rely primarily on the use of high-cost, fixed-position thermal cameras. The advantage of our approach is that it does not restrict the extent of the wound to be scanned.
Additionally, our proposed methodology helps to combine temperatures from different thermograms and achieves consistency between different thermal views. This allows us to have consistent 3D models with greater coverage of the thermography than those currently available.
Thermal and geometrical measurements have been obtained from the 3D models constructed with our methodology. From the observed cases, the temperature difference between the wound and periwound, and the standard deviation of temperatures in the periwound could be potential metrics for wound evolution and require further investigation. Moreover, further research is needed on the use of thermal metrics obtained from low-cost portable devices, which have less thermal accuracy and reduced thermal image resolution than expensive high-end cameras. Previous studies propose the use of different metrics, and most of them use high-end thermal cameras that have higher thermal accuracy than low-cost commercial devices [
11,
13,
14]. Thus, we are looking forward to conducting a longitudinal study to analyze the metrics in the literature, and identify those that have predictive power in wound evolution and can be used as follow-up metrics in the specific case of using low-cost hand-held devices.
Finally, the presented process allows an excellent resource for the teledermatology in the future and, in particular, for the prevention, follow-up, and monitoring of chronic wounds in remote areas, offering the possibility of more opportune examinations and diagnoses with less transport costs for the patient, and decreasing the expenses of the hospital at the same time. Our work also provides access to multimodal 3D models using low-cost handheld devices that employ an automated process through free, easy-to-use software. Basic knowledge of photo acquisition and basic computer skills would be sufficient to use the proposed process. Therefore, its application in hospitals and health centers would not pose any problems and would only require basic training in software handling and some training in the acquisition of photographs in the handheld mode, which is increasingly becoming familiar due to the widespread adoption of smartphones and, recently, the use of portable thermal cameras.
5. Conclusions
We present a methodology for creating 3D color and thermal models from multiple thermographic views obtained with low-cost handheld devices. This methodology is applied in six wounds, and the results show that consistency between the different thermographic views is achieved. Additionally, this methodology helps to increase the spatial and thermal resolution of the surface in the 3D model.
Different metrics combining 3D color information and thermography were obtained based on the models created with the proposed methodology. These metrics could be potentially useful for clinical evaluation; however, they require further study. We look forward to performing larger studies with more participants to help define the relationship between the different metrics and the evolution of the wound.


