Abstract
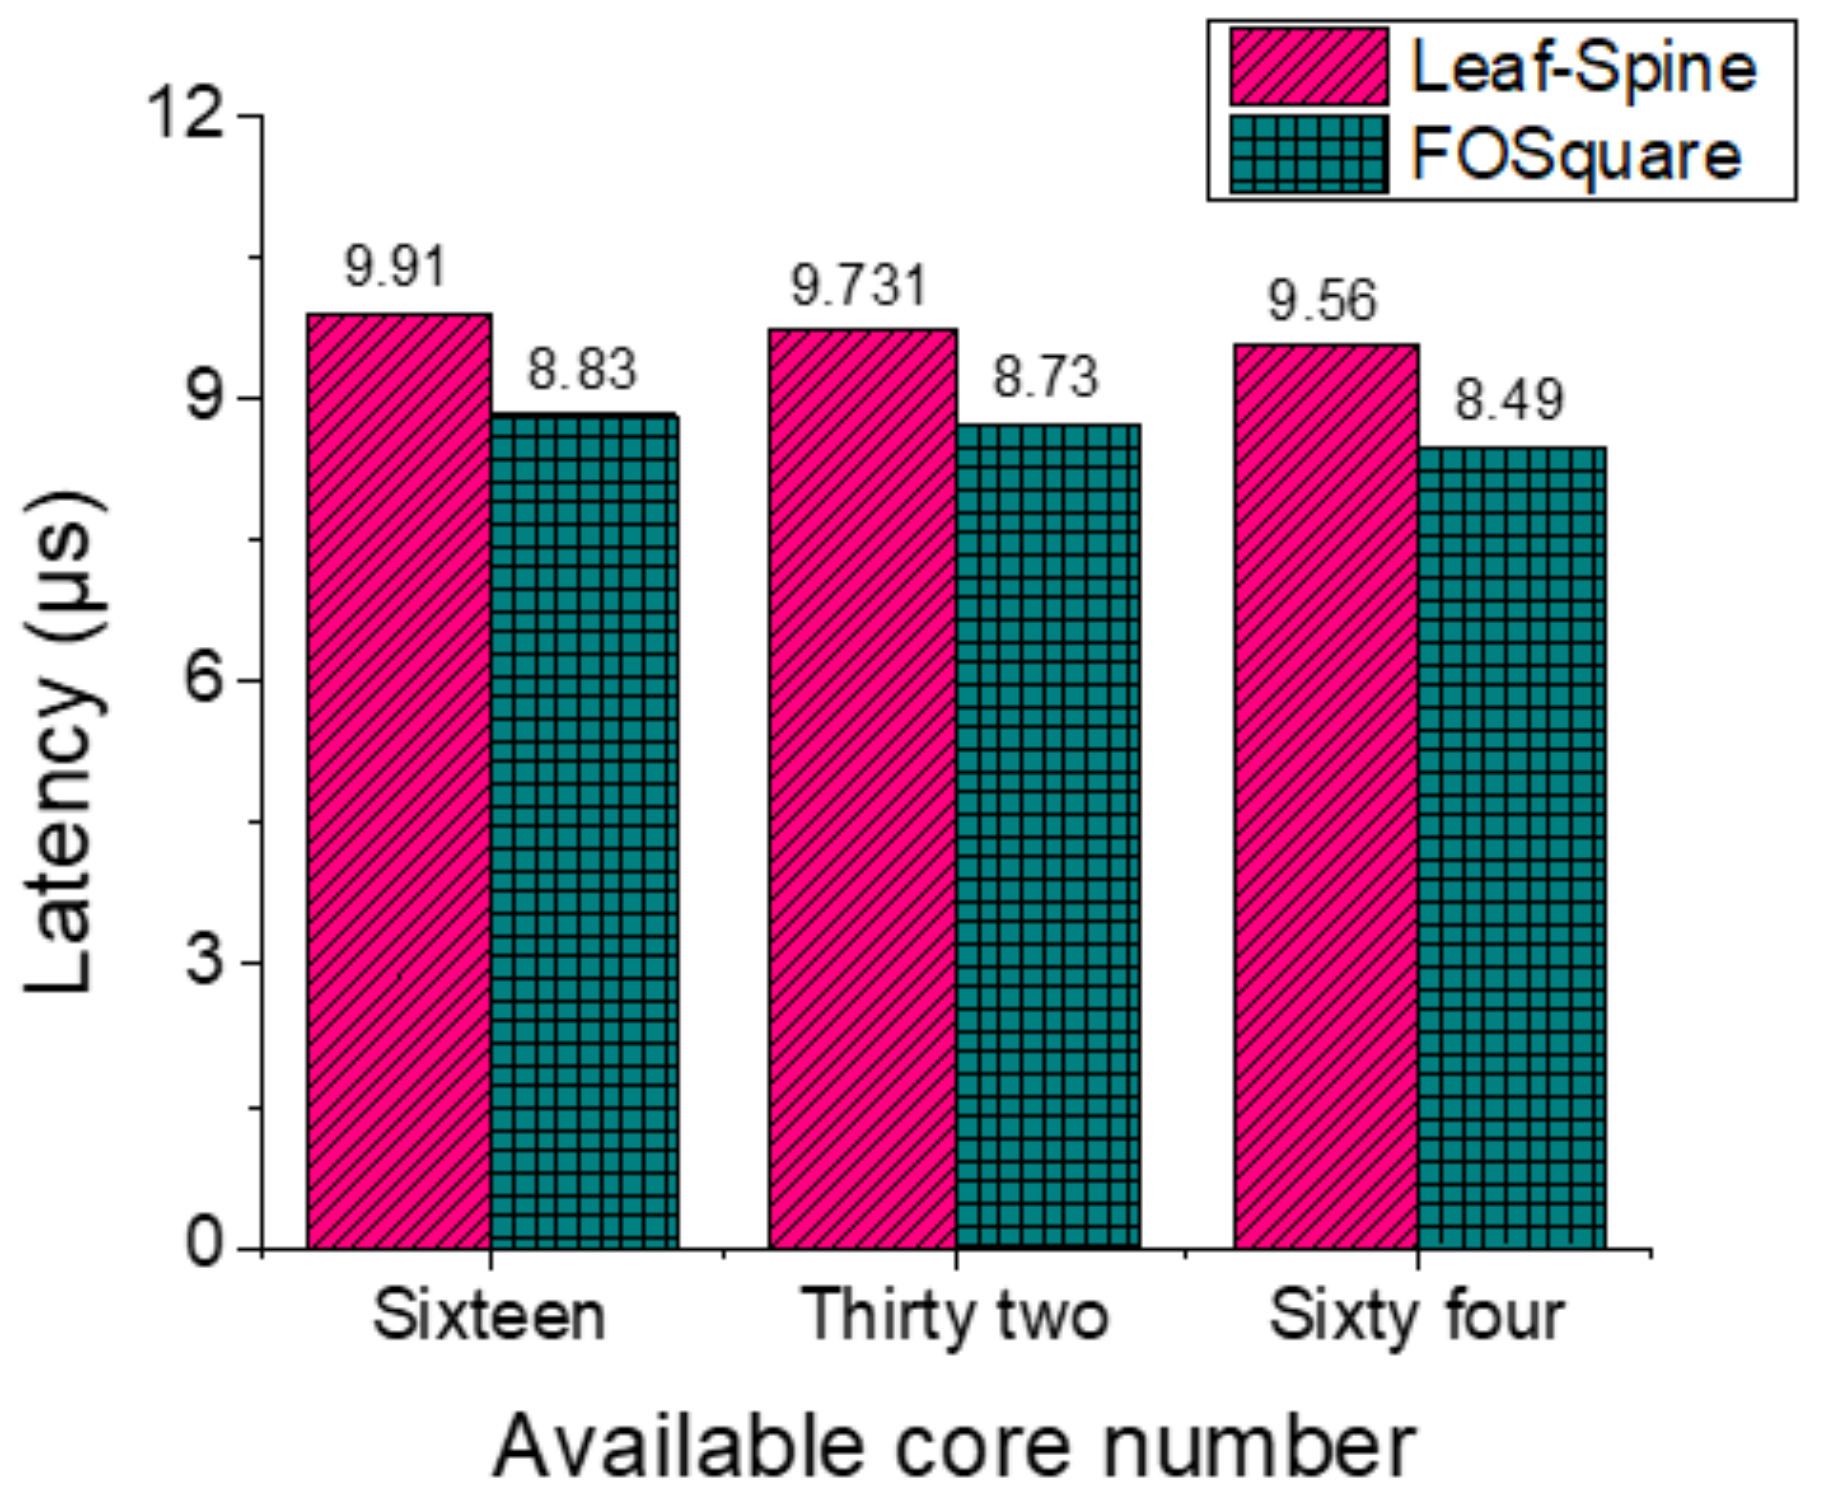
Interconnecting networks adopting Fast Optical Switches (FOS) can achieve high bandwidth, low latency, and low power consumption. We propose and demonstrate a novel interconnecting topology based on FOS (FOSquare) with distributed fast flow control which is suitable for HPC infrastructures. We also present an Optimized Mapping (OPM) algorithm that maps the most communication-related processes inside a rack. We numerically investigate and compare the network performance of FOSquare with Leaf-Spine under real traffic traces collected by running multiple applications (CG, MG, MILC, and MINI_MD) in an HPC infrastructure. The numerical results show that the FOSquare can reduce >10% latency with respect to Leaf-Spine under the scenario of 16 available cores.
1. Introduction
Driven by the requirements of the computing in large-scale scientific problems and the processing of massive data, such as computing simulation, gene sequencing, weather forecast, and so on, the peak arithmetic speed of the High-Performance Computing (HPC) infrastructure has had an increase of multiple orders of magnitude and reached 125.4 PFlop/s during the last five years [1]. This imposes stringent requirements for accommodating the booming HPC applications; thus, an open research question is: How can we efficiently scale out the servers count and scale up the data rate with a satisfactory performance under a suitable interconnecting architecture?
In current electronic switches-based architectures that support a large number of servers (≥10,000) operating at high data rata (≥50 Gb/s), multi-tier high radix electronic switches are being employed to satisfy the requirements of connectivity and bandwidth at the price of large latency, high cost, and power consumed optical-electro (and electro-optical) conversion (O/E/O) modules [2,3,4,5]. By exploiting optical switching technologies, the cost and power consumption associated with the O/E/O modules can be largely eliminated. Moreover, the optical switching technologies are transparent to data rate/format and therefore support huge bandwidth per port.
Current data center networks and HPCs are evolving from the hierarchical networks based on high radix electrical switches to optical interconnecting networks to meet the high bandwidth, low latency, cost, and power consumption efficiency requirements. Several optical switching technologies have been investigated based on Opto-mechanical and Piezo-electric Circuit Switching (OCS) [6,7,8,9,10], Fast Optical Switching (FOS) [11,12,13], and arrayed waveguide router (AWGR) combined with fast tunable lasers [14,15]. Exploiting optical switching technologies that transparently switch high data rate signals in DCN can efficiently reduce the cost and power consuming O/E/O interconnects and latency.
As a mature commercial technology, OCS exploits micro-electro-mechanical systems (MEMS). In the past few years, some efforts have been made to investigate the optical switching schemes for HPC applications [16]. C-through and Helios represent the architectures introducing MEMS based OCS in parallel with electrical switches [9,10]. Such hybrid electrical/optical solutions take advantage of the relative merits of each. OCS could switch on the order of milliseconds or microseconds supporting the switching granularity of flows. Because of the inefficient bandwidth utilization and inflexible connection resulting from the slow reconfiguration time and reservation time, the network architectures based on OCS are only suitable for long-term bulky data transfers. On the other hand, a fast optical switch (FOS) could switch on the order of nanoseconds and supports the switching granularity of packets.
FOS can switch packets in time, space, and wavelength domain in nanoseconds, and therefore can maintain the statistical multiplexing performance offered by the electronic switches. Benefiting from the huge bandwidth provided by the optical switching technologies, the link delay could also be decreased by simplifying the multi-tier interconnecting topology into a flatter one with the reduced switching hops. Despite the bandwidth and fast switching (nanoseconds) operation, one of the main challenges to build an interconnecting network by fast optical switching technologies is the lack of optical buffers for packet contention resolution. Therefore, to properly introduce a fast optical switching based interconnecting network, the fast (nanoseconds scale) controller should be implemented.
Several architectures have been proposed and investigated for large-scale DCNs exploiting multi-stage fast optical switching technologies [11,12,13]. However, the interconnected architectures based on FOS must overcome the lack of optical memory to support buffer-less operation. To maintain the statistical multiplexing offered by the electrical switches, OPSquare and HiFOST DCN architecture based on FOS is proposed to overcome the lack of optical memory [12,13]. Apart from the architectures based on OCS and FOS, there are also architecture built of AWGR and tunable lasers. However, the AWGR technology requires very expensive tunable lasers and sophisticated control to achieve sub-microseconds tuning time [14,15].
Accompanying the evolving of network technology, the real-time, interactive and big-data applications are also booming. When the communication happens between the servers in separate racks, there will be a severe performance bottlenecked for the data-intensive applications and computations. Considering the mapping algorithms in optical networks, different solutions have been proposed to handle the intrinsic characteristics of optical networks. The impact of the choice of a packet transfer mode on network performance is analyzed in [17], and to find out how a network node can exploit the wavelength resource to achieve statistical multiplexing efficiency. A heuristic network mapping algorithm called resource and load aware algorithm based on ant colony optimization (RL-ACO) is proposed in [18]. RL-ACO considers the load jointly with spectrum continuity and spectrum contiguity during the node mapping stage and focuses on decreasing the blocking ratio of virtual network requests. The consequences of packet collisions in application performance and how this situation can be avoided or minimized is not reported either. Besides, a mapping algorithm considering the collisions between different processes is proposed in [19]. However, it only shows the performance for a small-scale network with 16 servers and assumes that all the resources are available for use in the network.
In this work, we demonstrate a novel scalable and low latency HPC interconnecting architecture based on distributed fast optical flow control FOS that scales as the square of the FOS port count (FOSquare). The fast optical flow control overcomes the lack of optical memory in the FOS and enables the fast (nanoseconds) control of the FOSquare architecture for low latency operation. We also propose a novel Optimized Mapping (OPM) mechanism that maps the most communication-related processes inside a rack. OPM takes the traffic relevance of processes into consideration so that the processes with higher communication ratio are mapped to neighboring cores (cores in the same rack).
In the simulations, we use the traffic traces from real HPC applications to evaluate the network performance of average server-to-server latency. The length, transmission time, and destination of each packet are all fixed in the simulation. The completion time of the application is determined by the transmission time of the last packet. Therefore, the application completion time is almost the same for different networks. Also, the mapping algorithm is only used to show the network performance improvement of FOSquare with respect to Leaf-Spine. The latency performance of the FOSquare is numerically investigated by analyzing real HPC application traces under the specific mapping mechanism. For the application CG, MG, MILC, and MINI_MD, numerical results show that the latency of FOSquare architecture is 28.1%, 13.6%, 25.2%, and 10.9% less than the electrical interconnecting architecture Leaf-Spine, respectively, under the 16 available cores scenario.
The novel contributions with respect to the previous works are shown below. Firstly, benefiting from the advantages of FOS and the customized servers, we introduce the FOS in the HPC network and propose the FOS based optical FOSquare HPC network. By using the star topology for both the wavelength division multiplexing (WDM) inter-group and intra-group interconnection, FOSquare provides a scalability of N2 to interconnect thousands of servers with medium radix FOS. A comparison of FOSquare with various network architectures is shown in Table 1. Secondly, we evaluate the network performance of FOSquare HPC network by obtaining the traffic traces of real HPC applications in a Marenostrum 3 supercomputer. To show the advantages of FOSquare, the network performance of FOSquare is compared with the Leaf-Spine architecture adopted in a Marenostrum 3 supercomputer. The results show that FOSquare achieves less latency compared with Leaf-Spine.

Table 1.
Comparison of various network architecture (M: network size, RS: radix of inter-group (Spine) switch, Rd: down link radix of intra-group (leaf) switch, a: local channels and h: global channels in Dragon, N: radix of fast optical switch. BS: Bisection bandwidth).
2. Materials and Methods
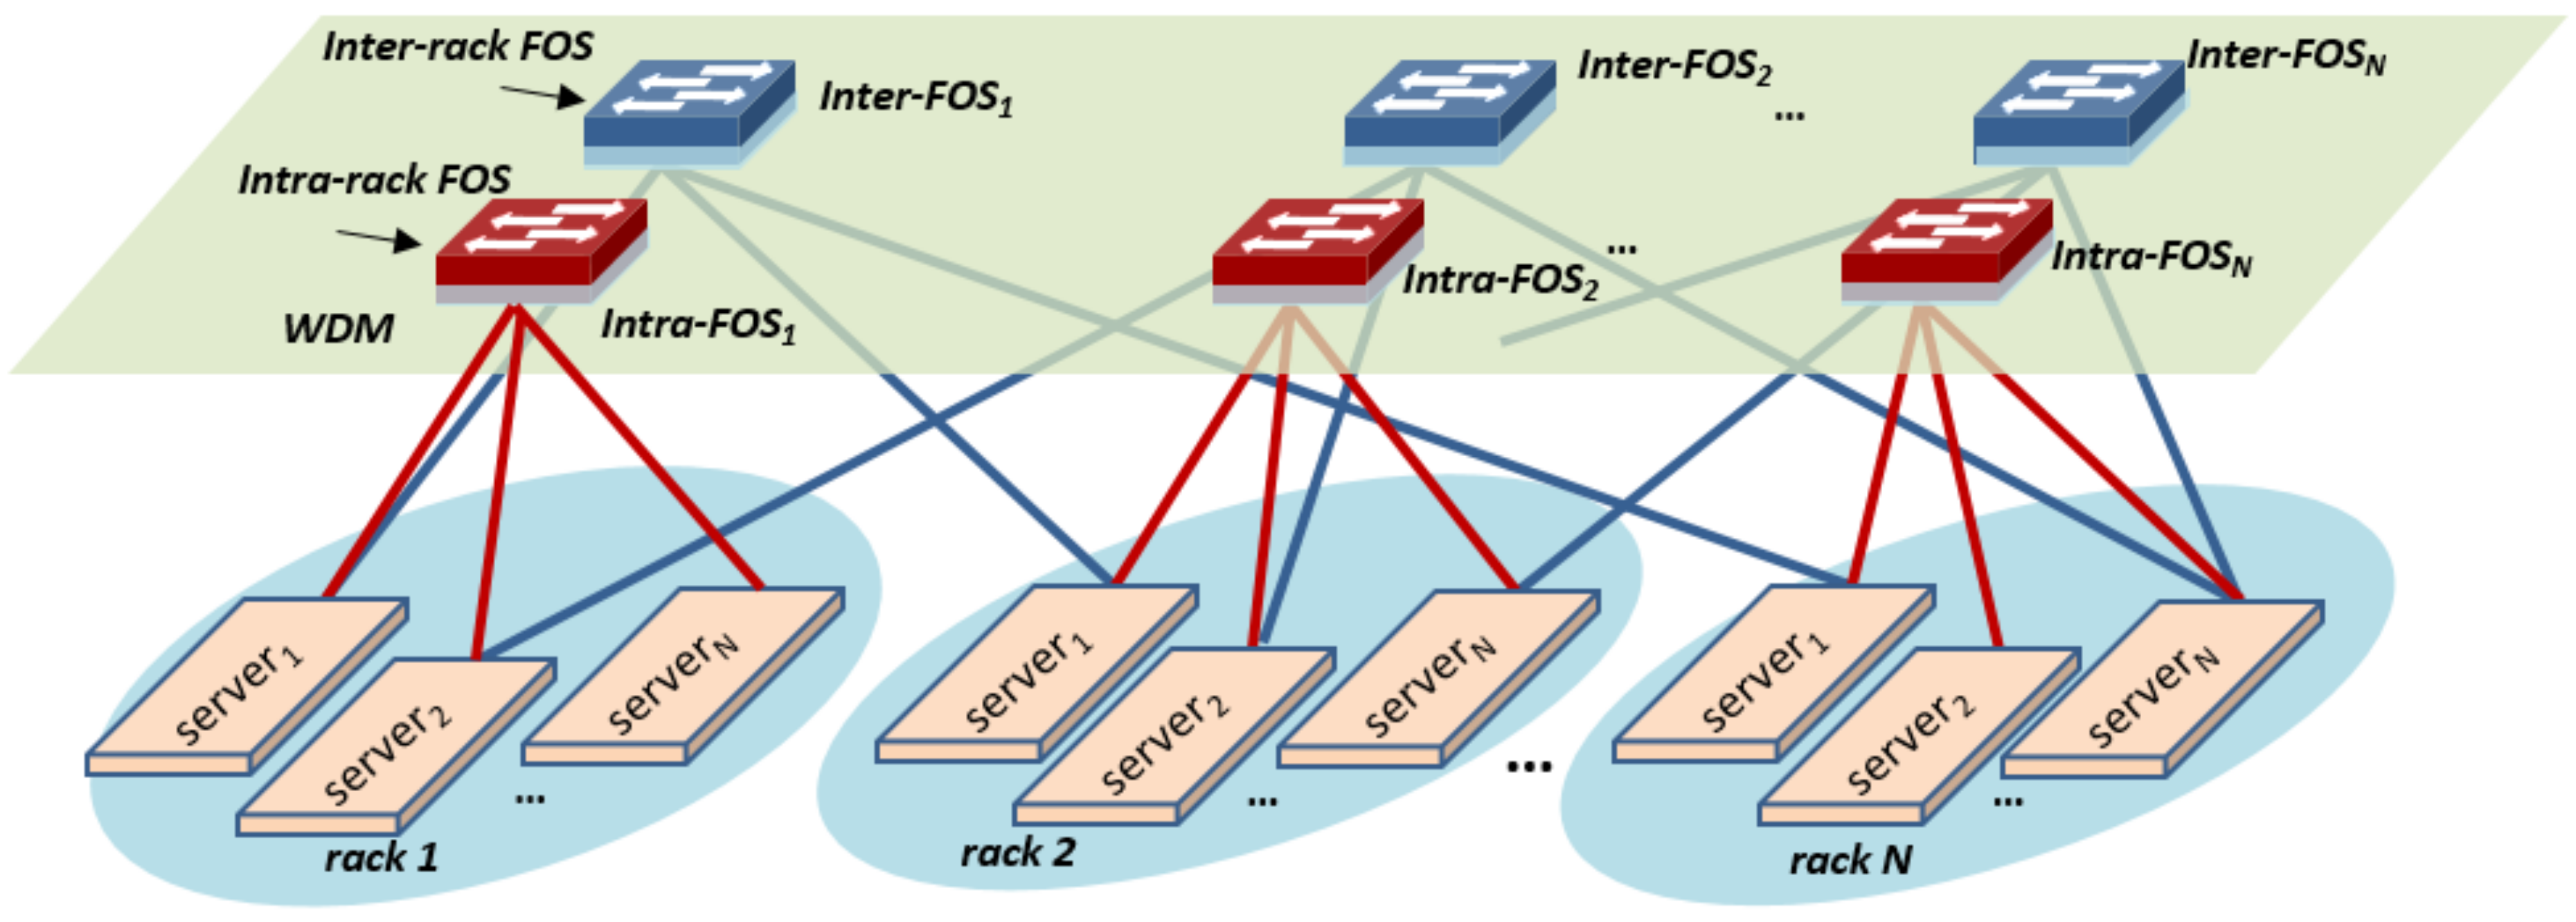
The proposed high-bandwidth, low-latency, and scalable HPC architecture based on flow-controlled FOS is shown in Figure 1. The network is divided into N racks. Each rack contains N servers interconnected by the intra-rack FOS through the WDM optical link. Meanwhile, the inter-rack connectivity is achieved by inter-rack FOS.
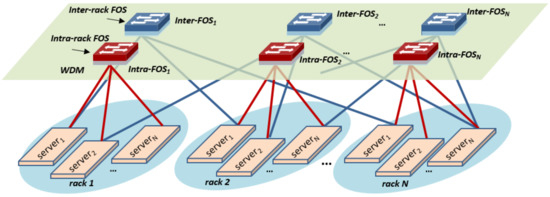
Figure 1.
The FOSquare High-Performance Computing (HPC) architecture based on fast optical switch with flow control.
As illustrated in Figure 1, servers in the i-th rack are interconnected by the i-th intra-FOS (intra-FOSi); and the j-th inter-rack FOS (inter-FOSj) interconnects the j-th server (1 ≤ i, j ≤ N) of all the racks. There is no direct connection among FOSs in FOSquare. For the inter-rack communication, servers undergo at most two optical hops. It is worth to notice that FOSquare allows servers to be interconnected via different path connections, increasing network fault-tolerance and facilitating load balancing algorithms to optimize the performance of the network. To be specific, for the inter-rack communication, there are two available shortest paths, the first is source → intra-rack FOS → mid-server1 → inter-rack FOS → destination. The second path is source → inter-rack FOS → mid-server2 → intra-rack FOS → destination. The number of interconnected servers in FOSquare scales as N2. The square scalability of FOSquare comes from the double NICs equipped in the sever. By using 64 × 64 port FOS, up to 4096 servers can be interconnected. Therefore, a scalable HPC can be built by using FOS with moderate radix due to the excellent square scalability.
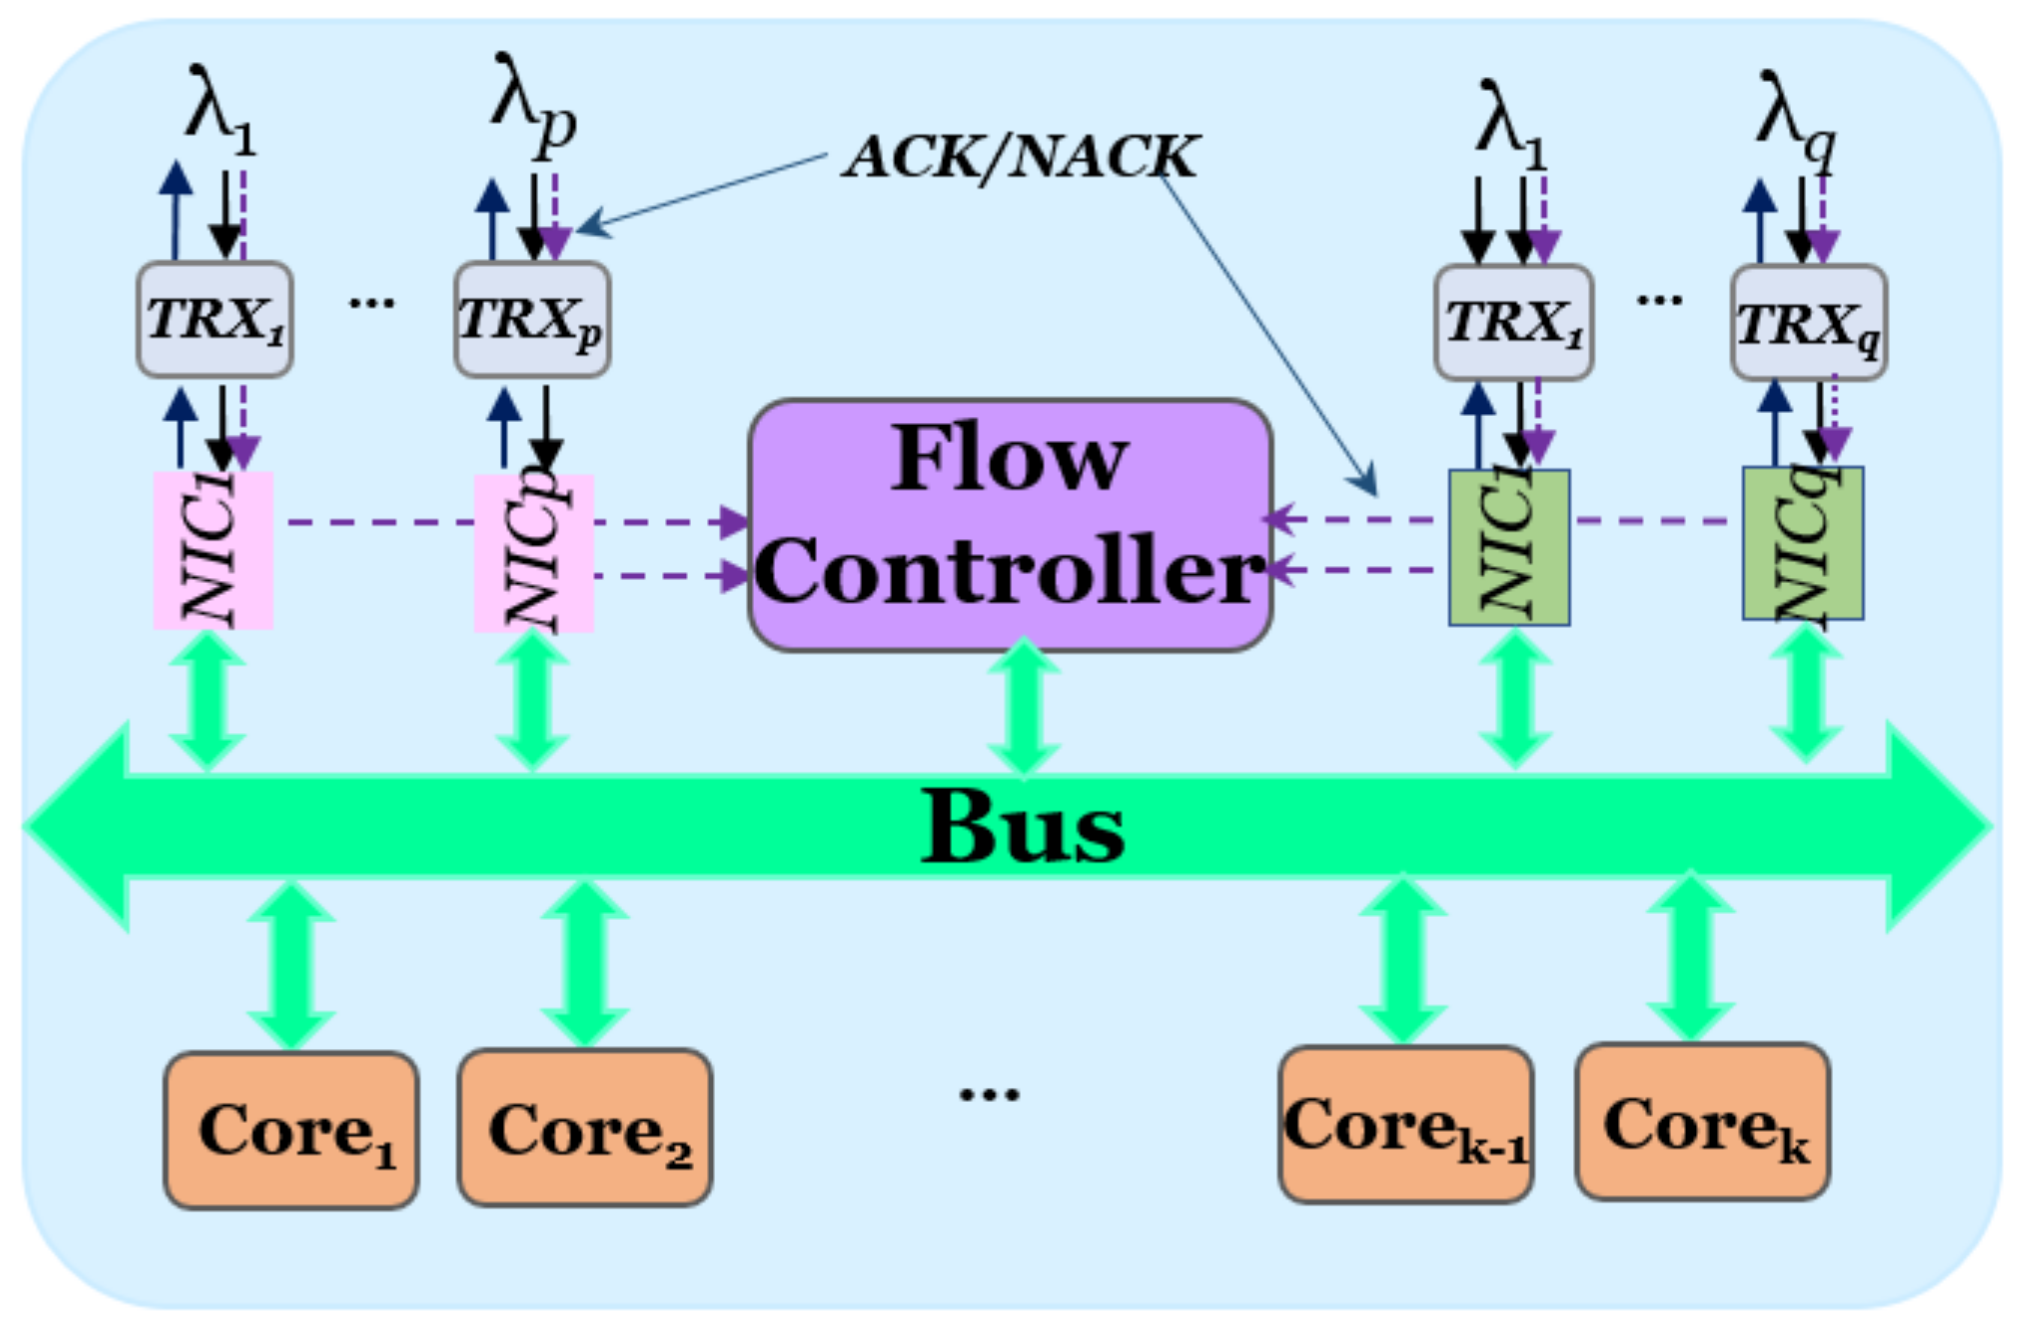
The composed modules of server are shown in Figure 2. There are k cores in the server, and the core operates at 50 Gb/s. The packets from the cores are segmented into cells with length of 1500-byte and buffered before sending out of the server. The number of cells Ncell that a packet occupied is calculated by the following formula:
where Lpacket is the length of the packet, and the ceil function maps a real number to the least succeeding integer. To achieve a target oversubscription with respect to the expected performance, p and q WDM transceivers (TRXs) are allocated to the intra-rack and inter-rack interconnection, respectively. In our system, the payload of the optical packet is composed of 5 cells. Therefore, the payload size of the optical packet is 5 × 1500 bytes = 7500 bytes, and the preamble length for the optical packet is 1000-bit (20 ns).
Ncell = ceil (Lpacket/1500)
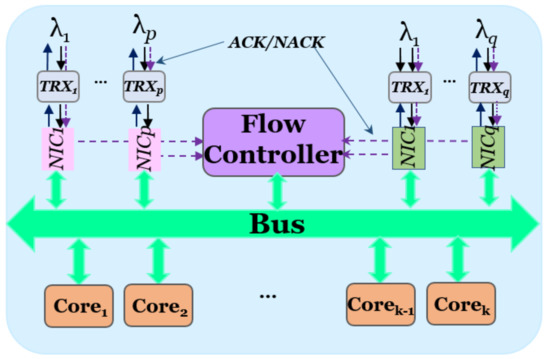
Figure 2.
Schematic of the server equipped with wavelength division multiplexing (WDM) transceivers and fast flow control.
For both intra-rack and inter-rack traffic, the packets are first segmented into cells and stored in the p intra-rack or q inter-rack TRX buffers. Then, the cells are transmitted to the intra-rack or inter-rack FOS with an attached optical label. The optical label is processed at the FOS to determine the destination. In case of contention, the blocked packet will be retransmitted benefiting from the operating of fast flow control. An optical flow control protocol between the servers and the FOS is implemented to fast control the switch and to solve packet contention through packet retransmission. The flow controller receives the ACK or NACK from the FOS. The FOSquare scales out as the FOS radix increases resulting in more servers inside the group. Meanwhile, there are only intra-group and inter-group optical interfaces in the servers. Therefore, the flow controller of the server does not need any updates since it only need to communicate with the optical interfaces.
Successful acknowledge (ACK) or unsuccessful acknowledge (NACK) are exchanged between FOS and server based on the contention results. The packet loss comes from the overload of the electronic buffer in the server, while the optical packet fails the contention in the FOS. Then the NACK generated by switch controller in the FOS is sent to the server to retransmit the packet.
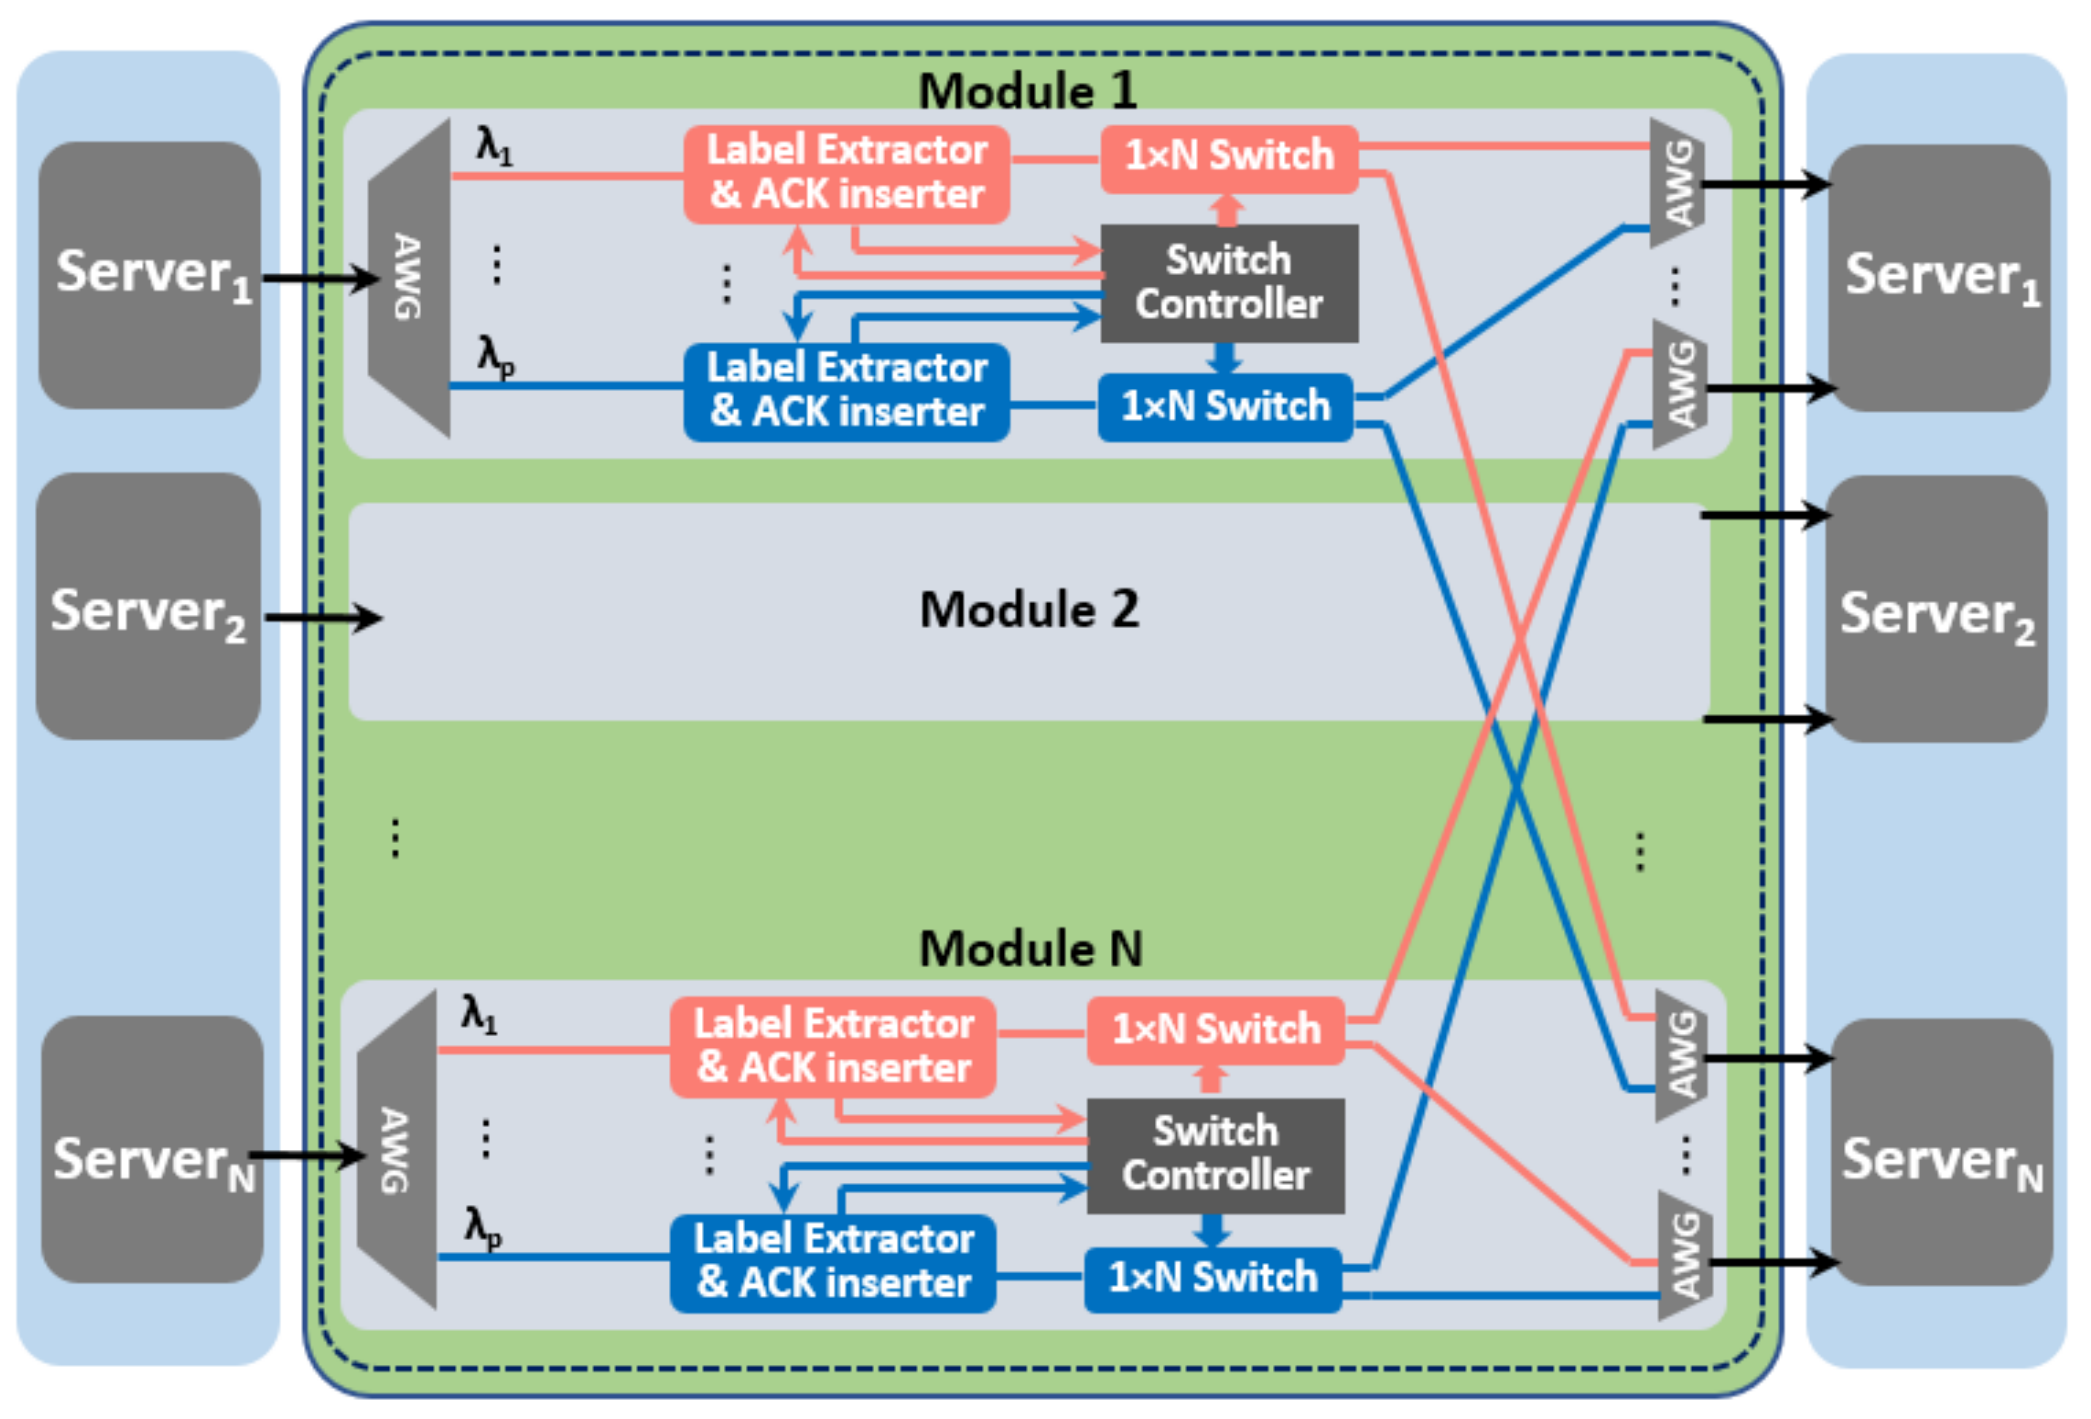
The schematic of the modular and buffer-less FOS based on broadcast and select architecture is shown in Figure 3. FOS supports statistical multiplexing technique that allows information from a number of input ports to be combined for transmission over a single output port. The modular FOS architecture scales to N × N port count by using p × N parallel smaller 1 × N switches with moderate broadcast splitting losses. In the photonic switch (PS), the optical label is first extracted and processed by the label extractor, then the optical payload is transparently switched by the 1 × N switch. Details on the operation for label extractor and 1 × N switch port count scalability up to 64 can be found in [11]. The 1 × N switch is based on optical gates exploiting semiconductor optical amplifier (SOA) technology. The main contribution to the optical power loss results from the splitter to divide the optical link to all the output ports. For a 4*4 SOA based FOS, the power loss caused at the splitter is 12 dB. The SOA in the FOS not only works as the switch gate to control the on/off of the optical link, but it can also amplify the optical power to compensate the power loss caused by the splitter. By providing 60 mA current to the SOA, the SOA gate can compensate the 12 dB power loss. SOA typically has a −3 dB gain bandwidth larger than 40 nm, which is sufficient for accommodating more than 50 100-GHz spaced channels. At current of 80 mA, the OSNR of 20 dB can be achieved for the FOS [20]. Benefiting from the modular structure and parallel processing of each WDM channel, the possible contentions among the F input ports can be solved in a distributed manner which results in port-count independent nanoseconds reconfiguration time. This allows operation on large as well as small flows exploiting statistical multiplexing.
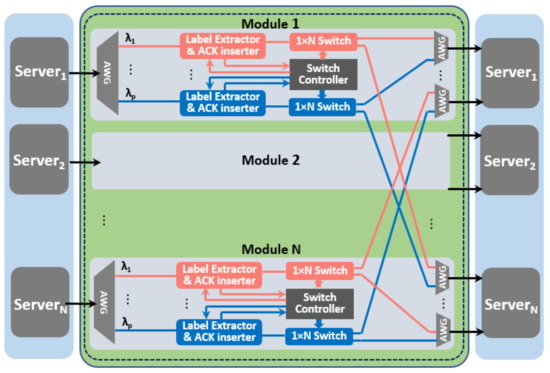
Figure 3.
Schematics of Fast Optical Switches (FOS) architecture.
In the case of contention, the packet with higher priority is forwarded to the output ports while the others are blocked, and the corresponding flow control ACKs are generated and sent back to the servers. According to the received ACK (or NACK), the flow controller at the server releases (or retransmits) the cells stored in the buffers. In terms of scalability, the maximum number of WDM wavelength channels supported by the FOSquare is determined by the operational bandwidth of the SOA gate and the achievable wavelength spacing. The SOA typically has a −3 dB gain bandwidth larger than 50 nm which is sufficient for accommodating more than 64 100 GHz-spaced channels.
In FOSquare, FPGA is used to implement the flow controller of server and the switch controller of FOS. Also, it can receive a Global Position System (GPS) signal to obtain precise time information on the order of sub-nanosecond. The whole network nodes (FPGA-based flow controller and FPGA-based switch controller) can be time accurately synchronized with less than 5 ns time skewing. All the packets are forwarded based on the time-slot mechanism in the proposed FOSquare and the gap time for the optical packet is set as 200 ns. The 200 ns gap time is then sufficient to provide 100 ns margin time between the switch controller signal and the optical packet. The 100 ns margin time can cover the potential 5 ns time-skewing.
To investigate the performance of the FOSquare architecture, four well-known scientific applications CG, MG, MILC, and MINI_MD, are considered for the simulations [21,22,23]. The descriptions of these MPI-based applications are given in Table 2. The traces of all the applications were obtained by executing the applications in the MareNostrum 3 supercomputer. The MareNostrum 3 supercomputer has 3024 compute nodes, which were interconnected through a high-speed Leaf-Spine interconnection network: Infiniband FDR10. The Infiniband FDR 10 was composed of four racks. The different nodes were interconnected via fiber optic cables and 6 Mellanox 648-port FDR 10 Infiniband core switches. MareNostrum’s 3 nodes consist of two processors Intel SandyBridge-EP E5-2670/1600 20 M 8-core at 2.6 GHz with 32 GB DDR3-1600 memory modules.

Table 2.
Application descriptions.
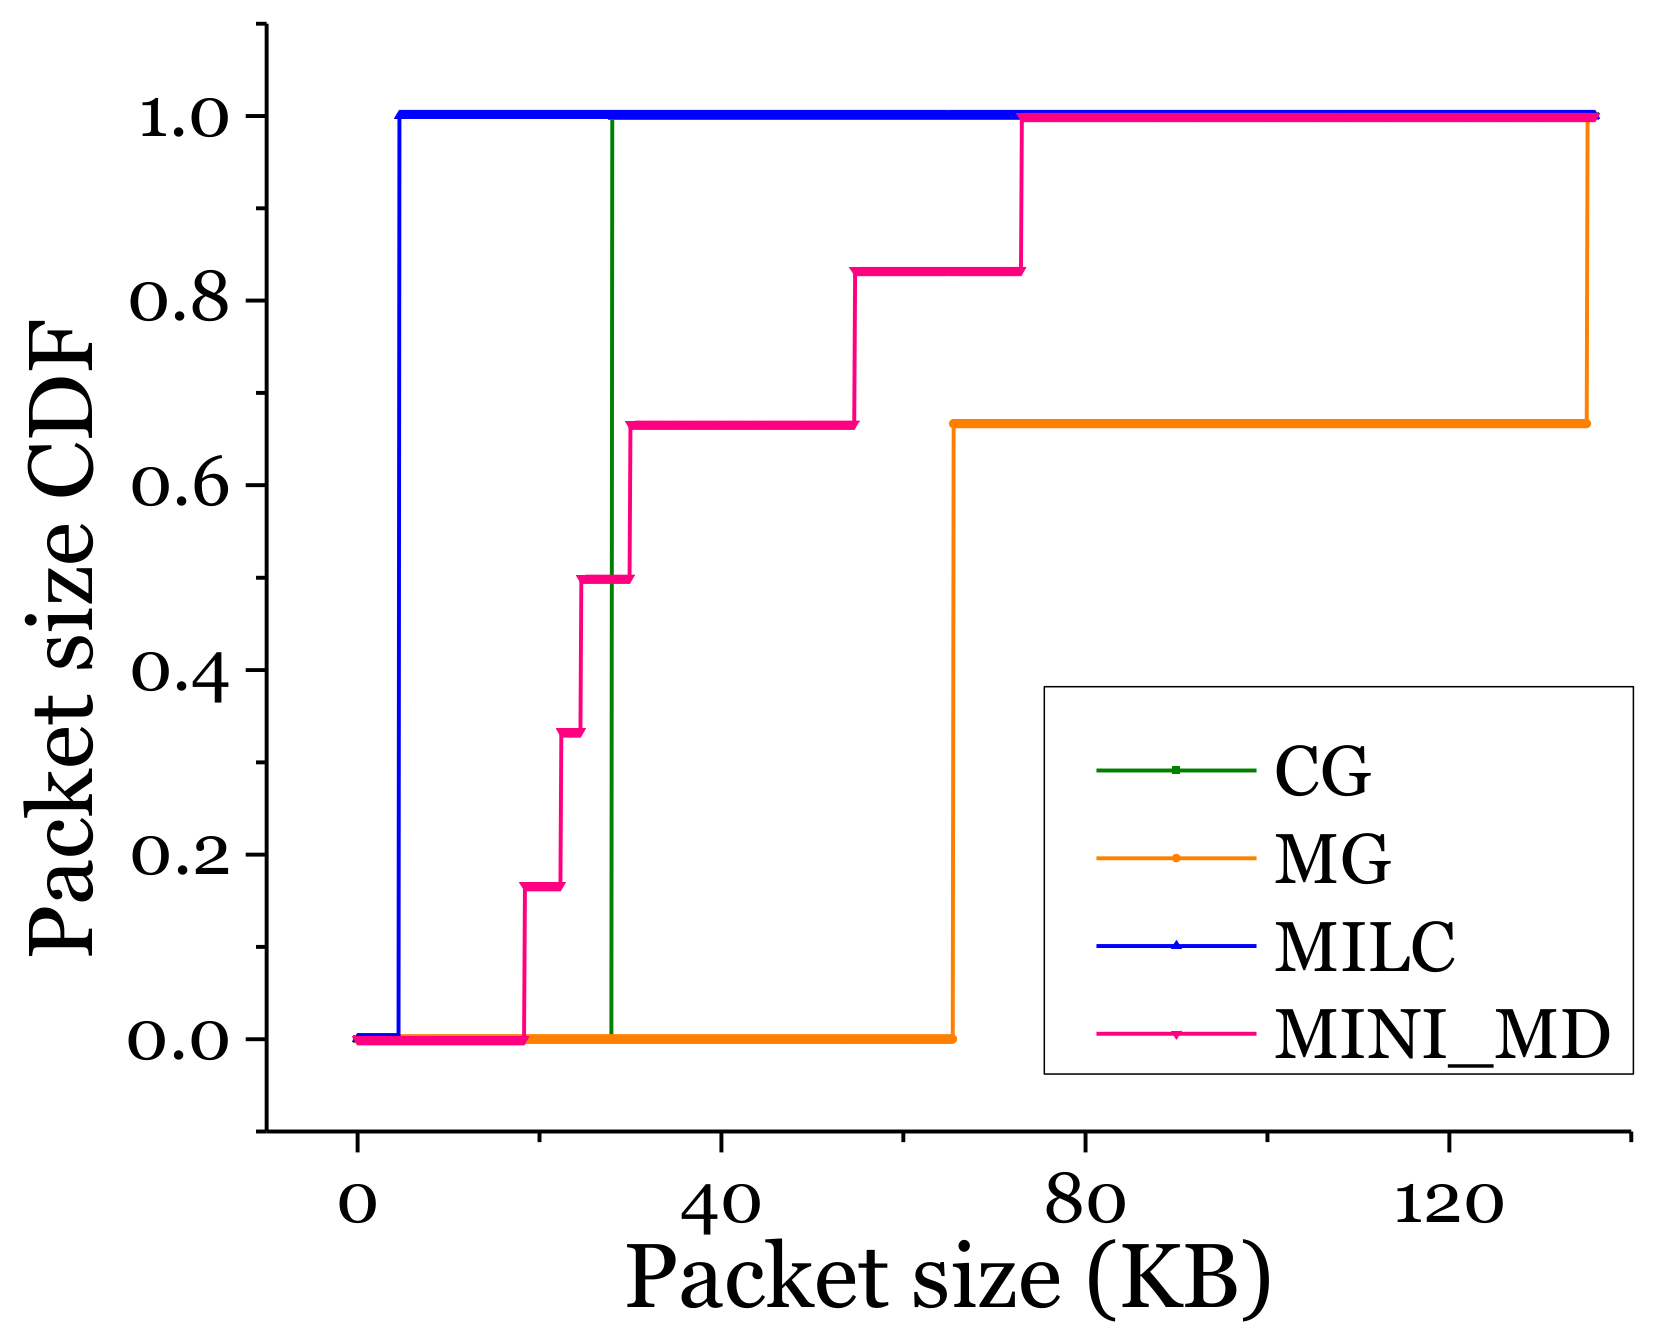
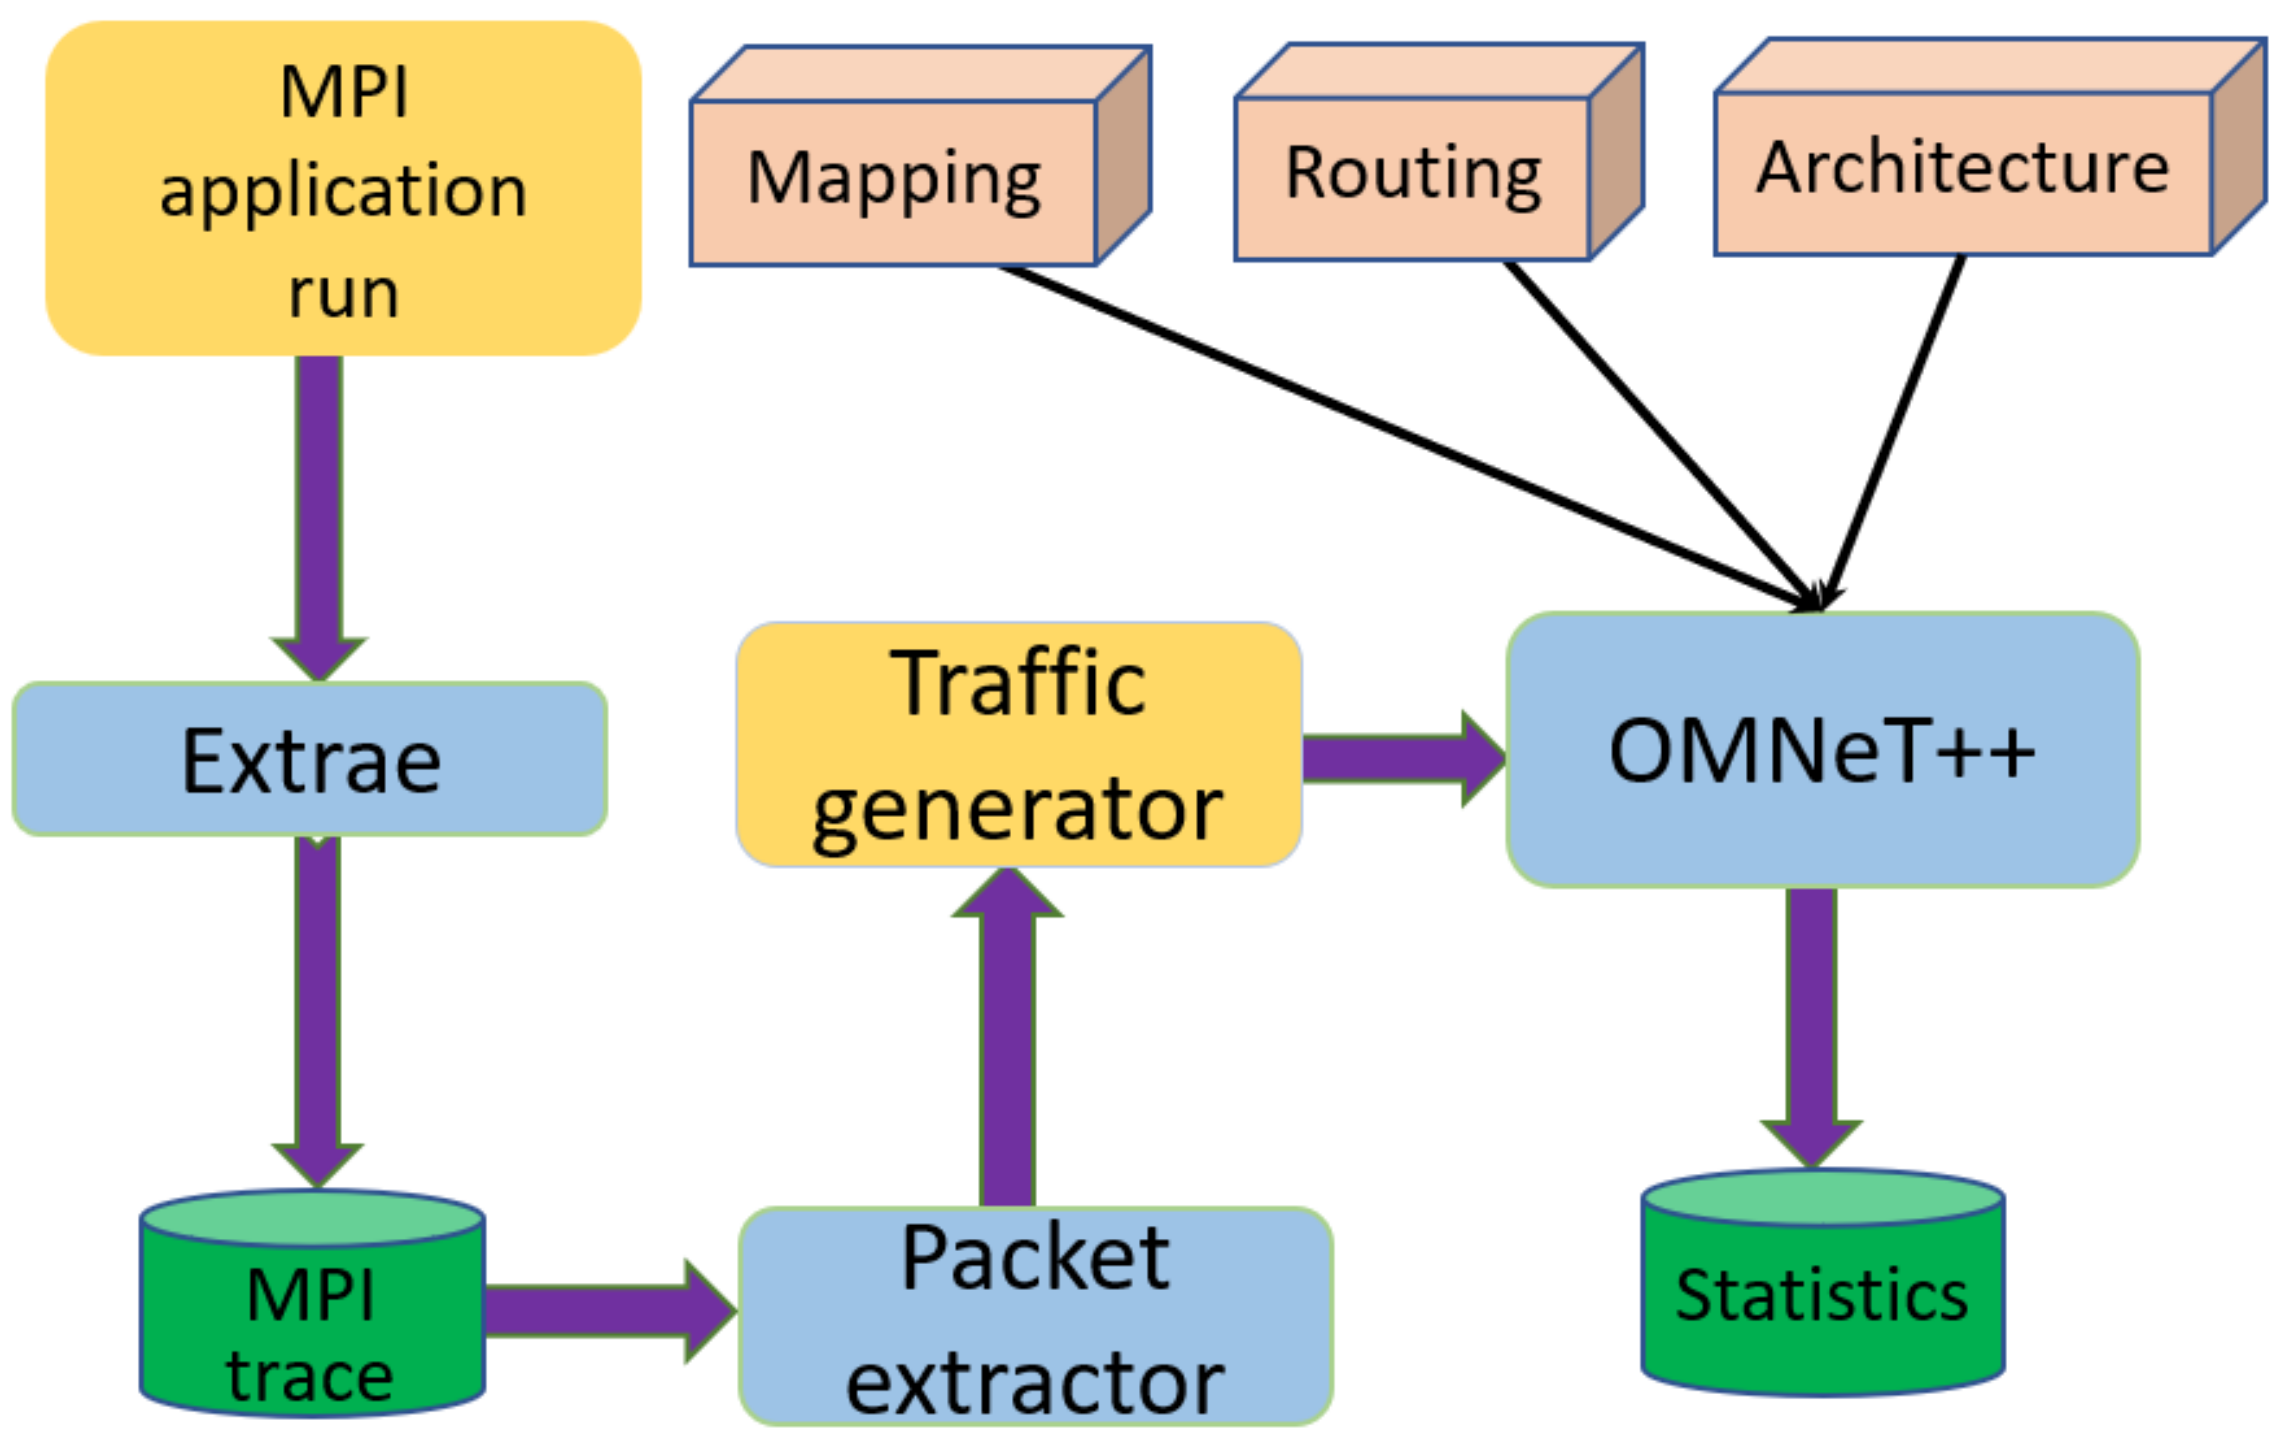
Figure 4 shows the packet size cumulative distribution function (CDF) of the four applications. The CG and the MILC applications only generate fixed length packets of 28,000-Byte and 4608-Byte, respectively. While the MG and MINI_MD applications generate variable packets length. Each application runs with 16 processes. All the application processes are allocated on different servers. Therefore, the number of processes per application is 16 and one process per server is placed. As shown in Figure 5, to evaluate the performance of the HPC networks, we build the network simulation infrastructures through the open-source tools.
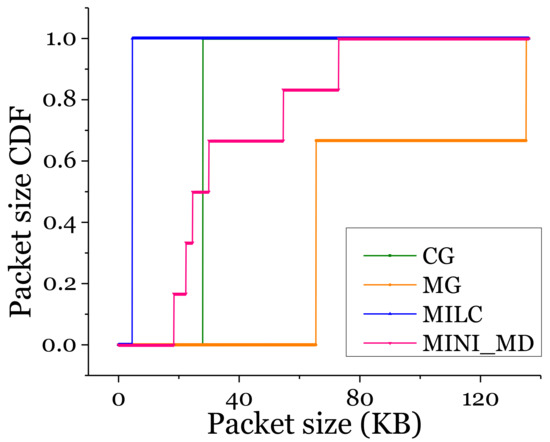
Figure 4.
Cumulative distribution function (CDF) of the packets size of the 4 applications.
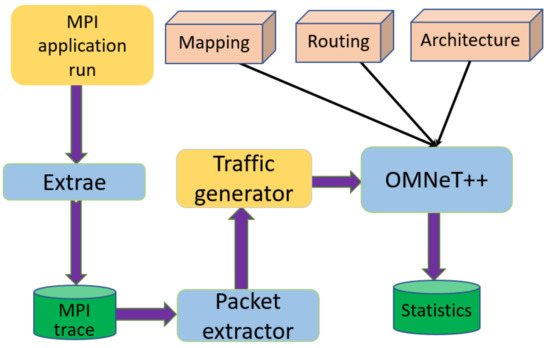
Figure 5.
HPC optical network simulation framework.
Extrae is employed to extract information that includes timestamps of events such as message transmissions and other runtime calls. Then Dimema, a replay tool for traces collected by Extrae, reproduces the events from the trace and creates a new Paraver trace of the simulated execution. Paraver is a visualization and analysis tool of the computation and communication events for Extrae traces. We dig the communication pattern, namely, the source and destination nodes pairs, packet lengths, and packet transmission times from the Paraver trace with Python script; the extracted traffic patterns of various HPC application are recorded in trace files. Then, acting as the traffic generator, the traffic patterns recorded in the trace files are fed into the HPC optical network built in OMNeT++.
In the simulation, each server operates at 5 × 50 Gb/s with 4 intra-rack and 1 inter-rack optical interfaces (p = 4, q = 1). The delay caused by the switching unit and buffering of cells at the server are taken as 80 ns and 240 ns, respectively [24]. The switching time of 80 ns is taken from the cut-through switch. This switching time is the same for both the FOSquare and Leaf-Spine. Therefore, it will not have an impact on the network performance results. The average link distance for servers to intra-FOS and inter-FOS are taken as 5 m and 50 m, respectively. The delay of the physical realization of label processing and port-count independent switch control are considered as 20 ns in total during all the simulations based on the experimental result presented in [25]. The buffer size of each transceiver is set as 50 KB. To investigate the performance of FOSquare under various applications, we consider a FOSquare network of 24 racks supporting 576 servers (each server has 8 cores), therefore there in total are 4608 cores in the simulated FOSquare network. However, as we already pointed out, the FOSquare can achieve a good scalability of N2. (supporting 4096 servers with 64 × 64 port FOS). And we provide the performance investigation under the application traces we currently obtained.
During the simulations, we separated the cores into two categories, the busy cores and the available cores. The available cores are idle ones that can be allocated for new applications. While the busy cores are already running a hypothetical synthetized application with a fixed packet length of 28,000-byte, we take 28,000-byte (from HPC application CG) as a representative packet length for HPC applications. The length of the packet is taken from the analysis of the traces. The busy cores generate those type packets destining other cores based on a certain load. We analyzed the traffic traces from HPC applications CG, MG, MILC, and MINI_MD, and found that the load for those applications is all less than 0.5. Considering the worst scenario and to give a conservative estimation, we set the load of the hypothetical synthetized application deployed in the busy cores as 0.5. The traffic ratio of the intra-server, intra-rack and inter-rack for busy cores are taken as 50%, 37.5%, and 12.5%, respectively. Three scenarios with 16, 32 and 64 available cores are taken into consideration. The index array of the available cores is obtained in advance. For example, the index array is [387, 544, 1452, 1517, 1771, 1909, 2304, 2448, 2809, 2825, 3065, 3514, 3794, 4148, 4193, 4241] for the first scenario with 16 available cores.
3. Optimized Process and Core Mapping Algorithm
To carry out the simulations in FOSquare, each process of the application trace is mapped to one of the available cores in the server. In this section, we describe a novel optimized mapping algorithm for processes. The target of OPM is to improve the performance of the application by taking the traffic relevance of processes into consideration so that the processes with higher communication ratio are mapped with neighboring cores. The philosophy behind OPM algorithm is to find out the maximum number (m) of the available neighboring cores and the process group that has the greatest number of communicated packets with m processes. Those grouped processes will be allocated to the m available neighboring cores to decrease the traffic hops, and therefore to reduce the average server-to-server latency. The procedure will be iteratively executing until all the processes are mapped to the available cores.
In the operation of the OPM, suppose M processes need to be mapped with Q available cores in the FOSquare architecture (M ≤ Q). The value of the parameter loop denotes the number of iterations for the process grouping. While the value of the parameter count denotes the number of mapping. The detailed operating producers of the OPM algorithm are described below.
In the above mentioned operation of the OPM Algorithm 1, step 2–step 6 are the procedures to group the processes that have the largest communication packets. When the value of loop increases by 1, the size of gloopk increases 2 times. More specifically, size(gloopk) = 2loop, that is to say, 2loop denotes the number of processes in gloopk. Therefore, the value of mcount should be an exponential of 2, otherwise, it is truncated to meet the criteria. After finding out the group pair set gcountk that groups mcount processes with largest number of communicated packets from a total of M processes. Algorithm 1 step 7 completes the mapping procedure.
| Algorithm 1 OPM |
| Initializing: Let S denotes the set of the M processes, S = { s1, s2, …, sM }, and set g0i = si, 1 ≤ i ≤ M. Then we have S = {g01, g02, …, g0M}. loop = 0, count = 1. 1: Find out the maximum number of available cores mcount in one rack, and go to step 6. 2: Find out group pair set P = {gloopi, gloopj} with the max communication packets in S. 3: Delete nodes pair P in S (S = S\{gloopi, gloopj}) .4: If S is not empty, go to step 2; else, loop++. 5: Combine each group pair as a single group, re-calculate set S = {gloop1, gloop2, …, gloopb} (b = M/2loop). 6: If (size(gloopk) == mcount), go to step 7; otherwise, go to step 2. 7: Map the mcount processes in gloopk having the largest number of communication packets to the mcount cores (1 ≤ k ≤ M/2loop); 8: Delete process set gloopk in S (S = S\gloopk) and also change the status of the mapped mcount cores into busy cores, count++. 9: If S is empty, end; otherwise, go to 1; |
The following example demonstrates the partial operating of Algorithm OPM with the communication patterns given in Table 3 when m1 and M equal 4 and 8, respectively. First, as shown in Table 3, it is found that the g01 and g02 have the maximum communication packets number of 10. Then, the steps 2 to 4 are repeatedly executed until set S is empty. The grouping pairs are shown in Table 4. Secondly, the group pairs {g01, g02}, {g05, g07}, {g03, g04} and {g06, g08} are mapped to node g11, g12, g13 and g14, respectively. And the communication packet number of those four groups are shown in Table 5 which is obtained from Table 3. The size of the g11 is 2, which is not equal to m. Then we go to step 2 to continue the procedures. At last, we can easily find that group g11 and g12 should be grouped together to g21 with 16 communication packets, while group g13 and g14 will be also grouped together to g22 with 16 communication packets. Now the size of the g21 is 4, which meet the requirement of ending of the procedures (m1 = 4), and the grouping for the first mapping of m1 processes finishes.

Table 3.
Communication packets between processes.

Table 4.
The processes pairs with maximum communication packets.

Table 5.
The communication packets after grouping.
Finally, we get group g21 = {g11, g12} = {g01, g02, g05, g07} = {s1, s2, s5, s7}. Therefore, processes 1, 2, 5, and 7 are mapped to the 4 available cores inside one rack, while processes 3, 4, 6, and 7 are mapped during the follow-up operation of the OPM algorithm.
4. Results and Discussion
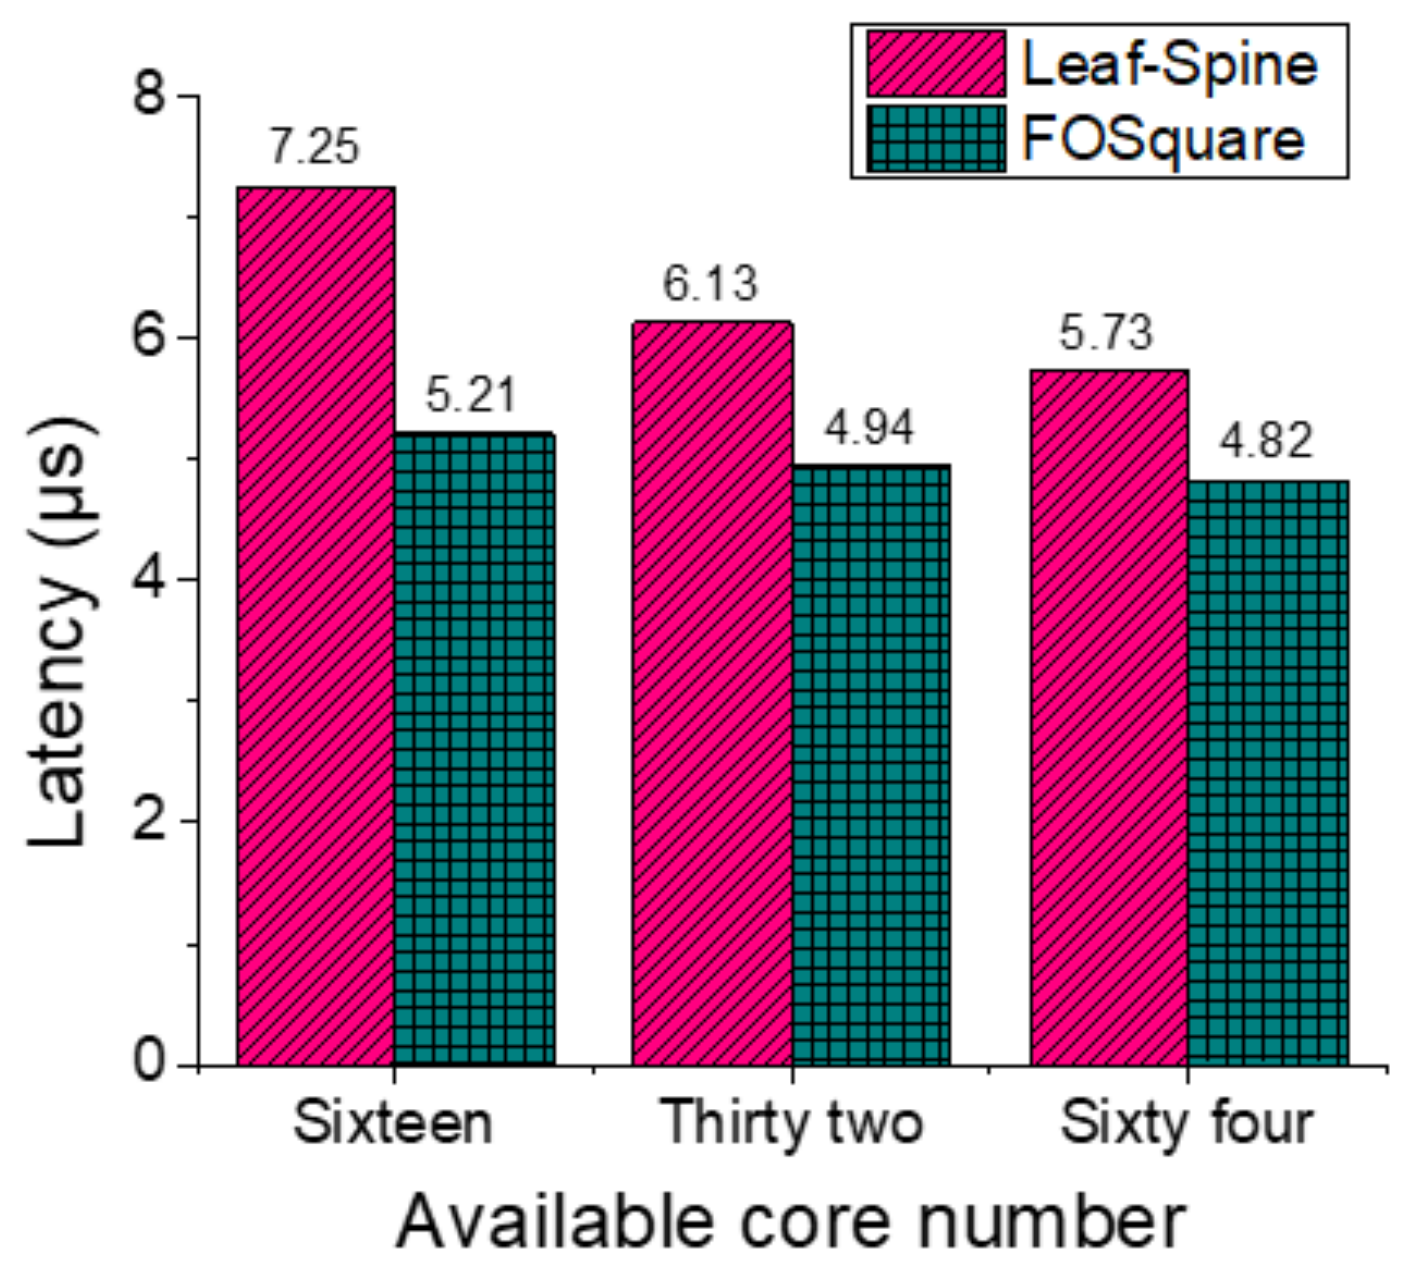
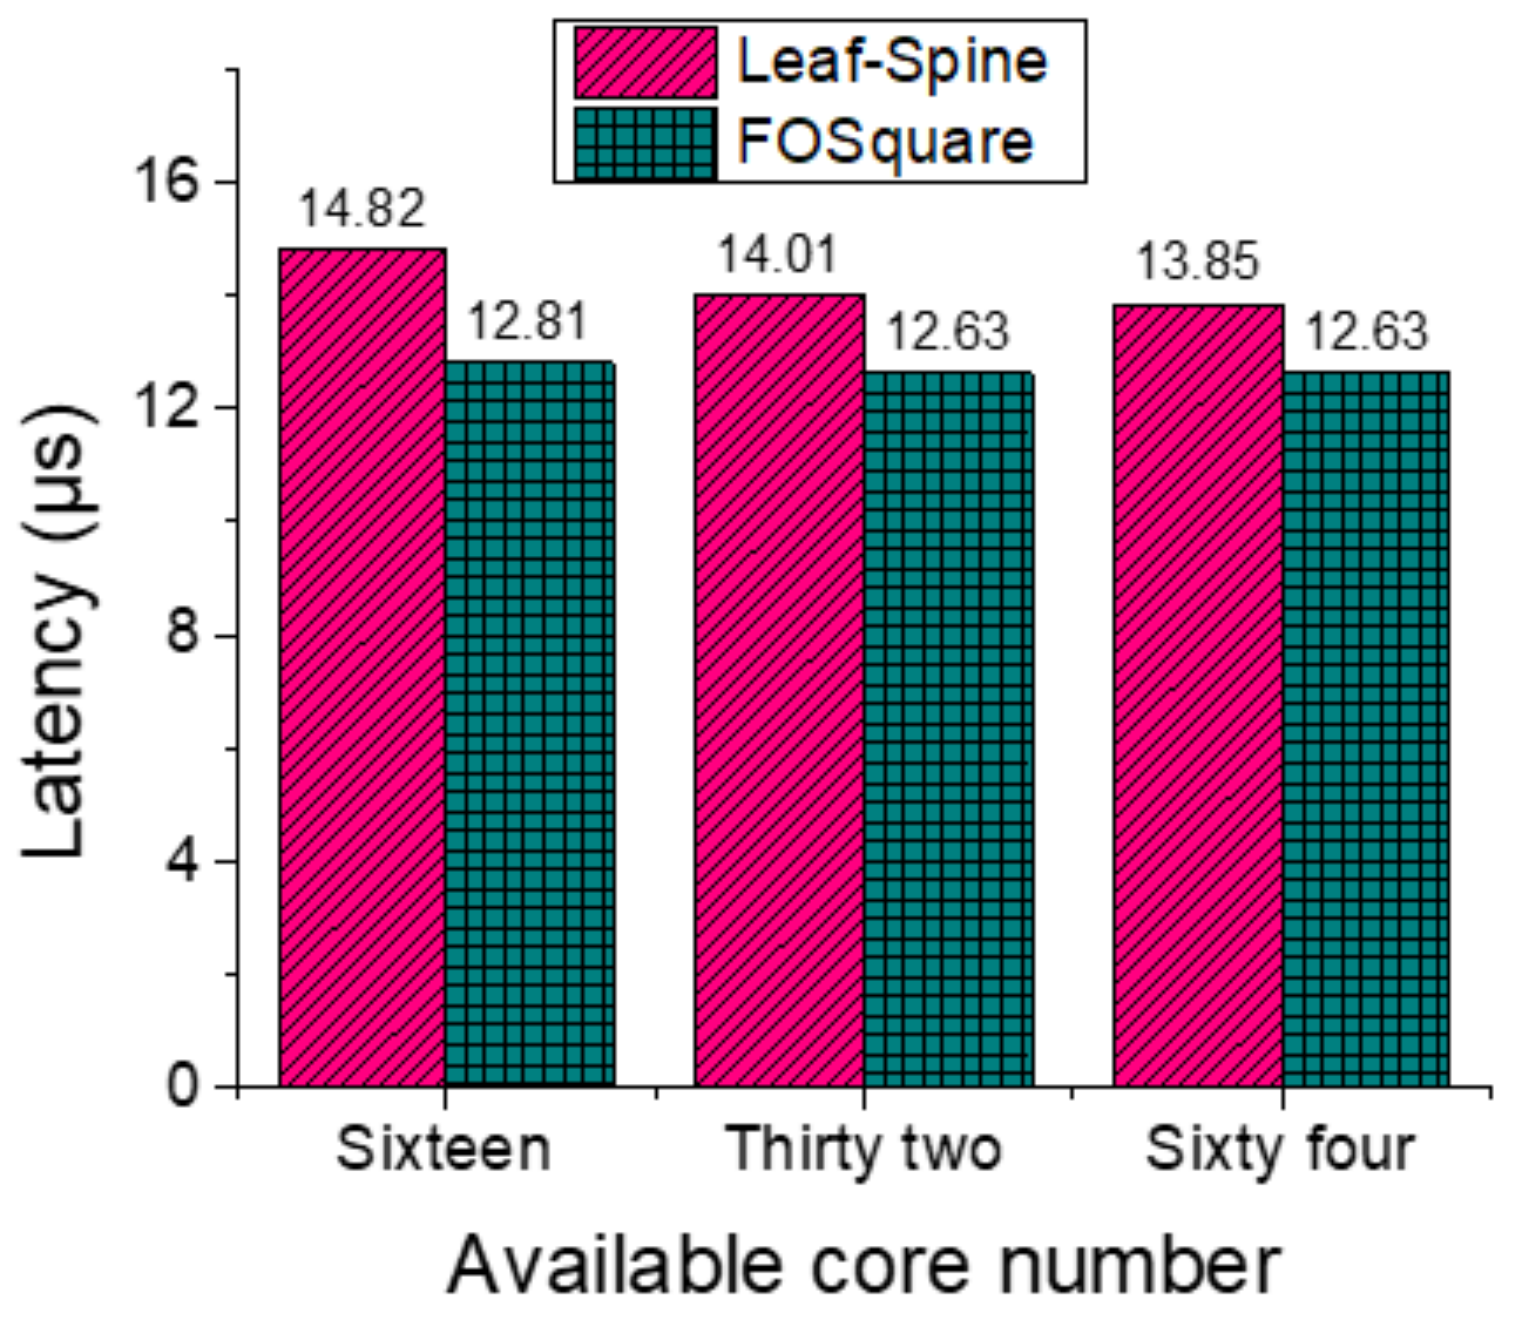
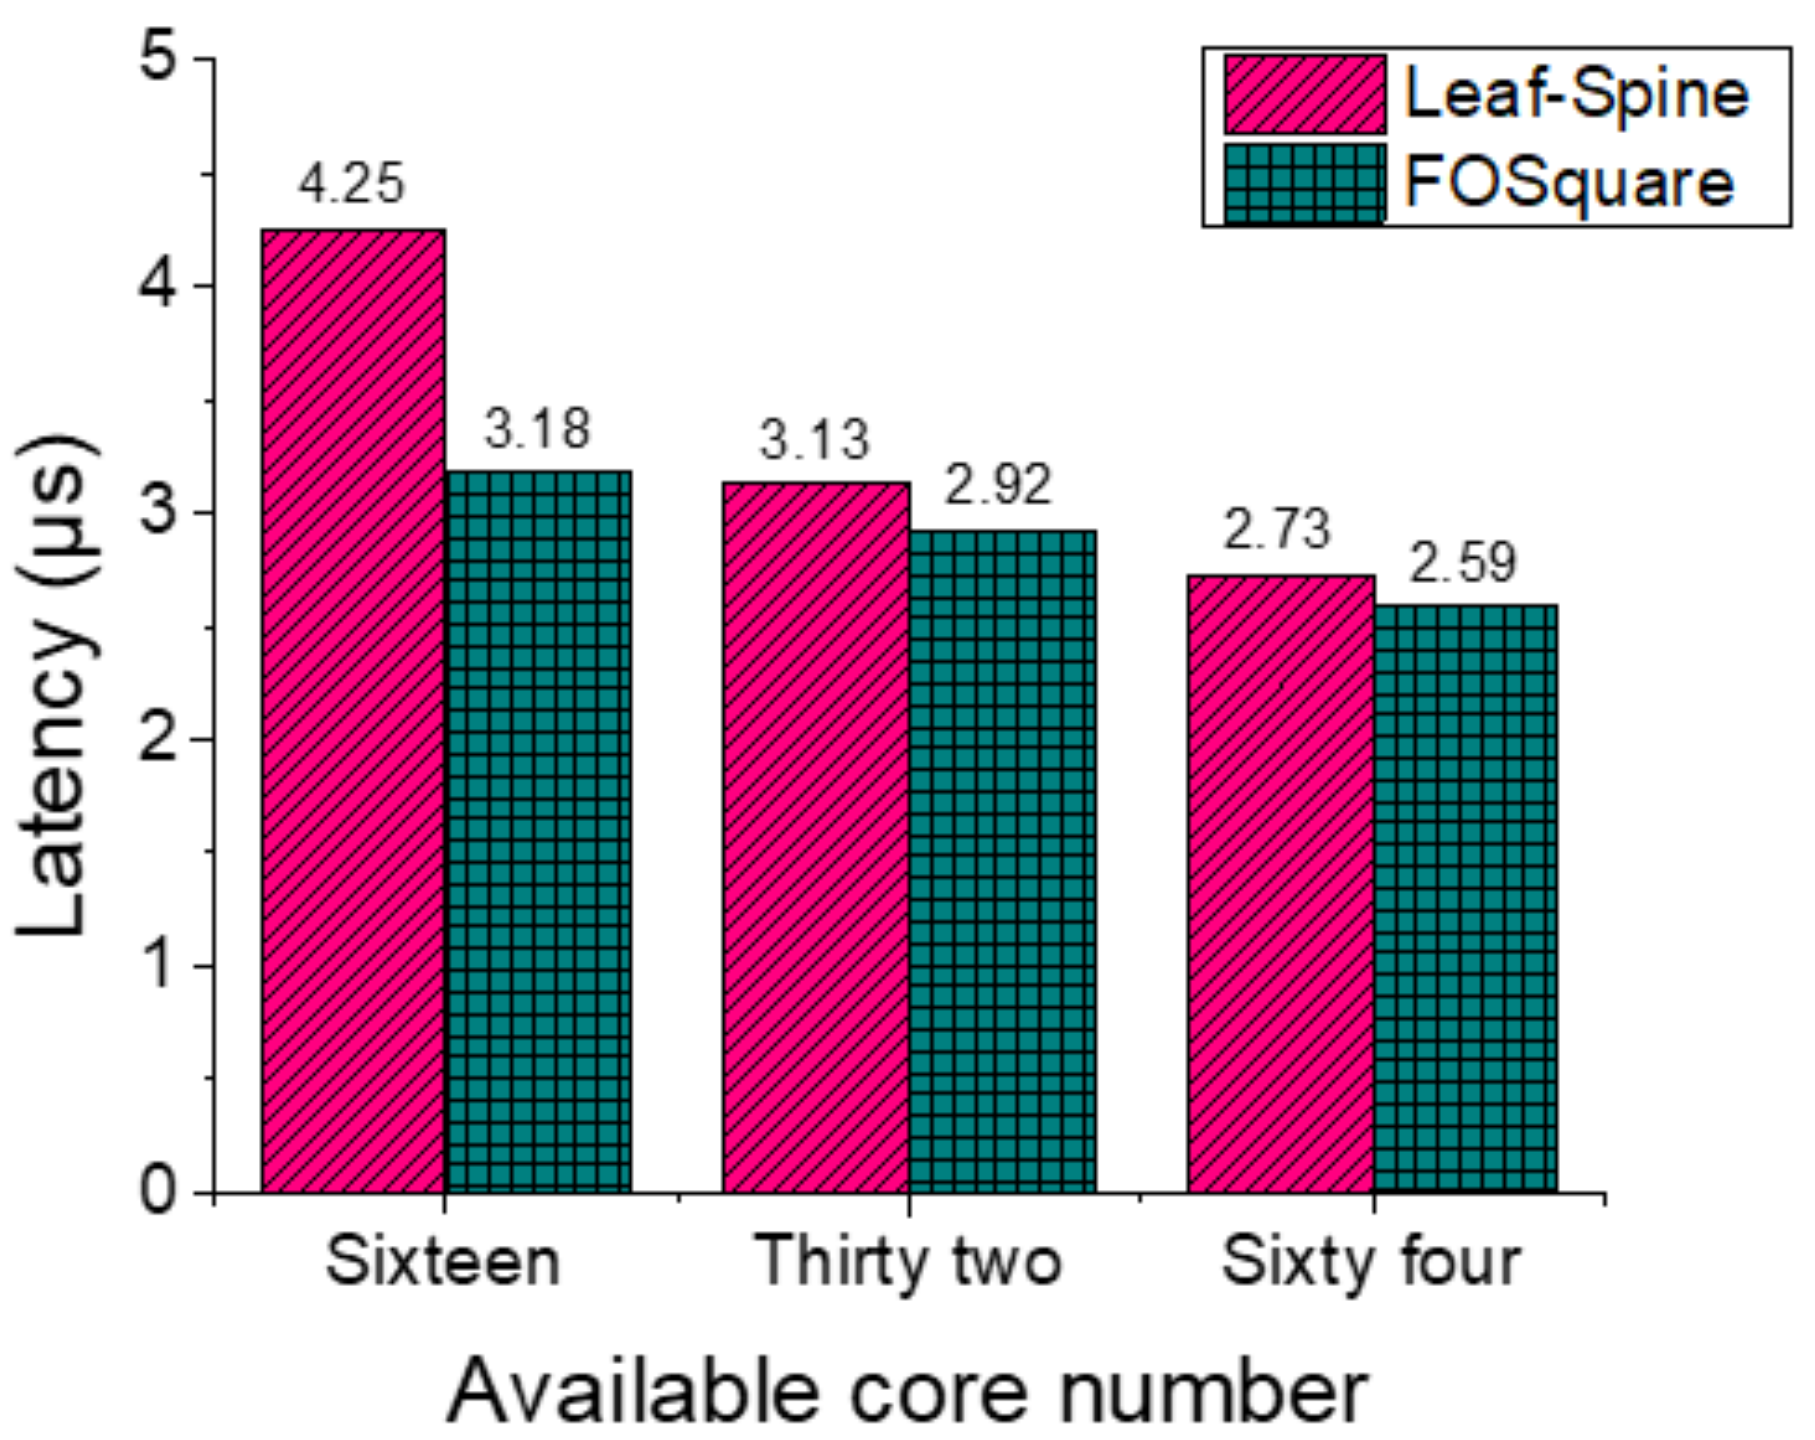
In this section, we present the simulation results with the proposed OPM mechanism for four different applications CG, MG, MILC, and MINI_MD in FOSquare and Leaf-Spine under three scenarios. Figure 6, Figure 7, Figure 8 and Figure 9 show the average latency obtained for each application with OPM algorithm in FOSquare and Leaf-Spine. The latency is the average server-to-server latency for all packets. The overall communication time including both latency and bandwidth/serialization contributions are considered. The results shown in Figure 6, Figure 7, Figure 8 and Figure 9 indicate an improved latency performance in both the FOSquare and Leaf-Spine architectures as the available core number increases. The reason is that when the number of available cores increases, the freedom to allocate processes also enlarges. Under the 16 available cores scenarios, the latency of FOSquare is 28.1%, 13.6%, 25.2%, and 10.9% less than that of Leaf-Spine for the application CG, MG, MILC, and MINI_MD, respectively. Moreover, even under 64 available core scenarios, numerical analyses indicate that FOSquare provides 5.1% less latency than Leaf-Spine for the MILC application.
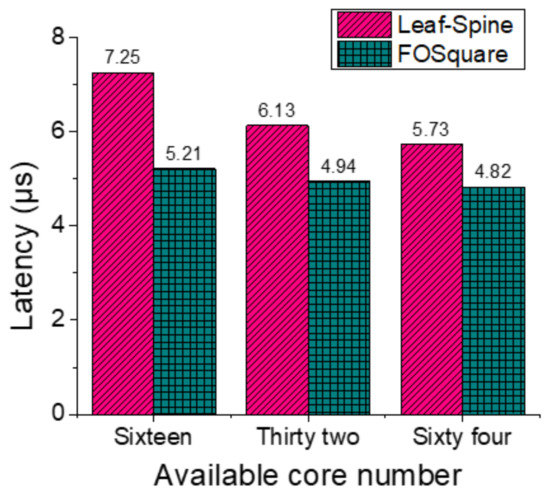
Figure 6.
CG application Latency.
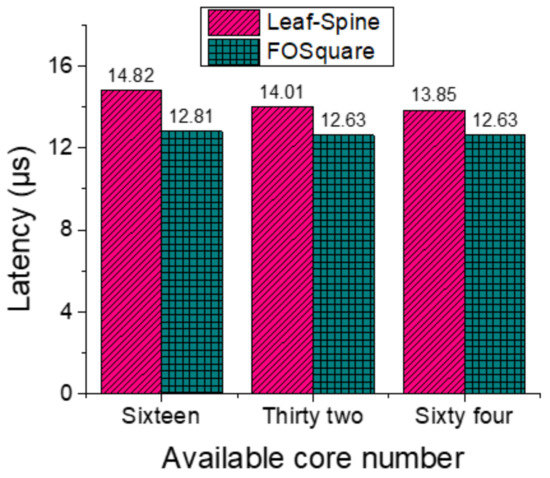
Figure 7.
MG application Latency.
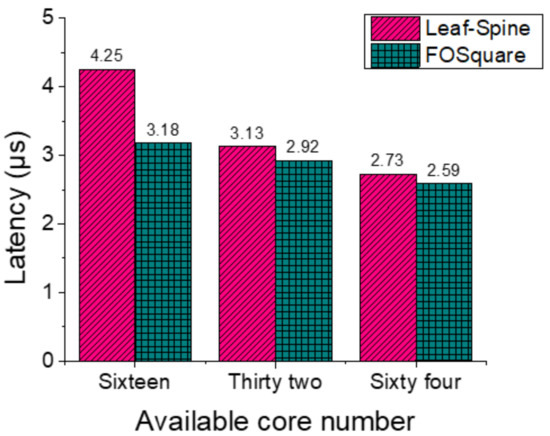
Figure 8.
MILC application Latency.
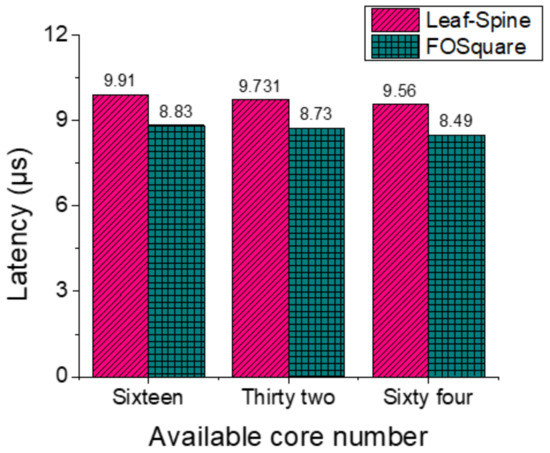
Figure 9.
MINI_MD application Latency.
5. Conclusions
We propose and investigate a novel HPC interconnecting architecture FOSquare based on buffer-less FOS with fast flow control. The number of supporting servers in FOSquare scales as N2. Besides, FOSquare allows for future proof scaling up the operating bitrate of servers due to the data rate/format transparency of the adopted optical switching technology. Benefiting from the operation of optical flow control, the requirement of optical buffers inside the FOS is eliminated. Moreover, with multi-paths existing for the communication server pairs, the FOSquare HPC architecture support a natural network fault-tolerance.
An OPM algorithm is also presented to group the most related processes (considering traffic status) and allocate cores inside a rack. Based on the HPC application traces, we numerically assess the system latency performance of FOSquare and Leaf-Spine in OMNeT++. Under the 16 available cores scenarios, the latency of FOSquare is 28.1%, 13.6%, 25.2%, and 10.9% less than Leaf-Spine for the application CG, MG, MILC, and MINI_MD, respectively. Therefore, the efficiency of the OPM algorithm and the high performance of the proposed architecture are verified, providing a promising solution to meet the high-throughput, low-latency and cost-efficient requirements for the HPC interconnecting.
Author Contributions
Conceptualization, F.Y. and C.Y.; Simulator development, F.Y.; validation, C.L. and X.D.; writing—original draft preparation, F.Y. and C.Y.; writing—review and editing, C.L. and X.D. All authors have read and agreed to the published version of the manuscript.
Funding
This research was funded by EUROSTARS OLYMPICS, grant number 10024020.
Institutional Review Board Statement
Not applicable.
Informed Consent Statement
Not applicable.
Data Availability Statement
Data available on request due to restrictions privacy. The data presented in this study are available on request from the corresponding author. The data are not publicly available due to it is from the Barcelona supercomputer.
Conflicts of Interest
The authors declare no conflict of interest.
References
- Top500.org. TOP500 List. 2017. Available online: http://top500.org/lists/2017/06 (accessed on 4 January 2021).
- Greenberg, A.; Hamilton, J.R.; Jain, N.; Kandula, S.; Kim, C.; Lahiri, P.; Maltz, D.A.; Patel, P.; Sengupta, S. VL2: A scalable and flexible data center network. In Proceedings of the ACM SIGCOMM 2009 Conference on Data communication, New York, NY, USA, 17–21 August 2009. [Google Scholar]
- Guo, C.; Wu, H.; Tan, K.; Shi, L.; Zhang, Y.; Lu, S. Dcell: A scalable and fault-tolerant network structure for data centers. In Proceedings of the ACM SIGCOMM 2008 Conference on Data communication, Seattle, WA, USA, 17–22 August 2008. [Google Scholar]
- Alizadeh, M.; Edsall, T. On the data path performance of leaf-spine datacenter fabrics. In Proceedings of the 2013 IEEE 21st Annual Symposium on High-Performance Interconnects (HOTI), San Jose, CA, USA, 21–23 August 2013; pp. 71–74. [Google Scholar]
- Kim, J.; Dally, W.J.; Scott, S.; Abts, D. Technology-driven, highly-scalable dragonfly topology. In Proceedings of the ACM SIGARCH Computer Architecture News IEEE Computer Society, Beijing, China, 21–25 June 2008; Volume 36, pp. 77–88. [Google Scholar]
- Porter, G.; Strong, R.; Farrington, N.; Forencich, A.; Chen-Sun, P.; Simunic, T.; Fainman, Y.; Papen, G.C.; Vahdat, A.M. Integrating microsecond circuit switching into the data center. ACM SIGCOMM Comput. Commun. Rev. 2013, 43, 447–458. [Google Scholar] [CrossRef]
- Sato, K. Realization and application of large-scale fast optical circuit switch for data center networking. In Proceedings of the 2017 European Conference on Optical Communication (ECOC), Gothenburg, Sweden, 17–21 September 2017; pp. 1–3. [Google Scholar]
- Meyer, H.; Sancho, J.C.; Mrdakovic, M.; Peng, S.; Simeonidou, D.; Miao, W.; Calabretta, N. Scaling architecture-on-demand based optical networks. In Proceedings of the 17th International Conference on Distributed Computing and Networking, New York, NY, USA, 4–7 January 2016. [Google Scholar]
- Honda, E.; Mori, Y.; Hasegawa, H.; Sato, K.-I. High-Throughput Optical Circuit Switch for Intra-Datacenter Networks Based on Spatial Super-Channels. In Proceedings of the Optical Fiber Communication Conference, San Francisco, CA, USA, 8–10 June 2020; Optical Society of America. [Google Scholar]
- Farrington, N.; Porter, G.; Radhakrishnan, S.; Bazzaz, H.H.; Subramanya, V.; Fainman, Y.; Papen, G.; Vahdat, A. Helios: A hybrid electrical/optical switch architecture for modular data centers. In Proceedings of the ACM SIGCOMM 2010 conference, New Delhi, India, 30 August–3 September 2010. [Google Scholar]
- Miao, W.; Luo, J.; Lucente, S.D.; Dorren, H.; Calabretta, N. Novel flat datacenter network architecture based on scalable and flow-controlled optical switch system. Opt. Express 2014, 22, 2465–2472. [Google Scholar] [CrossRef] [PubMed]
- Yan, F.; Miao, W.; Raz, O.; Calabretta, N. Opsquare: A flat DCN architecture based on flow-controlled optical packet switches. IEEE/OSA J. Opt. Commun. Netw. 2017, 9, 291–303. [Google Scholar] [CrossRef]
- Yan, F.; Xue, X.; Calabretta, N. HiFOST: A Scalable and Low-Latency Hybrid Data Center Network Architecture Based on Flow-Controlled Fast Optical Switches. IEEE/OSA J. Opt. Commun. Netw. 2018, 10, 1–14. [Google Scholar] [CrossRef]
- Proietti, R.; Cao, Z.; Nitta, C.J.; Li, Y.; Yoo, S.B. A scalable, low-latency, high-throughput, optical interconnect architecture based on arrayed waveguide grating routers. J. Lightwave Technol. 2015, 33, 911–920. [Google Scholar] [CrossRef]
- Xu, M.; Liu, C.; Subramaniam, S. PODCA: A passive optical data center network architecture. J. Opt. Commun. Netw. 2018, 10, 409–420. [Google Scholar] [CrossRef]
- Wiatr, P.; Yuan, D.; Wosinska, L.; Chen, J. Optical Interconnect Architectures for Datacenters. In Proceedings of the 2018 IEEE Photonics Conference (IPC), Reston, VA, USA, 30 September–4 October 2018; pp. 1–2. [Google Scholar]
- Carla, R. Architectures and performance of optical packet switching over WDM, Photonic Network Communications. J. lightwave Technol. 2001, 3, 91–99. [Google Scholar]
- Yang, R.; Wang, K.; Wang, B.; Wei, W.; Liu, X.; Guo, Y.; Gu, H. Resource and load aware mapping algorithm for elastic optical network. IEICE Electron. Express. 2016, 13, 1–8. [Google Scholar] [CrossRef]
- Meyer, H.; Sancho, J.C.; Mrdakovic, M.; Miao, W.; Calabretta, N. Optical packet switching in HPC. An analysis of applications performance. Future Gener. Comput. Syst. 2017, 82, 606–616. [Google Scholar] [CrossRef]
- Prifti, K.; Xue, X.; Tessema, N.; Stabile, R.; Calabretta, N. Lossless Photonic Integrated Add-Drop Switch Node for Metro-Access Networks. IEEE Photonics Technol. Lett. 2020, 32, 387–390. [Google Scholar] [CrossRef]
- MIMD Lattice Computation (MILC) Collaboration. Available online: http://www.physics.utah.edu/~detar/milc/ (accessed on 4 January 2021).
- Heroux, M.A. 2008 Mantevo Home Page. Available online: https://mantevo.org/ (accessed on 4 January 2021).
- Bailey, D.H.; Barszcz, E.; Barton, J.T.; Browning, D.S.; Carter, R.L.; Dagum, L.; Fatoohi, R.A.; Frederickson, P.O.; Lasinski, T.A.; Schreiber, R.S.; et al. The NAS parallel benchmarks; Summary and preliminary results. In Proceedings of the 1991 ACM/IEEE Conference on Supercomputing, Supercomputing’ 91ACM, New York, NY, USA, 18–22 November 1991; pp. 158–165, ISBN 0-89791-459-7. [Google Scholar]
- Cut-Through and Store-and-Forward Ethernet Switching for Low-Latency Environments. Available online: https://joonyounglee.tistory.com/106 (accessed on 4 January 2021).
- Calabretta, N.; Williams, K.; Dorren, H. Monolithically Integrated WDM Cross-Connect Switch for Nanoseconds Wavelength, Space, and Time Switching. In Proceedings of the 2015 European Conference on Optical Communication (ECOC), Valencia, Spain, 27 September–1 October 2015. [Google Scholar]
Publisher’s Note: MDPI stays neutral with regard to jurisdictional claims in published maps and institutional affiliations. |
© 2021 by the authors. Licensee MDPI, Basel, Switzerland. This article is an open access article distributed under the terms and conditions of the Creative Commons Attribution (CC BY) license (http://creativecommons.org/licenses/by/4.0/).

