1. Introduction
Structured light with non-Gaussian intensity profiles and with spatially variant phase distributions is getting attention in many fields of optical science and technology. A special case of such beams is a vortex beam, which features a helical shaped wavefront and annular intensity distribution [
1,
2]. A specific example of this kind of beam is, for example, the Laguerre–Gauss (LG) beam [
3]. During propagation, the phase of this beam rotates around a line, where the phase value is undetermined. At the screen, the line is reduced to a point, which is usually called the vortex point. One of the interesting physical features of the vortex beam is its donut-shaped intensity distribution. In the intensity pattern, one can observe a dark area (the vortex core) surrounded by a bright ring [
4]. Another unique aspect of this beam is the phase distribution. Its contour lines reveal a spiral character. Many methods have been used to characterize a vortex beam regarding its intensity profile. The bright ring of the ideal vortex beam is circular, with a diameter that encapsulates information of the beam size [
5]. In the case of optical imperfections, the intensity profile loses its spherical symmetry, changing, for example, into an elliptical one [
6,
7]. There are also methods to characterize a vortex beam by looking at the correlation between the measured and pure (ideal) modes [
8] or to identify order modes by its orbital angular momentum spectra [
9]. In this paper, we propose a new way for characterizing a vortex beam through the analysis of its phase distribution contour. We show that the phase profile of the LG beam can be described by a Fermat’s spiral with parameters that determine the curvature of the beam wavefront, as well as its spiral orientation. Moreover, we propose a procedure for recovering parameters of the spiral from the phase map. We also show that this concept of beam description can be applied in the case of a helical beam created by the spiral phase plate which is used in the optical vortex scanning microscope [
10,
11]. In the experimental part, we apply this new way of beam description to recover the phase shift introduced into the object beam in the optical vortex scanning microscope.
2. Laguerre–Gauss Beam and a Fermat’s Spiral in the Phase Profile
The complex amplitude of the Laguerre–Gauss beam (mode LG
0m*) can be expressed in Cartesian coordinates by Equation (1):
where
, and A and B belong to the complex numbers and m is topological charge, which measures the phase change in one close trip around the axis (m = 1, 2, 3, …).
Figure 1 presents a contour plot of the
. It is shown below that level sets of a function form a family of Fermat’s spirals [
12]. First, by passing to polar coordinates
,
, one gets
by the Moivre’s formula. Using
,
, and the addition rule for arguments of complex numbers [
13] one obtains:
From the above equation we get:
If
, then
. Hence, a level set of the function AN in polar coordinates,
, is a curve given by a formula:
where
The curve described by Equation (3) is a Fermat’s spiral with a tangent line at r = 0 equal to
. Two cases of tangent lines are presented in
Figure 1b,c. Equation (4) can be rewritten as:
which is a more convenient form to perform the numerical fitting. Here,
Figure 2 presents the exemplary phase maps calculated using Equation (3) and printed in grayscale, for different values of parameters α (Equation (7)) and β (Equation (8)). The phase distribution reveals a characteristic 2π jump, which we call the phase step line. As stated above, it forms a Fermat’s spiral.
Figure 2a,b presents the phase maps with the same value of parameter α and different β values, showing that β indicates spiral orientation.
Figure 2b,c shows the same β value and different α values. Here, one can see that α is responsible for spiral density. Thus, spiral density depends on the parameter α alone, while the parameter β affects the spiral orientation.
Equations (1) and (2) can be compared to the LG equation expressed by the physical parameter of the Gaussian beam [
3]:
where
w0 is a beam waist,
is transverse beam dimension,
is radius of curvature of the beam wavefront,
is Rayleigh range, Φ
G is Gouy phase, and
ϕ0 is initial phase. By comparing Equations (2) and (9), one reads that
and
. Applying Equations (5) and (7), one gets the expression for the radius of curvature of the wavefront in terms of the parameter α:
The value of β indicates an angle of tangent line at radial coordinate r = 0 (see
Figure 1).
In the next paragraphs, we describe a procedure for recovering the parameters encoding Fermat’s spiral (α, β in Equation (6)), first, from numerical phase maps, and then from the phase maps obtained in the experiment.
3. Numerical Fitting Procedure
To demonstrate how the spiral equation can be found and verify the fitting procedure, we started from numerically generated phase maps. In the first step, the complex amplitude of the vortex beam is calculated using Equation (1), from which the phase term has been extracted.
The phase values plotted modulo-2π are presented in
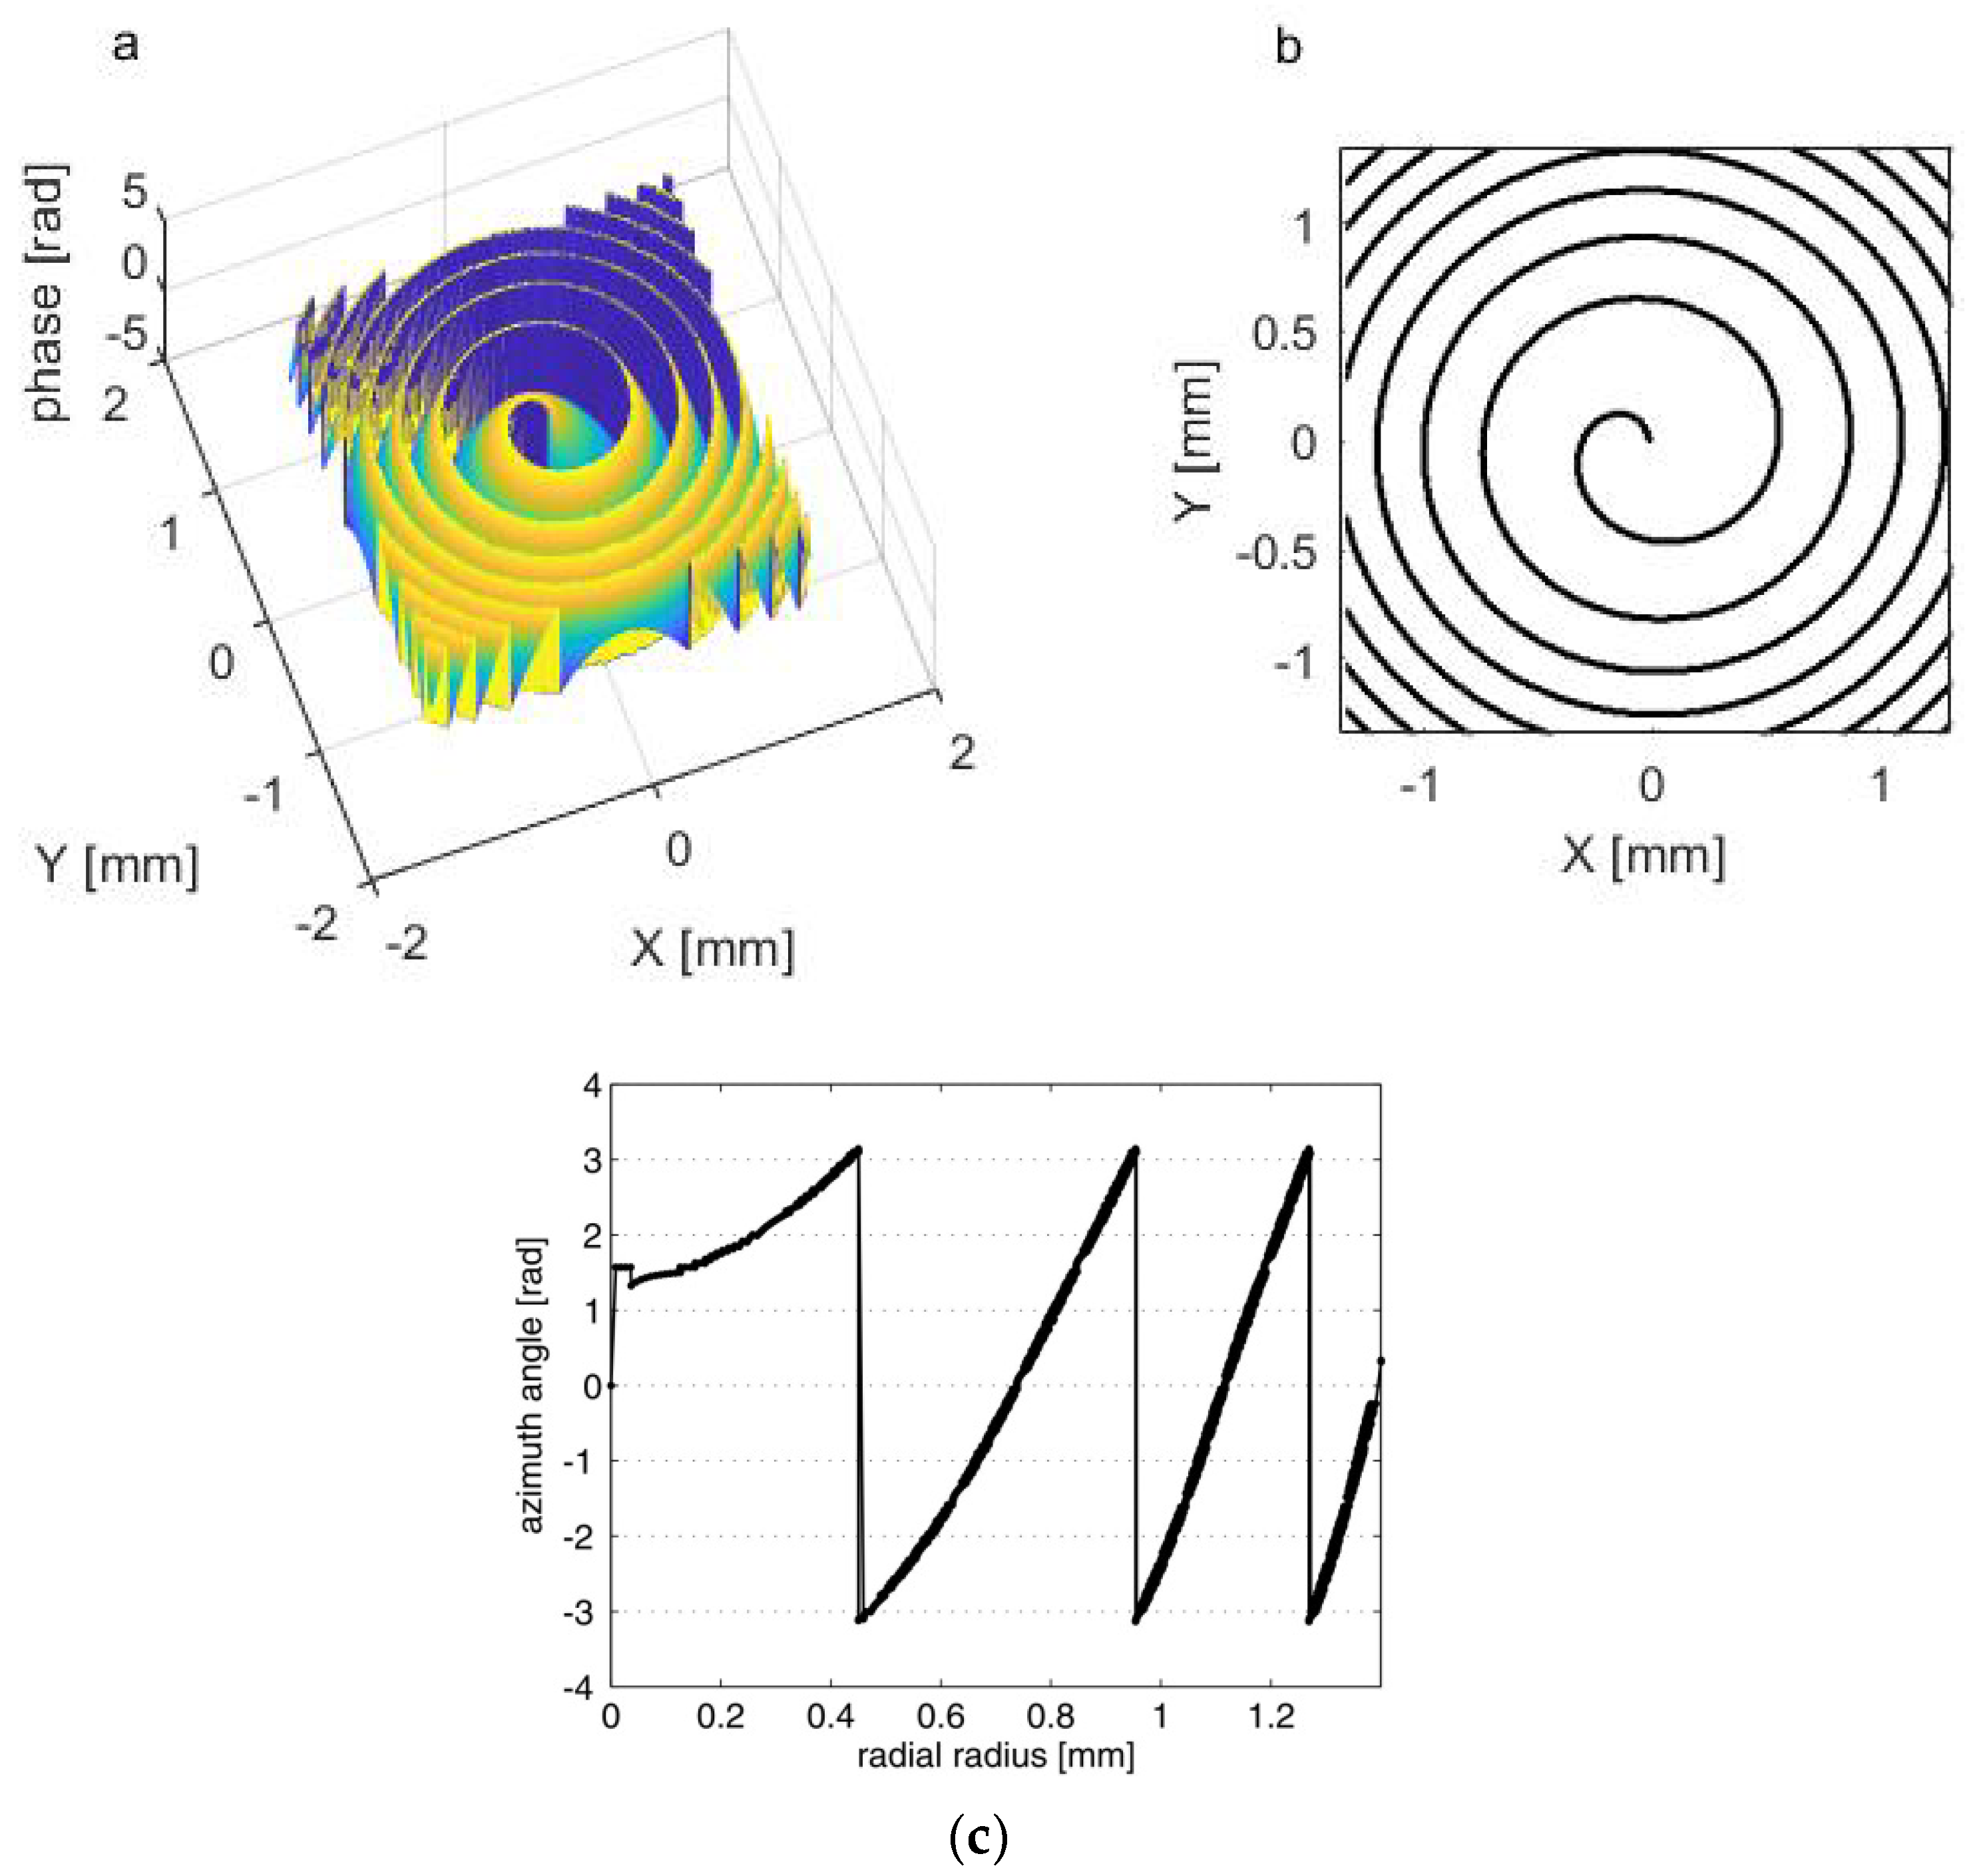
Figure 3a as a surface plot. One can see the 2π phase jump (from −3.14 rad to 3.14 rad) which forms a spiral line. It is one of many isophase lines on the map but it is the easiest to find. This phase jump line can be treated as an edge and can be extracted using Roberts method [
14] for edge detection used in image processing. The results of this step are presented in
Figure 3b. In this way, we obtain Cartesian coordinates of points forming a spiral (
Figure 3b) which, next, have to be transformed into polar coordinates (radial radius r and azimuth angle φ).
In the next step of calculations, the received points are sorted according to radial radii, and then unwrapping is necessary to assign the proper value of the azimuthal angle to the radial radius. Without unwrapping, an azimuth angle ranges from −π to π, which is not the case for the spiral coordinates (
Figure 3c). Increasing the azimuth angle enables a recognition of subsequent twirls of the spiral. Now, coordinates are set in proper order in order to reconstruct a curve expressed by Equation (6). In order to determine the values of parameters α and β, we use a nonlinear least squares method without normalization [
15]. The nonlinear least squares is the form of least squares analysis used to fit a set of mk observations with a model that is nonlinear in “n” unknown parameters (mk ≥ n). The basis of the method is to approximate the model by a linear one and to refine the parameters by successive iterations.
We simulated numerically a beam with an optical vortex with the following optical characteristics: values A and B (Equation (1)) for this beam were equal to
and
,
and correspondingly
and
. The results of a spiral recovering are presented in
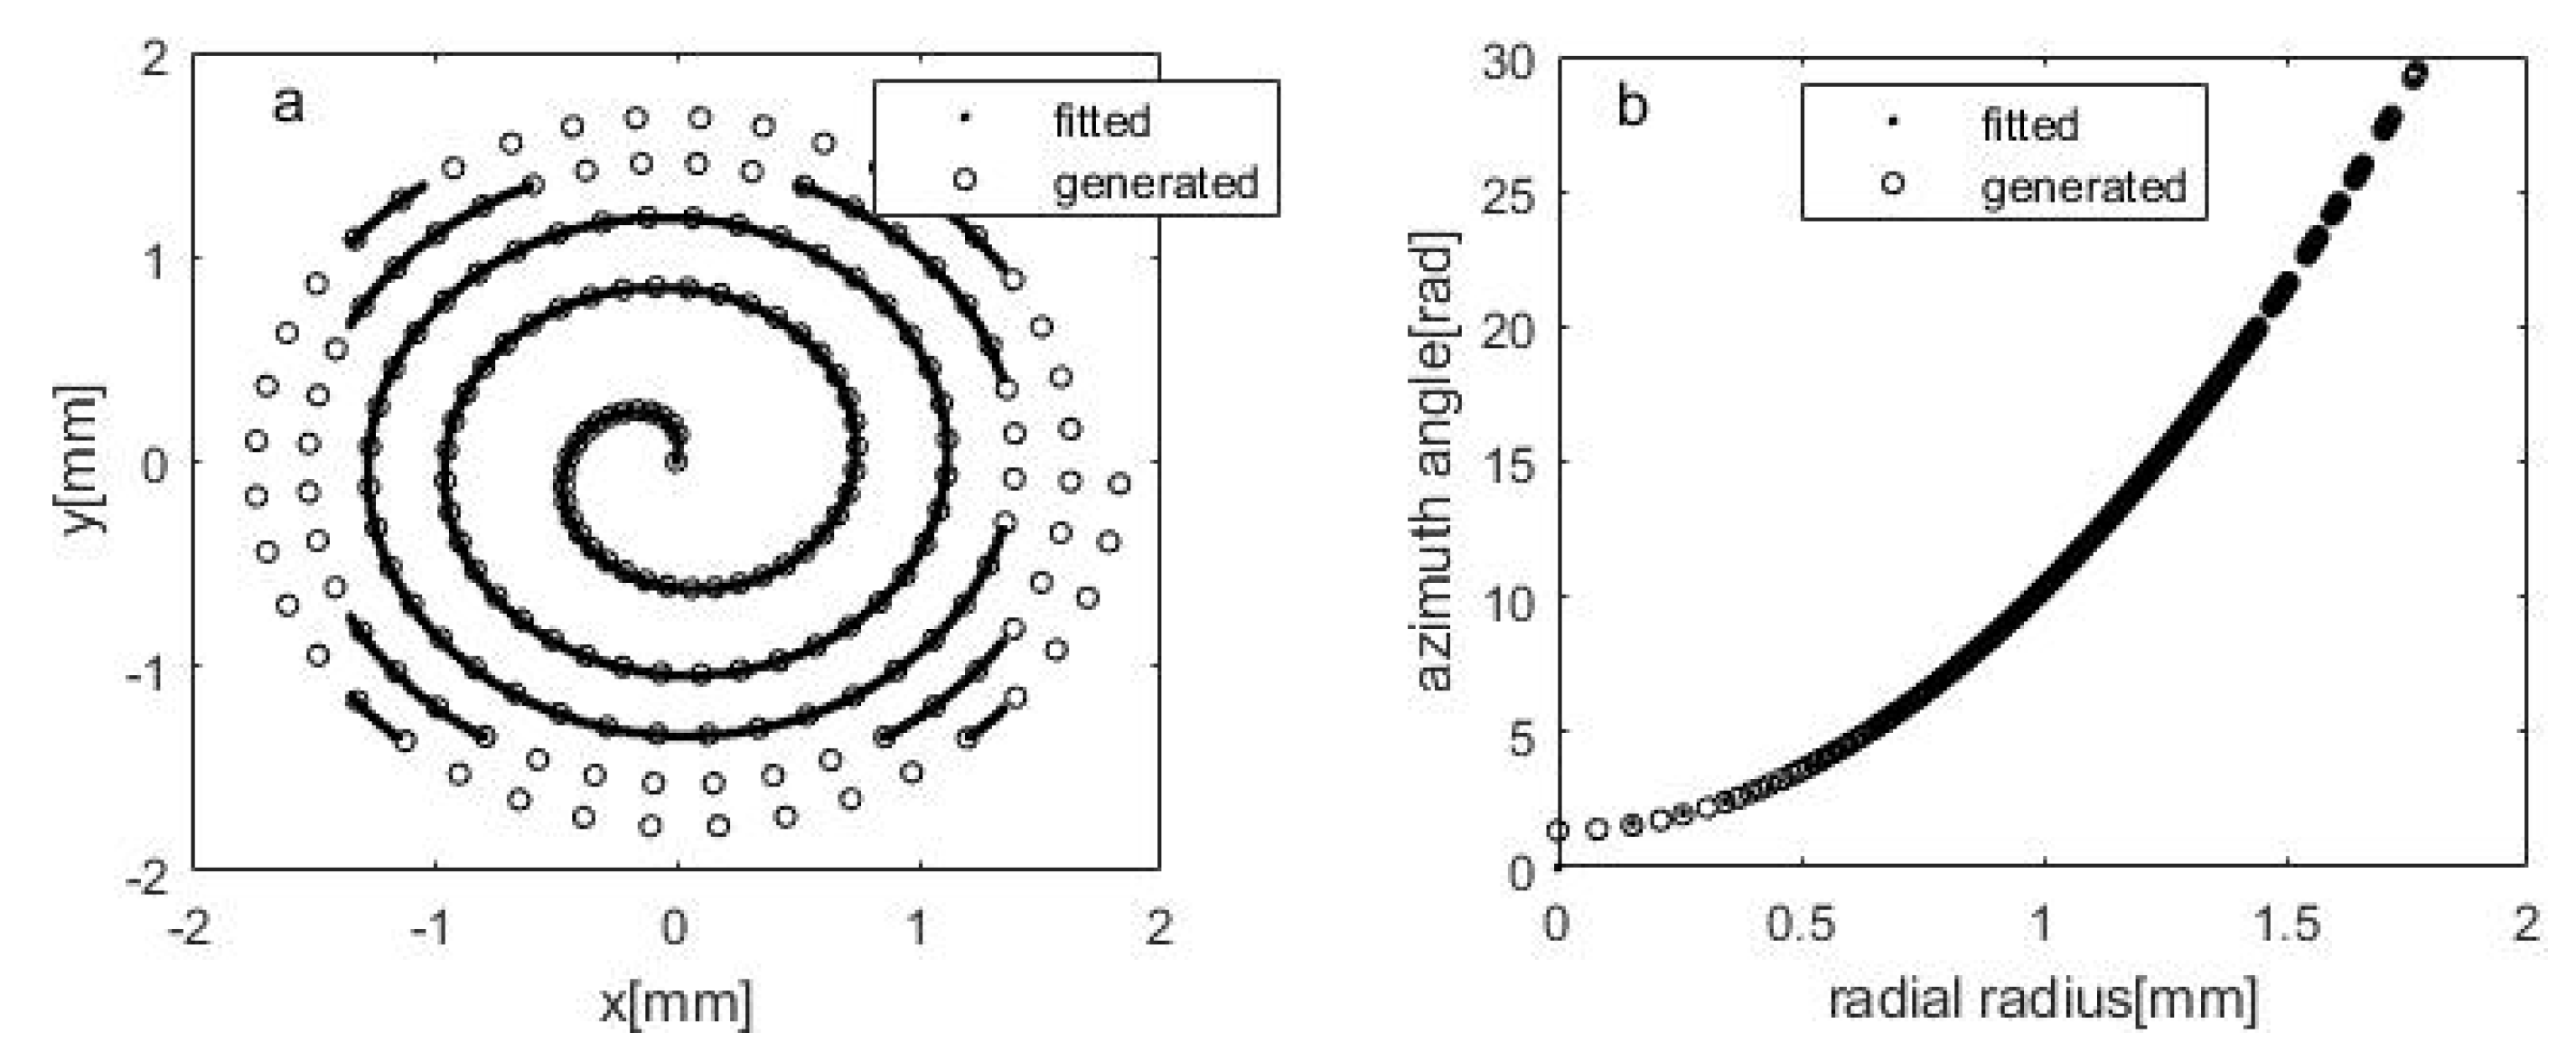
Figure 4.
Figure 4a shows two spirals, one spiral extracted from numerically generated helical wavefronts (dots), and a second spiral (circles) given by Equation (6) with the recovered values of α and β. Values of parameters are fitted (with 95% confidence bounds) as α = 8.95 ± 0.01
and β = 1.35 ± 0.1.
Figure 4b displays a dependence between the radial radius and azimuthal angle for both spirals. The orientation (determined by the tangent line) of the calculated spiral was β = 77.3 ± 0.7°, while the radius of the wavefront curvature of the beam (Equation (9)) is R = 357 mm. One sees that, in this way, we are able to recover the spiral characteristics.
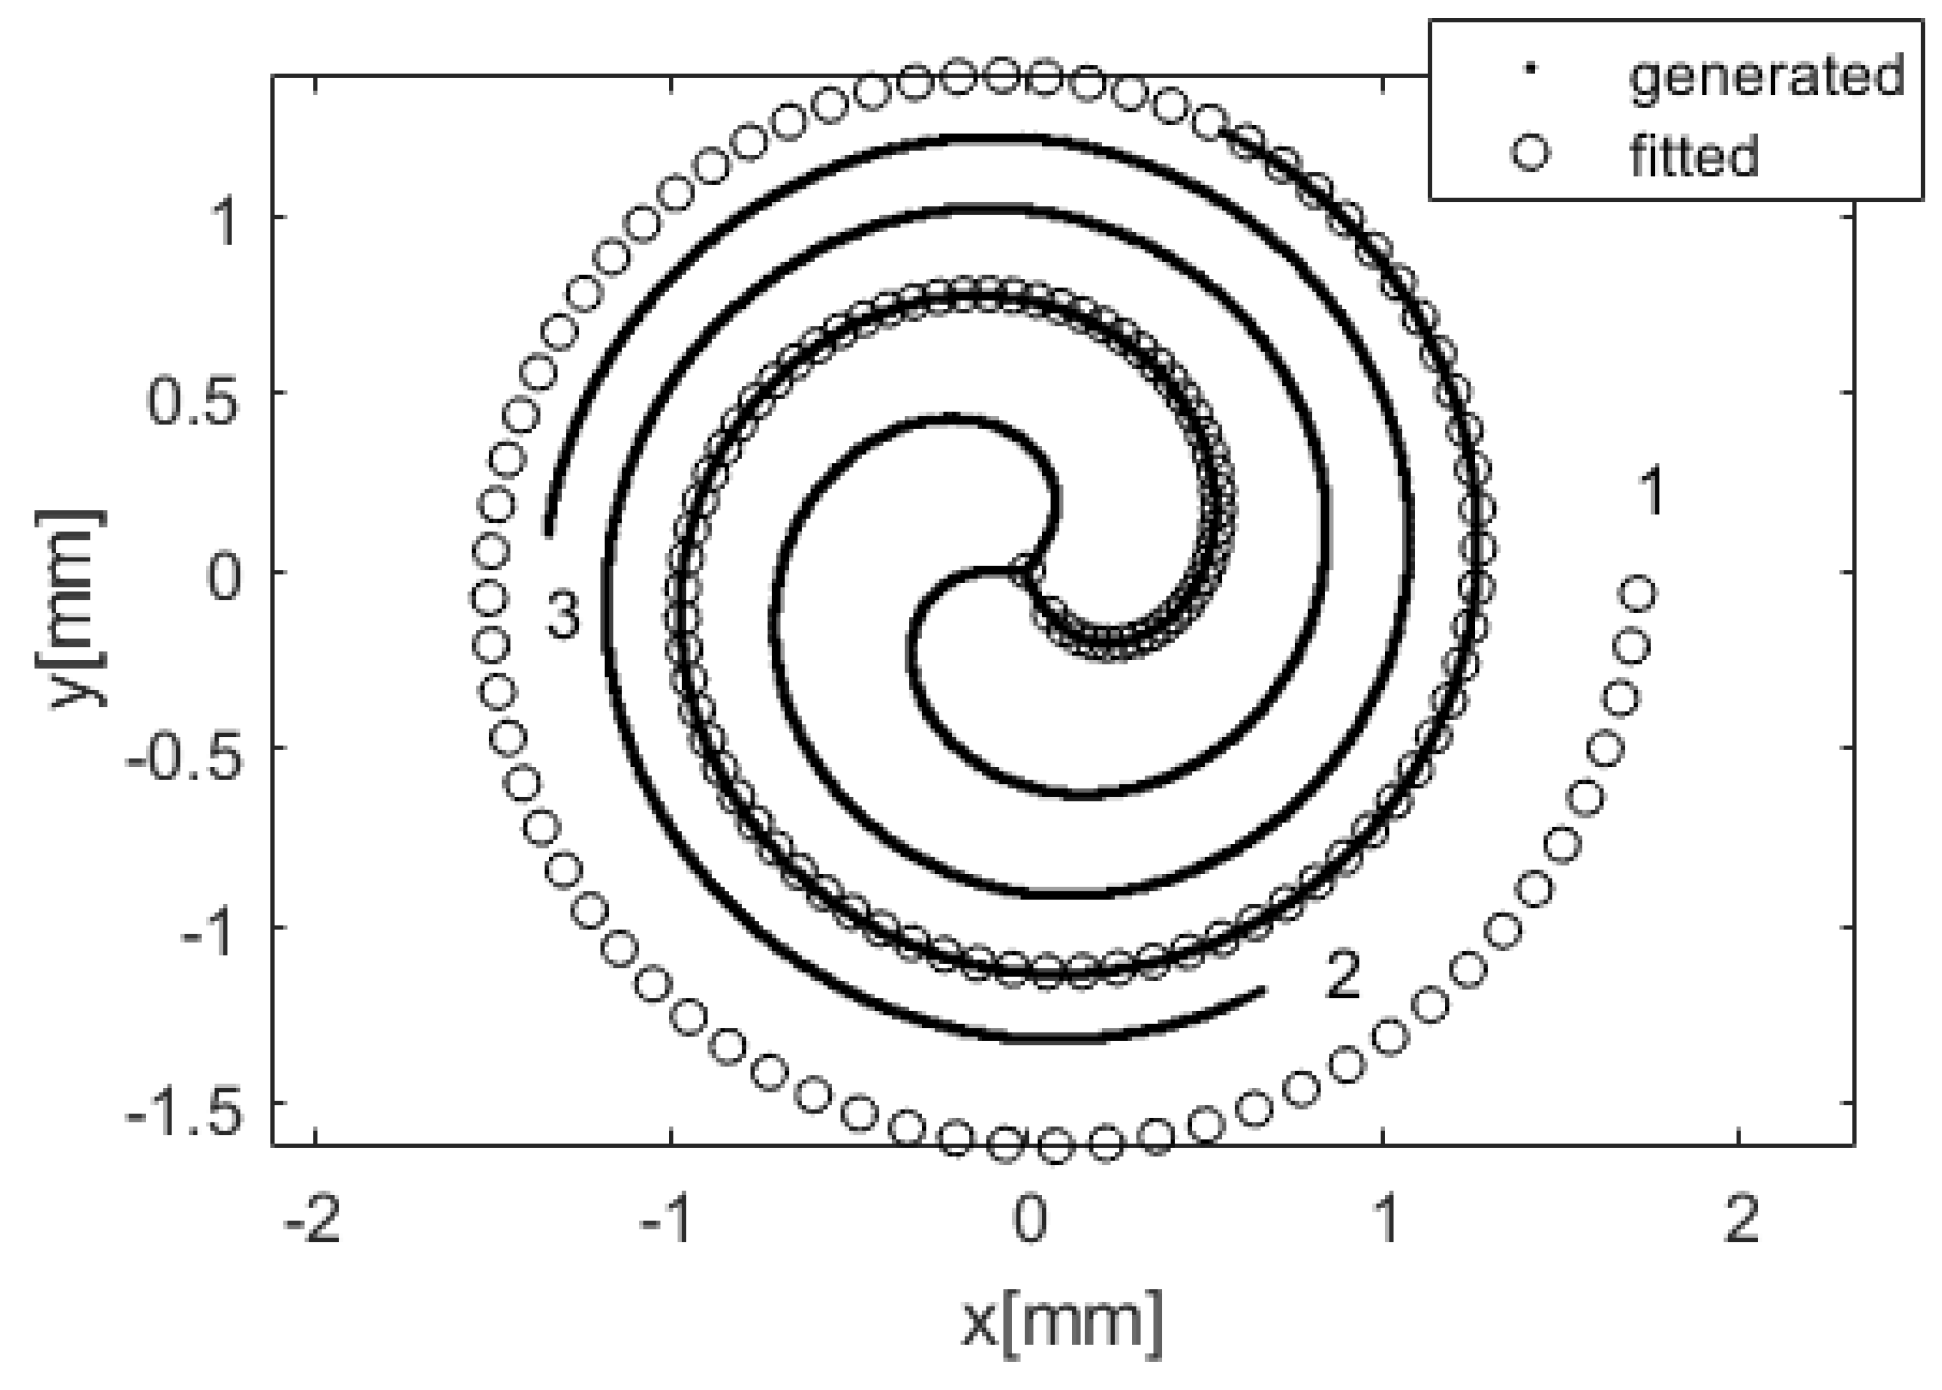
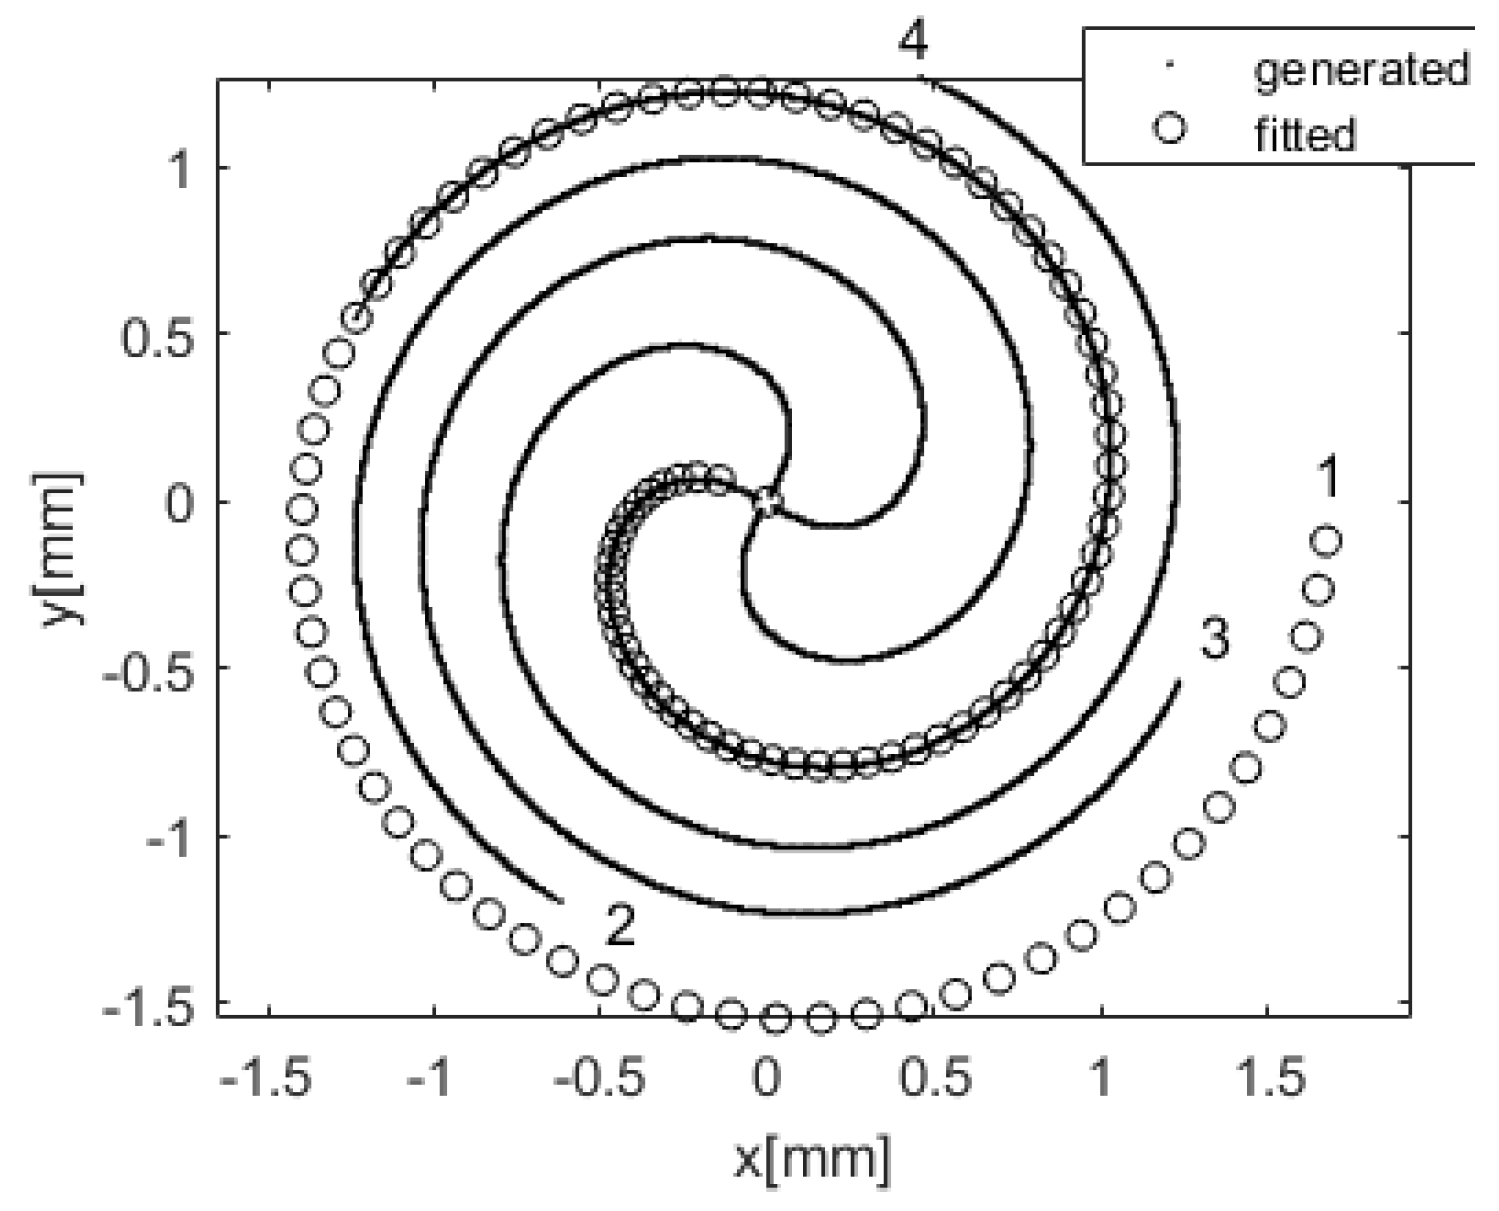
For the LG beam with higher topological charges, fitting is more complicated, but can be done. There are more 2π phase jumps lines forming Fermat’s spirals in the phase distribution. In these cases, the points found with the Roberts method must be separated into separate spirals. If the points are converted to polar coordinates and arranged in an increasing order of the radius, then, the particular spirals can be separated based on the second coordinate, the azimuth angle φ.
Figure 5 and
Figure 6 present the results of the algorithm for topological charges, m = 3 and m = 4, respectively, together with the fitted parameters α and β. One can see that the values of parameter α are kept almost constant for the given topological charge while the β values change, pointing out that the subsequent spirals are rotated by an angle of 119° ± 2° in the case of m = 3 and 90° ± 2° in the case of m = 4.
In the experimental part, which is described in the next section, the vortex beam is generated by the spiral phase plate (SPP). In this case, the complex amplitude is described by the sum of two special Bessel functions ([
16], Equation (22)). We numerically generate phase maps and intensity distribution within such beam and notice that the spiral line can be divided into two parts, i.e., one Fermat’s spiral fits the internal part of the beam (
Figure 7a) while the second Fermat’s spiral fits the external areas of the beam (
Figure 7b). In the experiments, we examined only the central area of the beam (inside the bright intensity ring), therefore, the part of the spiral included, only in this area, has been taken into account.
We use the algorithm described above to recover the uniform phase shift which is introduced into the vortex beam. The phase shift in the vortex beam manifests itself in the rotation of the phase profile.
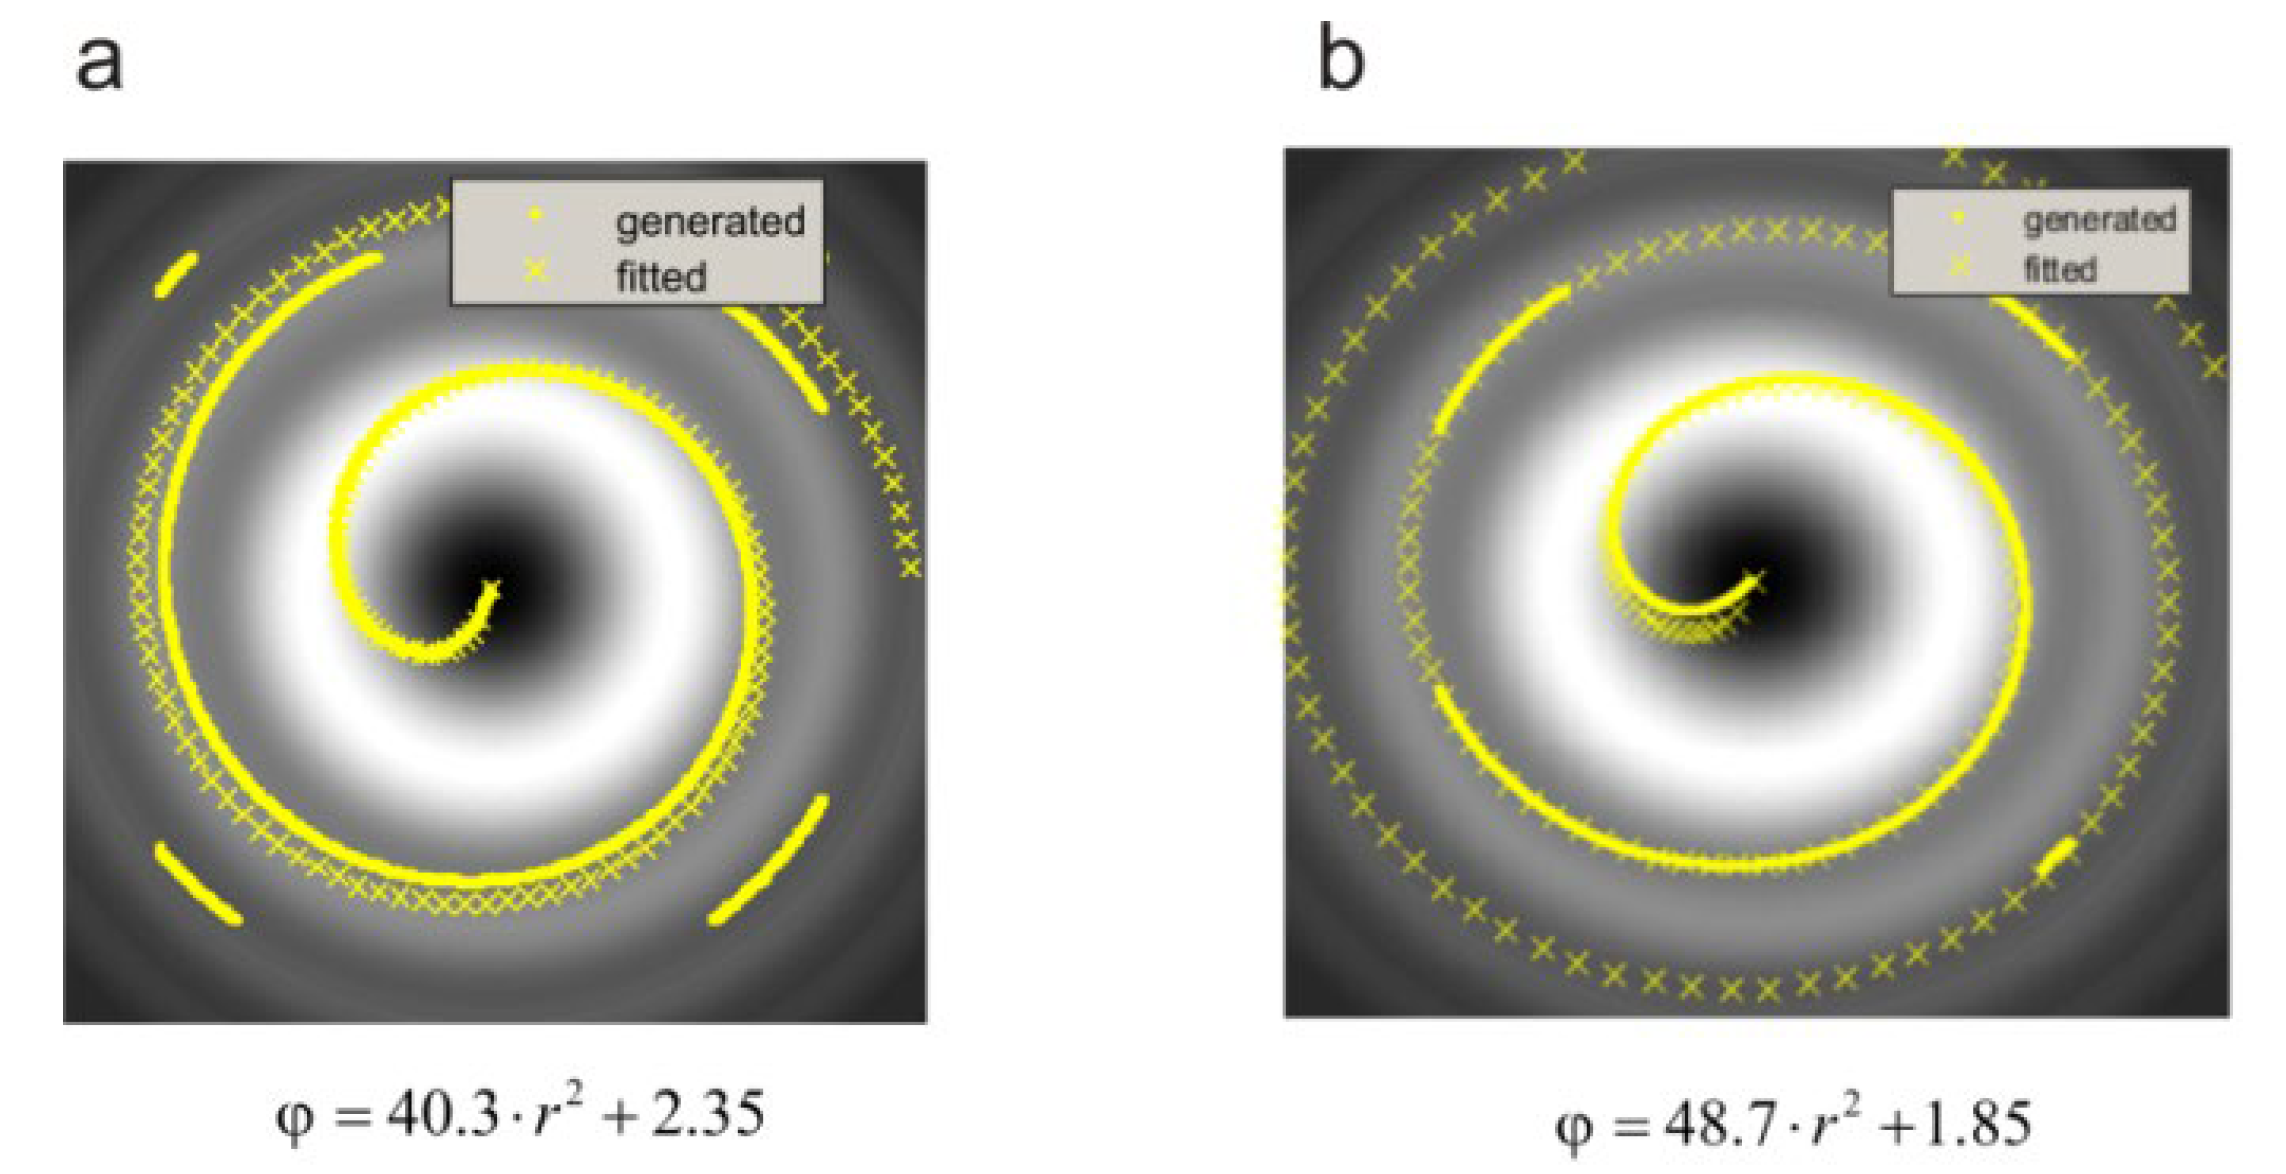
Figure 8 presents the spiral lines (plotted over the intensity distribution) in the case of four different values of phase ϕ
0. The phase is increased subsequently by the amount of π/5, causing the rotation of the 2π jump line, and the angle by which the spiral rotates corresponds to the introduced phase shift. As mentioned earlier, the parameter β from the spiral equation describes the spiral orientation, so its value changes when the spiral rotates.
Table 1 shows the results of the numerical fitting of the Fermat’s spiral parameters. One can see that α value is kept almost constant, while β changes indicate the rotation of the spiral. By calculating the difference between the β values in particular cases, we can recover the value of the introduced phase shift Δϕ, which corresponds well with the known value introduced into the beam.
4. Experimental Results
The algorithm described above was tested on experimental data.
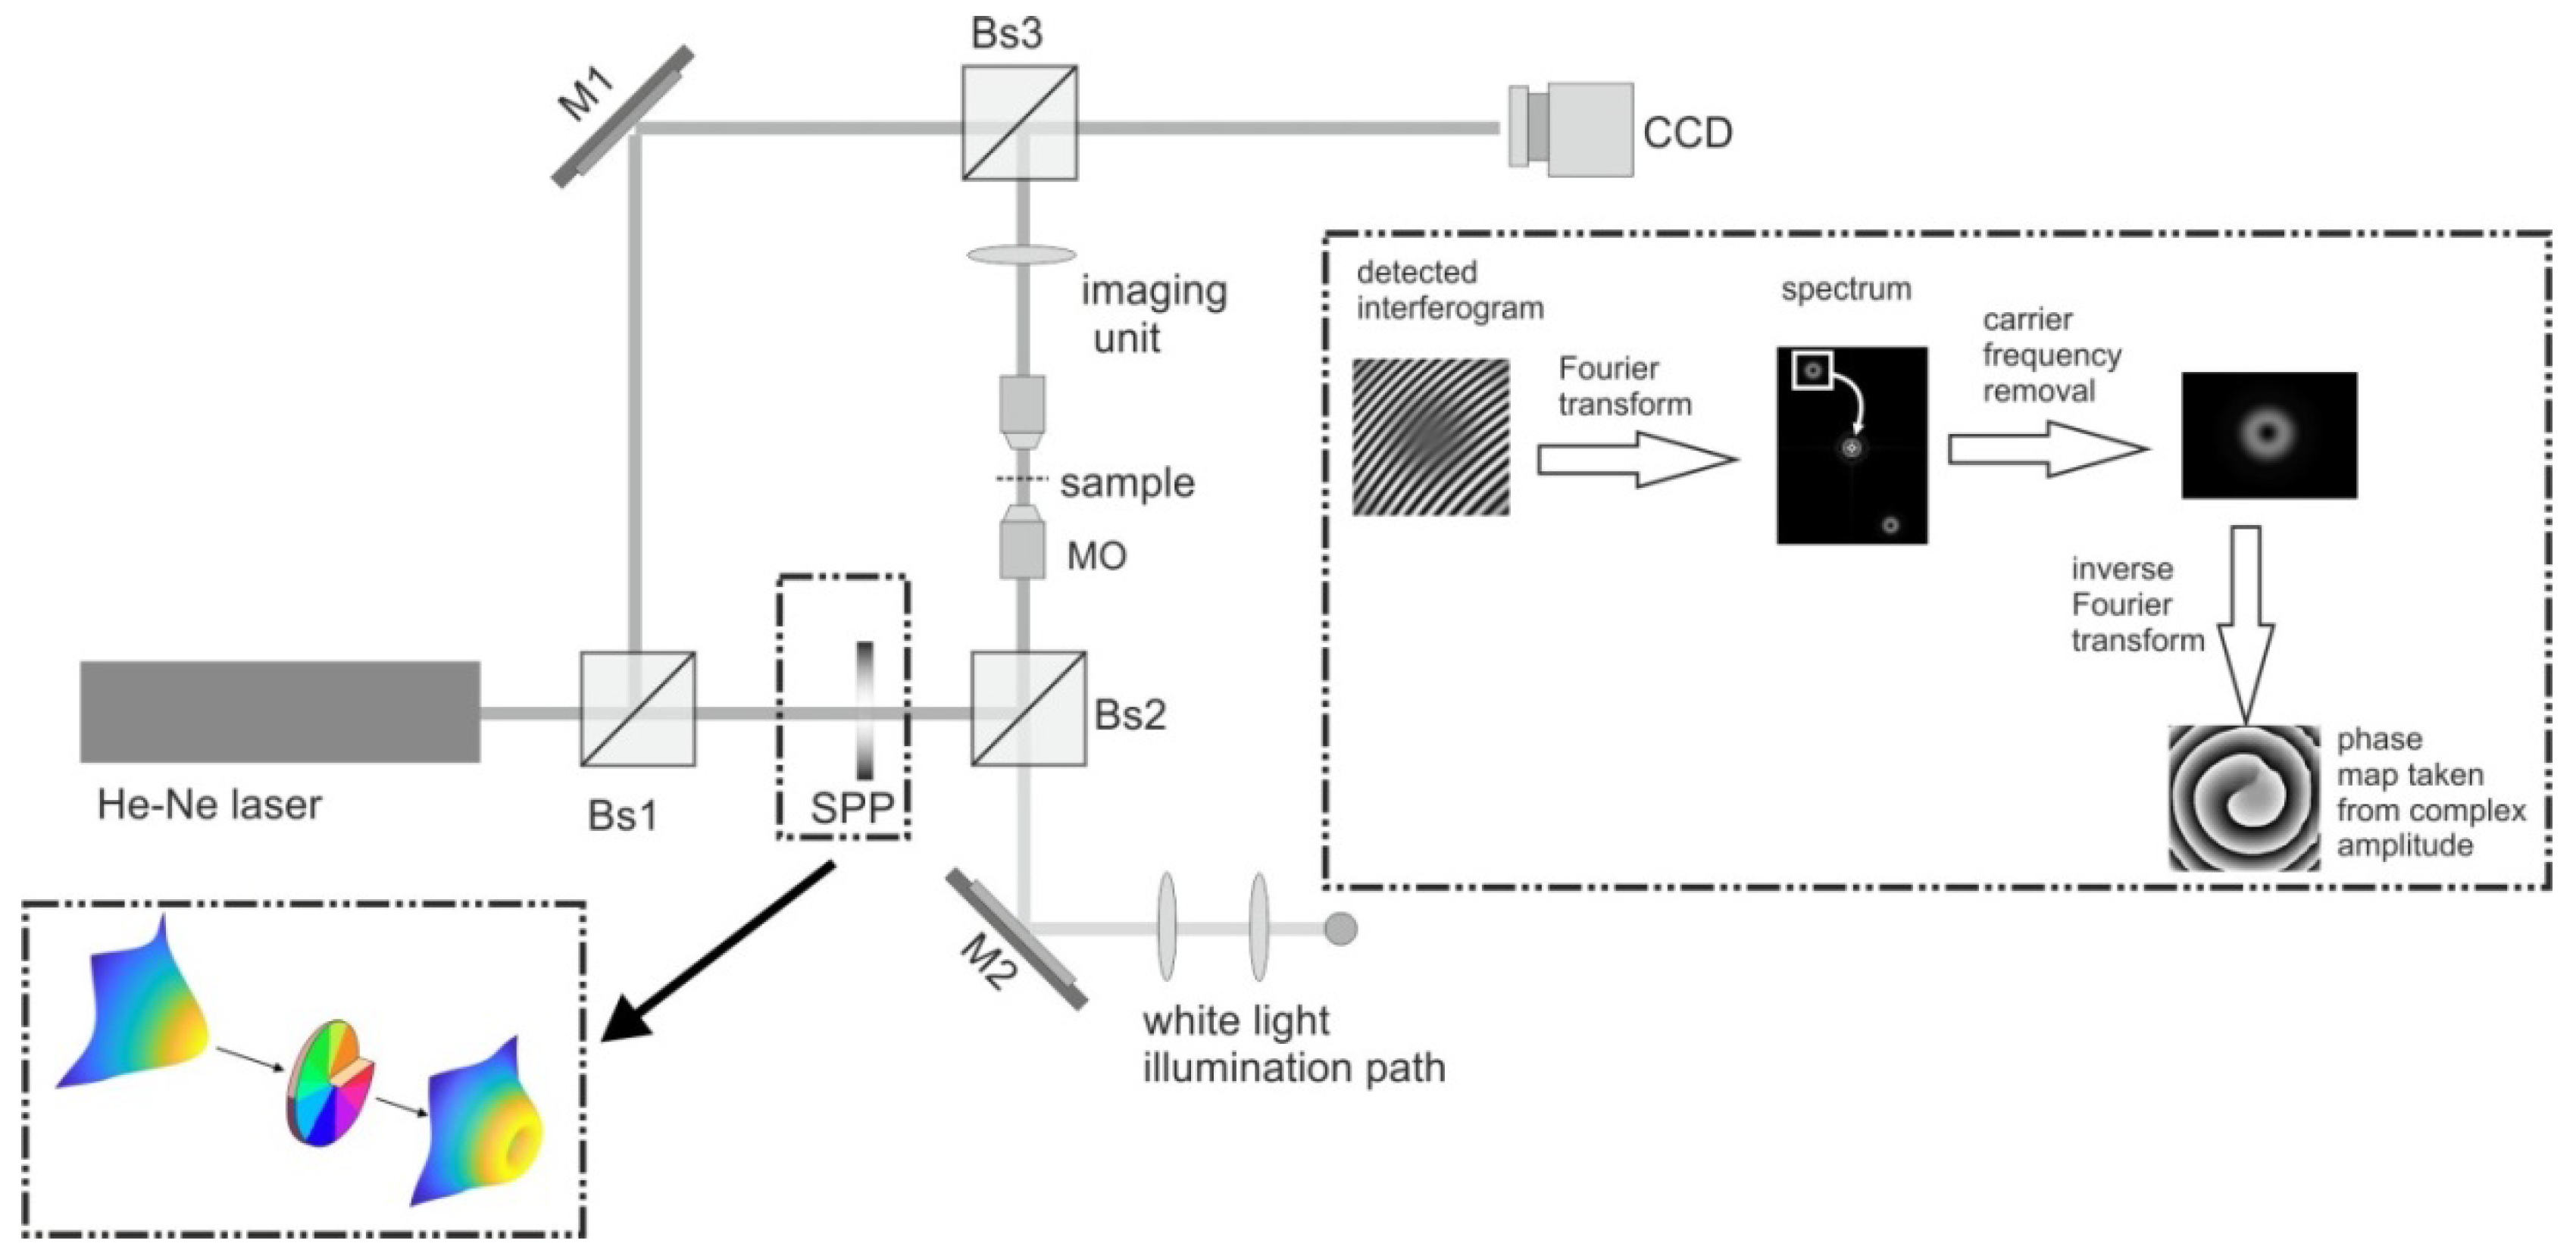
Figure 9 shows the scheme of the experimental setup of the optical vortex scanning microscope [
17]. In the object arm of the interferometer, the Gaussian beam from the He-Ne laser (λ = 0.633 μm) passes through the spiral phase plate (SPP) which introduces helical wavefront into the beam [
18]. Then, this beam is focused by the microscope objective (×20, NA = 0.4) into the sample plane. The spot size of the vortex beam reveals a donut shape (see
Figure 9) and its size can be described by the bright ring diameter, which in our case was about 2.8 μm. Through the imaging system (NA = 0.4, magnification 200×) a spot was imaged on the CCD camera and its size has been enlarged to about 0.6 mm. The object beam, together with the reference beam, creates on the CCD, the interferogram. When the vortex is present in the beam, the interference fringes split forming the characteristic fork pattern.
The standard Fourier technique [
19] was applied to recover the phase of the object beam. To do this, the Fourier transform is applied to the detected interferogram. In its spectrum, the first order is extracted and shifted to zero order position to remove the carrier frequency. Next, the inverse Fourier transform is applied. This recovers the complex amplitude of the detected beam, in which phase distribution is coded.
Figure 10a displays the exemplary phase maps of the central part of the vortex beam obtained from the experiment.
Figure 10b plots the polar coordinates of the localized 2π phase jump line (points) together with the fitted line of the equation.
Figure 10c compares the fitted Fermat’s spiral (circles) with the experimental points (crosses). Values of coefficients, fitted with 95% confidence bounds, are equal to
and
.
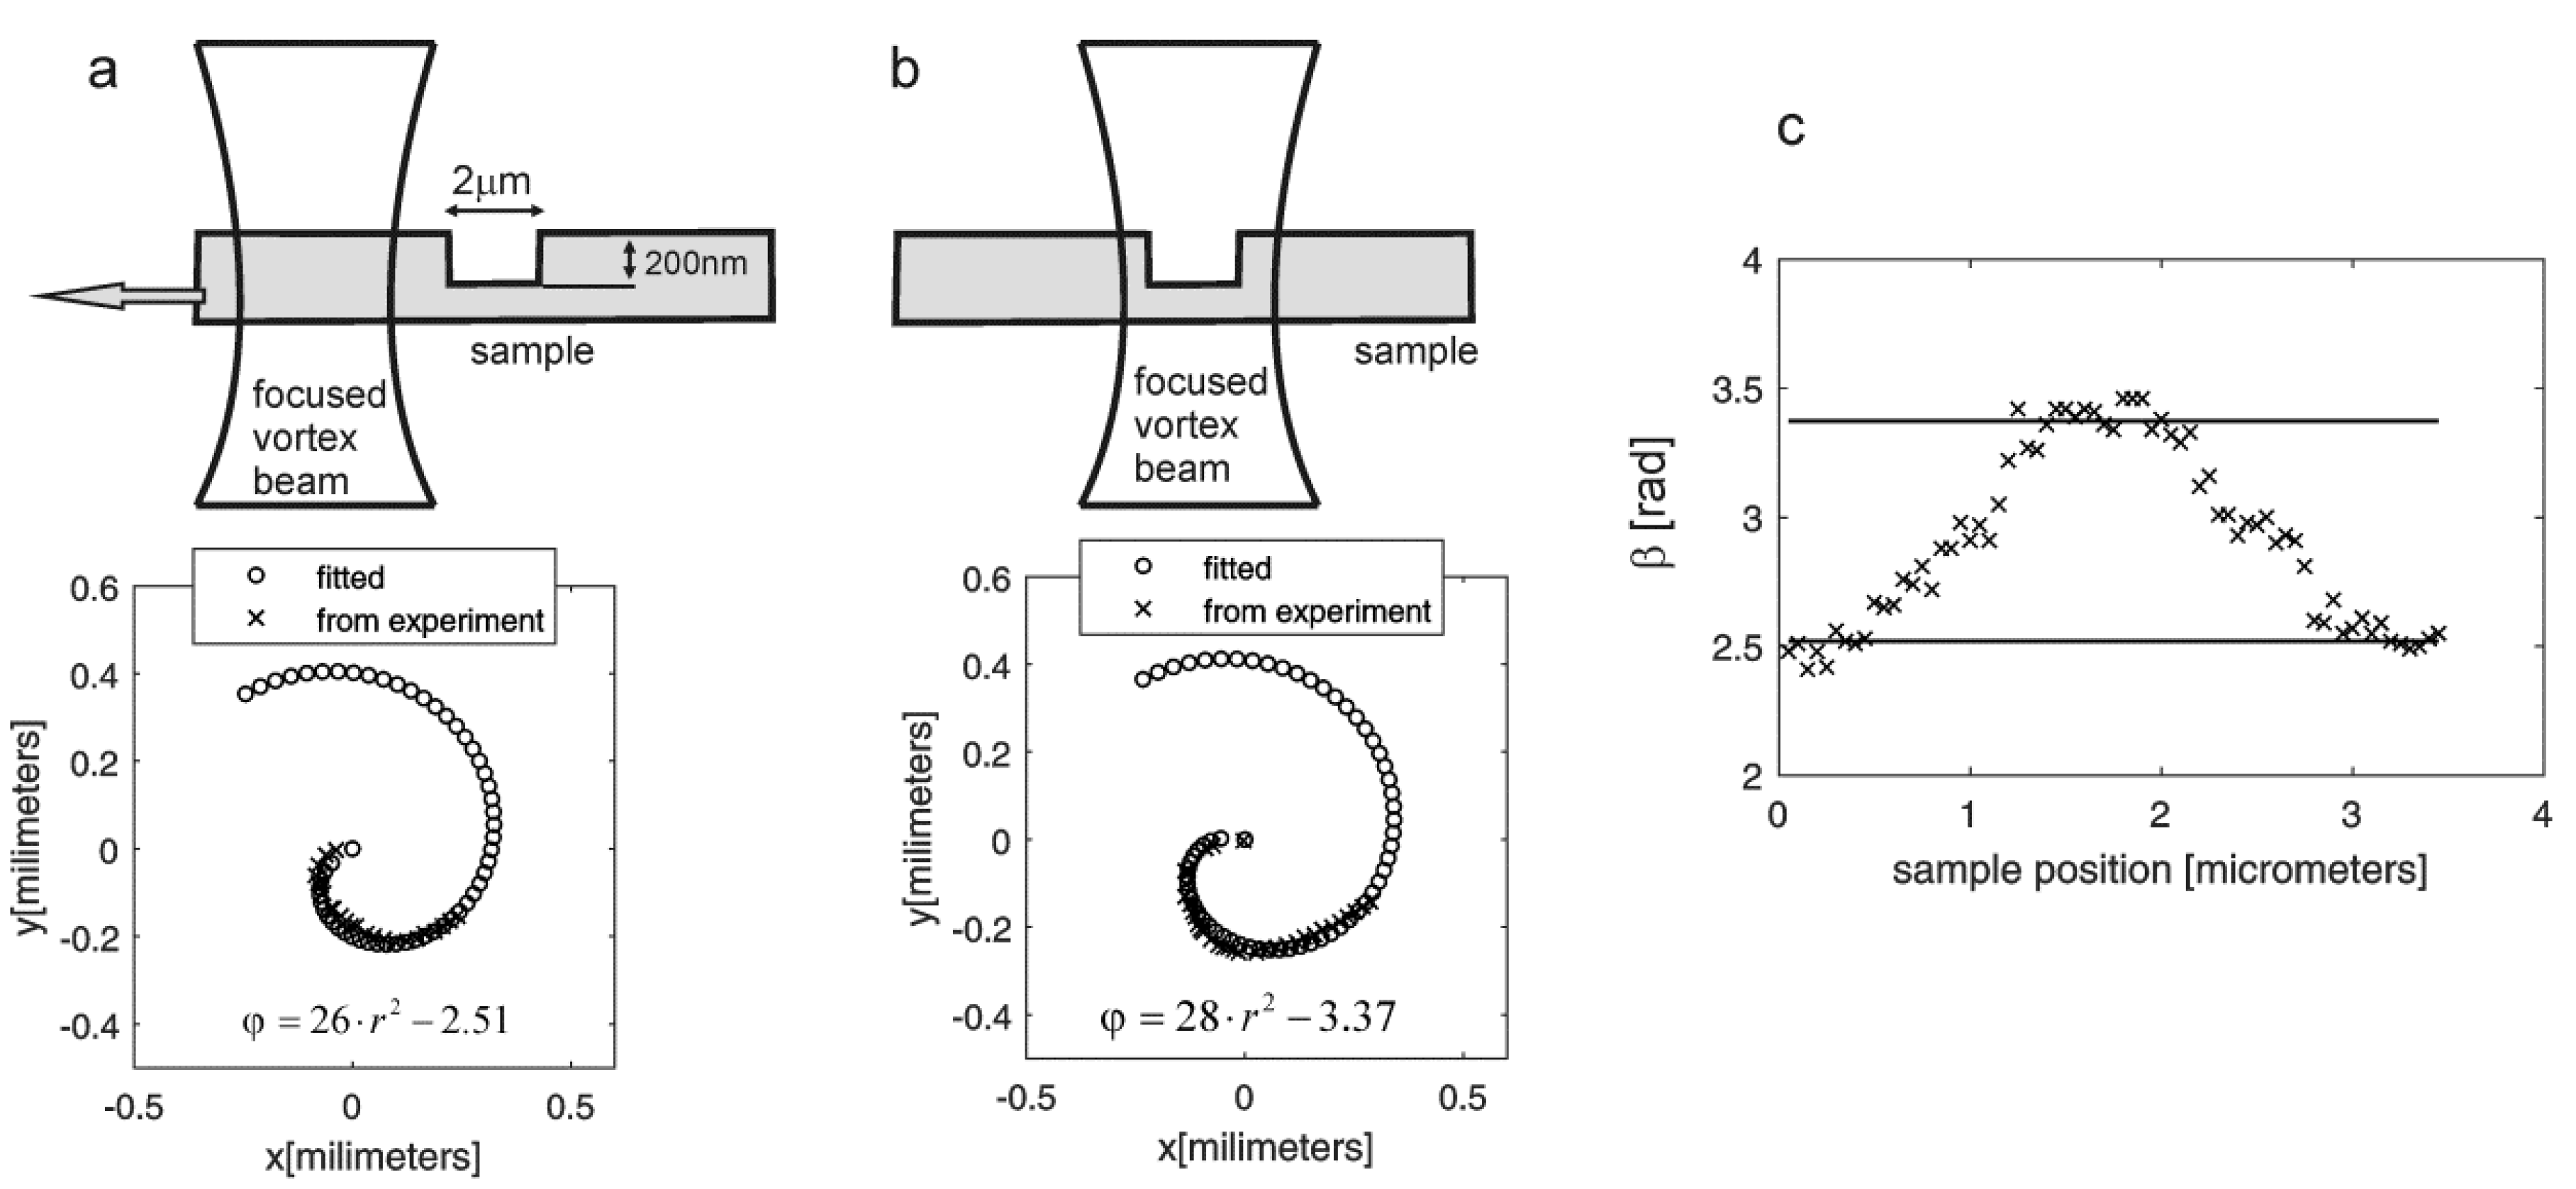
To demonstrate how this vortex beam description can be used in optical measurement, the phase sample is introduced into the object beam (at a sample plane). When the vortex beam passes through the transparent sample, its phase distribution changes. As was mentioned in the preceding section, in the case of uniform phase change within the whole beam, the phase profile rotates, manifesting the rotation of the spiral and this rotation can be read from the parameter β. In our experiment, the tiny, transparent sample had the shape of the square step of high 200 nm and size 2 μm. As the sample transverse dimensions were a little bit smaller than the vortex beam diameter and because it was hard to localize it perfectly in the beam center, it was mounted on the motorized XYZ table in order to position the sample with nanometer precision. The sample was shifted gradually with the step 0.05 μm. When the step was within the beam, the additional phase shift equal to
(
h is the step height equal 200 nm in our case, sample was a PMMA resist applied to the saphire substrates,
n ≅ 1.48) was expected, which should cause rotation of the spiral by the amount of Δ
ϕ, as was explained in the previous section.
Figure 11 shows the idea of the experiment and obtained results. For each sample position, the interferogram was detected, phase map recovered, and parameters of Fermat’s spiral fitted (
Figure 11a,b).
Figure 11c shows the change of the fitted value β while the sample was moved across the beam. The reference phase value (in the case where the step was outside the beam) was calculated for a sequence of measurements and equaled 2.51 ± 0.15 rad (uncertainty was evaluated on the base of the series of measurements taken when the object was outside the vortex beam). While the phase object was gradually moved through the vortex beam, the spiral was rotated and β reached the mean value 3.37 ± 0.15 rad when the whole phase step was inside the beam. Therefore, the spiral rotated by an angle of 0.86 ± 0.15 rad, which corresponded well with the value expected from object geometry.
5. Conclusions
We proposed a new method for characterizing a vortex beam with a topological charge of one and higher. We focused on the phase distribution and showed that its contour lines could be described by a Fermat’s spiral in the case of the LG beam. In addition, we showed that the same could be done for the central part of the phase profile of the Gaussian beam passing through SPP. Fermat’s spiral equation was expressed by two parameters, which could be assigned to the physical characteristics of the beam-radius of the wavefront curvature and the phase orientation. We proposed and tested a procedure for fitting the spiral equation to the phase maps of a vortex beam. The procedure consisted of three main stages. In the first step, a characteristic line assigned to the 2π phase jump was extracted from the phase map, in our case with the help of the Roberts method for edge detection. Next, the found points were arranged in the order of increasing values of radial radii and azimuth angles. In the third step, a nonlinear least squares method without normalization was used in order to fit extracted points into the spiral equation. This procedure worked well for numerical, as well as for experimental data.
To demonstrate the possible application of this way of beam characterization, we showed, that the spiral rotated in response to the transparent object by the angle equal to the introduced phase shift and one of the spiral parameters could read this rotation. We showed in [
11] that the accuracy of the recovered phase shift using OV could be very high because optical vortex could be treated as a single fringe surrounding the singular point, and in such geometry, rotation could be determined with high precision. If the phase disturbance is not uniform within the beam, then the phase undergoes local changes, deforming somehow the ideal Fermat’s spiral, which happens when LG beams are generated, for example, by SLM. Some methods of SLM correction have used vortex structure as a template. Distorted vortex has been compared with an ideal one [
20,
21]. In another work [
22], deformation from the ideal vortex was used for determining misalignment. Thus, the description of the ideal overall phase distribution gives a new set of tools in data analysis. We can treat it as a kind of reference profile against which wavefront deformation could be determined. We plan to use this idea in our further work. In our experimental part, we considered only m = 1 case, as higher order vortices are very unstable structures and split into a constellation of single-charged vortices [
8,
23]. Further research is needed to show their utility in experimental conditions.


