Article

Hyperspectral Imaging Bioinspired by Chromatic Blur Vision in Color Blind Animals

1
Ocean College, Zhejiang University, Zhoushan 316021, China
2
Shanghai Institute of Spaceflight Control Technology, Shanghai 201109, China
*
Author to whom correspondence should be addressed.
Photonics 2019, 6(3), 91; https://doi.org/10.3390/photonics6030091
Submission received: 3 July 2019 / Revised: 2 August 2019 / Accepted: 9 August 2019 / Published: 12 August 2019

Abstract

:
Hyperspectral imaging remote sensing is mutually restricted in terms of spatial and spectral resolutions, signal-to-noise ratio and exposure time. To deal with this trade-off properly, it is beneficial for imaging systems to have high light flux. In this paper, we put forward a novel hyperspectral imaging method with high light flux bioinspired by chromatic blur vision in color blind animals. We designed a camera lens with high degree of longitudinal chromatic aberration, a monochrome image sensor captured the chromatic blur images at different focal lengths. Finally, by using the known point spread functions of the chromatic blur imaging system, we process these chromatically blurred images by deconvolution based on singular value decomposition inverse filtering, and the spectral images of a target were restored. We constructed three different targets for validating image restoration based on a typical octopus eyeball imaging system. The results show that the proposed imaging method can effectively extract spectral images from the chromatically blurred images. This study can facilitate development of a novel bionic hyperspectral imaging, which may benefit from the high light flux of a large aperture and provide higher detection sensitivity.

1. Introduction

Hyperspectral imaging is a combination of imaging and spectroscopy technologies, which is a collection of narrowband or spectrally continuous image data obtained in the ultraviolet, visible, near-infrared, and infrared wavelength bands. Image and spectral information can be extracted simultaneously from the imaging spectrum. Thus, the imaging spectrum can not only be used for target recognition, but also for substance identification and analysis. Hyperspectral imaging is mainly applied in the field of remote sensing [1,2,3], including geological exploration, crops and vegetation observation, meteorological observation, atmospheric and ocean monitoring, military target detection, etc. The continuous development of hyperspectral imaging technology has also enabled its use in other fields, including biomedical [4], food analysis [5], etc.
The main spectroscopic methods of hyperspectral imaging can be classified in four modes according to the dispersion components: filter, prism/grating, tunable filter, and Fourier transform interferometer. Currently, among these modes, the most commonly used are prism/grating dispersion and interference. Because the optical radiation energy of an object in a single narrowband is very low, hyperspectral imaging are mutually restricted in terms of spatial resolution, spectral resolution, signal-to-noise ratio (SNR), and exposure time especially in the remote sensing applications [6]. In addition, the slit component limits the light flux, which is an important component of prism/grating spectrometer. Time-modulated interferometric imaging spectroscopy has high energy utilization rate and high spatial resolution, but hyperspectral resolution takes longer modulation time. Therefore, we believe that it is beneficial to shorten the modulation/acquisition time as much as possible under the premise of high light flux.
In this paper, we propose a novel bionic hyperspectral imaging method inspired by the chromatic blur vision in marine cephalopods color blind animals. We used three type of targets and simulate the spectrum for different colors. Based on the eyeball model constructed by Stubbs et al. [7], we first obtained chromatically blurred images under different accommodations. Next, a deconvolution method was used to deal with these blurred images, thereby restoring the spectral images at each wavelength band. We theoretically validate the feasibility of this hyperspectral imaging method and proposed the corresponding conceptual scheme of imaging system design.

2. Materials and Methods

All the objects data and the computer codes used to generate the results presented in this section are available on GitHub at https://github.com/maxu0808/chromatic-bulrred-images-restoration. Documentation on how to use the codes to reproduce the results is also included therein.

2.1. Eyeball Model

Marine cephalopods including octopus, squids, and cuttlefish sense their surrounding environments and change their skin color to ensure camouflage. However, modern scientific studies indicate that only one type of photoreceptor exists in the retina of these animals, which are classified as color blind animals [8,9,10]. Although these animals exhibit color blindness, they can perceive color. Existing studies further indicate that these “color blind camouflage” animals even possess spectral recognition capabilities [11,12,13]. Several studies had put forward some probable explanations [7], but the definite mechanism of visual perception in the “color blind camouflage” animals has not been revealed to date.
Jagger et al. [14] measured the optical properties of the eyeball of an octopus and showed that its optical system had a high degree of longitudinal chromatic aberration. With respect to a photographic imaging system with large imaging chromatic aberrations, the resulting images typically exhibit varying degrees of blur. Stubbs et al. [7] further found that the semi-annular off-axis pupil or large circular pupil of the octopus can cause a high lateral chromatic aberration. Under the premise that the lens has a certain longitudinal chromatic aberration at the same retinal position, higher lateral chromatic aberration will occur with a semicircular off-axis pupil than a small on-axis circular pupil, such as the pupil of a human eye, thereby further aggravating the degree of image blur.
As compared to the human lens, the octopus lens has a better spherical symmetry and its refractive index gradually decreases from the center of sphere to the surface [15,16]. Although geometric aberrations such as spherical aberrations can be corrected due to these optical properties, high longitudinal chromatic aberrations still exist. In addition, due to the low illuminance of the underwater environment, these animals have larger pupil apertures for obtaining higher light flux. A large pupil aperture with a high longitudinal chromatic aberration lens generates a high lateral chromatic aberration on the retina, thus resulting in a blurry vision. The octopus lens can move back and forth in the axial direction, leading to a variable accommodation from the lens to the retina, which is similar to camera focusing. However, due to the rich and continuous spectral composition of radiation from natural objects, the vision is always blurred in any accommodation under the high chromatic aberration lens.
The optical model of a chromatic blur imaging system based on a typical octopus eyeball with a lens diameter of 10 mm, pupil diameter of 8 mm, and a focal length of 12 mm under 550 nm light is shown in Figure 1a. To facilitate the subsequent numerical calculations, we set the focal length of the 550 nm light as the zero position. The approximate relationship between different light wavelengths and the focal length shift is shown in Figure 1b and represented in Equation (1) [14]:
Δ f ( λ ) = ( 5.4676 × 10 7 λ 2 + 7.94 × 10 4 λ 0.271047 ) × f 550 n m ,
where the units of the focal length shift Δf and the wavelength λ are mm and μm, respectively. Only one type of photoreceptor exists in the retina of these animals, the spectral response range of the photoreceptor (or opsin) is approximately 350–600 nm, which has been studied by Chung [17]. The response curve of the opsin is shown in Figure 1c. Single photoreceptor size on the detection plane is about 5 μm × 5 μm. The octopus lens can move back and forth in a small range along the optical axis direction, leading to a variable accommodation from the lens to the retina, but in order to facilitate the corresponding focal length shift in the optical model, we fixed the lens position and make the retinal position movable. The retina acts as a monochrome image sensor, when the detection plane is in a specific position, the image of a point object of different radiation wavelengths at the distance of infinity exhibits different degrees of dispersion, diagrammatic drawing of the images can be seen in Figure 1d.
Through contrast analysis of chromatic blur images, spectral discrimination can be obtained under certain conditions, which is a probable perception mechanism of chromatic blur vision in color blind animals [7]. Inspired by the studies of Stubbs et al., we believe that the chromatic blur can be used to form a hyperspectral imaging technology. Correspondingly there are a variety of deconvolution-based image processing methods can be used to process these defocused images to restore spectral images. In order to be comparable with Stubbs et al.’s contrast methods and results, we simulated chromatically blurred images on this eyeball optical model imaging system, and validate the feasibility and effectiveness of deconvolution method. A design scheme of the chromatic blur imaging system based on a monochrome camera is discussed in Section 3.4.

2.2. Chromatically Blurred Images

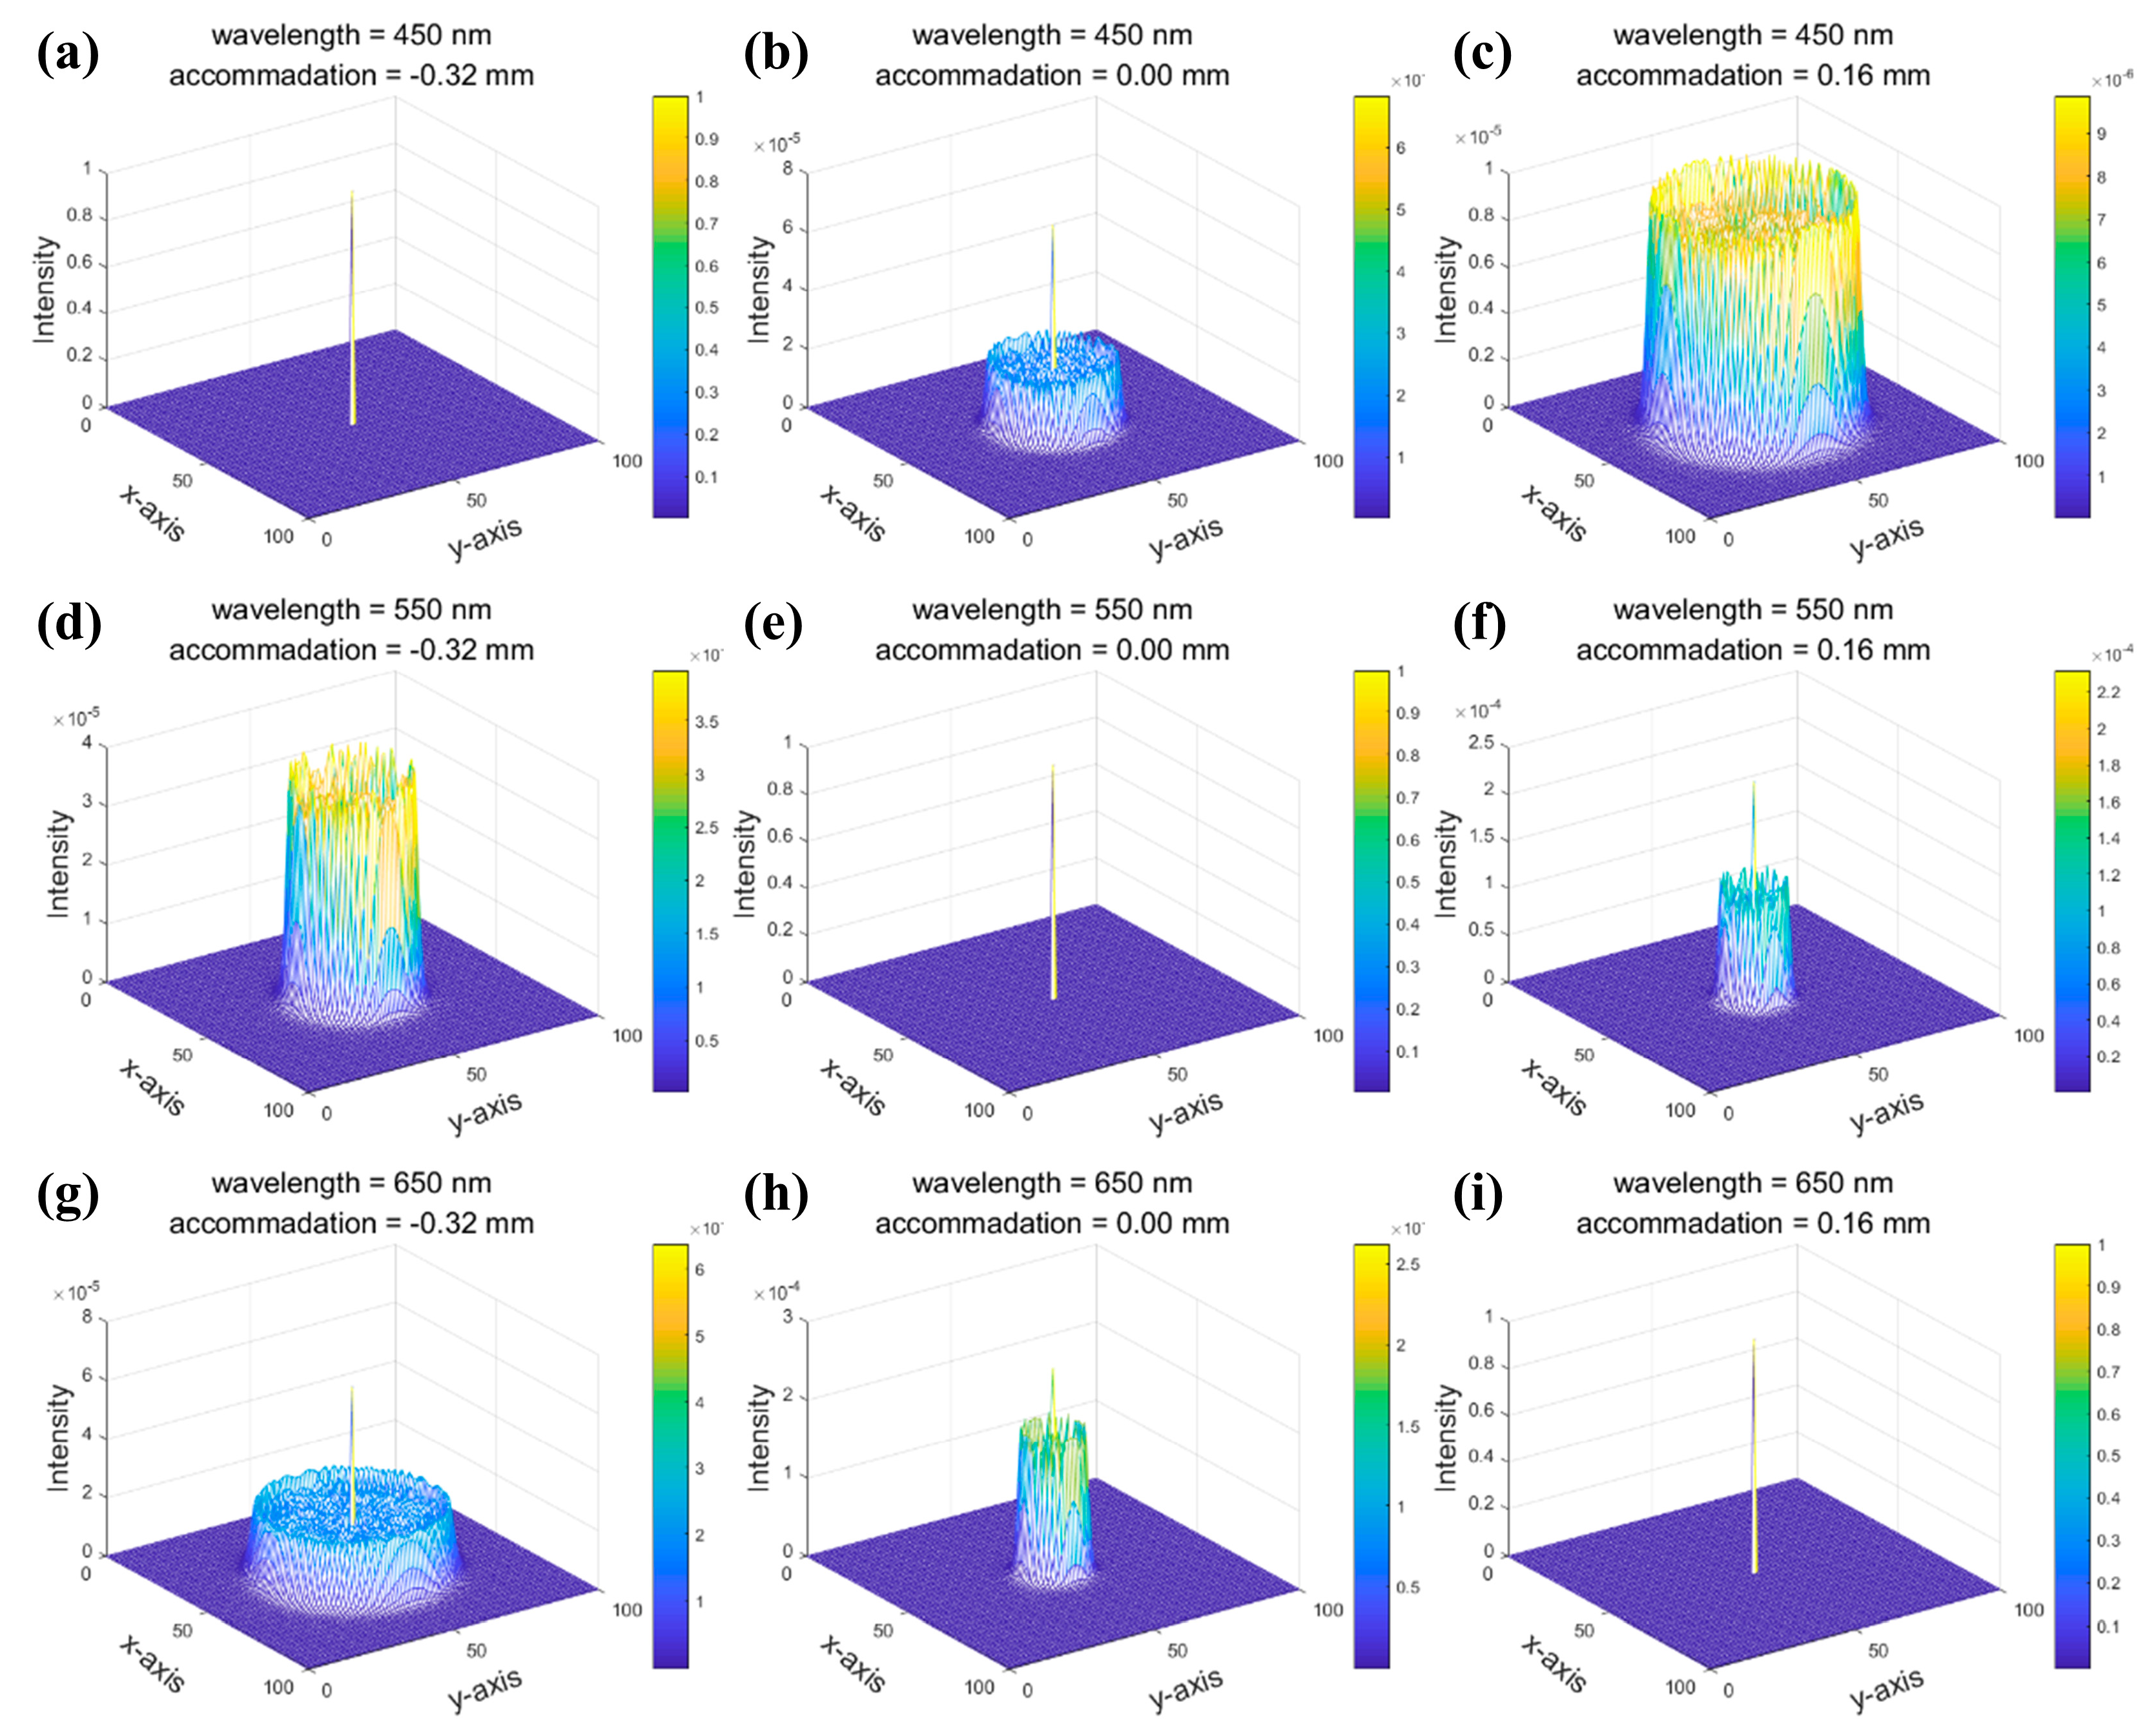
The convolution of a scene and the point spread function (PSF) of the imaging optical system results in the formation of an image. For an ideal imaging system without aberration, the PSF is an impulse response function, which implies that the beam is perfectly focused on the detection plane. However, the chromatic blur imaging system has high chromatic aberration and variable detection plane, so its PSF varies with the light wavelength and longitudinal position of detection plane. We calculated the three-dimensional optical field distribution of the monochromatic point source through the imaging system to obtain the PSFs [18], shown in Figure 2. Under focused conditions, the PSF is the impulse response, whereas in other cases, it is the dispersion spot of varying degrees.
If the target radiation spectrum and imaging system PSFs are determined, the images at different detection plane positions can be obtained through convolution and superposition, given by
I ( Δ f ) = λ 1 λ n O ( λ ) P S F ( Δ f , λ ) × R ( λ ) ,
where If) is the chromatically blurred image obtained by the detection plane under the focal length shift Δf, O(λ) is the target spectral image, PSF(f, λ) is the PSF of the light wavelength λ and imaging plane at f, ‘⊗‘ is the convolution operator, and R(λ) is the spectral response of the photoreceptor. As to the octopus’s vision, R(λ) is the opsin response, i.e., Figure 1c, as to a camera imaging system, R(λ) is the quantum efficiency of photodetectors. As this paper mainly validates the effectiveness of image deconvolution in the wavelength range of 400–700 nm, the spectral response is considered uniform at each wavelength in the following calculation, i.e., R(λ) is set to 1.
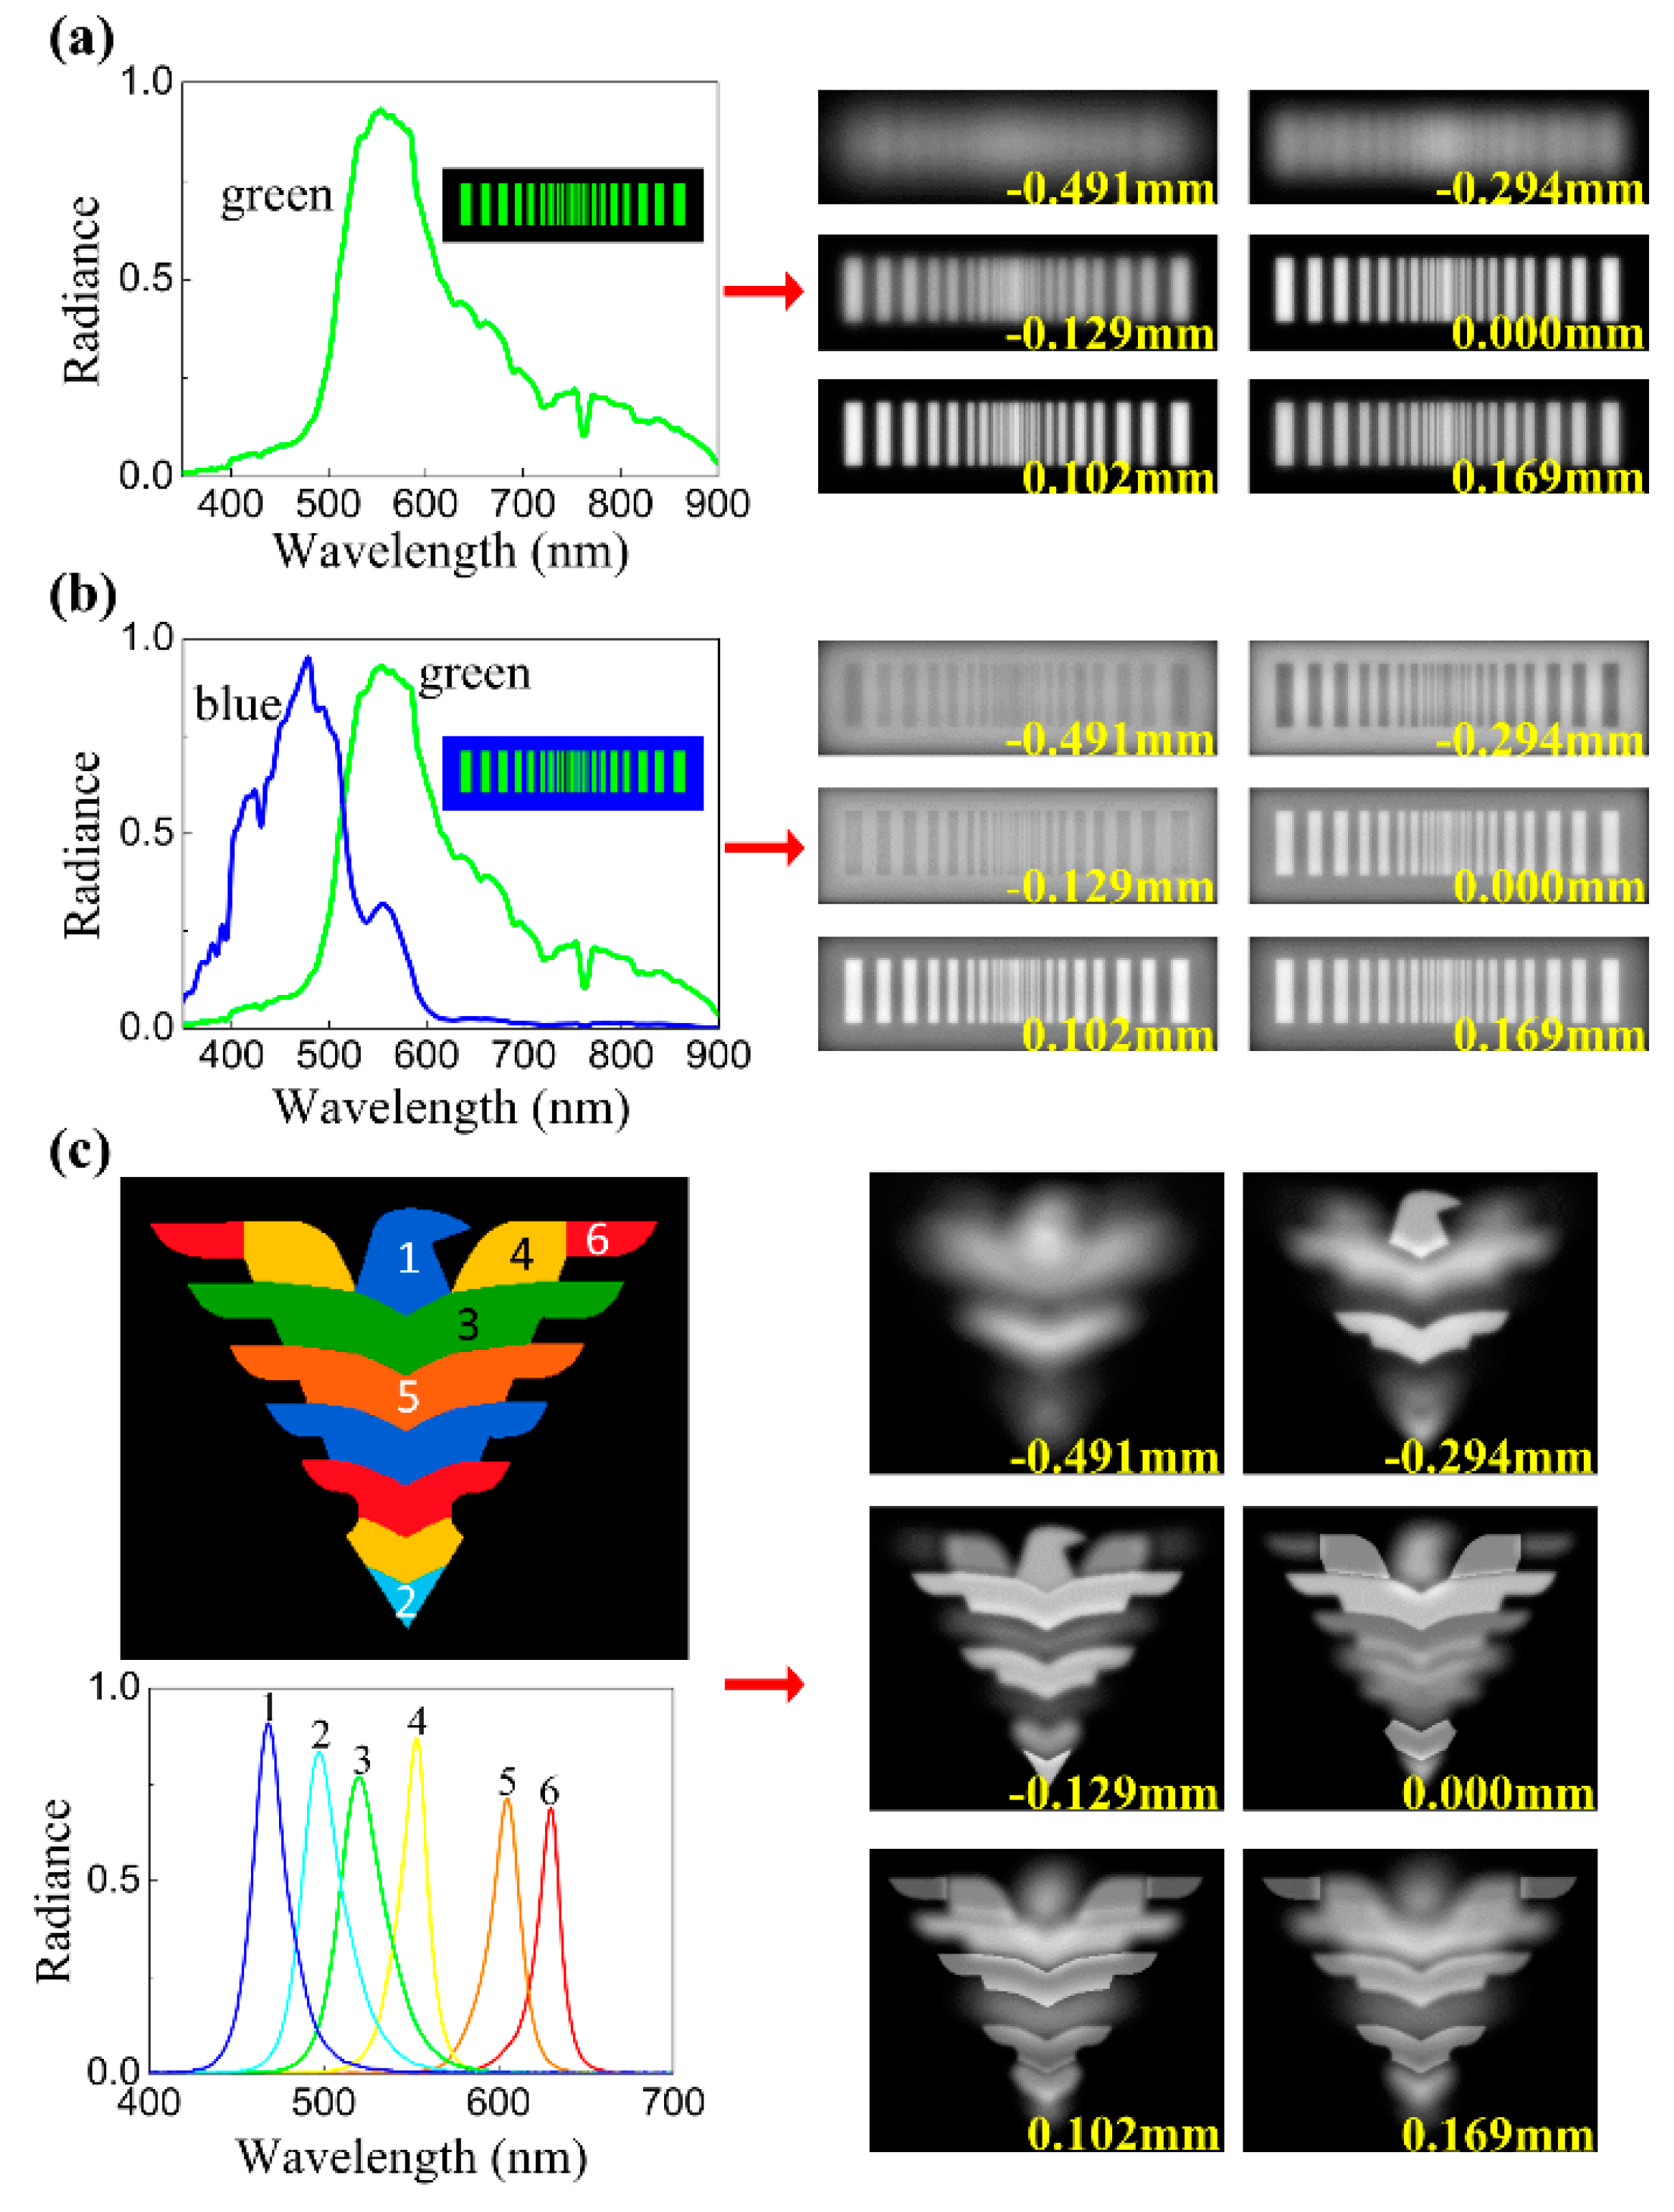
We constructed three types of targets as shown in Figure 3. The first target consists of green stripes with a black background and the second target consists of green stripes with a blue background. Australian reef fish reflectance spectra are assigned to the green and blue colors. The third target is the logo of Zhejiang University (ZJU) displaying six colors. The LEDs emission spectra were assigned to each of the colors. When all the pixels of the target have been assigned with the spectral information, the spectral images (spectral image cube) O(λ) of the target can be acquired, which is also the goal of image restoration from chromatically blurred images.
We used the aforementioned PSFs of the chromatic blur imaging system and target-image mathematical relationship given in Equation (2) to calculate and obtain a total of sixty-one chromatic blurred images at different detection plane positions. The different detection plane positions are set to the position giving the best focus at different wavelengths. The wavelength range is set to 400–700 nm and the wavelength interval is 5 nm, as shown in Figure 3.

2.3. Deconvolution-Based Image Restoration

The chromatically blurred images are the result of convolution of the target radiation and the PSF of imaging system. Therefore, the spectral images, i.e., the target radiation in each band can be recovered by deconvolution. However, deconvolution is an inverse problem, which is inherently ill-posed. Therefore, if the PSF is known, certain deconvolution image restoration methods can achieve a reasonable spectral image restoration. Common and effective deconvolution image restoration methods are Tikhonov regularization inverse filtering, singular value decomposition (SVD) inverse filtering, and Jansson–Van Citter (JVC) iteration, which are often used for sliced image restoration from defocused microscopy images [19,20,21].
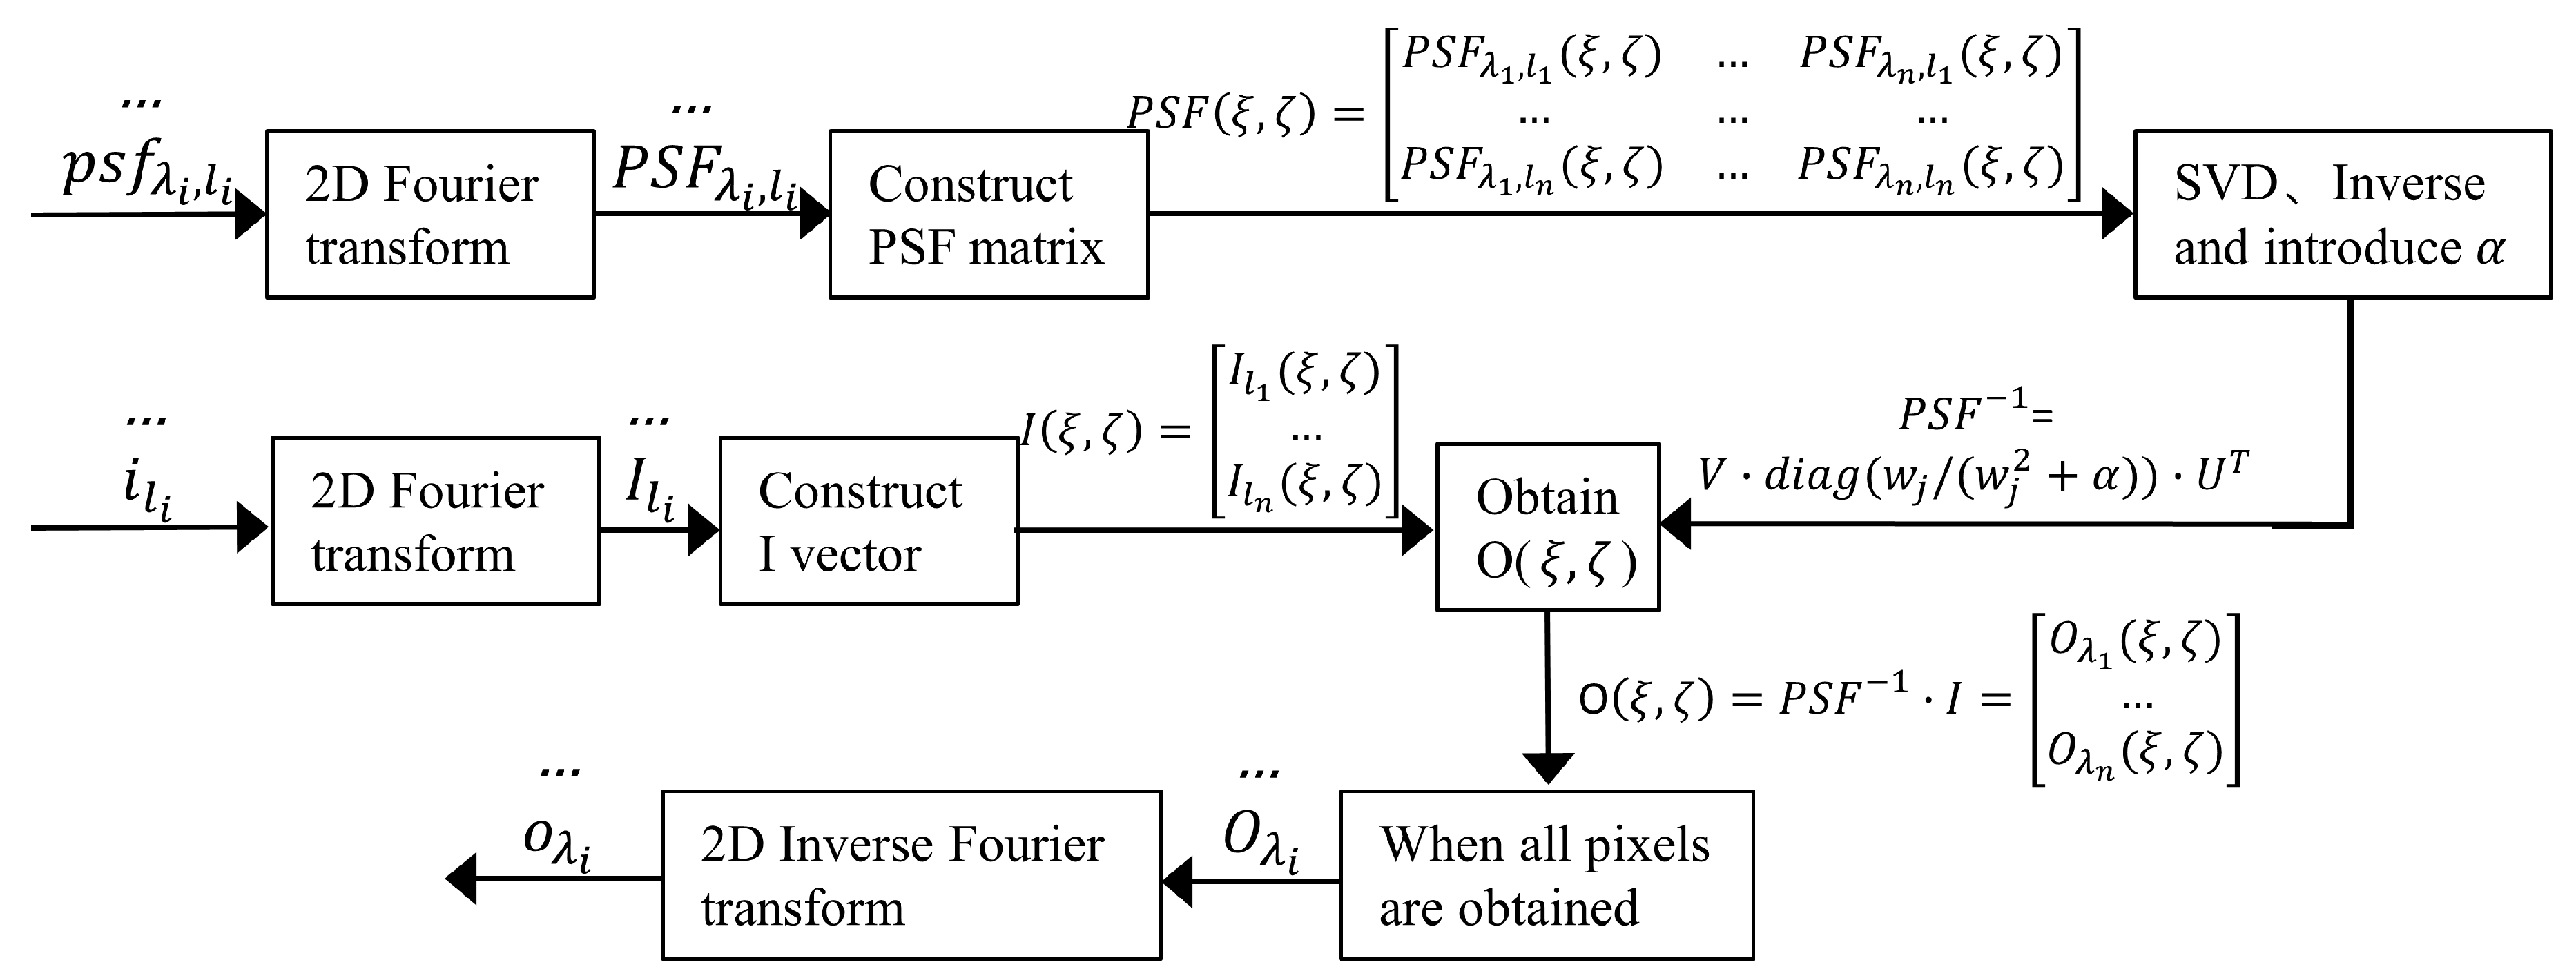
In this paper, we used the SVD inverse filtering combined with the known PSFs to process the blurred images. We used MATLAB for the SVD inverse filtering processing. We inputted blurred images under different accommodations into the algorithm together with all PSFs, then restored the spectral images under different bands pixel by pixel. The flow chart of the processing algorithm is shown in Figure 4. The main steps involved in this processing are as follows:
  • Firstly, perform 2D Fourier transform for all blurred images and PSFs.
  • To obtain the values of the restored images at the pixel point (ξ, ζ), we construct the matrix PSF(ξ, ζ) and the vector I(ξ, ζ) based on the PSFs and blurred images in the frequency domain which are obtained in the first step.
  • Then, SVD of PSF(ξ, ζ) are carried out, followed by the inverse calculation of the PSF(ξ, ζ) in the frequency domain using the singular values and vectors.
  • To avoid the occurrence of zero values in the singular values of the PSFs to affect the image restoration results, we introduce a regularization factor α into the singular values. The regularization factor should be adjusted according to imaging noise by mean square error (MSE) evaluation criterion: the optimal factor is obtained when the MSE is at a minimum. In this study, we set the regularization factor α as 1.0 × 10⁻⁷.
  • Next, multiply the inverse matrix of PSF(ξ, η) by I(ξ, ζ) to obtain the frequency values of the restored images at the pixel point (ξ, ζ).
  • Repeat steps 2–5 until all pixels of the restored images have been computed. Finally, we perform 2D inverse Fourier transform on the frequency restored images to obtain the final spatial restored images.

3. Results and Discussion

In this section, we show the spectral images restored using the proposed method. We discussed the performance of the method and compare it with an existing method proposed by Stubbs et al. In addition, we also produced a video to demonstrate the methods and results of hyperspectral imaging bioinspired by chromatic blur vision in color blind animals, as showed in Video S1.

3.1. Spectral Discrimination and Spatial Resolution

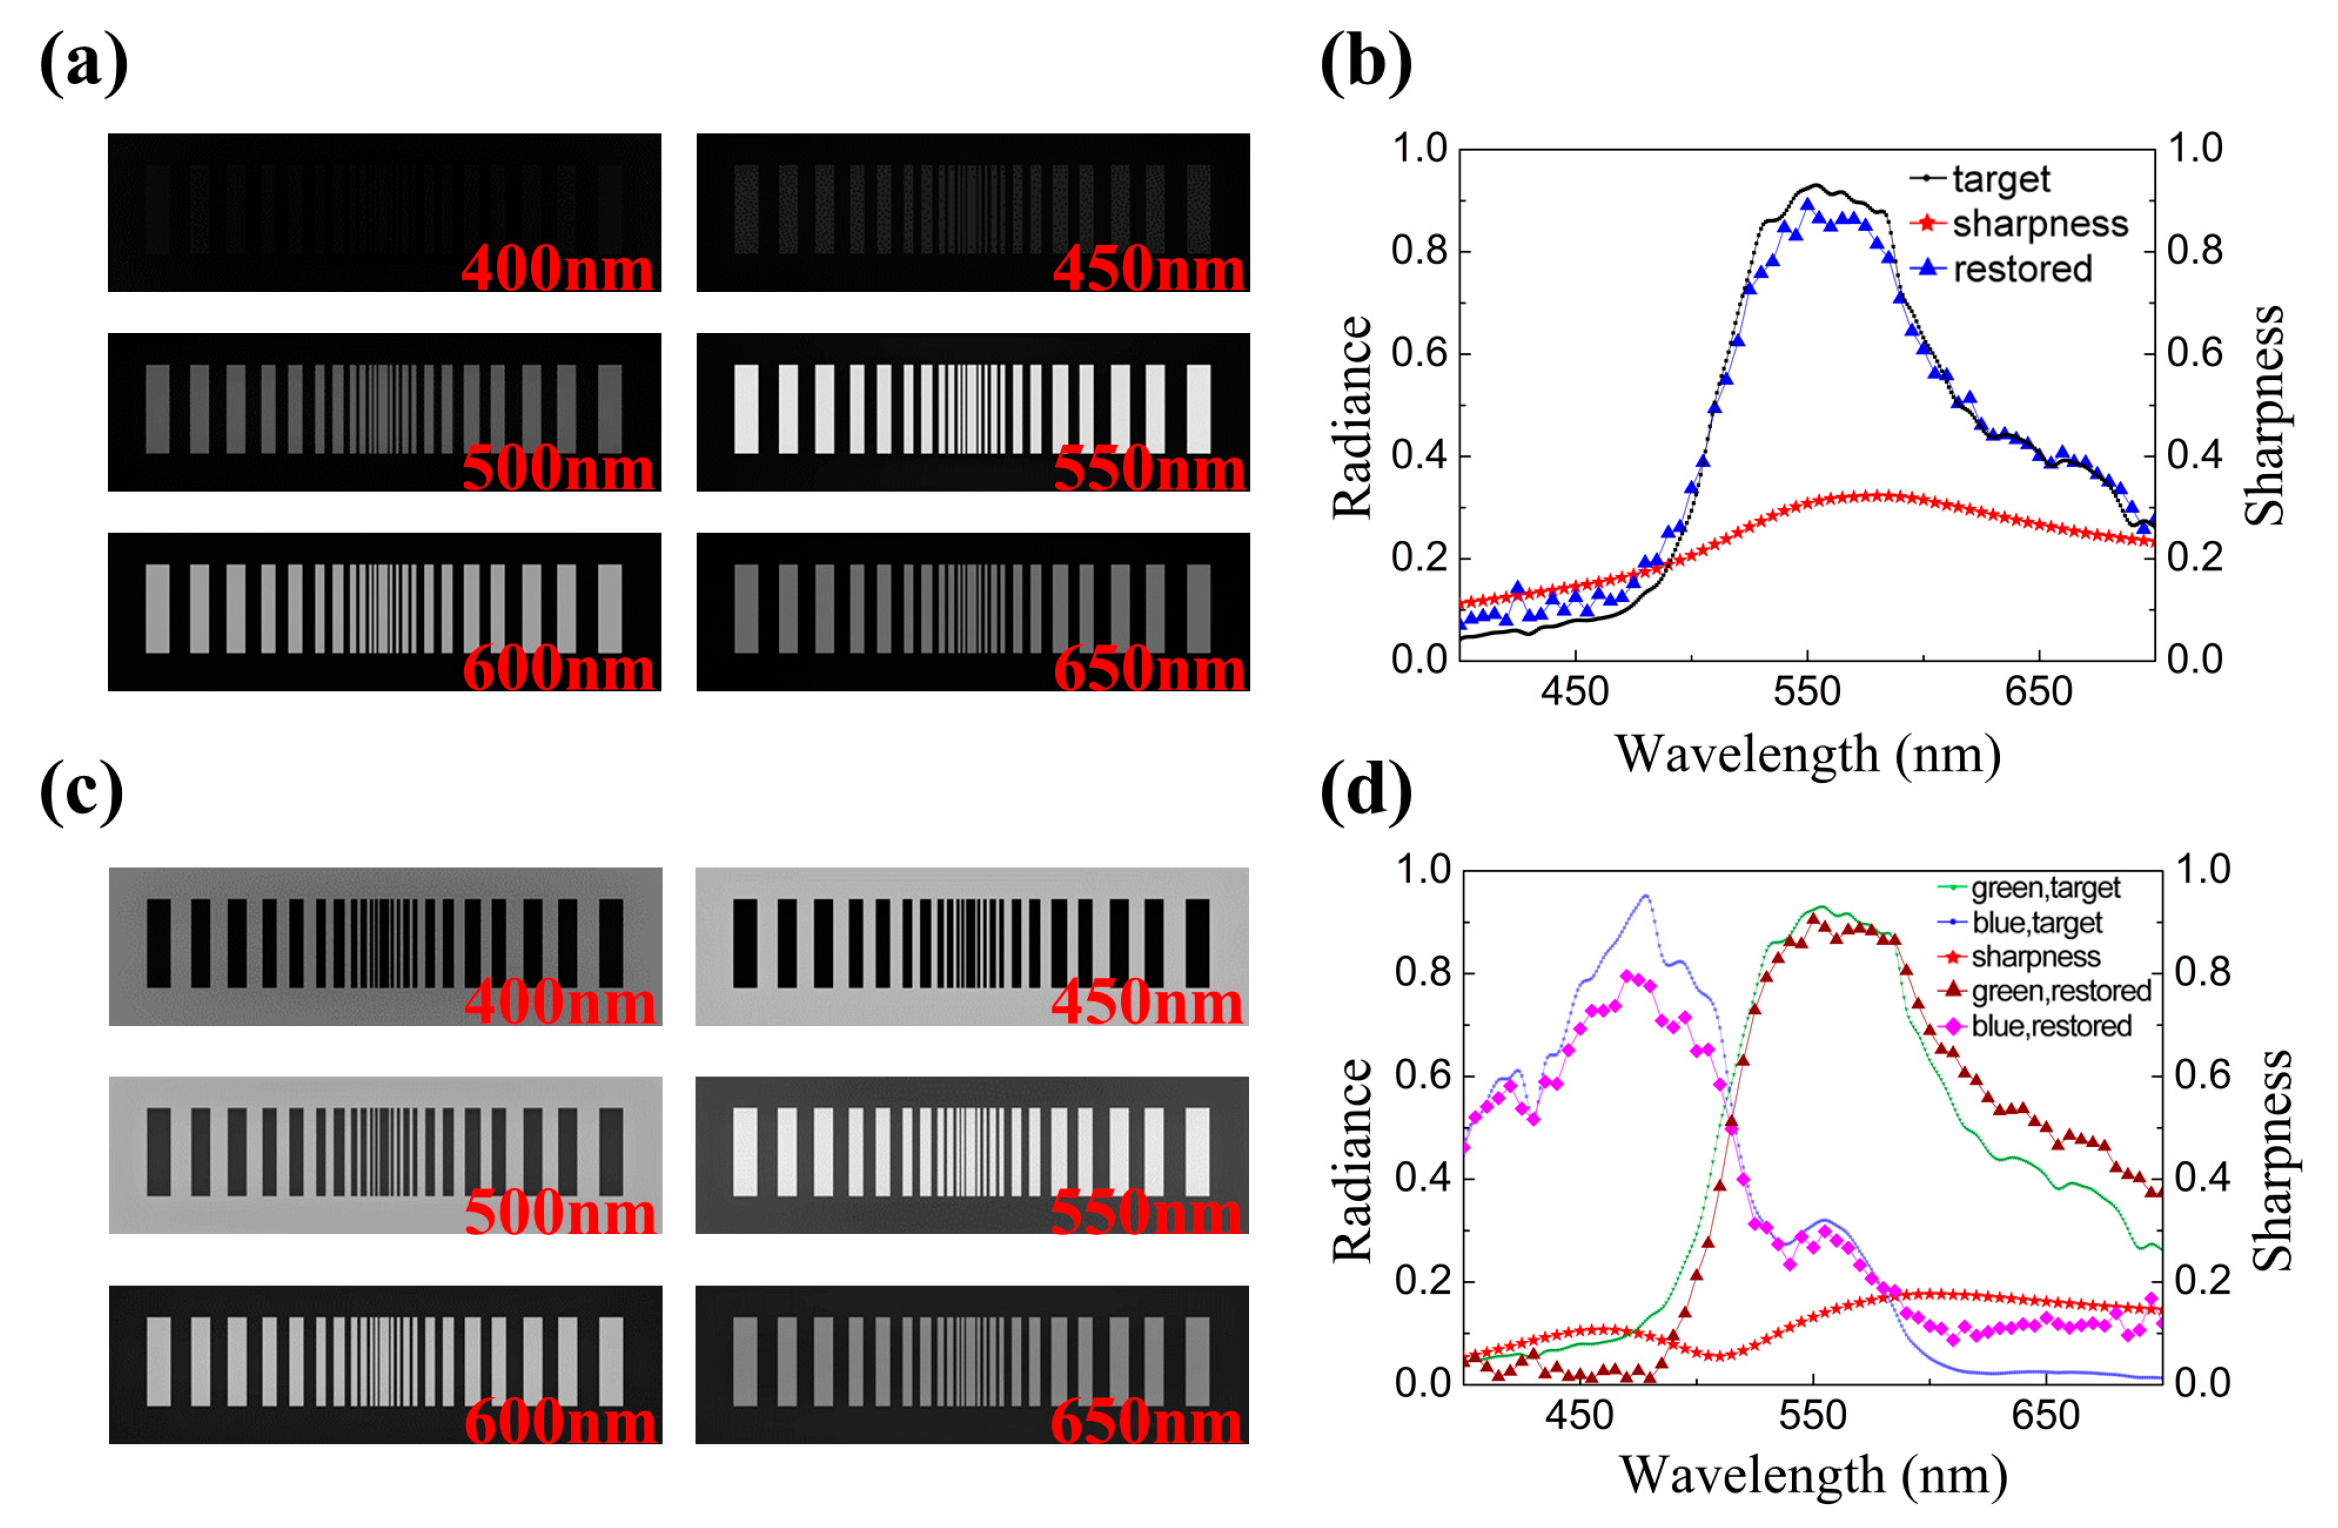
The restored spectral images of the two striped targets obtained by the SVD inverse filtering method are shown in Figure 5a,c. The striped pattern is restored to a clear shape and is no longer blurred, which is a considerable improvement over the chromatically blurred images shown in Figure 3. The spectral curve of a region can be obtained by selecting the same area from the sixty-one restored spectral images and averaging the pixel intensity of each area, thereby validating the effectiveness of the image restoration algorithm. As shown in Figure 5b,d, the restored spectral curves can reflect the main features of the target spectra.
According to Stubbs et al. [7], the octopus perceives the spectrum based on a contrast method. In that method, the contrast between stripes and background of total blurred images at different accommodations is obtained by adjusting the lens–retina spacing. Figure 5b,d illustrate the image sharpness curves obtained by contrast method, which show that although the sharpness curve reflects the spectrum to a certain extent, it has significantly low radiance values. Additionally, the contrast method relies on the spatial difference of the object spectrum. Therefore, it is impossible to analyze a flat-field background and difficult to process a small area in a target. Furthermore, it is not possible to recover clear images and obtain a high spatial resolution.
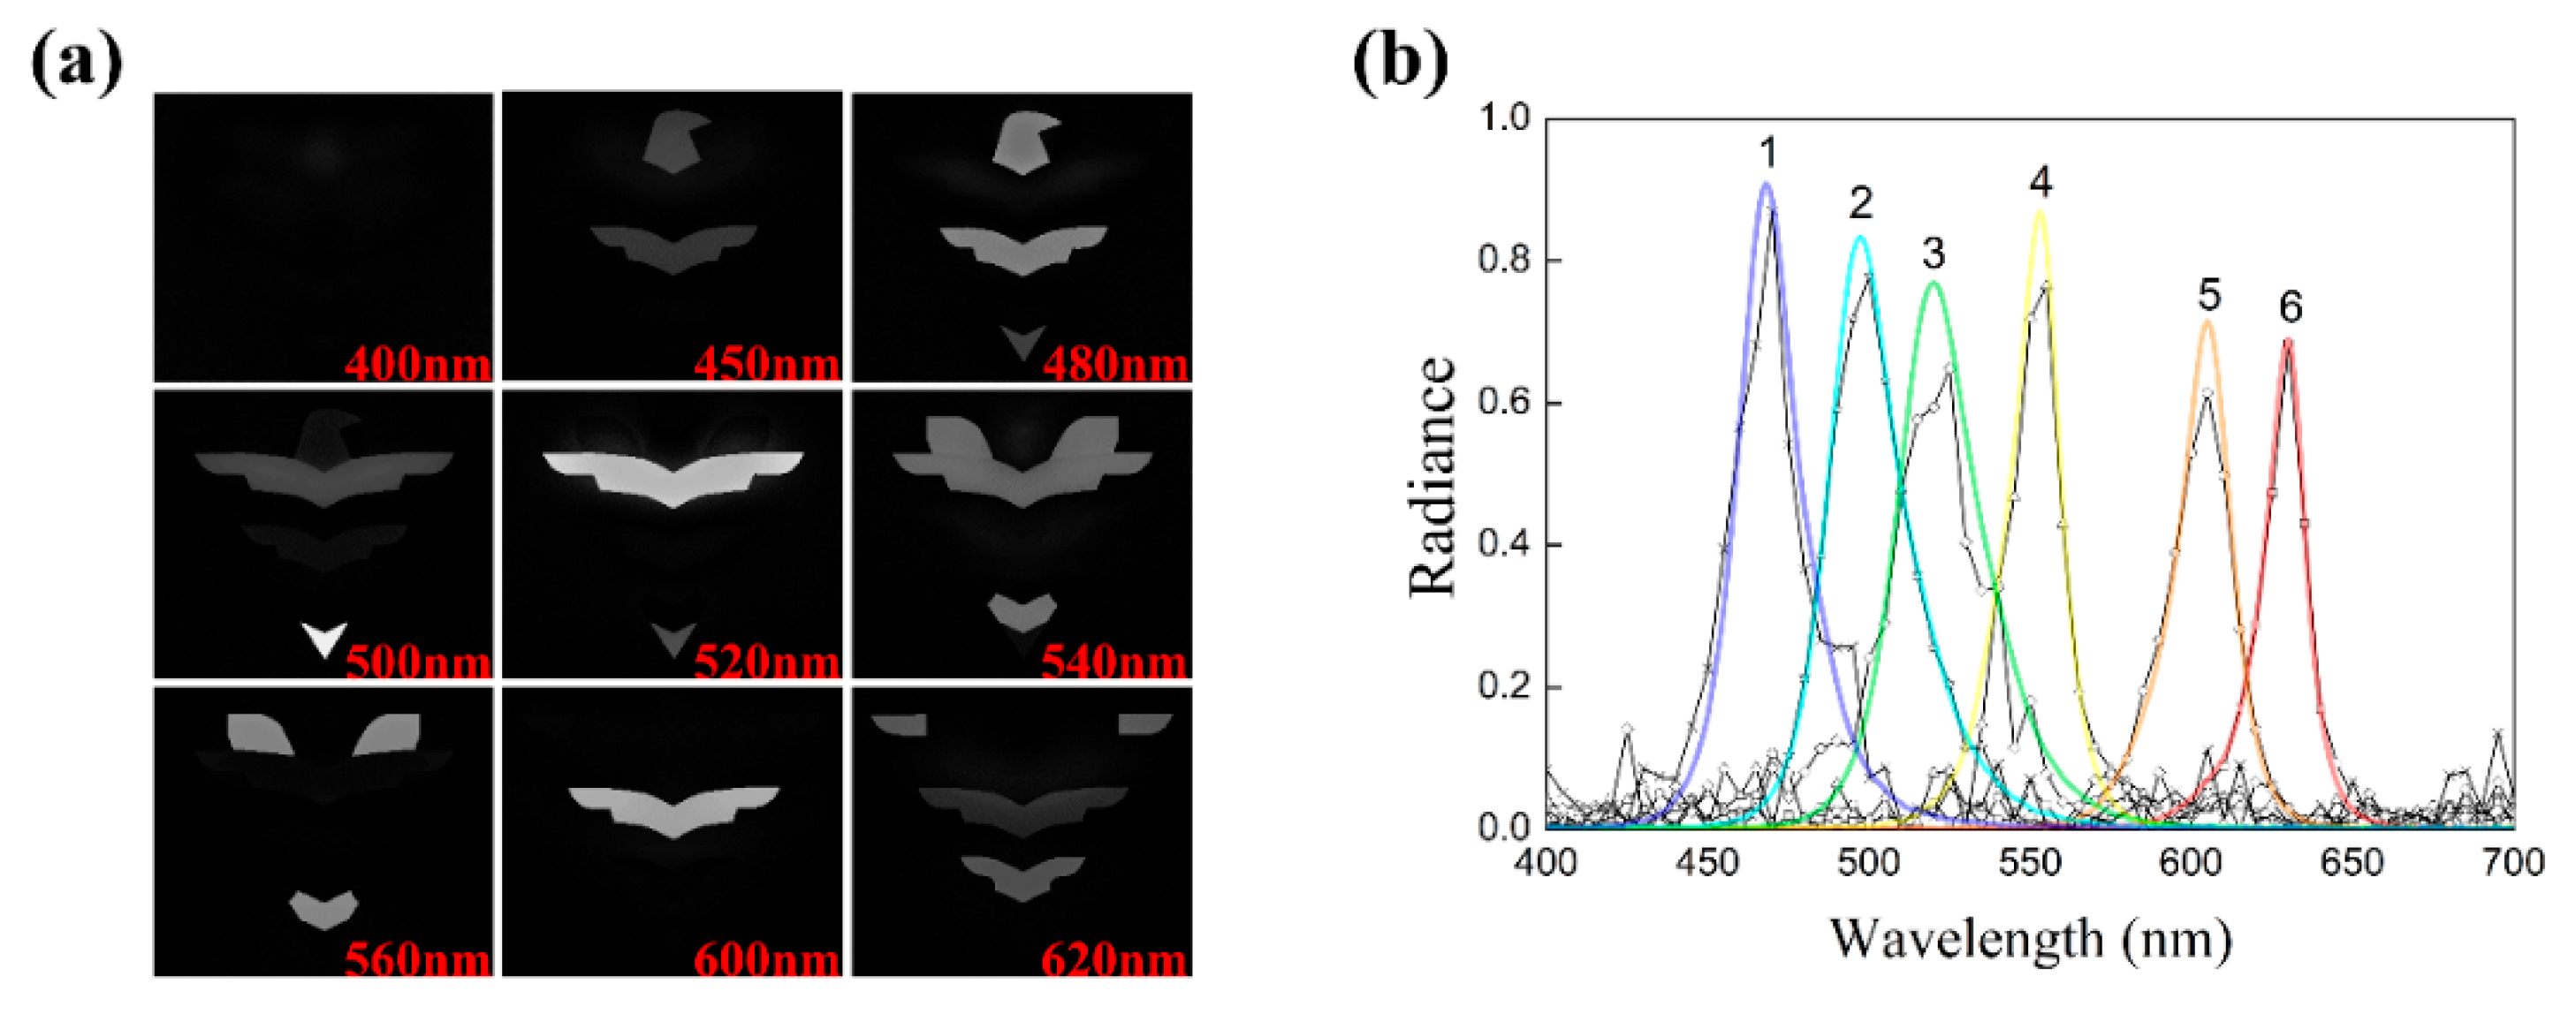
The restored spectral images of the ZJU logo target obtained by the SVD inverse filtering method are shown in Figure 6a, the restoration method is identical to that detailed above. It is observed that the image restoration method obtains clear spectral images. The six selected ROIs are shown in Figure 3c, and the number-labeled positions are approximately the ROIs. As a result, the spectral curve of each region can be obtained by selecting the same area from the sixty-one restored spectral images and averaging the pixel intensity of each area. As shown in Figure 6b, the restored spectral curves of the ROIs and the target spectra match well.

3.2. Errors in the Restored Images

As shown in Figure 5b,d, there are differences between the restored and target spectra. MSE is a global quantitative estimation of restoration and target approximation. A smaller MSE indicates a smaller deviation from the target, and it is the most basic evaluation criterion for image restoration performance. The average MSE values of the restored images of the two striped targets with identical morphology are 0.002083 and 0.006882, which indicates that the green-spectrum and blue-spectrum of the second striped target will interfere with each other in the image processing, consequently affecting the accuracy of image restoration. The MSE of the restored images can be reduced to some extent by adjusting the regularization factor. Furthermore, the average peak signal-to-noise ratio (PSNR) values of the restored images of the two striped targets are 27.4 and 21.8 dB, respectively.
The restoration results of the ZJU logo target are better than the two striped targets, the average MSE value is 0.00038, and the average PSNR value is 34.2 dB. As shown in Figure 6b, the restored spectra of ROI number 1, 2, 4, and 6 coincide well with the target spectra. These regions have dark backgrounds and are mostly unaffected by other regions, as can be observed in Figure 3c. However, the restored spectra of ROI number 3 and 5 have errors at the wavelength of 520 nm and 605 nm, because these regions are affected by different color regions around it.
In addition, the number of chromatically blurred images generated at different detection plane positions is 61 frames in this paper, which meets the requirement of spectral image restoration of sixty-one wavelength bands. If the number of restored wavelength bands does not increase, the error in the restored images can be reduced by increasing the number of chromatically blurred images captured at different detection plane positions.

3.3. Target Distance

In this paper, the target is assumed to be at an infinite distance. However, considering an imaging system, the focus position of imaging plane is also related to the target distance, especially at close range. For example, a target of wavelength 450 nm at 0.4 m and a target of wavelength 550 nm at 4 m have the same focal length, and it is impossible to distinguish the two targets. Stubbs et al. state that when the target distance is greater than 0.75 m [7], the contrast-spectrum perception of chromatically blurred images will not be significantly disturbed by the target distance in an octopus’ vision. The bioinspired imaging spectroscopy method proposed in this paper is also affected by target distance at close range; however, remote sensing applications are not affected by target distance.

3.4. Chromatic Lens and Imaging System

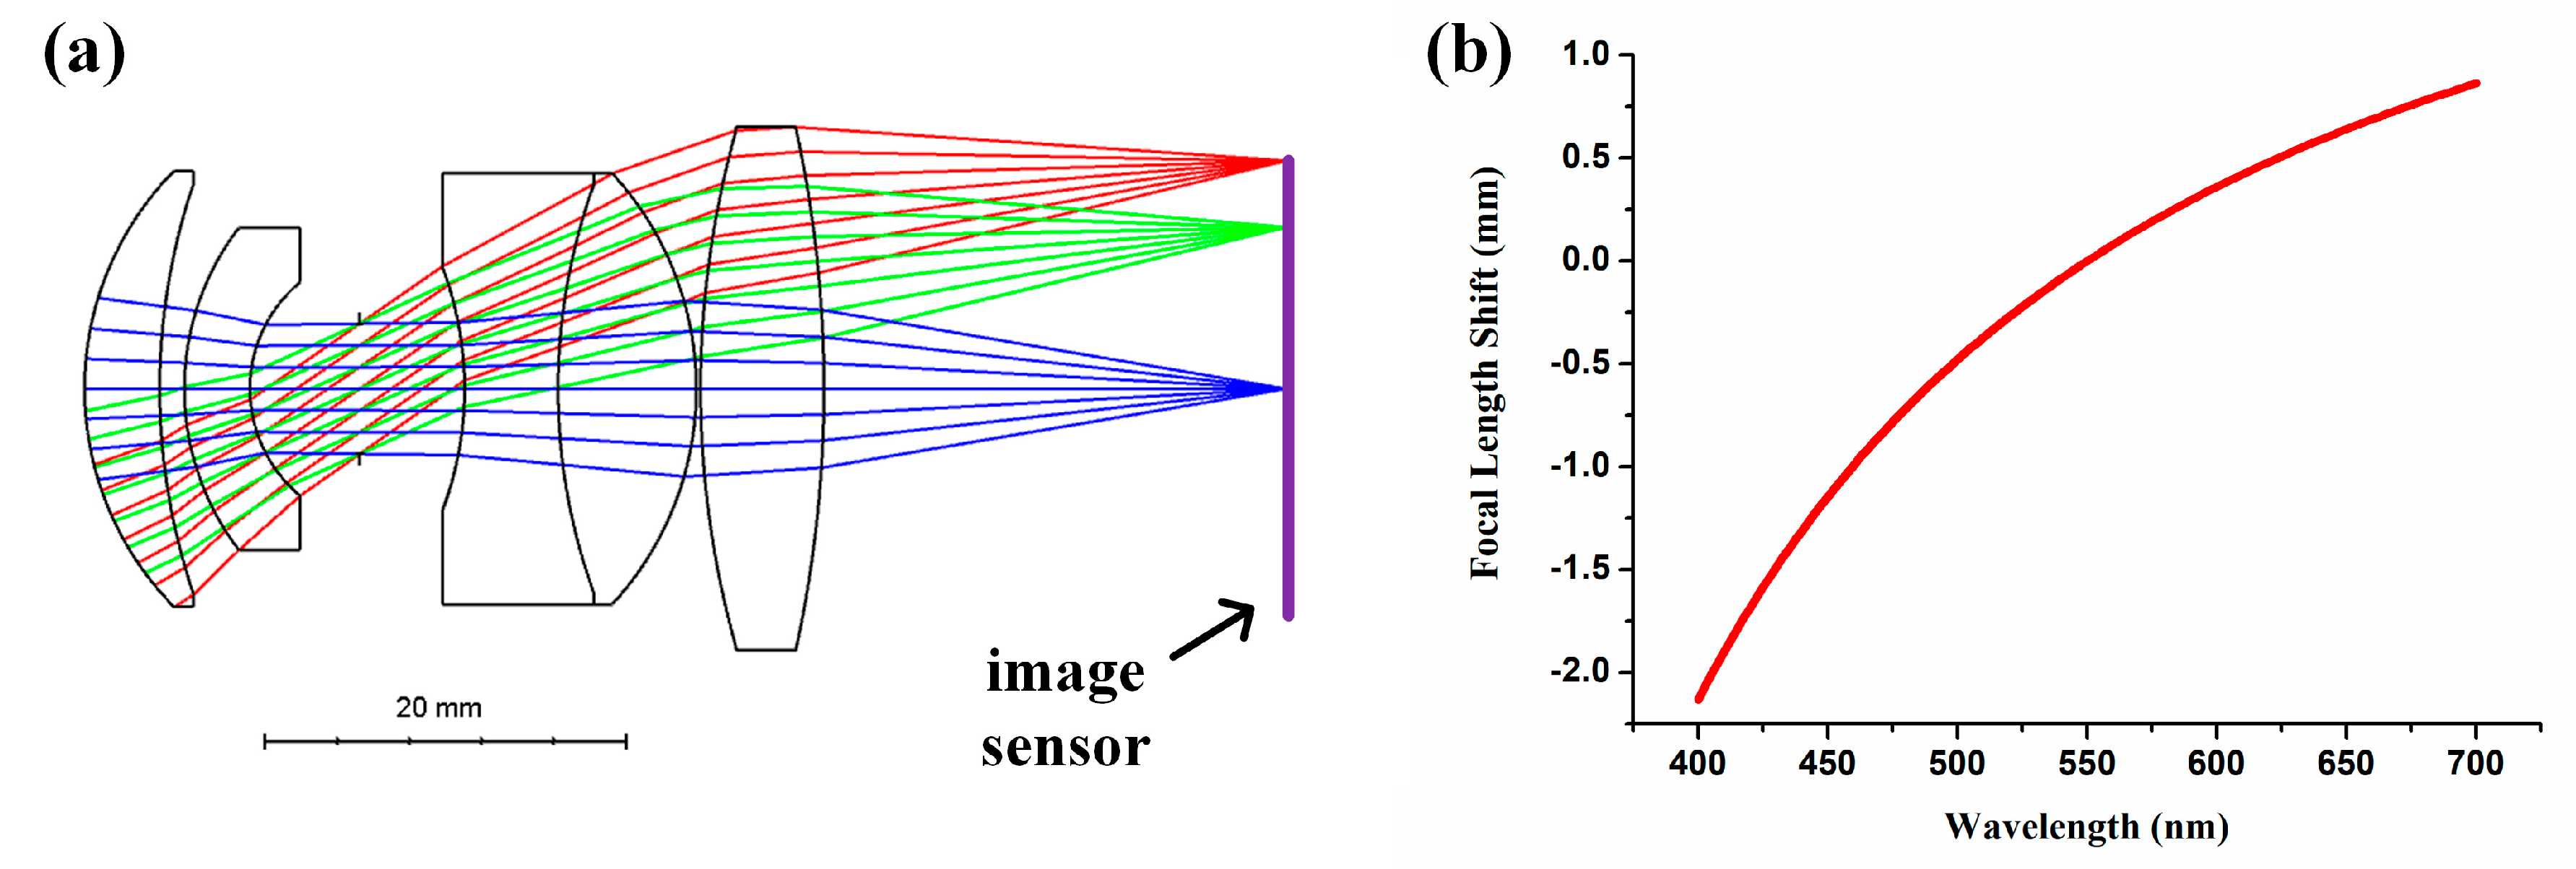
Although the typical octopus eyeball lens had a high degree of longitudinal chromatic aberration, the focal length shift in the 400–700 nm visible band is only about 0.75 mm, as shown in Figure 1b. For the establishment of an imaging system, the range of focal length shift needs to be further increased to make it easier and more accurate to modulate the distance between the lens and the image sensor. Therefore, we designed a chromatic camera lens by ZEMAX as shown in Figure 7a, with a field of view angle of about ±24°, and image surface size of about 25.2 mm in diameter, so a monochrome camera with 1/1.2″ image sensor can be used to capture images (such as DCC3260M, Thorlabs Inc., Newton, NJ, USA). Figure 7b shows the longitudinal chromatic aberration characteristics of the lens. The focal length shift in 400–700 nm is only about 2.99 mm. If applied to remote sensing imaging, the focal length of the lens designed will increase by an order of magnitude, and then it is more likely to obtain the longitudinal chromatic aberration characteristics close to linearity.
The chromatic camera lens can be fixed on an optical platform, while the monochrome camera can be mounted on a motorized linear positioning platform (such as PT1-Z8, Thorlabs Inc., Newton, HJ, USA), so that the distance between the lens and the camera can be controlled by computer to obtain chromatic blur images under different focal lengths. When the moving step of the positioning platform is set at 0.01 mm, the chromatic blur images of 300 frames with different focal lengths can be captured, and 300 different narrowband spectral images in the 400–700 nm visible band can be restored.
For the imaging method proposed in this paper, although the light flux is high when capturing each frame chromatic blur image—in that it does not need a long exposure time—it takes a long time to capture 300 different focal lengths of chromatic blur image for a scene, which is an obvious defect. Therefore, in our future study, we will focus on the image restoration method based on convolutional neural network (CNN), which can support less input channels and obtain more output channels. In other words, we expect to restore spectral images of hundreds of bands by CNN, but only need to capture a few chromatic blur images.

4. Conclusions

We used the deconvolution method of the SVD inverse filtering to process chromatically blurred images based on a chromatic blur imaging system bioinspired by color blind animals, and obtained accurate and spatially clear spectral images. Therefore, we can develop a novel hyperspectral imaging technology by an imaging lens with high chromatic aberration and a monochrome image sensor; the spectral images can be obtained through the SVD inverse filtering from the captured chromatically blurred images at different focal planes. This bioinspired hyperspectral imaging may benefit from the high light flux of large aperture, which has advantages of higher detection sensitivity. Although the current method of PSF-based inverse filtering deconvolution for spectral images restoration requires the chromatic blur images with corresponding quantity of wavelength bands as input, which is very time-consuming, other image processing methods (such as CNN) are expected to reduce the quantity of input channels to shorten the acquisition time.

Supplementary Materials

The following are available online at https://www.mdpi.com/2304-6732/6/3/91/s1, Video S1: demonstration of hyperspectral imaging bioinspired by chromatic blur vision in color blind animals.

Author Contributions

Conceptualization, S.Z. and H.H.; methodology, X.M.; software, X.M.; validation, S.Z., X.M. and W.Z.; formal analysis, X.M.; investigation, S.Z.; data curation, X.M.; writing—original draft preparation, S.Z.; writing—review and editing, H.H.; visualization, X.M.; supervision, H.H.; project administration, H.H.; funding acquisition, W.Z.

Funding

This research was funded by the National Natural Science Foundation of China (No. 61605169), Zhejiang Provincial Natural Science Foundation of China (No. LY19F050016), Shanghai Aerospace Science and Technology Innovation Fund (SAST2018-083).

Acknowledgments

We are grateful to Alexander L. Stubbs and Christopher W. Stubbs for providing MATLAB codes and spectra data for us to learn and use.

Conflicts of Interest

The authors declare no conflict of interest.

References

  1. Kneubuhler, M.; Damm-Reiser, A. Recent Progress and Developments in Imaging Spectroscopy. Remote Sens. 2018, 10, 1497. [Google Scholar] [CrossRef]
  2. Nakazawa, K.; Mori, K.; Tsuru, T.G.; Ueda, Y.; Awaki, H.; Fukazawa, Y.; Ishida, M.; Matsumoto, H.; Murakami, H.; Okajima, T.; et al. The FORCE mission: Science aim and instrument parameter for broadband X-ray imaging spectroscopy with good angular resolution. In Proceedings of the Space Telescopes and Instrumentation 2018: Ultraviolet to Gamma Ray, Austin, TX, USA, 10–15 June 2018. [Google Scholar] [CrossRef]
  3. Kontar, E.P.; Yu, S.; Kuznetsov, A.A.; Emslie, A.G.; Alcock, B.; Jeffrey, N.L.S.; Melnik, V.N.; Bian, N.H.; Subramanian, P. Imaging spectroscopy of solar radio burst fine structures. Nat. Commun. 2017, 8, 1515. [Google Scholar] [CrossRef] [PubMed]
  4. Offerhaus, H.L.; Bohndiek, S.E.; Harvey, A.R. Hyperspectral imaging in biomedical applications. J. Opt. 2019, 21, 010202. [Google Scholar] [CrossRef]
  5. Huang, H.; Shen, Y.; Guo, Y.L.; Yang, P.; Wang, H.Z.; Zhan, S.Y.; Liu, H.B.; Song, H.; He, Y. Characterization of moisture content in dehydrated scallops using spectral images. J. Food Eng. 2017, 205, 47–55. [Google Scholar] [CrossRef]
  6. Aasen, H.; Honkavaara, E.; Lucieer, A.; Zarco-Tejada, P.J. Quantitative Remote Sensing at Ultra-High Resolution with UAV Spectroscopy: A Review of Sensor Technology, Measurement Procedures, and Data Correction Workflows. Remote Sens. 2018, 10, 1091. [Google Scholar] [CrossRef]
  7. Stubbs, A.L.; Stubbs, C.W. Spectral discrimination in color blind animals via chromatic aberration and pupil shape. Proc. Natl. Acad. Sci. USA 2016, 113, 8206–8211. [Google Scholar] [CrossRef] [PubMed] [Green Version]
  8. Brown, P.K.; Brown, P.S. Visual Pigments of the Octopus and Cuttlefish. Nature 1958, 182, 1288–1290. [Google Scholar] [CrossRef] [PubMed]
  9. Bellingham, J.; Morris, A.G.; Hunt, D.M. The rhodopsin gene of the cuttlefish Sepia officinalis: Sequence and spectral tuning. J. Exp. Biol. 1998, 201, 2299–2306. [Google Scholar] [PubMed]
  10. Mathger, L.M.; Barbosa, A.; Miner, S.; Hanlon, R.T. Color blindness and contrast perception in cuttlefish (Sepia officinalis) determined by a visual sensorimotor assay. Vis. Res. 2006, 46, 1746–1753. [Google Scholar] [CrossRef] [PubMed] [Green Version]
  11. Chiao, C.C.; Wickiser, J.K.; Allen, J.J.; Genter, B.; Hanlon, R.T. Hyperspectral imaging of cuttlefish camouflage indicates good color match in the eyes of fish predators. Proc. Natl. Acad. Sci. USA 2011, 108, 9148–9153. [Google Scholar] [CrossRef] [PubMed] [Green Version]
  12. Buresch, K.C.; Ulmer, K.M.; Akkaynak, D.; Allen, J.J.; Mathger, L.M.; Nakamura, M.; Hanlon, R.T. Cuttlefish adjust body pattern intensity with respect to substrate intensity to aid camouflage, but do not camouflage in extremely low light. J. Exp. Mar. Biol. Ecol. 2015, 462, 121–126. [Google Scholar] [CrossRef]
  13. Akkaynak, D.; Allen, J.J.; Mathger, L.M.; Chiao, C.C.; Hanlon, R.T. Quantification of cuttlefish (Sepia officinalis) camouflage: A study of color and luminance using in situ spectrometry. J. Comp. Physiol. A 2013, 199, 211–225. [Google Scholar] [CrossRef] [PubMed]
  14. Jagger, W.S.; Sands, P.J. A wide-angle gradient index optical model of the crystalline lens and eye of the octopus. Vis. Res. 1999, 39, 2841–2852. [Google Scholar] [CrossRef] [Green Version]
  15. Hao, Z.L.; Zhang, X.M.; Kudo, H.; Kaeriyama, M. Development of the Retina in the Cuttlefish Sepia Esculenta. J. Shellfish Res. 2010, 29, 463–470. [Google Scholar] [CrossRef]
  16. Douglas, R.H.; Williamson, R.; Wagner, H.J. The pupillary response of cephalopods. J. Exp. Biol. 2005, 208, 261–265. [Google Scholar] [CrossRef] [PubMed] [Green Version]
  17. Chung, W.S. Comparisons of visual capabilities in modern Cephalopods from shallow water to deep sea. PhD Thesis, University of Queensland, Brisbane, Australia, 2014. [Google Scholar]
  18. Born, M.; Wolf, E. Principles of Optics, 5th ed.; Pergamon Press: Oxford, UK, 1975. [Google Scholar]
  19. McNally, J.G.; Karpova, T.; Cooper, J.; Conchello, J.A. Three-dimensional imaging by deconvolution microscopy. Methods 1999, 19, 373–385. [Google Scholar] [CrossRef] [PubMed]
  20. Kenig, T.; Kam, Z.; Feuer, A. Blind Image Deconvolution Using Machine Learning for Three-Dimensional Microscopy. IEEE Trans. Pattern Anal. Mach. Intell. 2010, 32, 2191–2204. [Google Scholar] [CrossRef] [PubMed]
  21. Klema, V.C.; Laub, A.J. The Singular Value Decomposition—Its Computation and Some Applications. IEEE Trans. Autom. Control 1980, 25, 164–176. [Google Scholar] [CrossRef]
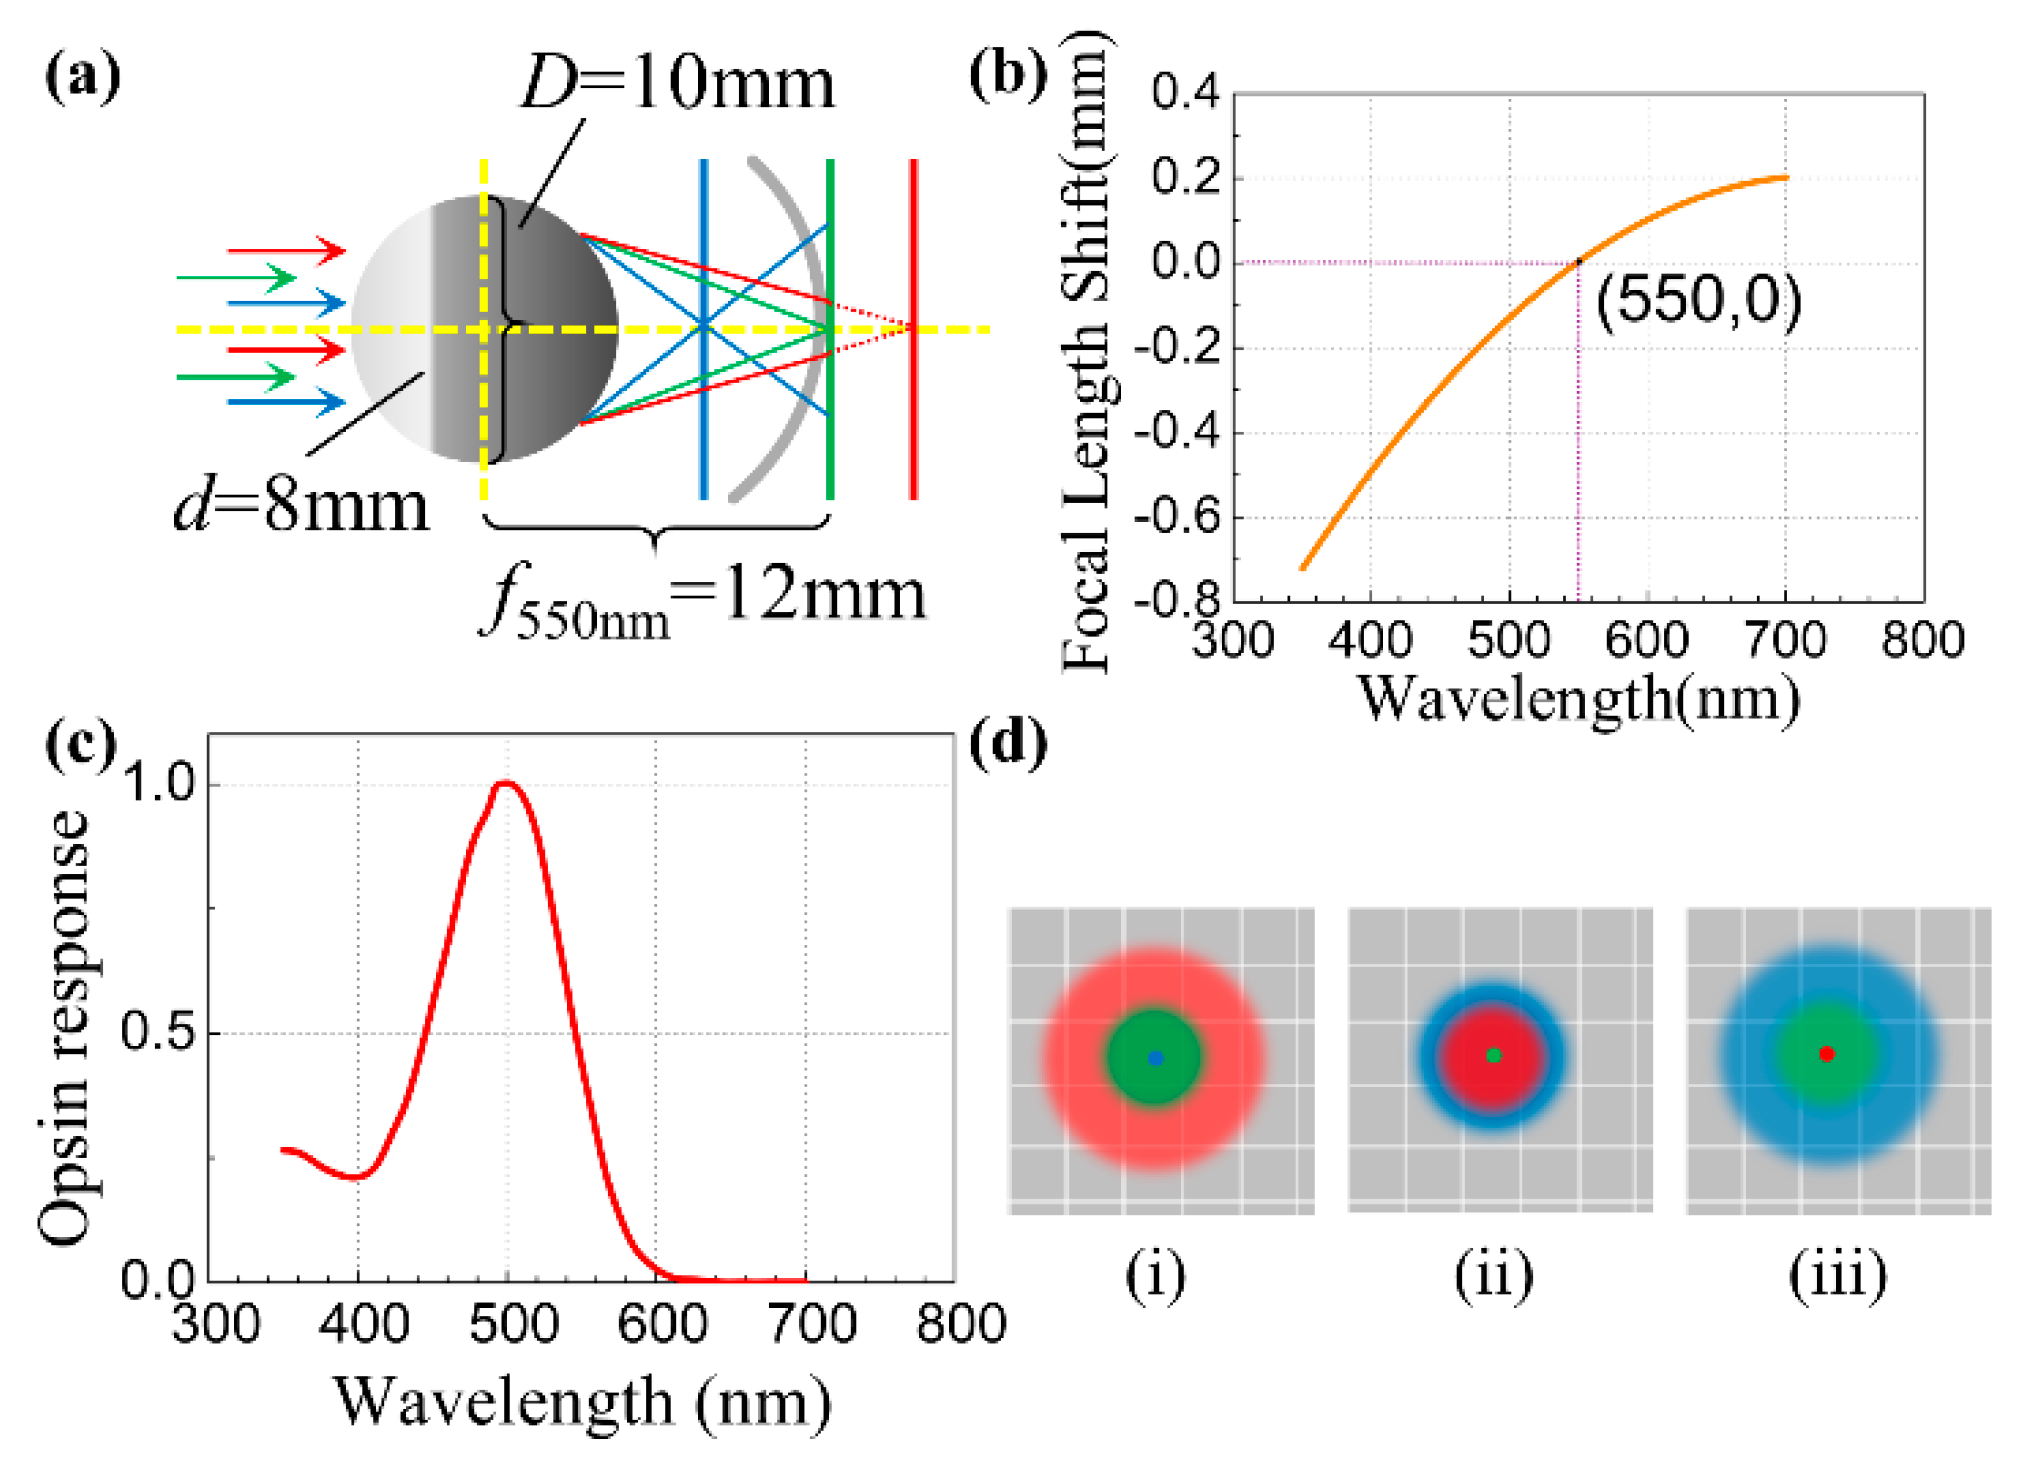
Figure 1. Optical model and characteristics of chromatic aberration. (a) Optical path diagram of the model that reflects a high longitudinal chromatic aberration characteristic. (b) Longitudinal chromatic aberration curve with a focal length shift range of approximately 0.923 mm in the wavelength range of 350–700 nm. (c) Photoreceptor response curve. Octopus retina contain only one type of photoreceptor and exhibit almost no response to light exceeding 600 nm. (d) Diagrammatic drawing of a point object with three wavelength bands at the distance of infinity imaged on the detection plane containing. The photoreceptor response is not considered here; (i), (ii), and (iii) indicate the focal plane at each wavelength band.
Photonics 06 00091 g001
Figure 2. The point spread function (PSF) simulations. (ac) The PSFs at a wavelength of 450 nm, where the beam wavelengths of 450 nm, 550 nm, and 650 nm focused on the detection plane, corresponding to focal length shifts f at −0.32 mm, 0 mm, and 0.16 mm, respectively. (df) The PSFs at a wavelength of 550 nm, where the detection plane positions are the same as above. (gi) The PSFs at a wavelength of 650 nm, where detection plane positions are the same as above.
Photonics 06 00091 g002
Figure 3. Blurred images of three objects formed on the detection plane. The left column shows the objects and the radiation spectrum for each color, and the right column denotes the blurred images formed on the detection plane. We consider the position corresponding to 550 nm focused as the zero position, and only show six images where the detection plane is at −0.491 mm, −0.294 mm, −0.129 mm, 0 mm, 0.102 mm, and 0.168 mm. (a,b) Radiation spectrum and blurred images on detection plane of green stripes with black background target and green stripes with blue background object. Light wavelength below 400 nm and exceeding 700 nm is not considered in the imaging. (c) Six-color ZJU logo. The radiation spectrum of each color in the object is correspondingly numbered, and the number-labeled positions are approximately the Region of Interests (ROIs).
Photonics 06 00091 g003
Figure 4. The singular value decomposition (SVD) inverse filtering algorithm flow chart. The input data are chromatically blurred images and PSFs of the octopus eye optical system, the outputs are restored spectral images of the target.
Photonics 06 00091 g004
Figure 5. Spectral image restoration and spectral discrimination of two striped targets. (a,c) Restored images of green stripes with a black background target and green stripes with a blue background target, respectively, at different wavelength bands. (b,d) We plot the restored spectral curve by averaging the pixel values (3 × 3 pixels) of the ROI of green stripes or blue background in each restored image frame. The sharpness curve is calculated from each frame of the blurred image of the target.
Photonics 06 00091 g005
Figure 6. Spectral image restoration and spectral discrimination of the six-color ZJU logo target. (a) Different wavelength bands of restored images of the ZJU logo target. (b) Comparison of the restored (5 nm resolution) and target (continuous) ROIs spectra corresponding to ROI numbers 1–6 in Figure 3c.
Photonics 06 00091 g006
Figure 7. Chromatic camera lens and longitudinal chromatic aberration characteristics. (a) Optical design of chromatic camera lens by ZEMAX, longitudinal position of monochrome image sensor can be modulated by a motorized linear positioning platform. (b) Longitudinal chromatic aberration curve with a focal length shift range of approximately 2.99 mm in the wavelength range of 400–700 nm, focal length of 550 nm is set to 0.
Photonics 06 00091 g007