Abstract
We report on the study of an intensity-based optical fiber sensor for gasoline quality monitoring. The sensor setup employs two Bragg gratings with different spectral responses to interrogate the optical response of a tilted Bragg grating. The sensor operation is based on the tilted Bragg grating sensitivity to external refractive index changes, which are translated as power variations by the interrogation scheme. Gasoline–ethanol solutions with concentrations ranging from 0% to 60% ethanol were used to demonstrate the sensor performance. The results allowed to estimate that the sensor is able, within its resolution limit, to detect ethanol concentration variations of 1.5% in gasoline–ethanol solutions and discriminate temperature variations of 0.5 °C. The all-optical sensor setup is compact and robust, making it a competitive alternative for the realization of fuel quality analyses in practical applications.
1. Introduction
Although the efforts made towards the study of renewable fuels have provided very interesting results in recent years, the use of petroleum-derived fuels remains crucial in today’s world. In this context, malpractices including the adulteration of fuels—such as the addition of ethanol to gasoline beyond the concentration stipulated by legislation—are, unfortunately, very frequent in developing countries [1]. Therefore, the development of technologies for monitoring fuel conformity is highly desired.
In the literature, techniques based on the use of chemiresistors [2], piezoresonance elements [3], and capacitive transducers [4] have been reported for evaluating gasoline quality. However, the use of setups in which electrical signals are present can be extremely dangerous as fuels are flammable and explosive substances. Thus, optical fiber sensors appear as an interesting alternative because they do not demand the use of electrical signals in their operation. Additionally, optical fiber sensors are immune to electromagnetic interference and allow the realization of measurements with high sensitivity and, potentially, with adequate resolution levels.
Optical fiber sensors for gasoline quality monitoring usually probe the refractive index changes, which are verified when different contents of the adulterated solvents are diluted in gasoline. Long-period gratings (LPG) [5,6], singlemode-multimode-singlemode (SMS) structures [7], and thinned Bragg gratings [8] are technologies able to evaluate fuel conformity. Moreover, gasoline sensors based on Fabry–Perot interferometers prepared on fiber tips [9] and on long-period gratings associated with fiber tapers [10] have been reported in the literature. However, in these investigations, the sensing experiments are based on spectral measurements [5,6,7,8,9] or make use of sophisticated interrogation schemes (such as the setup reported in [10], based on white light interferometry). Regarding the use of spectral measurements, even though they are highly useful for sensing, their realization involves the utilization of expensive optical spectrum analyzers, which can ultimately limit their application for practical purposes.
Additionally, tilted fiber Bragg gratings (TFBGs) [11] are also suitable for probing refractive index variations in the medium that surrounds the optical fiber. Although one can find numerous reports on the use of TFBGs in refractive index sensing applications [12,13], to our knowledge, there is no journal article to date describing the application of these gratings acting specifically as fuel sensors. On the other hand, one can find a few patents that approach this topic [14,15]. The sensor reported herein, differently from the ones described in [14] and [15], allows, in an intensity-based measurement, to characterize both the concentration of adulteration components in gasoline and temperature variations.
In this letter, we report on the study of an intensity-based gasoline sensor based on a tilted fiber Bragg grating. The experimental setup employs two additional standard (non-tilted) Bragg gratings (FBGs), which are able to interrogate the TFBG response using simple photodetectors. Here, it is worth saying that the study of interrogation schemes in FBG-based sensors have entailed a great variety of interrogation routines, such as the ones using Fabry–Perot interferometers [16], tunable lasers [17], and electronics-assisted FBG-based setups [18]. In our sensor, we made the choice of using an FBG-based interrogation scheme due to the ease of obtaining FBGs with adequate optical responses (with suitable resonance spectral positioning and bandwidth), taking into account the existing knowledge on FBG fabrication and manipulation.
In the following, we present the sensor’s principle of operation and the characterization of the gratings. Additionally, we demonstrate the sensor performance by measuring ethanol–gasoline mixtures at different concentrations. The sensor resolution limit is estimated to be 1.5% of ethanol diluted in gasoline, which is similar to the one estimated from the data available in [6] for a sensor based on a single LPG (around 1%). Moreover, differently from [6], the setup here reported avoids the use of expensive optical spectrum analyzers and provides the possibility of accounting for refractive index and temperature variations.
2. Gratings, Sensor Setup, and Principle of Operation
Standard and tilted fiber Bragg gratings were used in the setup to be described herein. Bragg gratings (FBGs) consist of periodic refractive index modulations along the core of an optical fiber, which allow coupling between forward and backwards propagating core modes [19]. The coupling occurs at wavelengths, λFBG, at which the phase matching condition, Equation (1), is satisfied (where neffcore is the effective refractive index of the core mode and Λ is the grating period). The typical response of an FBG is usually measured in reflection and consists of a spectral peak centered at λFBG.
In tilted Bragg gratings, the refractive index modulation planes are inclined with respect to the fiber axis. It promotes, in addition to the coupling between forward and backwards propagating core modes, the coupling between the core mode to backwards propagating cladding modes [11]. The coupling happens at wavelengths λTFBG, at which the phase matching condition, Equation (2), is met (where neff,icoupled is the effective refractive index of the i-th cladding mode and θ is the tilt angle). The TFBG spectrum is usually measured in transmission and is characterized by the presence of several dips, with each dip corresponding to the coupling of the core mode and a different cladding mode. Indeed, Equation (1) is a special case of Equation (2) when neffcore = neff,icoupled and θ = 0.
The operation of the sensor proposed here is based on the TFBG sensitivity to external refractive index variations, as the cladding modes depend on the surrounding refractive index. Variations in the external medium refractive index will cause each cladding mode’s optical response to spectrally shift or cause the cladding mode to change from a bound to a leaky state (which modifies the amplitude of the spectra). In our sensor, these spectral and amplitude shifts are translated into power variations in the sensor output, which can be directly associated to gasoline–ethanol solution concentration variations.
2.1. Gratings Characterization
The sensor here proposed uses two different FBGs for interrogating the response of a TFBG. The two Bragg gratings (FBG 1 and FBG 2) are chosen to have distinct spectral responses. The Bragg peaks of FBG 1 and FBG 2 are centered, respectively, at 1535.6 nm and at 1559.3 nm, as seen in Figure 1 (red and purple lines in the main spectrum). The gratings were UV-induced by using the phase-mask technique [20].
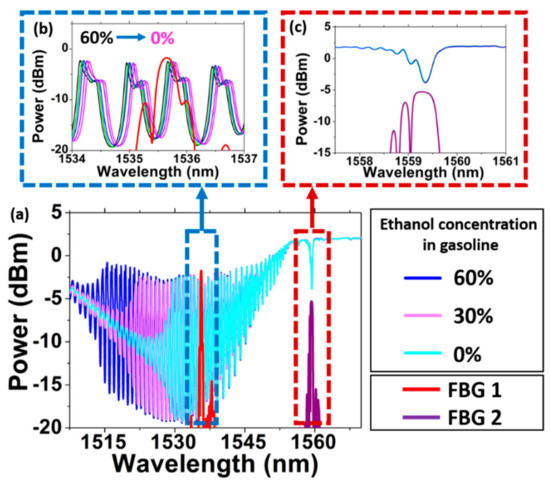
Figure 1.
(a) Spectral response of the fiber Bragg gratings (FBG 1 and FBG 2) and of the tilted Bragg grating when it is immersed in the gasoline–ethanol solutions of different concentrations. Zoomed-in view of the spectral ranges (b) between 1534 nm and 1537 nm and (c) between 1557.5 nm and 1551 nm.
A TFBG was used as the sensing element (tilt angle: 6°). Its transmission spectra for the situations in which it was immersed in gasoline–ethanol solutions at different concentrations are shown in Figure 1a. Note that some of the cladding modes become leaky modes, depending on the gasoline–ethanol solution that surrounds the TFBG. This bound-to-leaky mode transition is observed as an abrupt variation in the visibility of the dips in the TFBG transmission spectrum [20]. It happens because the gasoline–ethanol solutions’ refractive indices are relatively high (1.3746, 1.3862, and 1.3983 as measured at 589 nm for the solutions with 60%, 30%, and 0% ethanol diluted in gasoline, respectively) and eventually greater than the effective refractive index of some of the cladding modes excited by the TFBG. For the modes that do not become leaky, as the external refractive index changes, the TFBG cladding modes spectrum shifts; see Figure 1b for a zoomed-in view of the spectral region between 1534 nm and 1537 nm.
Otherwise, as the core mode is tightly confined in the fiber core, it does not depend on the refractive index variations in the medium that surrounds the fiber [11]. Therefore, the spectral position of the dip at 1559.3 nm in the TFBG spectrum does not change when the external medium’s refractive index is altered (see Figure 1c for a zoomed-in view of the spectral region between 1557.5 nm and 1561 nm). On the other hand, the spectral position of this dip depends on temperature variations due to thermal expansion and the thermo-optic effect [11]. The optical response of the core mode will, therefore, be interrogated to account for temperature variations in the setup.
2.2. Sensor Setup and Principle of Operation
The sensor setup is represented in Figure 2a. A superluminescent light-emitting diode (SLED) is used as a broadband optical source. The Bragg gratings FBG 1 and FBG 2 reflect back the input signal at 1535.6 nm and at 1559.3 nm, as discussed in Section 2.1. The optical signals reflected by the FBGs act as the optical source for interrogating the TFBG response: the FBG 1 response is adjusted to interrogate the TFBG cladding mode dip around 1535.6 nm (whose behavior is dependent on both the external refractive index and the temperature variations), and the FBG 2 response is tuned to interrogate the TFBG core mode dip at 1559.3 nm (whose behavior is dependent on temperature changes only). Optical circulators and fiber couplers are used to conduct the optical signal conveniently. Similar approaches have been reported in the literature for interrogating strain sensors [21] and plasmonic biosensors [22]. However, the setup reported in [20] was focused on strain measurements, and the one reported in [22] was not designed to account for undesirable temperature variations during the measurements as is the setup reported herein.
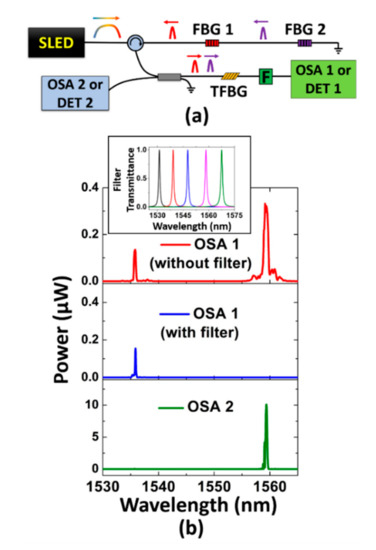
Figure 2.
(a) Sensor setup. SLED: superluminescent light-emitting diode; OSA: optical spectrum analyzer; DET: photodetector; F: tunable spectral filter. (b) Spectra measured in OSA 1 (without and with the optical filter: red and blue lines, respectively) and in OSA 2 (green line). Inset shows the transmittance of the filter, which can be tuned conveniently.
The signals measured in the optical spectrum analyzers (OSA) or photodetectors (DET) are, therefore, a combination of the FBGs and TFBG responses. Figure 2b presents the spectra measured in OSA 1 and OSA 2 according to the configuration presented in Figure 2a. The spectral responses are presented here to clarify the sensor operation. The final measurements are performed by using the photodetectors (DET 1 and DET 2) and not the optical spectrum analyzers.
In OSA 1, originally, two peaks are measured (top red spectrum in Figure 2b). They consist of a convolution between the FBG 1, the FBG 2, and the TFBG spectra. However, as we intended to measure in DET 1 the cladding mode contribution (at 1535.6 nm) exclusively, we added to the experimental setup a tunable spectral filter (F in Figure 2a), whose transmittance can be tuned (as shown in the inset of Figure 2b) for excluding the core mode contribution from the spectrum (at 1559.3 nm). The resulting spectrum measured in OSA 1 when using the filter is also shown in Figure 2b (blue spectrum). It is seen that the use of the spectral filter allows measuring the cladding mode optical contribution individually in DET 1.
The optical signal reflected by the TFBG is computed in OSA 2. The measured spectrum is shown in Figure 2b (green bottom spectrum). Although the TFBG couples the incident core mode to the backwards propagating core and cladding modes, only the core mode contribution is measured in OSA 2. It happens because the cladding modes have greater loss than the core mode.
To summarize, the signal measured in DET 1 carries information of the cladding mode variation, which can be due to refractive index and/or temperature changes. The signal measured in DET 2, in turn, carries information of the core mode variations, which are due to temperature variations only. By observing the DET 2 response, the influence of the temperature variations on DET 1 data can be accounted for.
3. Gasoline Sensing Measurements
To perform the gasoline adulteration measurements, the optical spectrum analyzers were replaced by the photodetectors. As the TFBG was immersed in gasoline–ethanol solutions with different concentrations, the photodetectors’ signals were evaluated. Here, gasoline–ethanol solutions were chosen for demonstrating the operation of the sensor because ethanol is very often used as an adulterating substance (due to its good solubility in gasoline). Although other substances can also be used for this purpose, adulteration via ethanol utilization is particularly important in countries as Brazil, where ethanol is available at gas stations and with a cost that is lower than gasoline.
Figure 3a shows the normalized voltage measured by using the photodetectors as a function of the ethanol concentration in the gasoline; the voltage level measured for the 60% ethanol solution was assumed to be 1. It is worth saying that care was taken in order to keep the solutions at the same temperature (room temperature) during the measurements.
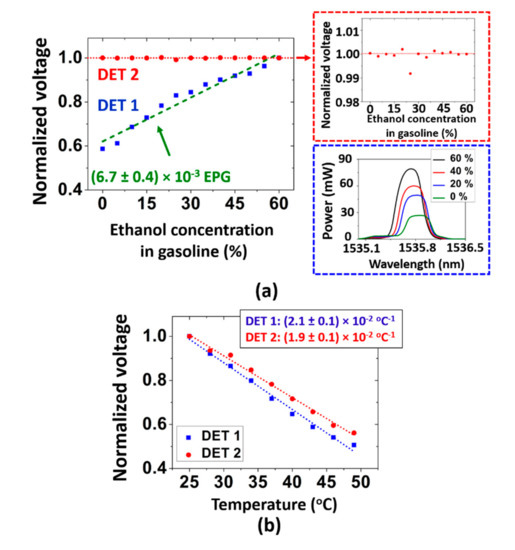
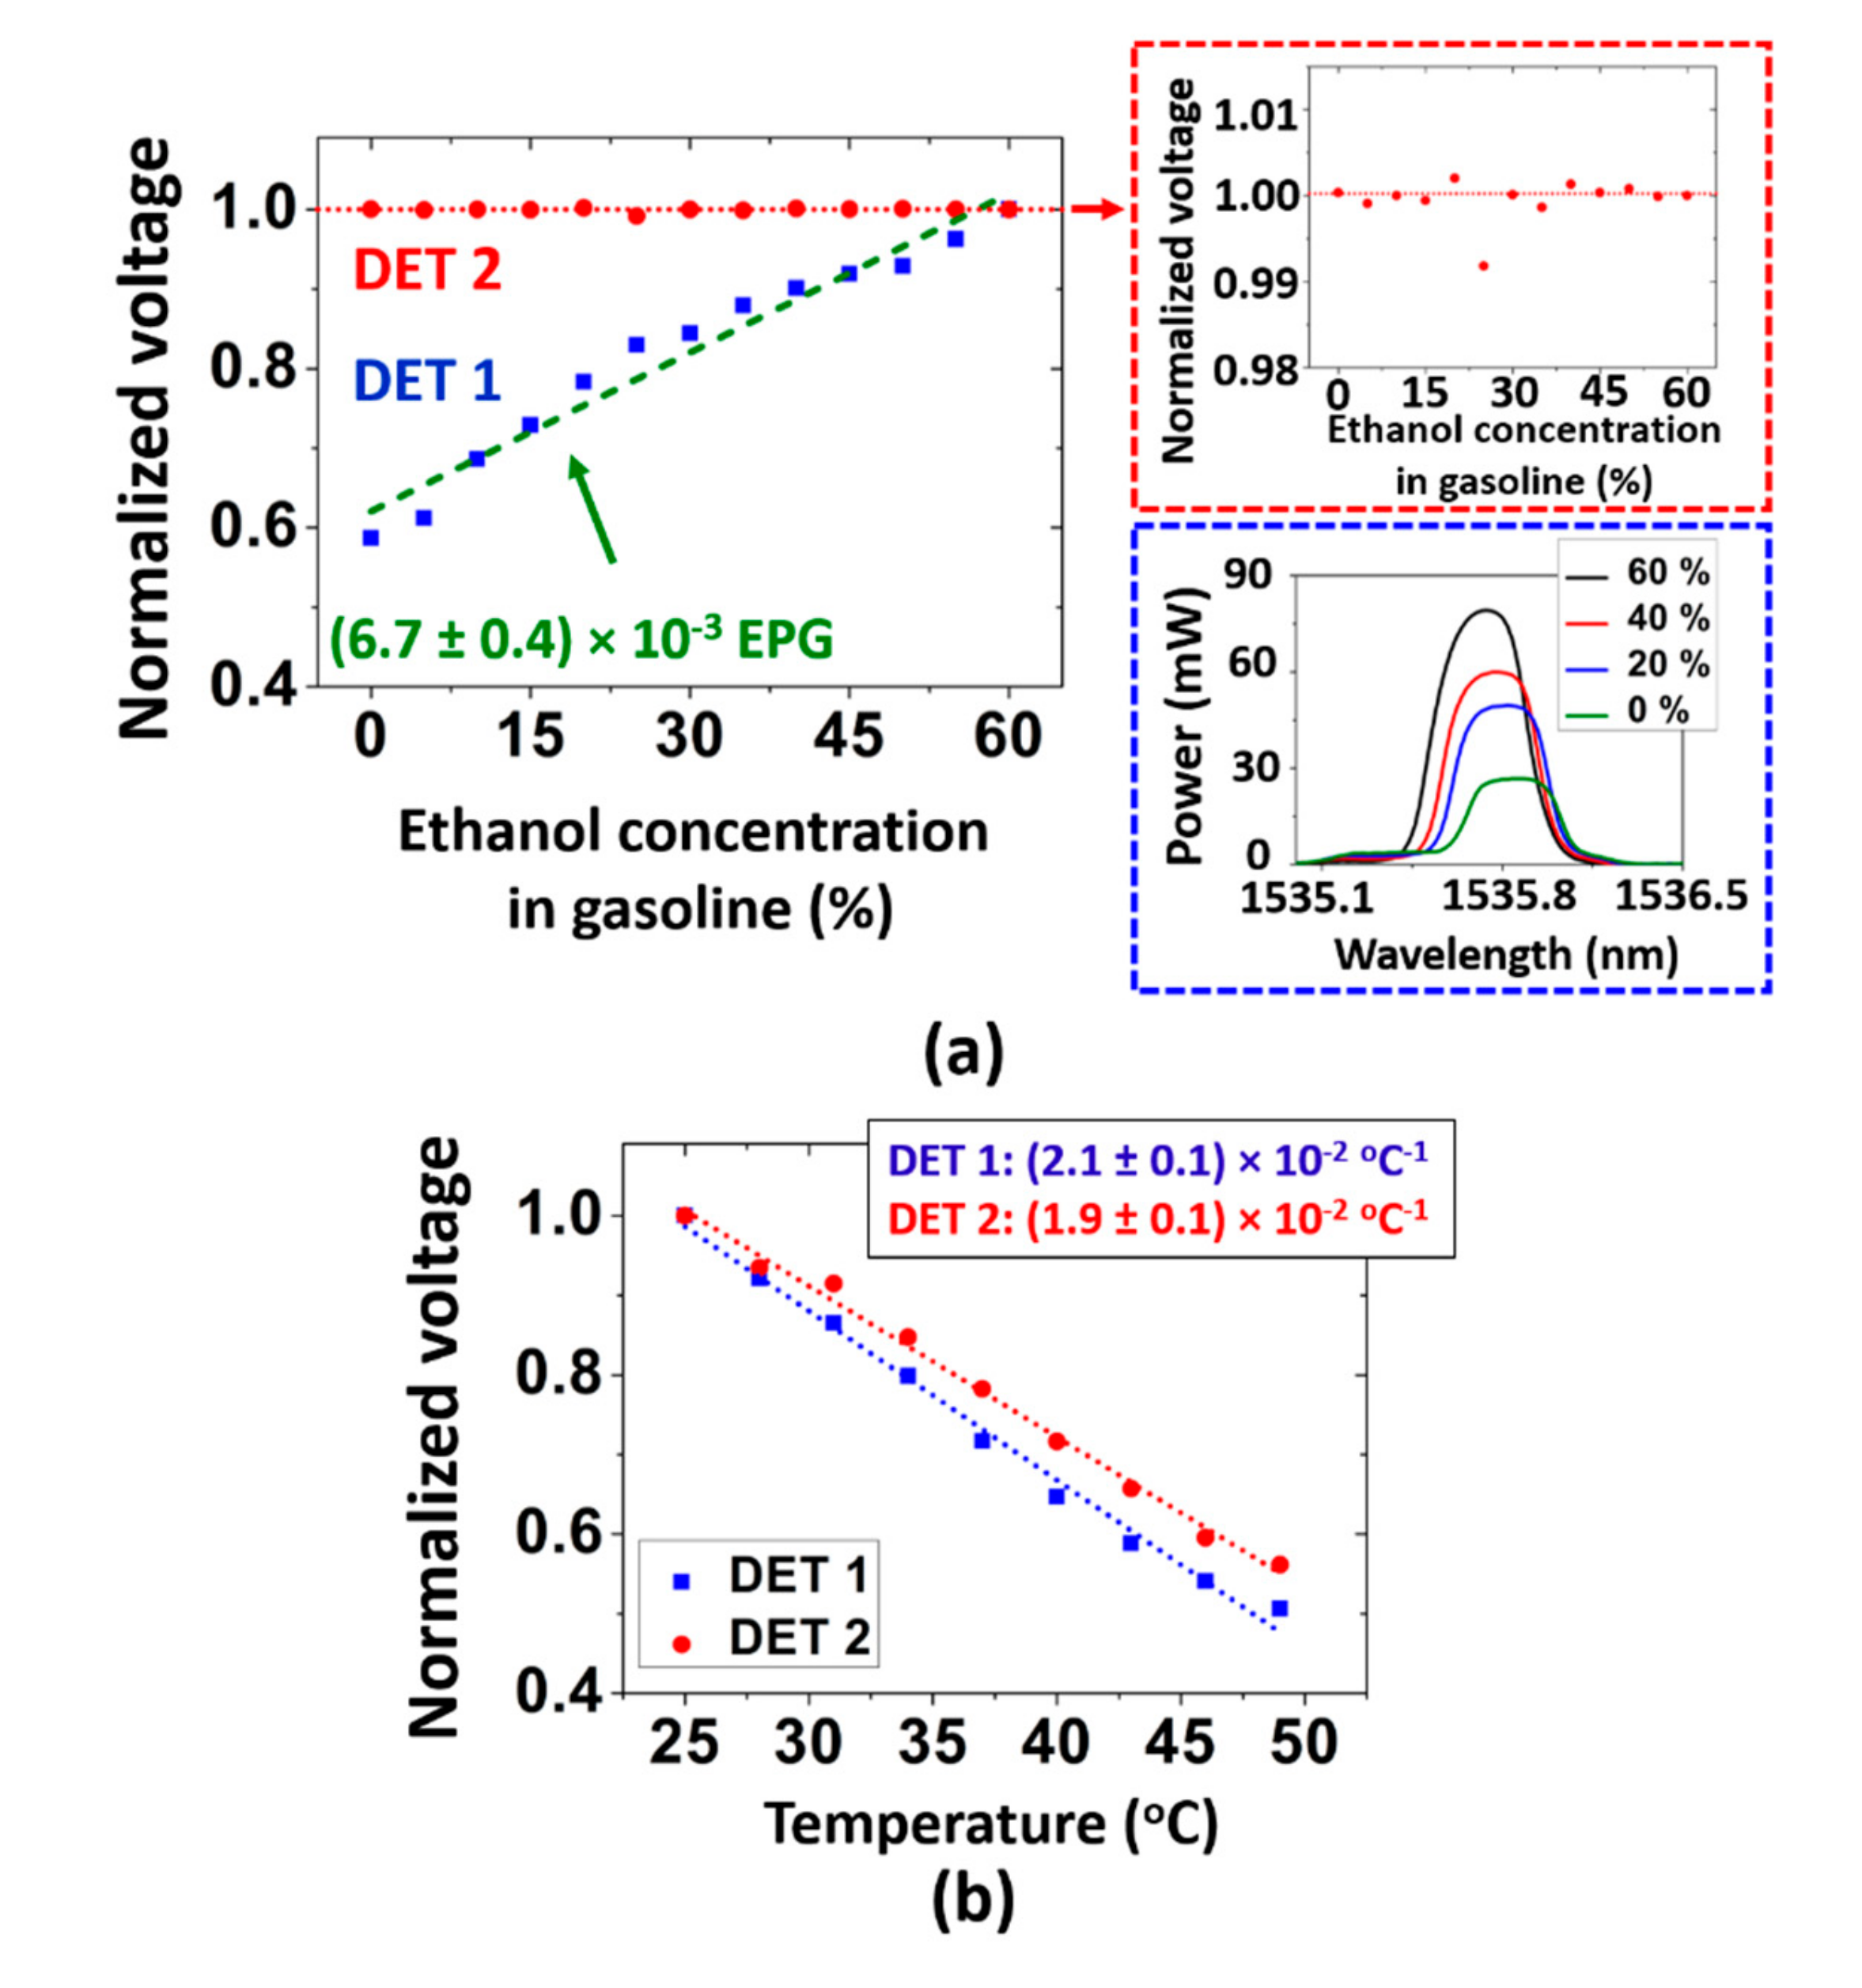
Figure 3.
(a) Normalized voltage measured in the photodetectors (DET 1 and DET 2) as a function of the ethanol concentration in gasoline. Inset shows the signal measured by OSA 1 as a function of the ethanol concentration. (b) Normalized voltage variation measured in the photodetectors (DET 1 and DET 2) as a function of the temperature.
In Figure 3a, it is seen that, as expected, the DET 1 signal varies as the ethanol concentration in gasoline is changed, since the external refractive index variation alters the cladding mode optical response. The bottom inset in Figure 3a (blue dashed rectangle) shows the spectral response measured by substituting DET 1 by OSA 1, where one can clearly observe that greater power levels are measured by OSA 1 (and DET 1) for solutions with larger ethanol concentrations. Otherwise, the DET 2 normalized voltage slightly oscillated around 1 as the solutions with different concentrations were tested (the top inset in Figure 3a shows a zoomed-in view of DET 2 data for better visualization). This was also expected because DET 2 measures the core mode contribution (and thus is independent from external refractive index variations).
By linear fitting of DET 1 data in Figure 3a, we obtain (6.7 ± 0.4) × 10−3 EPG−1 as the sensor sensitivity (EPG: ethanol percentage in gasoline). Assuming we can resolve a 1% normalized voltage variation in DET 1 output, we can estimate that our sensor resolution is 1.25% of ethanol in gasoline. This result is similar to the one that can be calculated from the long-period grating-based sensor reported in [6], of around 1%. Other sensors, however, can achieve better resolution levels, such as the high-sensitivity gasoline sensor reported in [10], of 0.06%. However, the sensor reported herein has the advantage of being much more compact and robust than the one reported in [10], which is based on a pair of long-period gratings associated to a fiber taper (which decreases the sensor robustness). Moreover, the interrogation scheme used here is much simpler. Furthermore, it is worthy to say that, in principle, the sensor reported herein would be suitable for detecting adulteration in other fuels that have refractive indices lower than the effective refractive indices of the cladding modes excited by the TFBG.
Furthermore, to demonstrate that the sensor can account for temperature variations, we measured the detectors’ signals when the TFBG was subjected to temperature variations. Here, the TFBG was inserted into an oven and the detectors’ outputs were observed as the temperature was altered. Figure 3b shows the results for the normalized voltage in the photodetectors as a function of the temperature. As can be observed, the temperature responses are seen to be very similar. A linear fitting was realized, and the temperature sensitivities for DET 1 and DET 2 were calculated to be (2.1 ± 0.1) × 10−2 °C−1 and (1.9 ± 0.1) × 10−2 °C−1. In fact, the similarity in the detectors’ temperature sensitivities was expected because the spectral temperature sensitivities for the core and cladding modes dips in the TFBG spectrum are also very similar (around 10 pm/°C).
Assuming we can resolve a 1% normalized voltage variation in the photodetectors’ output, the sensor temperature resolution can be estimated to be 0.5 °C. Thus, the sensor allows to account for temperature variations by observing, in a gasoline-adulteration sensing measurement, the DET 2 response; i.e., if the DET 2 output changes, the DET 1 data must be corrected. For example, if the DET 2 output changes by 1% (meaning that during the sensing experiment, the temperature varied by 0.5 °C), the DET 1 data must be corrected by this same amount, since the detectors’ output sensitivities to temperature variations are approximately the same. Indeed, it is not mandatory that the temperature sensitivities in DET 1 and DET 2 are equal. If they are different, similarly to FBG-based multiparameter sensors [23], the temperature and refractive index variations can be estimated by using a linear system in which the refractive index and temperature sensitivities are taken into account.
4. Conclusions
In this letter, we described the study of a gasoline-adulteration optical fiber sensor. By employing two Bragg gratings to interrogate the optical response of a tilted Bragg grating, the sensor was able to detect ethanol concentration variations in gasoline–ethanol solutions. The resolution limit was calculated to be 1.5% of ethanol in gasoline when we assume that a minimum of 1% normalized voltage variation can be measured in the photodetectors. Also, the sensor provides the possibility of accounting for temperature variations with a resolution limit of 0.5 °C. The sensor output is measured by using photodetectors instead of expensive optical spectrum analyzers. It makes the sensor a competitive alternative to be employed in practical applications.
Author Contributions
Conceptualization, C.M.B.C. and J.H.O.; methodology, C.M.B.C., J.H.O., and S.A.; writing—original draft preparation, J.H.O.; writing—review and editing, C.M.B.C., J.H.O., and S.A.; supervision, C.M.B.C. and J.H.O.
Funding
This research was partially funded by the São Paulo Research Foundation (FAPESP) (#2014/50632-6). J.H.O. gives thanks to CNPq (Conselho Nacional de Desenvolvimento Científico e Tecnológico) for financial support.
Conflicts of Interest
The authors declare no conflict of interest.
References
- Vempatapu, B.P.; Kanaujia, P.K. Monitoring petroleum fuel adulteration: A review of analytical methods. Trends Anal. Chem. 2017, 92, 1–11. [Google Scholar] [CrossRef]
- Zanelli, A.; Bassinib, S.; Giorgettib, M.; Li, Y.; Yang, M.J. Chemiresistors for ethanol detection in hydrocarbons. Sens. Actuators B Chem. 2010, 148, 147–152. [Google Scholar] [CrossRef]
- Kalach, A.V.; Selemenev, V.F. A piezoresonance sensor system for rapid evaluation of the quality of gasolines. Chem. Technol. Fuels Oil 2007, 43, 60–61. [Google Scholar] [CrossRef]
- Wiziack, N.K.L.; Catini, A.; Santonico, M.; D’Amico, A.; Paolesse, R.; Paterno, L.G.; Fonseca, F.J.; di Natale, C.A. A sensor array based on mass and capacitance transducers for the detection of adulterated gasolines. Sens. Actuators B Chem. 2009, 140, 508–513. [Google Scholar] [CrossRef]
- Possetti, G.R.C.; Côcco, L.C.; Yamamoto, C.I.; de Arruda, L.V.R.; Falate, R.; Muller, M.; Fabris, J.L. Application of a long-period fibre grating-based transducer in the fuel industry. Meas. Sci. Technol. 2010, 20, 1–9. [Google Scholar] [CrossRef]
- Falate, R.; Kamikawachi, R.C.; Müller, M.; Kalinowski, H.J.; Fabris, J.L. Fiber optic sensors for hydrocarbon detection. Sens. Actuators B Chem. 2005, 105, 430–436. [Google Scholar] [CrossRef]
- Rodríguez, A.J.R.; Baldovino-Pantaleón, O.; Cruz, R.F.D.; Zamarreño, C.R.; Matías, I.R.; May-Arrioja, D.A. Gasohol quality control for real time applications by means of a multimode interference fiber sensor. Sensors 2014, 14, 17817–17828. [Google Scholar] [CrossRef] [PubMed]
- Agarwal, S.; Prajapati, Y.K.; Mishra, V. Thinned fibre Bragg grating as a fuel adulteration sensor: Simulation and experimental study. Opto Electron. Rev. 2014, 23, 231–238. [Google Scholar] [CrossRef]
- Pawar, D.; Kitture, R.; Kale, S.N. ZnO coated Fabry-Perot interferometric optical fiber for detection of gasoline blend vapors: Refractive index and fringe visibility manipulation studies. Opt. Laser Technol. 2017, 89, 46–53. [Google Scholar] [CrossRef]
- Osório, J.H.; Mosquera, L.; Gouveia, C.J.; Biazoli, C.R.; Hayashi, J.G.; Jorge, P.A.S.; Cordeiro, C.M.B. High sensitivity LPG Mach-Zehnder sensor for real-time fuel conformity analysis. Meas. Sci. Technol. 2013, 24, 015102. [Google Scholar] [CrossRef]
- Albert, J.; Shao, L.-Y.; Caucheteur, C. Tilted fiber Bragg grating sensors. Laser Photonics Rev. 2012, 49, 305104. [Google Scholar] [CrossRef]
- Shevchenko, Y.Y.; Albert, J. Plasmon resonances in gold-coated tilted fiber Bragg gratings. Opt. Lett. 2007, 32, 211–213. [Google Scholar] [CrossRef] [PubMed]
- Alberto, N.J.; Marques, C.A.; Pinto, J.L.; Nogueira, R.N. Three-parameter optical fiber sensor based on a tilted Bragg grating. Appl. Opt. 2010, 49, 6085–6091. [Google Scholar] [CrossRef]
- Takabayashi, M.; Yoshiara, K.; Shimakura, Y.; Matsumoto, S.; Mitani, T.; Kanamaru, S.; Ishii, K. Optical Fiber Sensor. U.S. Patent US 7,672,544 B2, 2 March 2010. [Google Scholar]
- Nishikawa, S.; Takabayashi, M.; Yoshiara, K.; Yagyu, E.; Mitani, T.; Hamatani, Y. Optical Fiber Sensor. U.S. Patent US 8,285,086 B2, 9 October 2012. [Google Scholar]
- Hill, K.O.; Meltz, G. Fiber Bragg grating technology fundamentals and overview. J. Lightw. Technol. 1997, 15, 1263–1276. [Google Scholar] [CrossRef]
- Ma, Y.; Wang, C.; Yang, Y.; Yan, S.; Li, J. High resolution and wide scale fiber Bragg grating sensor interrogation system. Opt. Laser Technol. 2013, 50, 107–111. [Google Scholar] [CrossRef]
- Kim, H.; Song, M. Linear FBG Interrogation with a Wavelength-Swept Fiber Laser and a volume Phase Grating Interferometer. In Proceedings of the 21st International Conference on Optical Fibre Sensors (OFS21), Ottawa, ON, Canada, 17 May 2011. [Google Scholar] [CrossRef]
- Cui, J.; Hu, Y.; Feng, K.; Li, J.; Tan, J. FBG interrogation method with high resolution and response speed based on a reflective-matched FBG scheme. Sensors 2015, 15, 16516–16535. [Google Scholar] [CrossRef] [PubMed]
- Miao, Y.-P.; Liu, B.; Zhao, Q.-D. Refractive index sensor based on measuring the transmission power of tilted fiber Bragg grating. Opt. Fiber Technol. 2009, 15, 233–236. [Google Scholar] [CrossRef]
- Miao, Y.; Liu, B.; Zhang, W.; Dong, B.; Zhou, H.; Zhao, Q. Dynamic temperature compensating interrogation technique for strain sensors with tilted fiber Bragg gratings. IEEE Photonics Technol. Lett. 2008, 20, 1393–1395. [Google Scholar] [CrossRef]
- González-Vila, A.; Kinet, D.; Mégret, P.; Chaucheteur, C. Narrowband interrogation of plasmonic optical fiber biosensors based on spectral combs. Opt. Laser Technol. 2017, 96, 141–146. [Google Scholar] [CrossRef]
- Oliveira, R.; Osório, J.H.; Aristilde, S.; Bilro, L.; Nogueira, R.N.; Cordeiro, C.M.B. Simultaneous measurement of strain, temperature and refractive index based on multimode interference, fiber tapering and fiber Bragg gratings. Meas. Sci. Technol. 2016, 27, 075107. [Google Scholar] [CrossRef]


© 2019 by the authors. Licensee MDPI, Basel, Switzerland. This article is an open access article distributed under the terms and conditions of the Creative Commons Attribution (CC BY) license (http://creativecommons.org/licenses/by/4.0/).