Article

Modeling the Output Performance of Al0.3Ga0.7As/InP/Ge Triple-Junction Solar Cells for a Venus Orbiter Space Station

Theoretical Physics Division, Department of Physics, Bogor Agricultural University, Jalan Meranti Kampus IPB Dramaga, Bogor 16680, Indonesia
*
Author to whom correspondence should be addressed.
Photonics 2019, 6(2), 46; https://doi.org/10.3390/photonics6020046
Submission received: 1 March 2019 / Revised: 16 April 2019 / Accepted: 25 April 2019 / Published: 27 April 2019

Abstract

:
The performance of Al0.3Ga0.7As/InP/Ge triple-junction solar cells (TJSC) at the geosynchronous orbit of Venus had been simulated in this paper by assuming that the solar cells were put on a hypothetical Venus orbiter space station. The incoming solar radiation on TJSC was calculated by a blackbody radiation formula, while PC1D program simulated the electrical output performance. The results show that the incoming solar intensity at the geosynchronous orbit of Venus is 3000 W/m2, while the maximum solar cell efficiency achieved is 38.94%. Considering a similar area of the solar panel as the International Space Station (about 2500 m2), the amount of electricity produced by Venus orbiter space station at the geosynchronous orbit of Venus is 2.92 MW, which is plenty of energy to power the space station for long-term exploration and intensive research on Venus.

1. Introduction

Space exploration and the human effort to find a new place to live in the outer space has never been weakened since the dawn of NASA in 1958. The observation and exploration of Mars, Europa, Enceladus or even Gliese 581 g are some of the highlights in our effort to find a new habitable place in the future. Comparing to Mars, which is located about 0.52 AU (Astronomical Unit) from Earth, Venus offers a less distance to Earth with only 0.28 AU. The almost similar size of Venus makes this planet sometimes called Earth’s twin and sheds some hopes for future human colonization. However, the hostile conditions of Venus’s atmosphere, which is dominated by carbon dioxide and sulfuric acid droplets, makes its surface temperature reach above 450 °C and discounts any possibility of making this planet a habitable place in the future. There is still some research considering Venus as a promising place to live done, among others, by Landis et al. [1,2,3,4,5,6,7]. Even US National Academies of Science Space Studies placed Venus exploration as one of the highest priorities for medium-class future missions [8]. Landis et al. proposed some ideas to intensively studying Venus by using a solar airplane, sending a robotic exploration of the surface and atmosphere of Venus [3,5,6,9,10,11,12,13]. Based on the fact that the upper atmosphere of Venus at an altitude of 50 km has similar pressure, gravity, density, and radiation protection to that of the Earth, NASA had proposed a High-Altitude Venus Operational Concept (HAVOC) project to conduct a 30-day crewed mission into Venus atmosphere. Although this project is no longer active, more ideas and refinement to this conceptual mission are still ongoing [14,15]. Japan has also shown interest in studying Venus by sending a Venus Climate Orbiter (VCO) in the year of 2010 [16] to intensively study the climate of Venus. In 2015, Japan Aerospace Exploration Agency (JAXA) discovered a new phenomenon called the Venusian equatorial jet, a strong wind in the low and middle cloud layer (45 to 60 kilometers of altitude) of Venus atmosphere [17].
To conduct a continuous and intensive study on Venus exploration, we propose the development of an ISS-like station (ISS stands for the international space station) dedicated to studying Venus. Having this IVOSS (international Venus orbiter space station), more intensive research and missions can be deployed to this planet, including the one proposed by Landis et al. [3,9]. To power this hypothesized space station, a high-efficiency solar cell based on the combination of III-V groups solar cells like GaInP, GaInAs, AlGaAs, InP, and GaAs might be used in the form of multijunction solar cells (MJSC). The unique electronic structure of III-V based materials had long been known to have a wide range of applications, such as in quantum wells LED [18,19,20,21,22,23], laser [24], sensors [25], and also solar cells [26,27,28,29,30,31]. Those III-V groups solar cells are known for their ability to withstand harsh conditions in the outer space, such as energetic particles and high temperature [32,33,34,35].
The MJSC is an arrangement of several p-n junctions of semiconducting materials which are stacked following the order of their bandgap energies. The highest bandgap material is put on top while the lowest in the bottom. This arrangement will minimize the spectrum loss and increase the efficiency of MJSC as compared to a single junction solar cell. The typical MJSC on Earth’s surface can produce above 30% efficiency under one sun solar radiation and almost approaching 50% when exposed to several hundreds of times of solar radiation by using solar concentrators [36,37,38]. The closer distance of Venus to the sun will ensure more power produced by the IVOSS’s solar panels at this position as compared to the Earth’s geosynchronous orbit. The most common solar cells used for the space application is GaAs which can produce efficiency of up to 22.08% [39], while InGaP/GaAs/InGaAs TJSC can deliver 37.9% efficiency [40]. For the latest development and high-efficiency record of MJSC especially for the space application, one can refer to Reference [41].
In this paper, we simulate the performance of Al0.3Ga0.7As/InP/Ge TJSC for the application in the hypothetical IVOSS space station. The selection of Al0.3Ga0.7As compound as a first subcell was based on its higher energy gap (1.817 eV) which allows more spectral energy to be absorbed by MJSC. Most of the experimental and modeling reports were based on GaInAs and GaInP ternary compounds and they rarely discussed the AlGaAs based solar cell [42,43,44,45]. This paper was intended to broaden our perspective in terms of material selection and its consequence to the total efficiency of MJSC, especially for the extra-terrestrial application. The simulation was done using an ideal (toy) model in which each subcell was simulated independently without considering the tunnel junction between each subcell. The solar cell in this simulation is assumed to be an array of the multi-homo-junction solar cell in which the p and n-type of each subcell were made from the same material. A similar schematic model has been used by other researchers, such as Reference [46,47]. The temperature of each subcell was held constant in this simulation (at T = 25 °C) by assuming that the solar panels were equipped with a temperature control system, such as in Reference [48,49]. The effect of cosmic radiation was also not taken into account in this simulation. The IVOSS was positioned at the geosynchronous orbit of Venus and cleared from the atmospheric blanket of Venus so that the ideal blackbody radiation formula could approximate the incoming radiation. The performance of TJSC at the geosynchronous orbit of Venus will be compared to its performance at the geosynchronous orbit of Earth.
Since this paper emphasizes the simulation approach of MJSC, we do not discuss the specific fabrication technique of MJSC. We assume that Al0.3Ga0.7As/InP/Ge has a similar fabrication technique as other III-V MJSC, such as GaP/InGaAs/InGaSb [50] where the IMM (inverted metamorphic multi-junction solar cells) concept is applied. The growing of subcells in the IMM concept is started from the top to the bottom-cell using the MOCVD (metal organic chemical vapor deposition) technique [47] and can produce a 34.2% efficiency in space application [51]. Various fabrication techniques, such as molecular beam epitaxy (MBE), were able to fabricate InGaAs/GaAs quantum dot solar cell [52] and InGaP/GaAs/GaInAs monolithic tandem solar cell [53].

2. Materials and Methods

The incoming solar radiation to MJSC was prepared by calculating the spectral irradiance using the blackbody radiation formula. The response of each junction (subcell) and the amount of the transmitted radiation were calculated using the absorption coefficient formula and the Berr–Lambert’s-like equation. Finally, the electric power produced by each subcell was simulated using PC1D program. The PC1D program solves the highly nonlinear transport equation of electron (and hole) in a semiconductor device by discretizing the equation using the finite element method (FEM). The Poisson equation consisting of the spatial-dependence of local quasi-Fermi potential, conductivity and current density at each node were linearized iteratively and solved by matrix inversion method until it reached the convergence. [54].
The distance Rsvg is the distance from the center of the sun to the geosynchronous orbit of Venus, and defined as:
R s v g = R s v R v g
where Rsv is the distance between the center of the sun to the center of Venus (Rsv = 1.0748 × 10¹¹ m), and Rvg is the distance between the center of Venus to its geosynchronous orbit (Rvg = 1.5372 × 10⁹ m). The schematic of distances is shown in Figure 1.
The surface temperature of the sun was set to T = 6000 K. The incoming spectral irradiance (the radiation intensity divided by the wavelength) of blackbody radiation received by the IVOSS in Venus geosynchronous orbit is expressed as:
I 0 ( λ , T ) = 2 π h c 2 λ 5 ( 1 exp ( h c / λ k B · T ) 1 ) · ( r s R s v g ) 2
where rs is the diameter of the sun, λ is the radiation wavelength, h is Planck’s constant (h = 6.626 × 10⁻³⁴ J.s), and kB is the Boltzmann’s constant (kB = 1.38 × 10⁻²³ J/K). By integrating the whole spectrum, the total power density (the entire area under the I(λ) vs. λ curve) at a particular distance from the sun can be found. The same formula was also used to calculate the incoming spectral irradiance received in Earth’s geosynchronous orbit by modifying all the distance parameters in Equation (2).
For a terrestrial application on Earth, plenty of accurate spectral irradiance data, such as AM1.5G and AM1.5D, can be utilized. However, the actual/experimental data on solar radiation intensity at the geosynchronous orbit of Venus to the best of authors’ knowledge are not readily available. The High Altitude Venus Operational Concept (HAVOC) project by NASA [15] calculated that the solar intensity at the altitude of 50 km from the Venus surface is around 1.42 kW/m2. This value is smaller as compared to the blackbody calculation at the geosynchronous orbit of Venus located at a distance of about 115 times of the Venus radius. The amount of electric power gained by the space station at the geosynchronous orbit of Venus can be calculated via a simple blackbody radiation formula.
The coefficient of absorption of each subcell was calculated using Equation (3) following Reference [55]:
α ( λ ) = 5.5 ( E E g ) + 1.5 E ( E g + 0.1 ) μ m 1 ,
where α(λ) is the coefficient absorption as a function of the wavelength, Eg is the bandgap energy of the corresponding junction and E is the incoming photon energy at a particular wavelength. Once we have the spectral irradiance, we can input this to PC1D with several additional steps. There are several options in preparing the solar radiation input in PC1D program, through the internal source (monochromatic or blackbody radiation) or the external source. In this paper, we will use the external radiation source obtained from the calculation of blackbody radiation at the geosynchronous orbit of Venus and Earth in Equation (2). Those external spectrums must be saved in *.spc format and have two columns of data, the wavelength and power density F(λ) (in W/m2). The amount of data read by PC1D program only limited to 200 rows, therefore for more than 200 pieces of data we have to average the input data by following the scheme as seen in Figure 2. As an example, to average three subsequent data, the interval of ith wavelength is defined as,
Δ λ i = ( λ i + 1 λ i 1 ) q
while the ith power density is, and q is the number data segment considered in the particular range (in the case above q = 2),
F ( λ i ) = ( ( F ( λ i + 1 ) + F ( λ i 1 ) ) q
The intensity of the ith data is,
I i = Δ λ i × F ( λ i )
and the corresponding wavelength λi is
λ i = ( λ i + 1 ) + ( λ i 1 ) q
For this TJSC simulation, the wavelength spans from 112 nm to 2500 nm with 1.00 nm data increment. There is a maximum limit of 200 pieces of data to be included in PC1D program, so in our simulation, we have to average every 13 pieces of data to become a single piece of data of λ vs. I(λ).
The incoming intensity to the nth subcell, In depends on the amount of the previous solar radiation In−1, the thickness of the previous subcell dn−1, and the absorption coefficient of the previous subcell αn−1(λ), following Equation (4):
I n ( λ ) = I n 1 ( λ ) · e α n 1 ( λ ) · d n 1 ;   n = 1 ,   2 ,   3   for   triple   junction   solar   cells
With α0 = 0 and d0 = 0 representing the open space (vacuum), medium and I0 is obtained from Equation (2). The thickness of the nth cell, dn was calculated using the PC1D program. Since this program can only simulate one layer at a time, several simulations depending on the number of junctions involved must be performed. For each set of simulation, the electrical performance of the TJSC in the form of the short circuit current (ISC), the open circuit voltage (VOC) and the output power of each subcell (Pn) was recorded. The total efficiency (η) of a mechanically-stacked TJSC was calculated by summing up all electric power produced by each subcell:
η = ( P 1 + P 2 + P 3 P 0 ) × 100 %
To analyze the individual performance of each subcell, we also define some terms, i.e., relative efficiency (ηn) and relative loss (Ln) of each subcell:
η n = P n P 0 n × 100 %
L n = P n _ a b s P n P 0 n × 100 %
where Pn is the electric power produced by the nth subcell, and Pn_abs is the absorbed power of the nth subcell, and P 0 n is the incoming power at nth subcell ( P 0 n = I n · A ) with A is the area of the solar cell. The fill factor (FF) of each subcell was calculated via the formula below,
F F n = P n V n o c · I n s c
where Vnoc and Insc is the open circuit voltage and the short circuit current of the nth subcell, respectively.
The intensity (or power) distribution in each subcell follows this relation below,
I a b s = I o u t + I d i s s I a b s = I o u t + I d i s s
In which the subscript labels denote incoming, absorbed, transmitted, output, and dissipated intensity, respectively.

3. Results and Discussions

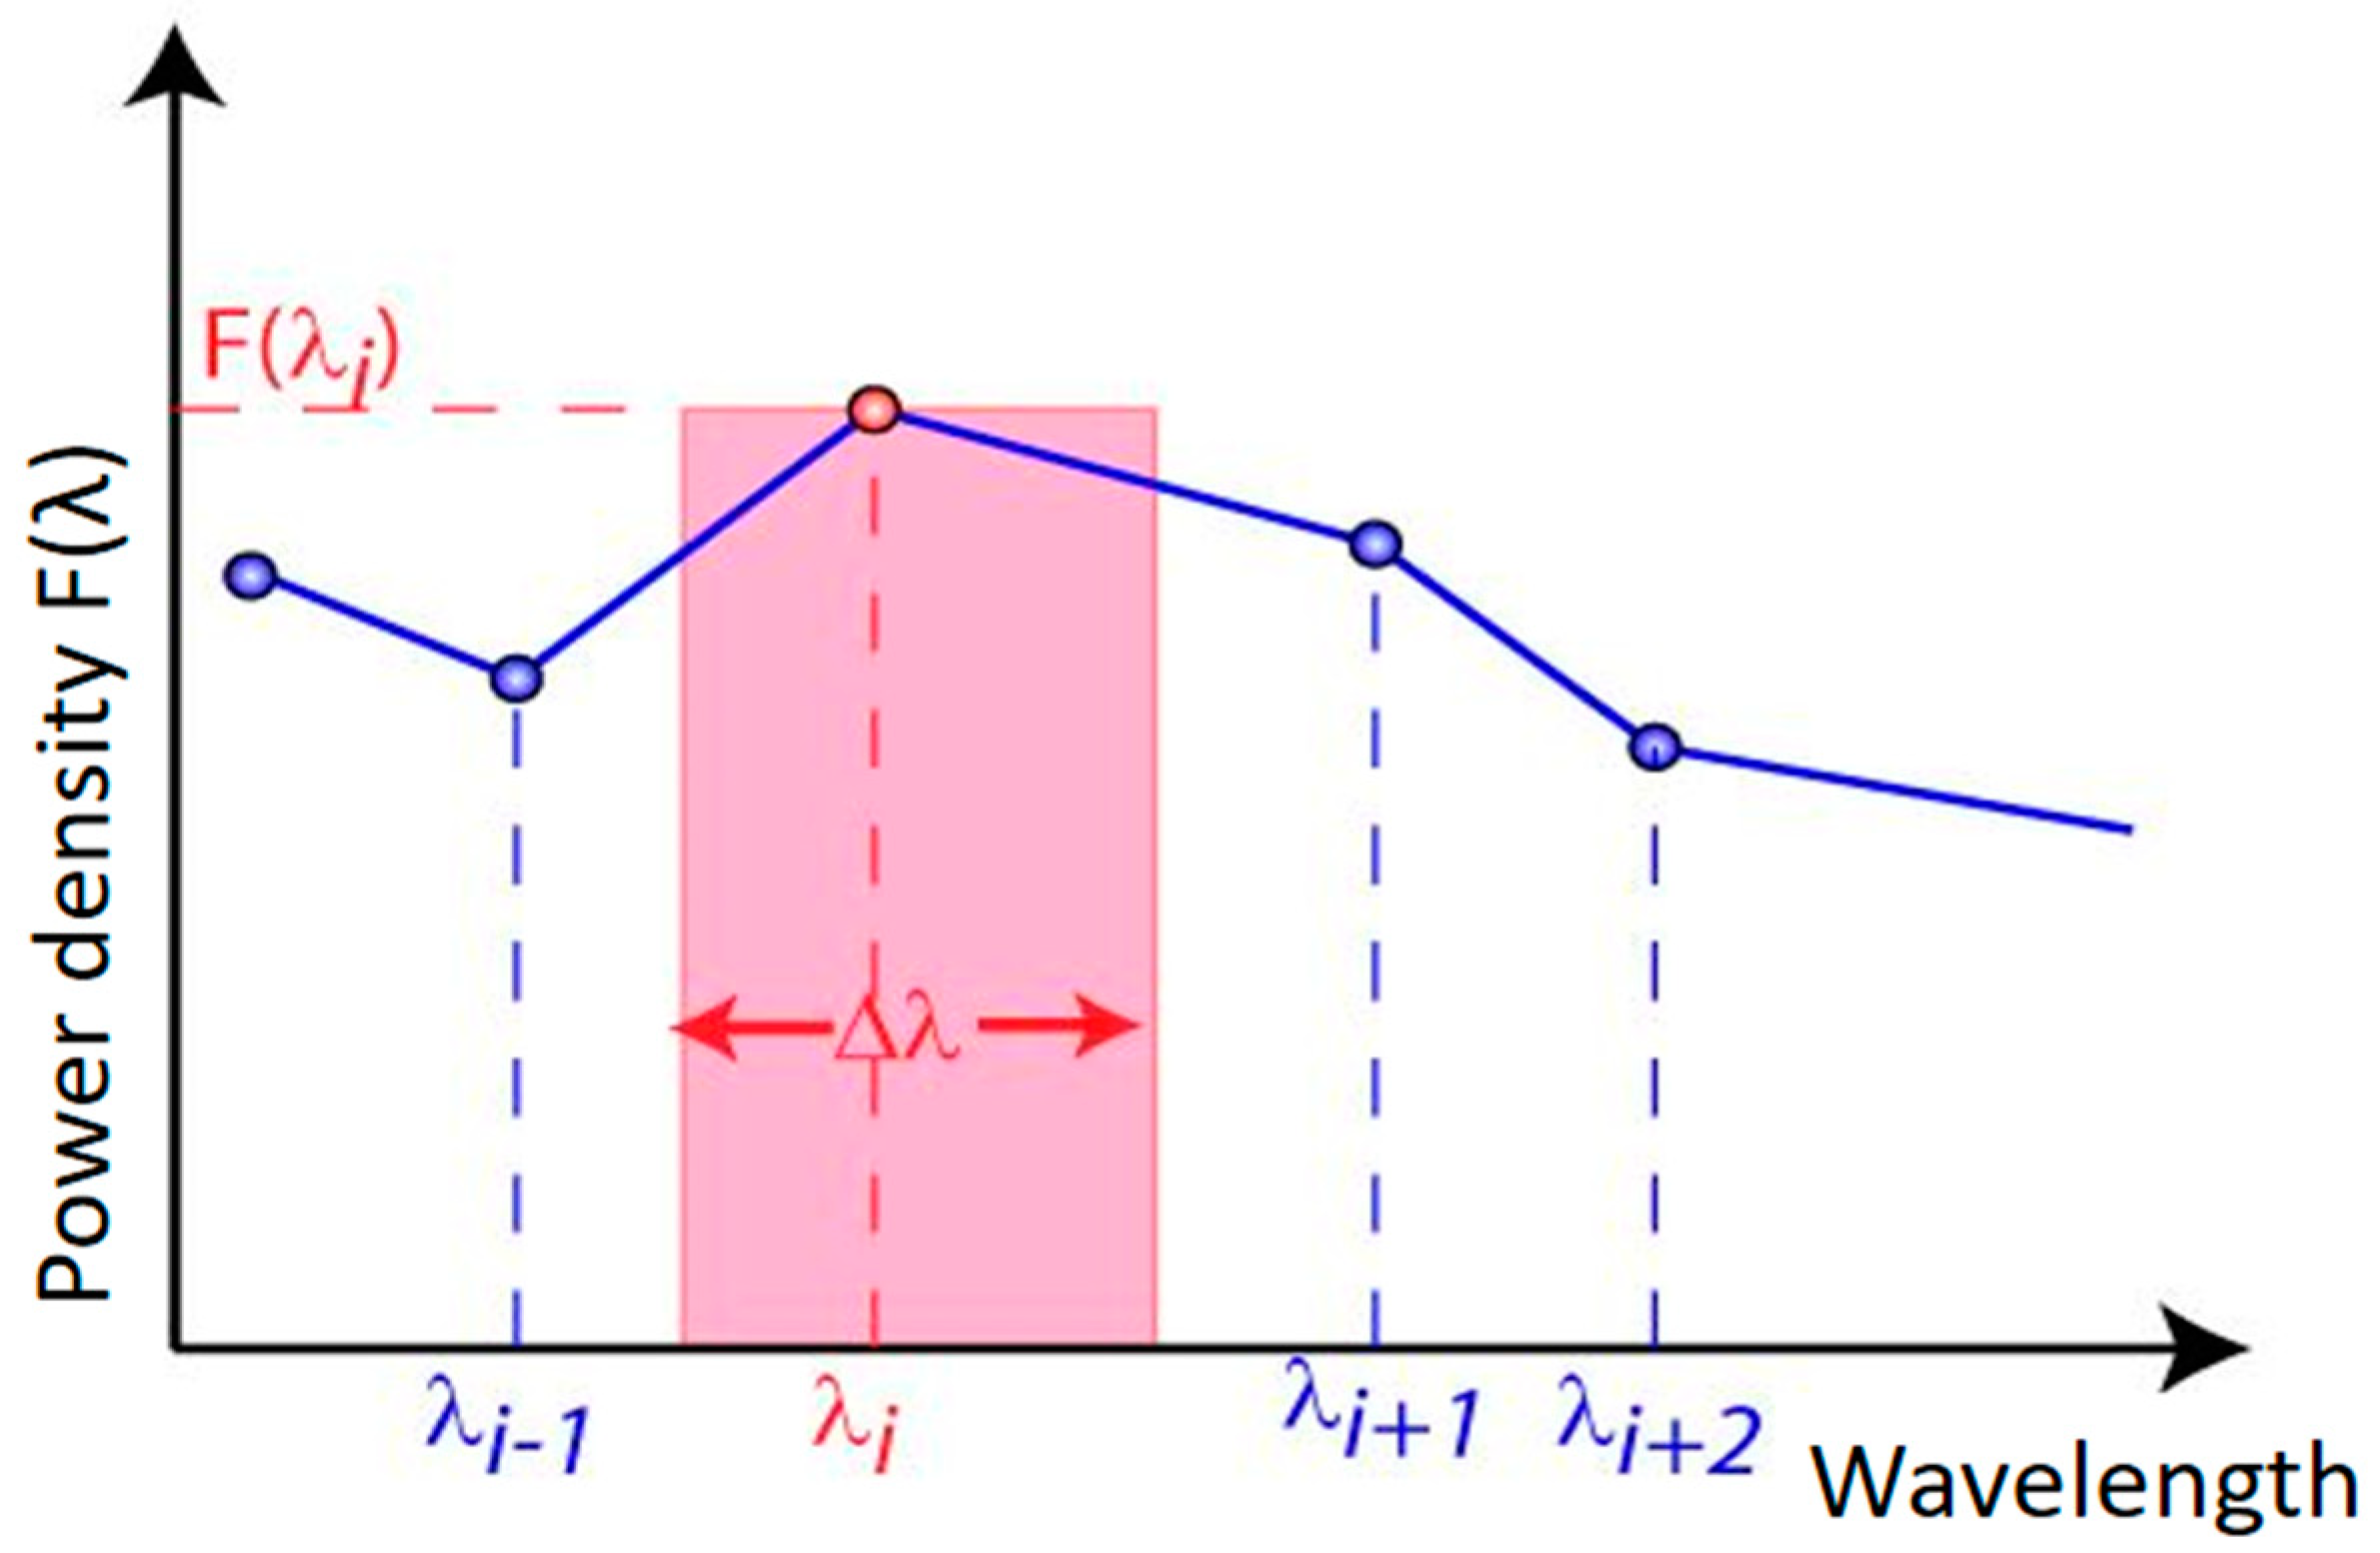
3.1. The Solar Radiation Spectrums

The spectrum of incoming radiation (blackbody approximation) on the geosynchronous orbit of Venus and Earth were shown in Figure 3. The total power density (intensity) as calculated by Equation (6) on the geosynchronous orbit of Venus is 3000 W/m2 and for Earth’s geosynchronous orbit is 1557 W/m2. If it is assumed that IVOSS has the same solar panel area as ISS has, which is around 2500 m2, the total potential of solar energy available at the geosynchronous orbit of Venus is about 7.50 MW, which is plenty of energy to power the space station.
The transmitted radiation to the next subcell depends on the absorption coefficient and the optimum thickness of the solar cell’s materials. The first subcell, Al0.3Ga0.7As, absorbs the solar radiation from 112 nm up to its cut-off wavelength of 645 nm. The second subcell, InP, absorbs the radiation in the medium wavelength region up to 868 nm, and the last subcell, Ge, works in the long wavelength region up to 1765 nm.

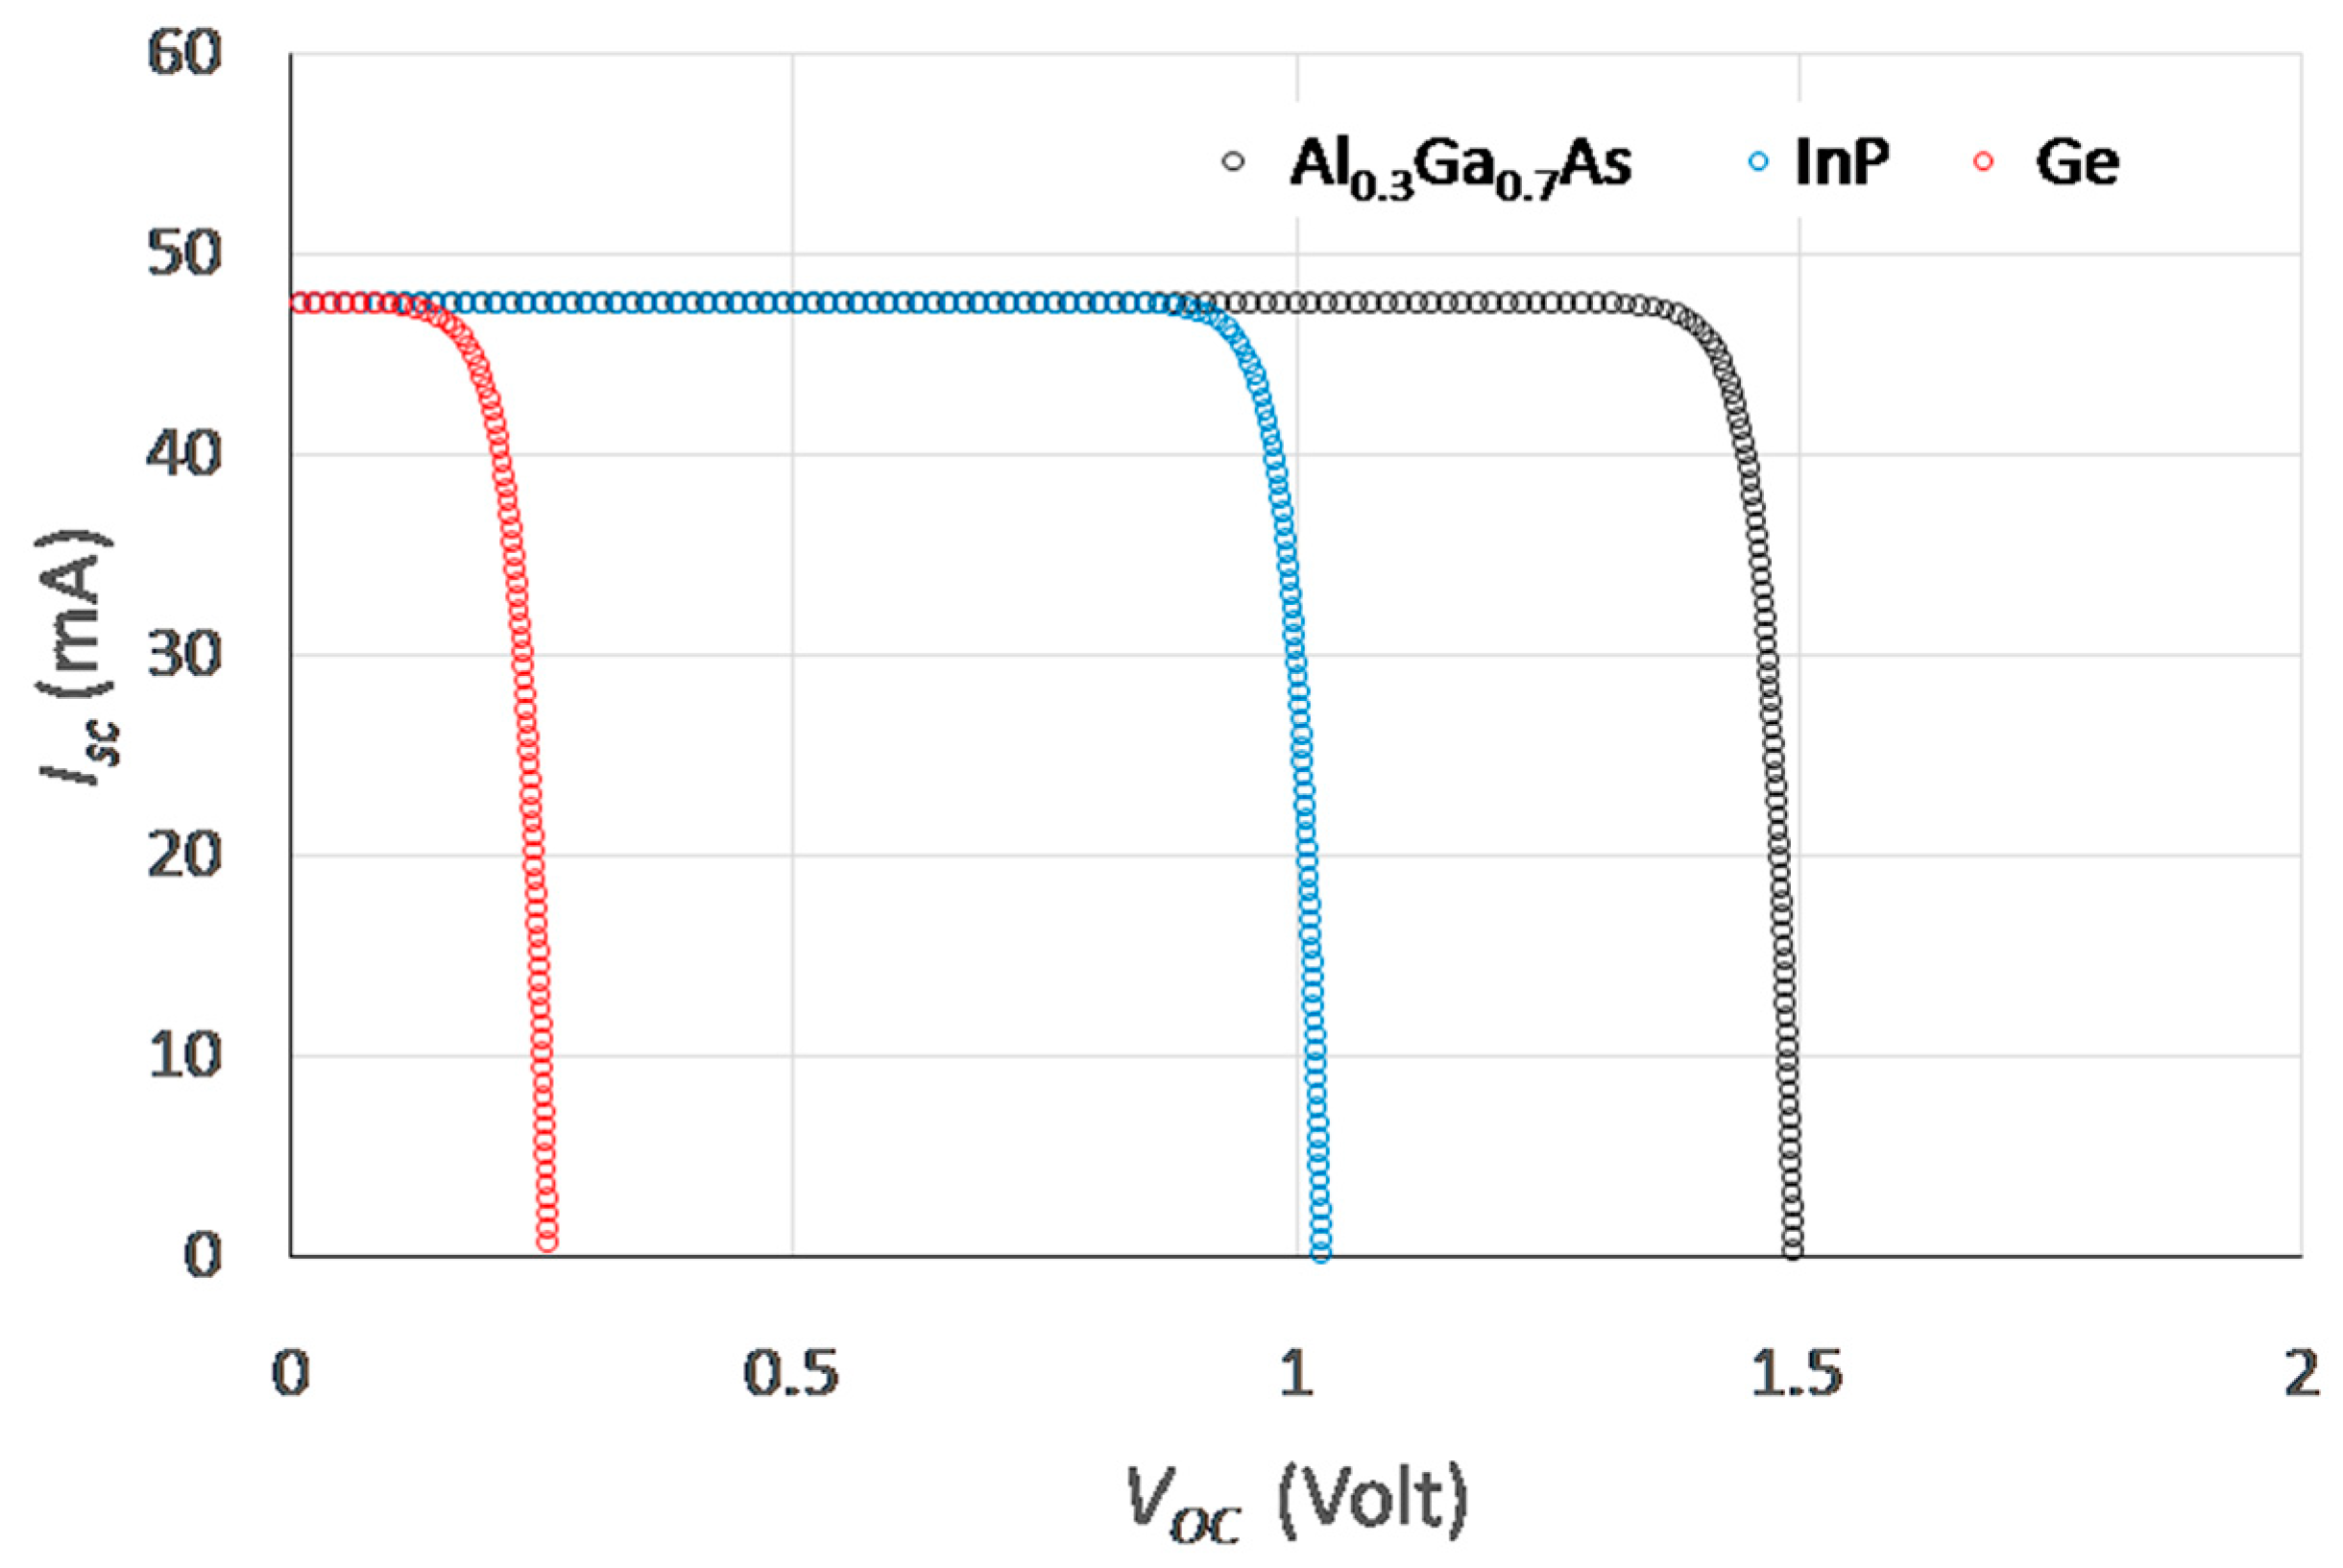
3.2. Simulation of the Performance of the Solar Cells at the Geosynchronous Orbit of Venus

The power producing simulations were performed by using the PC1D program using a series connection model of subcells. By maintaining the same amount of current in each subcell, the optimum value of subcell’s thickness and the amount of doping were optimized by the quick batch mode in PC1D program. The input parameters for PC1D program are shown in Table 1. The thickness of the subcell grows as we move from the first to the third subcell. The first subcell is the thinnest (2.889 μm for Al0.3Ga0.7As) as compared to other subcells due to plenty of solar radiation received by this subcell. The next subcells, on the other hand, must be thicker (4.222 μm for InP and 15.56 μm for Ge) to absorb as much transmitted radiation as possible. The thickness of the subcells in this simulation is comparable to the result of other III-V MJSC (GaP/InGaAs/InGaSb) by Reference [50] where the cumulative (emitter and base) thickness of the first, second and third subcell are 10.35 μm, 4.55 μm, and 14.20 μm, respectively. The n-doping dominates the carrier concentration of each subcell in the TJSC since the electron plays the role of a charge carrier. The n and p-doping density in this simulation are also within the same range (1017 to 1019) as Reference [50].
The simulation results on the spectral and electrical performance of TJSC are shown in Table 2. For simplicity, the unit of intensity in this table was mW/cm2 (not W/m2), since the area of the subcell in the PC1D simulation was set to 1.0 cm2. For the first subcell, the incoming radiation is 300 mW/cm2, with 136.18 mW/cm2 is absorbed and 163.82 mW/cm2 (54.61%) is transmitted to the next subcell. About 65 mW of electricity is produced in each cm2 area of the first subcell (21.67% relative efficiency as compared to the incoming radiation on the first subcell). The dissipated energy in the first subcell is 71.18 mW (23.73% relative energy loss). Therefore, the amount of electric power produced in the first subcell is slightly smaller than the energy loss. In the second subcell, the incoming radiation power received is 163.82 mW/cm2, of which 60.08 mW/cm2 is absorbed and 103.74 mW/cm2 (63.32%) is transmitted to the third subcell. The electric power produced by the second subcell is 43.4 mW (about 26.49% relative efficiency), while the energy loss is only 15.48 mW (9.45% relative loss). The amount of electric power produced by the second subcell is bigger (by a factor of 2.8) than the energy loss. In the third subcell, the incoming solar radiation intensity is 103.74 mW/cm2. Most of the incoming solar intensity in the third subcell will be passed to the air (84.2 mW or about 81.16%) and only 18.84% absorbed. The absorbed power in 1.0 cm2 is 19.54 mW, and only 8.42 mW of electric power produced (8.12% of relative efficiency), while 11.12 mW will be dissipated (10.72% relative energy loss). The total efficiency of the Al0.3Ga0.7As/InP/Ge TJSC in geosynchronous orbit of Venus is 38.94%. This amount of efficiency is within the range of some recent results on III-V group multijunction solar cells [30,37,56,57,58,59]. The maximum power gained in 1.0 m2 solar panel at Venus’s geosynchronous orbit is 1168.2 W. By assuming the total area of solar panel of IVOSS is similar to ISS, which is around 2500 m2, the amount of power produced by Al0.3Ga0.7As/InP/Ge TJSC at the geosynchronous orbit of Venus is 2.92 MW.
Based on PC1D optimization, the amount of current flows in a series connected subcells is 47.7 mA, while the open circuit voltage VOC in the first subcell is bigger than in the second subcell and the third subcell. Almost similar current is found in a CuInGaSe (CIGS) based solar cell [60] applied in space application. The VOC of the second subcell and the third subcell is only 68.87% and 17.09% of the first subcell, respectively. This gradation of VOC is expected, as those voltages are related to the amount of electrical power produced by each subcell. The I-V diagram of Al0.3Ga0.7As/InP/Ge TJSC at the geosynchronous orbit of Venus is shown in Figure 4.

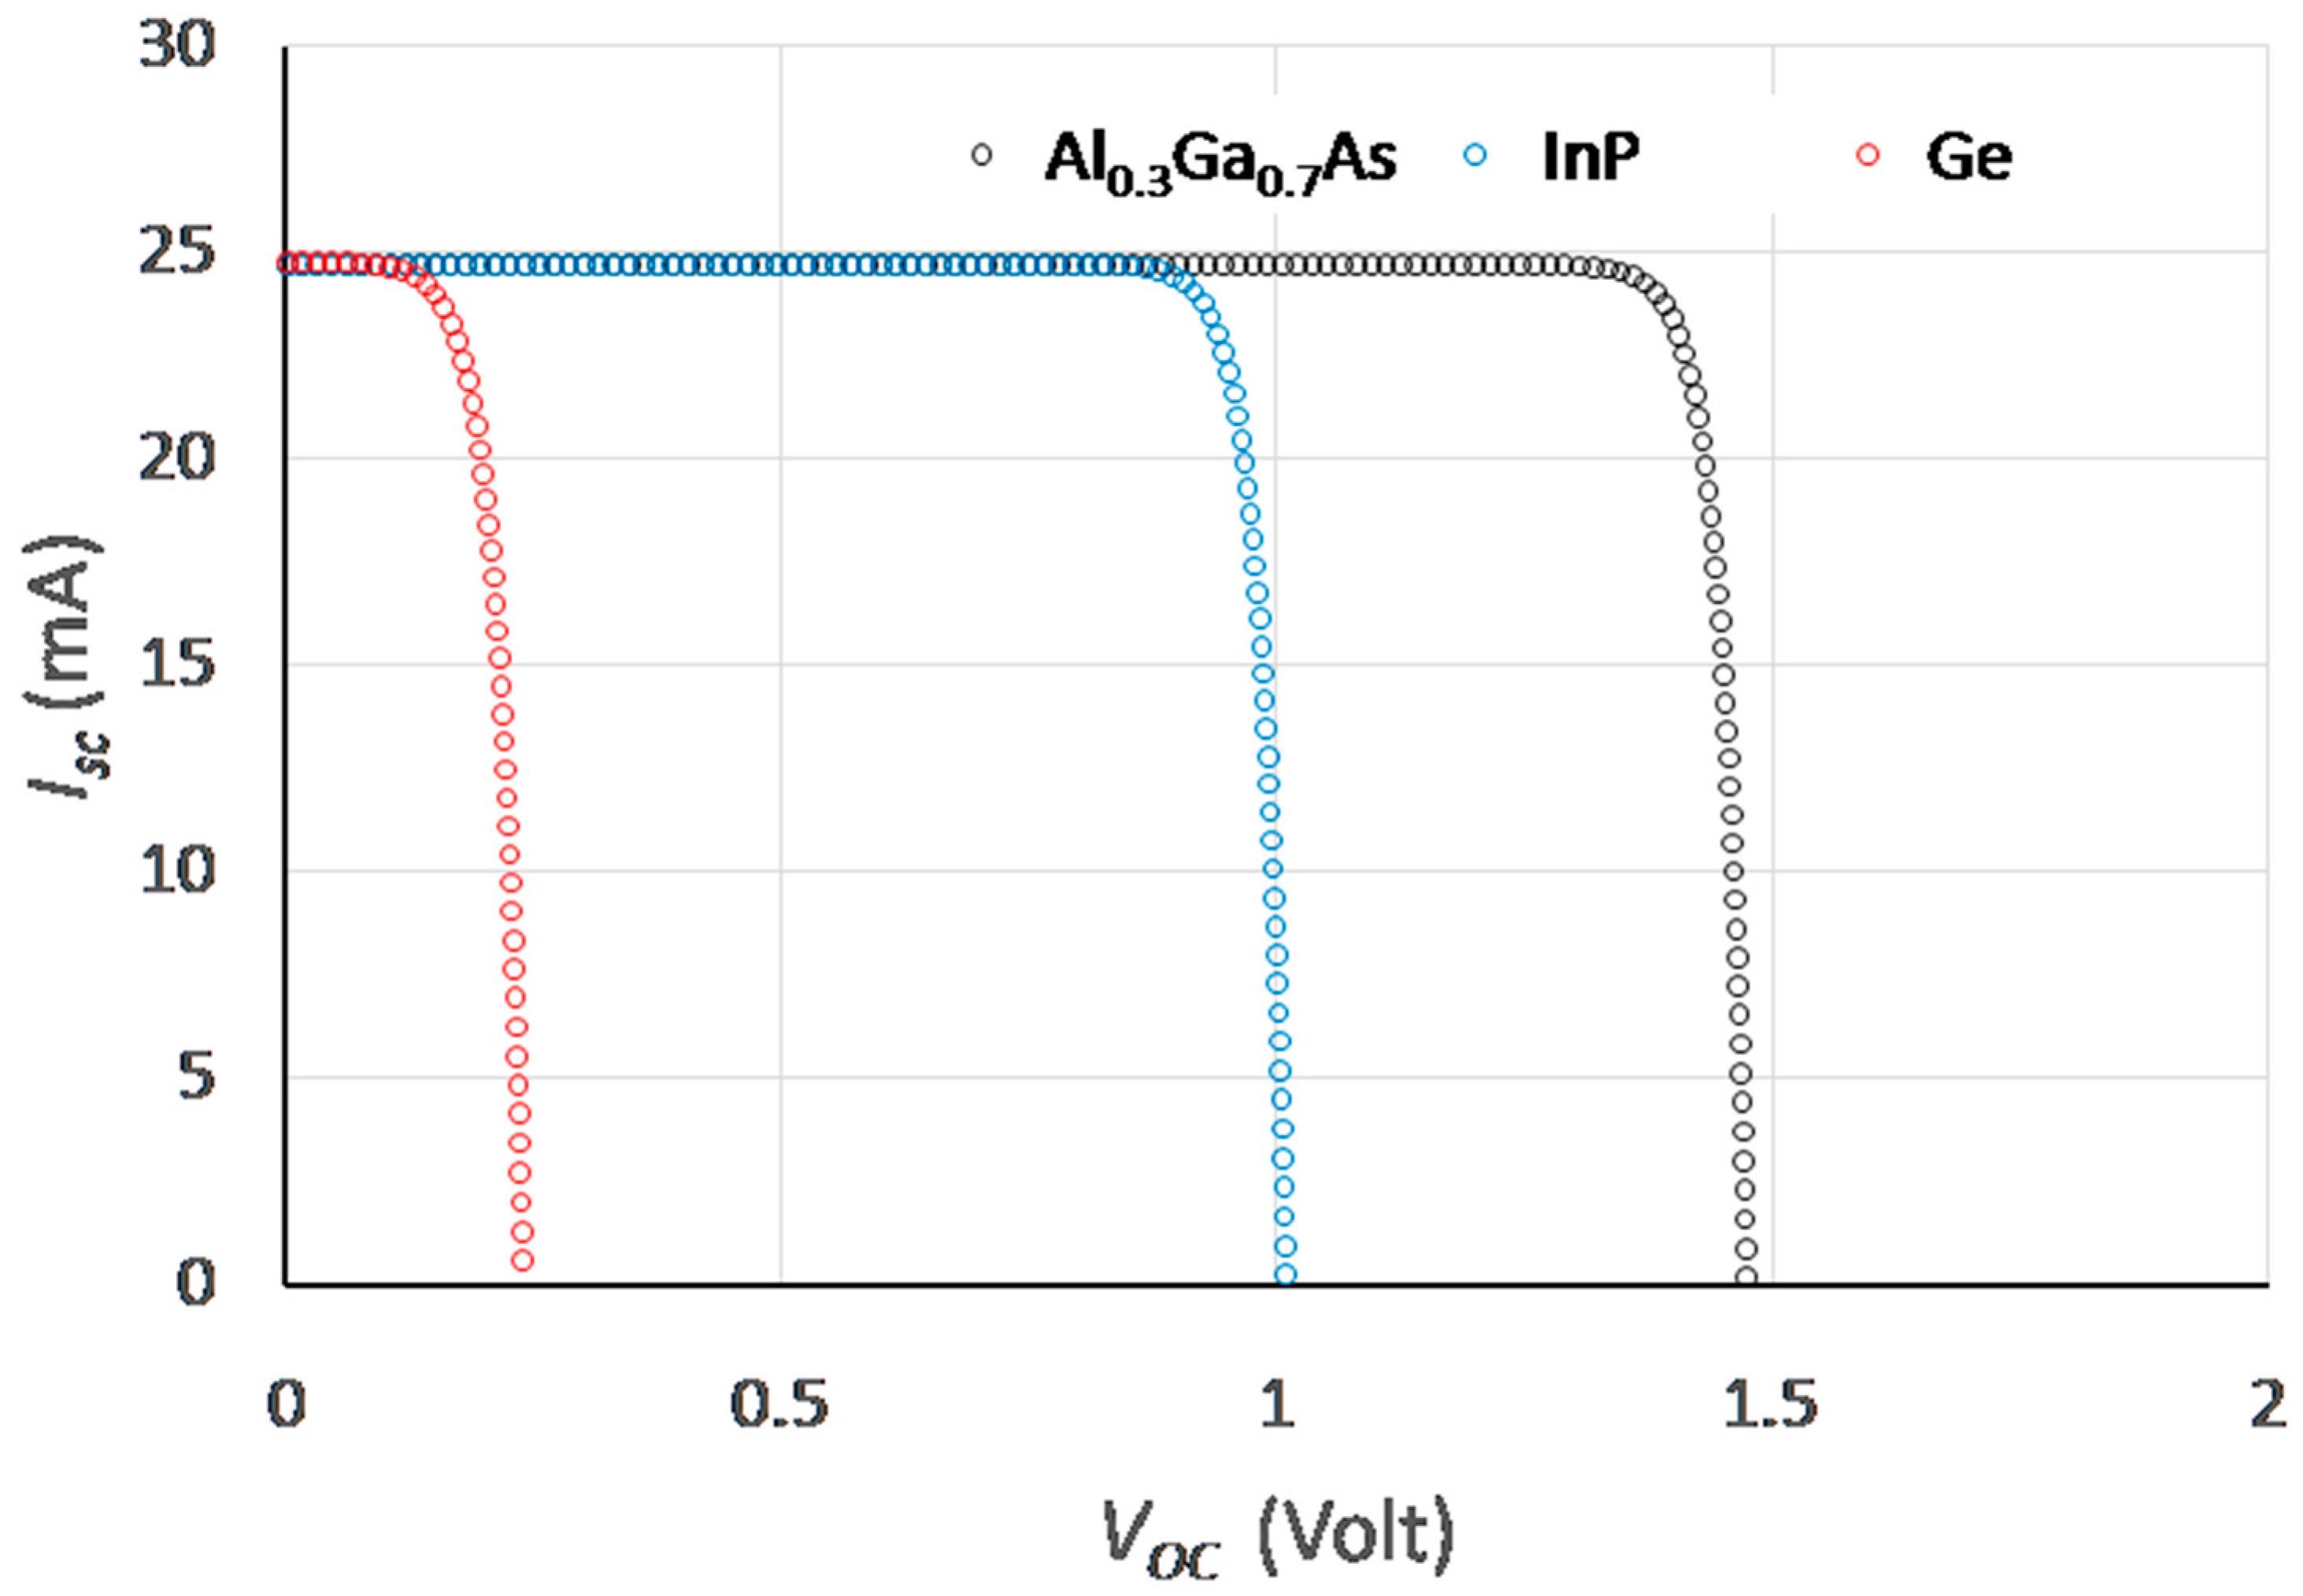
3.3. Simulation of the Performance of the Solar Cells at the Geosynchronous Orbit of Earth

The same procedure of current producing simulation using PC1D program was done for solar cells application at the geosynchronous orbit of Earth. The same input parameter set up as in Table 1 (bandgap, thickness, and p and n doping density) is also used in this simulation, and the only difference is the input spectral irradiance. The simulation results on the spectral and electrical performance of TJSC at the geosynchronous orbit of Earth are shown in Table 3. Since the distance of this orbit to the sun is further as compared to the geosynchronous orbit of Earth, the amount of solar radiation and the electric power produced in this condition is smaller. The first subcell receives 155.7 mW of solar radiation power for every 1.0 cm2 of the panel area and produces a 33.3 mW of electric power (about 21.39% of relative efficiency). The dissipated power in the first subcell is 37.4 mW (24.02% relative loss of power), while the transmitted power to the second subcell is 85 mW (54.6% of the incoming intensity to the first subcell). Similar to the case of Venus’s geosynchronous orbit, the amount of electric power produced by the first subcell in Earth’s geosynchronous orbit is slightly smaller than the relative energy loss. In the second subcell, the electric power generated is 22.10 mW (26% of relative efficiency), while the dissipated power is 9.05 mW (about 10.6% relative loss). The amount of electric power produced by the second subcell is bigger (by a factor of 2.4) than the energy loss. The amount of transmitted power to the third subcell is 53.85 mW, about 63.35% of the incoming intensity at the second subcell. The electric power produced by the third subcell is 4.0 mW (about 7.4% relative efficiency), while the dissipated power is 6.13 mW (about 11.4% relative loss). The amount of the transmitted power from the third subcell to free space is 43.72 mW, approximately 81.19% of the incoming intensity at the third subcell. The total efficiency of the Al0.3Ga0.7As/InP/Ge TJSC at the geosynchronous orbit of Earth in this simulation is 38.15%. The similar amount of power efficiency of Al0.3Ga0.7As/InP/Ge TJSC in both orbital conditions might come from the fact that in both cases the only variable is the amount of incoming solar radiation. For 1.0 m2 solar panel at the geosynchronous orbit of Earth, the maximum power gained is about 594 W.
The amount of current flows in a series connected subcells in Earth’s geosynchronous orbit is 24.8 mA. A comparable result of ISC is also found in GainAsP/InGaAs MJSC as a consequence of current-limiting behavior of subcell as shown by its non-zero slope of I-V curve near the short-circuit current [61]. The open circuit voltage VOC in the first subcell is bigger than in the second subcell and the third subcell. The VOC of the second subcell and the third subcell are only 68.59% and 16.14% of VOC of the first subcell respectively. The gradation of VOC in the Earth’s geosynchronous orbit is similar to Venus’s geosynchronous orbit condition since those voltages are related to the amount of electric power produced by each subcell. The I-V diagram of Al0.3Ga0.7As/InP/Ge TJSC is shown in Figure 5.

4. Conclusions

We have ideally simulated the performance of Al0.3Ga0.7As/InP/Ge triple-junction solar cells for an application in a hypothetical International Venus Orbiter Space Station (IVOSS). Although the simulation parameters here are ideal compared to experimentally achievable results, we find that Al0.3Ga0.7As/InP/Ge TJSC could reach 38.94% power efficiency and can produce 2.92 MW of electricity to power this space station (assuming a 2500 m2 of solar panel area). As a comparison, we also showed that the same TJSC (with the same parameter simulation) applied to a space station at the geosynchronous orbit of Earth only produces 1.48 MW of electric power. The vast amount of electricity produced by Al0.3Ga0.7As/InP/Ge TJSC in Venus geosynchronous orbit condition opens up an opportunity to conduct long-term and intensive research on Venus in the future.

Author Contributions

Conceptualization, T.S. and H.S; methodology, A.S., P.F.; software, T.S., H.S.; validation, T.S., A.S., H.S.; formal analysis, T.S., P.F.; investigation, P.F., A.S.; resources, T.S., H.S.; data curation, H.S., A.S.; writing—original draft preparation, T.S.; writing—review and editing, T.S., P.F., A.S., H.S.; visualization, P.F., T.S.; supervision, T.S., H.S.

Funding

This research received no external funding.

Acknowledgments

Authors express their gratitude to the Department of Physics, Faculty of Mathematics and Natural Sciences, Bogor Agricultural University for their Computational Laboratories support.

Conflicts of Interest

The authors declare no conflict of interest.

References

  1. Landis, G.A. Exploring Venus by Solar Airplane. Available online: https://aip.scitation.org/doi/abs/10.1063/1.1357898 (accessed on 26 April 2019).
  2. Landis, G.A.; Harrison, R. Batteries for Venus Surface Operation. J. Propuls. Power 2010, 26, 649–654. [Google Scholar] [CrossRef]
  3. Landis, G.A.; Colozza, A.; LaMarre, C.M. Atmospheric Flight on Venus. In Proceedings of the 40th Aerospace Sciences Meeting and Exhibit, Reno, NV, USA, 14–17 January 2002. [Google Scholar]
  4. Schmidt, G.R.; Landis, G.A.; Oleson, S.R. Human exploration using real-time robotic operations (HERRO): A space exploration strategy for the 21st century. Acta Astronaut. 2012, 80, 105–113. [Google Scholar] [CrossRef]
  5. Benigno, G.; Hoza, K.; Motiwala, S.; Landis, G.A.; Colozza, A.J. A Wind-powered rover for a low-cost venus mission. In Proceedings of the 51st AIAA Aerospace Sciences Meeting including the New Horizons Forum and Aerospace Exposition, Grapevine, TX, USA, 7–10 January 2013. [Google Scholar]
  6. Landis, G.A. Robotic exploration of the surface and atmosphere of Venus. Acta Astronaut. 2006, 59, 570–579. [Google Scholar] [CrossRef]
  7. Landis, G.A. Astrobiology: The case for Venus. J. Br. Interplanet. Soc. 2003, 56, 250–254. [Google Scholar]
  8. Hunten, D.M. Venus: Atmosphere. In Encyclopedia of the Solar System; Elsevier: Amsterdam, The Netherlands, 2007; pp. 139–148. ISBN 9780120885893. [Google Scholar]
  9. Landis, G.A. Colonization of Venus. AIP Conf. Proc. 2003, 654, 1193–1198. [Google Scholar]
  10. Landis, G.A.; Lamarre, C.; Colozza, A. Venus atmospheric exploration by solar aircraft. Acta Astronaut. 2005, 56, 750–755. [Google Scholar] [CrossRef] [Green Version]
  11. Landis, G.A.; Vo, T. Photovoltaic performance in the venus environment. In Proceedings of the Conference Record of the IEEE Photovoltaic Specialists Conference, Philadelphia, PA, USA, 7–12 June 2009. [Google Scholar]
  12. Landis, G.A.; Haag, E. Analysis of Solar Cell Efficiency for Venus Atmosphere and Surface Missions. In Proceedings of the 11th International Energy Conversion Engineering Conference, San Jose, CA, USA, 14–17 July 2013. [Google Scholar]
  13. Landis, G.A.; Mellott, K.D. Stirling Cooler Designed for Venus Exploration. Available online: https://ntrs.nasa.gov/search.jsp?R=20050192311 (accessed on 26 April 2019).
  14. Jones, C.A.; Arney, D.C.; Bassett, G.Z.; Clark, J.R.; Hennig, A.I.; Snyder, J.C. High Altitude Venus Operational Concept (HAVOC): Proofs of Concept. Available online: https://arc.aiaa.org/doi/abs/10.2514/6.2015-4545 (accessed on 26 April 2019).
  15. Arney, D.C.; Jones, C.A. High Altitude Venus Operational Concept (HAVOC): An Exploration Strategy for Venus. Available online: https://arc.aiaa.org/doi/abs/10.2514/6.2015-4612 (accessed on 26 April 2019).
  16. Nakamura, M.; Imamura, T.; Ueno, M.; Iwagami, N.; Satoh, T.; Watanabe, S.; Taguchi, M.; Takahashi, Y.; Suzuki, M.; Abe, T.; et al. Planet-C: Venus Climate Orbiter mission of Japan. Planet. Space Sci. 2007, 55, 1831–1842. [Google Scholar] [CrossRef]
  17. Horinouchi, T.; Murakami, S.Y.; Satoh, T.; Peralta, J.; Ogohara, K.; Kouyama, T.; Imamura, T.; Kashimura, H.; Limaye, S.S.; McGouldrick, K.; et al. Equatorial jet in the lower to middle cloud layer of Venus revealed by Akatsuki. Nat. Geosci. 2017, 10, 646. [Google Scholar] [CrossRef] [PubMed]
  18. Zhao, H.; Liu, G.; Zhang, J.; Poplawsky, J.D.; Dierolf, V.; Tansu, N. Approaches for high internal quantum efficiency green InGaN light-emitting diodes with large overlap quantum wells. Opt. Express 2011, 19, 991–1007. [Google Scholar] [CrossRef]
  19. Lu, C.H.; Li, Y.C.; Chen, Y.H.; Tsai, S.C.; Lai, Y.L.; Li, Y.L.; Liu, C.P. Output power enhancement of InGaN/GaN based green light-emitting diodes with high-density ultra-small In-rich quantum dots. J. Alloys Compd. 2013, 555, 250–254. [Google Scholar] [CrossRef]
  20. Alfaraj, N.; Mitra, S.; Wu, F.; Ajia, I.A.; Janjua, B.; Prabaswara, A.; Aljefri, R.A.; Sun, H.; Khee Ng, T.; Ooi, B.S.; et al. Photoinduced entropy of InGaN/GaN p-i-n double-heterostructure nanowires. Appl. Phys. Lett. 2017, 16, 161110. [Google Scholar] [CrossRef]
  21. Arif, R.A.; Ee, Y.K.; Tansu, N. Polarization engineering via staggered InGaN quantum wells for radiative efficiency enhancement of light emitting diodes. Appl. Phys. Lett. 2007, 91, 091110. [Google Scholar] [CrossRef]
  22. Wang, Z.; Zhang, H.; Wen, D.; Zhao, W.; Zhou, Z. Characterization of the InGaP/InGaAs/Ge triple-junction solar cell with a two-stage dish-style concentration system. Energy Convers. Manag. 2013, 76, 177–184. [Google Scholar] [CrossRef]
  23. Sun, W.; Al Muyeed, S.A.; Song, R.; Wierer, J.J.; Tansu, N. Integrating AlInN interlayers into InGaN/GaN multiple quantum wells for enhanced green emission. Appl. Phys. Lett. 2018, 112, 201106. [Google Scholar] [CrossRef] [Green Version]
  24. Zhang, J.; Zhao, H.; Tansu, N. Effect of crystal-field split-off hole and heavy-hole bands crossover on gain characteristics of high Al-content AlGaN quantum well lasers. Appl. Phys. Lett. 2010, 97, 111105. [Google Scholar] [CrossRef]
  25. Besikci, C. III-V infrared detectors on Si substrates. In Proceedings of the Integrated Optoelectronics, San Jose, CA, USA, 13 April 2000. [Google Scholar]
  26. Nguyen, H.Q.; Chang, E.Y.; Yu, H.W.; Lin, K.L.; Chung, C.C. High-quality 1 eV In0.3Ga0.7As on GaAs substrate by metalorganic chemical vapor deposition for inverted metamorphic solar cell application. Appl. Phys. Express 2011, 4, 075501. [Google Scholar] [CrossRef]
  27. Tanabe, K.; Guimard, D.; Bordel, D.; Arakawa, Y. High-efficiency InAs/GaAs quantum dot solar cells by metalorganic chemical vapor deposition. Appl. Phys. Lett. 2012, 100, 193905. [Google Scholar] [CrossRef] [Green Version]
  28. Yamaguchi, M.; Takamoto, T.; Araki, K.; Ekins-Daukes, N. Multi-junction III–V solar cells: Current status and future potential. Sol. Energy 2005, 79, 78–85. [Google Scholar] [CrossRef]
  29. Philipps, S.P.; Dimroth, F.; Bett, A.W. High-Efficiency III-V Multijunction Solar Cells. In Practical Handbook of Photovoltaics; Academic Press: Waltham, MA, USA, 2012; pp. 417–448. ISBN 9780123859341. [Google Scholar]
  30. Essig, S.; Benick, J.; Schachtner, M.; Wekkeli, A.; Hermle, M.; Dimroth, F. Wafer-Bonded GaInP/GaAs//Si Solar Cells With 30% Efficiency Under Concentrated Sunlight. IEEE J. Photovoltaics 2015, 5, 977–981. [Google Scholar] [CrossRef]
  31. Tanabe, K. A review of ultrahigh efficiency III-V semiconductor compound solar cells: Multijunction tandem, lower dimensional, photonic up/down conversion and plasmonic nanometallic structures. Energies 2009, 2, 504–530. [Google Scholar] [CrossRef]
  32. Yamaguchi, M. Radiation-resistant solar cells for space use. Sol. Energy Mater. Sol. Cells 2001, 68, 31–53. [Google Scholar] [CrossRef]
  33. Yamaguchi, M.; Kojima, N.; Khan, A.; Takamoto, T.; Ando, K.; Imaizumi, M.; Sumita, T. Radiation-resistant and high-efficiency InGaP/InGaAs/Ge 3-junction solar cells. In Proceedings of the IEEE International Symposium on Compound Semiconductors, San Diego, CA, USA, 25–27 August 2003. [Google Scholar]
  34. Bourgoin, J.C.; De Angelis, N. Radiation-induced defects in solar cell materials. Sol. Energy Mater. Sol. Cells 2001, 66, 467–477. [Google Scholar] [CrossRef]
  35. Torchynska, T.; Polupan, G.; Zelocuatecatl, F.C.; Scherbina, E. Application of III-V Materials in Space solar cell engineering. Mod. Phys. Lett. B 2002, 15, 593–596. [Google Scholar] [CrossRef]
  36. Dimroth, F.; Grave, M.; Beutel, P.; Fiedeler, U.; Karcher, C.; Tibbits, T.N.D.; Oliva, E.; Siefer, G.; Schachtner, M.; Wekkeli, A.; et al. Wafer bonded four-junction GaInP/GaAs//GaInAsP/GaInAs concentrator solar cells with 44.7% efficiency. Prog. Photovoltaics Res. Appl. 2014, 22, 277–282. [Google Scholar] [CrossRef] [Green Version]
  37. Dimroth, F.; Tibbits, T.N.D.; Niemeyer, M.; Predan, F.; Beutel, P.; Karcher, C.; Oliva, E.; Siefer, G.; Lackner, D.; Fus-Kailuweit, P.; et al. Four-junction wafer-bonded concentrator solar cells. IEEE J. Photovoltaics 2016, 6, 343–349. [Google Scholar] [CrossRef]
  38. Sumaryada, T.; Damayanti, N.E.; Rohaeni, S.; Syafutra, H.; Irzaman; Maddu, A.; Hardhienata, H.; Alatas, H. Modeling the Thermal Response of Al0.3Ga0.7As/GaAs/Ge Multijunction Solar Cells. J. Phys. Conf. Ser. 2017, 877, 012030. [Google Scholar] [CrossRef]
  39. Moon, S.; Kim, K.; Kim, Y.; Heo, J.; Lee, J. Highly efficient single-junction GaAs thin-film solar cell on flexible substrate. Sci. Rep. 2016, 50, 229–235. [Google Scholar] [CrossRef] [PubMed]
  40. Takamoto, T.; Washio, H.; Juso, H. Application of InGaP/GaAs/InGaAs triple junction solar cells to space use and concentrator photovoltaic. In Proceedings of the IEEE 40th Photovoltaic Specialist Conference, Denver, CO, USA, 8–13 June 2014. [Google Scholar]
  41. Green, M.A.; Hishikawa, Y.; Dunlop, E.D.; Levi, D.H.; Hohl-Ebinger, J.; Yoshita, M.; Ho-Baillie, A.W.Y. Solar cell efficiency tables (Version 53). Prog. Photovoltaics Res. Appl. 2019, 27, 3–12. [Google Scholar] [CrossRef]
  42. Sumaryada, T.; Rohaeni, S.; Damayanti, N.E.; Syafutra, H.; Hardhienata, H. Simulating the Performance of Al0.3Ga0.7As/InP/Ge Multijunction Solar Cells under Variation of Spectral Irradiance and Temperature. Model. Simul. Eng. 2019, 9. [Google Scholar] [CrossRef]
  43. Sumaryada, T.; Sobirin, R.; Syafutra, H. Ideal simulation of Al0.3Ga0.7As/InP/Ge multijunction solar cells. In Proceedings of the AIP Conference Proceedings, Jatinangor, West Java, Indonesia, 7–9 May 2013. [Google Scholar]
  44. Liou, J.J. Physical models for predicting the performance of Si/Si, AlGaAs/GaAs, and Si/SiGe solar cells. Sol. Energy Mater. Sol. Cells 1993, 29, 261–276. [Google Scholar] [CrossRef]
  45. Cisneros Tamayo, R.; Torchynska, T.V.; Polupan, G.; Guerrero Moreno, I.J.; Velázquez Lozada, E.; Shcherbyna, L. Photoluminescence of InAs quantum dots embedded in AlGaAs/InGaAs quantum wells with strain reducing layer. Superlattices Microstruct. 2014, 71, 168–176. [Google Scholar] [CrossRef]
  46. Chiu, P.T.; Law, D.C.; Woo, R.L.; Singer, S.B.; Bhusari, D.; Hong, W.D.; Zakaria, A.; Boisvert, J.; Mesropian, S.; King, R.R.; et al. Direct semiconductor bonded 5J cell for space and terrestrial applications. IEEE J. Photovoltaics 2014, 4, 493–497. [Google Scholar] [CrossRef]
  47. Ciminelli, C.; Dell’Olio, F.; Armenise, M.N. Photonics in Space: Advanced Photonic Devices and Systems; World Scientific: Singapore, 2016; ISBN 9789814725118. [Google Scholar]
  48. Sargunanathan, S.; Elango, A.; Mohideen, S.T. Performance enhancement of solar photovoltaic cells using effective cooling methods: A review. Renew. Sustain. Energy Rev. 2016, 64, 382–393. [Google Scholar] [CrossRef]
  49. Saadah, M.; Hernandez, E.; Balandin, A. Thermal Management of Concentrated Multi-Junction Solar Cells with Graphene-Enhanced Thermal Interface Materials. Appl. Sci. 2017, 7, 589. [Google Scholar] [CrossRef]
  50. Tiwari, B.; Hossain, M.J.; Bhattacharya, I. GaP/InGaAs/InGaSb triple junction current matched photovoltaic cell with optimized thickness and quantum efficiency. Sol. Energy 2016, 135, 618–624. [Google Scholar] [CrossRef]
  51. Patel, P.; Aiken, D.; Boca, A.; Cho, B.; Chumney, D.; Clevenger, M.B.; Cornfeld, A.; Fatemi, N.; Lin, Y.; McCarty, J.; et al. Experimental results from performance improvement and radiation hardening of inverted metamorphic multijunction solar cells. IEEE J. Photovoltaics 2012, 2, 377–381. [Google Scholar] [CrossRef]
  52. Sugaya, T.; Numakami, O.; Oshima, R.; Furue, S.; Komaki, H.; Amano, T.; Matsubara, K.; Okano, Y.; Niki, S. Ultra-high stacks of InGaAs/GaAs quantum dots for high efficiency solar cells. Energy Environ. Sci. 2012, 5, 6233–6237. [Google Scholar] [CrossRef]
  53. Wanlass, M.; Ahrenkiel, P.; Albin, D.; Carapella, J.; Duda, A.; Emery, K.; Friedman, D.; Geisz, J.; Jones, K.; Kibbler, A.; et al. Monolithic, ultra-thin GalnP/GaAs/GalnAs tandem solar cells. In Proceedings of the IEEE 4th World Conference on Photovoltaic Energy Conversion, Waikoloa, HI, USA, 7–12 May 2006. [Google Scholar]
  54. Basore, P.A.; Clugston, D.A. PC1D version 4 for Windows: From analysis to design. In Proceedings of the Twenty Fifth IEEE Photovoltaic Specialists Conference, Washington, DC, USA, 13–17 May 1996. [Google Scholar]
  55. Luque, A.; Hegedus, S. Handbook of Photovoltaic Science and Engineering; John Wiley & Sons Ltd.: Hoboken, NJ, USA, 2011; ISBN 9780470721698. [Google Scholar]
  56. Bertness, K.A.; Kurtz, S.R.; Friedman, D.J.; Kibbler, A.E.; Kramer, C.; Olson, J.M. 29.5%-efficient GaInP/GaAs tandem solar cells. Appl. Phys. Lett. 1994, 65, 989–991. [Google Scholar] [CrossRef]
  57. Tukiainen, A.; Aho, A.; Gori, G.; Polojärvi, V.; Casale, M.; Greco, E.; Isoaho, R.; Aho, T.; Raappana, M.; Campesato, R.; et al. High-efficiency GaInP/GaAs/GaInNAs solar cells grown by combined MBE-MOCVD technique. Prog. Photovoltaics Res. Appl. 2016, 24, 914–919. [Google Scholar] [CrossRef] [Green Version]
  58. Predan, F.; Reinwand, D.; Cariou, R.; Niemeyer, M.; Dimroth, F. Direct wafer bonding of highly conductive GaSb/GaInAs and GaSb/GaInP heterojunctions prepared by argon-beam surface activation. J. Vac. Sci. Technol. A Vacuum Surfaces Film. 2016, 34, 031103. [Google Scholar] [CrossRef] [Green Version]
  59. Law, D.C.; Liu, X.Q.; Boisvert, J.C.; Redher, E.M.; Fetzer, C.M.; Mesropian, S.; King, R.R.; Edmondson, K.M.; Jun, B.; Woo, R.L.; et al. Recent progress of Spectrolab high-efficiency space solar cells. In Proceedings of the 38th IEEE Photovoltaic Specialists Conference, Austin, TX, USA, 3–8 June 2012. [Google Scholar]
  60. Dabbabi, S.; Ben Nasr, T.; Turki Kamoun, N. CIGS Solar Cells for Space Applications: Numerical Simulation of the Effect of Traps Created by High-Energy Electron and Proton Irradiation on the Performance of Solar Cells. JOM 2019, 71, 602–607. [Google Scholar] [CrossRef]
  61. Braun, A.; Szabó, N.; Schwarzburg, K.; Hannappel, T.; Katz, E.A.; Gordon, J.M. Current-limiting behavior in multijunction solar cells. Appl. Phys. Lett. 2011, 98, 223506. [Google Scholar] [CrossRef]
Figure 1. The schematic of distances of the geosynchronous orbit of Venus.
Photonics 06 00046 g001
Figure 2. The schematic picture of power density (intensity) averaging technique. (All units in arbitrary).
Photonics 06 00046 g002
Figure 3. The incoming spectral irradiance at the geosynchronous orbit of Venus and Earth calculated using a blackbody radiation formula. The total power density (intensity) at the geosynchronous orbit of Venus is 3000 W/m2, while for Earth it is 1557 W/m2.
Photonics 06 00046 g003
Figure 4. The electrical performance (I-V diagram) of Al0.3Ga0.7As/InP/Ge TJSC at the geosynchronous orbit of Venus. All subcells were connected in a series connection and possess the same current.
Photonics 06 00046 g004
Figure 5. The electrical performance of Al0.3Ga0.7As/InP/Ge TJSC at geosynchronous of Earth. All subcells were connected in a series and possess the same current.
Photonics 06 00046 g005
Table 1. Input parameter for PC1D program.
SubcellBandgap EnergyThicknessp-Dopingn-Doping
(eV)(μm)(cm−3)(cm−3)
Al0.3Ga0.7As1.8172.8891.00 × 10173.45 × 1018
InP1.3504.2221.36 × 10171.73 × 1017
Ge0.66415.563.00 × 10182.13 × 1019
Table 2. Simulation results of TJSC at the geosynchronous orbit of Venus.
SubcellIncoming IntensityAbsorbed IntensityDissipated IntensityVOCIscPmaxFFTotal Efficiency
mW/cm2mW/cm2mW/cm2(V)(mA)(mW)(%)(%)
Al0.3Ga0.7As300.00136.1871.181.49147.765.091.3938.94
InP163.8260.0816.681.02747.743.488.59
Ge103.7419.5411.120.254847.78.4269.28
Table 3. Simulation results of TJSC at the geosynchronous orbit of Earth.
SubcellIncoming IntensityAbsorbed IntensityDissipated IntensityVOCIscPmaxFFTotal Efficiency
mW/cm2mW/cm2mW/cm2(V)(mA)(mW)(%)(%)
Al0.3Ga0.7As155.7070.7037.401.47424.833.3091.0938.15
InP85.0031.159.051.01124.822.1088.14
Ge53.8510.136.130.23824.84.0067.77

