1. Introduction
The demand for higher information transfer rates has led much research into evolving the current infrastructure in place for data transmission. Previous wavelength division multiplexing (WDM) networks were rigid in nature, with fixed channel spacings and bit rates throughout the network. Flexible or elastic optical networks have been proposed as superior, more energy- and bandwidth-efficient alternatives to standard WDM systems, which allow the optical bandwidth and modulation formats used to be dynamically adjusted to meet the requirements of each node in the network [
1,
2,
3,
4]. Transmission speeds of greater than 10 Tb/s with spectral efficiencies of 7.7 b/s/Hz have been achieved under laboratory conditions [
5], which shows promise that these networks will be able to deliver future transmission speed requirements. These flexible networks have been made realisable due to advances in transmitting and receiving optical super channels, using narrowly-spaced coherent optical combs [
5,
6,
7]. As well as reducing power consumption and the amount of individual components required, optical combs offer advantages such as allowing the WDM channels to be more densely packed and simplifying the digital signal processing [
8].
The power consumption and cost of coherent comb sources can be further reduced through photonic integration. Designs using monolithically-integrable injection locked gain switched lasers have previously demonstrated coherent combs on InP, with optical spacings between 4 GHz and 10 GHz [
9,
10]. The use of these optical combs however requires each comb line to be demultiplexed, in order to enable each frequency to be individually modulated with data. However, standard integrable arrayed waveguide grating technologies suitable for demultiplexing combs with spacings below 10 GHz have yet to be demonstrated on active material and are impractical due to their large size and cost. As a result, new integrated demultiplexers that use optical injection locking to demultiplex were developed [
11,
12,
13,
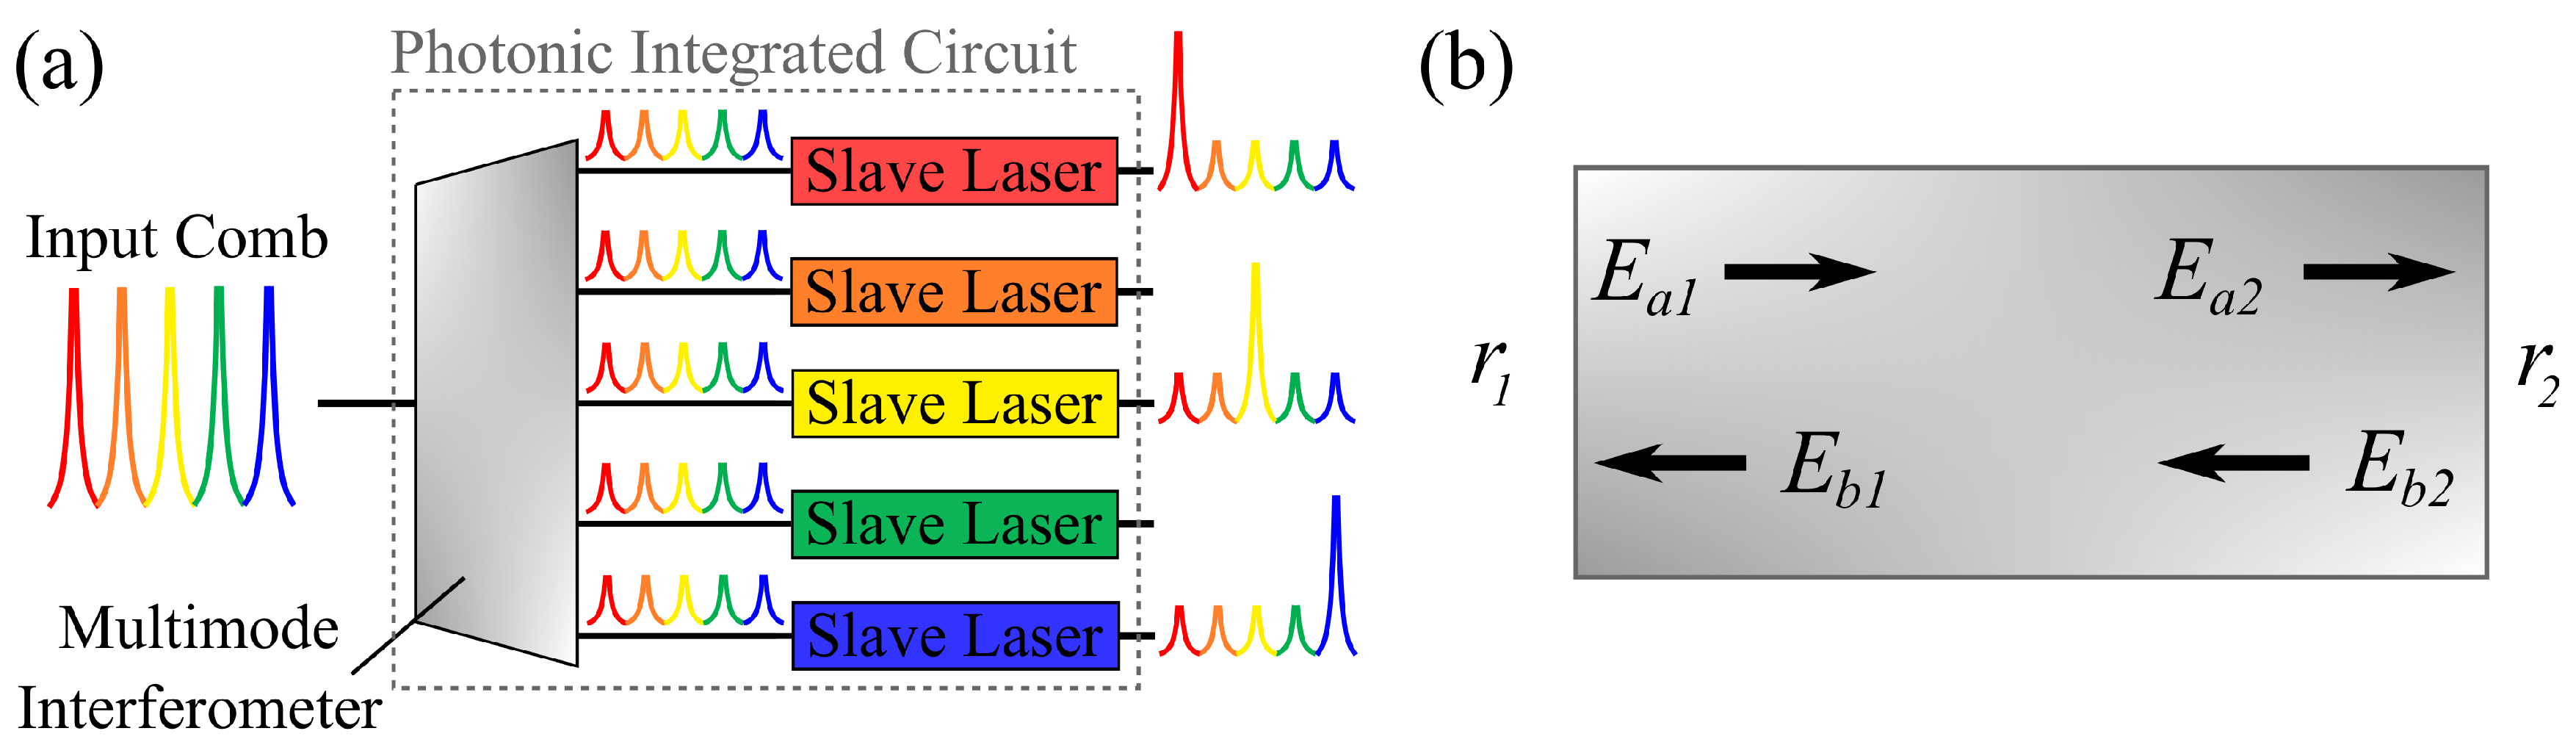
14]. These optical filters operate by injection locking each line in the optical comb to a slave laser, as illustrated in
Figure 1a. The injection locked slave laser provides amplification to the targeted carrier in the comb, whereas the other comb lines passing through the slave laser can undergo optical loss. In addition, using optical injection means the demultiplexer can track small frequency drifts without any active control or device tuning, as long as they are within the locking tongue of the slave laser.
Numerical models for simulating the demultiplexing of these coherent combs have been previously presented in [
15,
16,
17]. In all cases, single-mode rate equation approaches were used to model the suppression of the unlocked comb lines from these demultiplexers, which are not sufficient to describe multimode devices such as Fabry–Pérot (FP) lasers. Optical suppression due to injection of a single wavelength has previously been modelled in many other works, such as in [
18], where they used a multimode rate equation approach to model the effect of the bias currents and spontaneous emission coupling factor on the suppression of the unlocked modes in FP lasers. The work in [
19] used a similar model to study how detuning and the injected mode relative to the gain centre affect the suppression. Neither of these multimode approaches however investigated optical comb injection.
In this paper, we present a new model for simulating the optical spectra and suppression of comb lines, based on the multimode FP model [
20], and the steady state solutions of the rate equation models presented in [
21,
22]. To our knowledge, the side mode suppression ratio (SMSR) of a slave laser under optical injection from a comb has not previously been studied using a multimode model. Our model is used to simulate the optical spectra of optically-injected FP lasers, slotted FP lasers [
23,
24], and a
demultiplexer, as in [
25], and these simulations are shown to be in good agreement with our experimental results. We then use the model to comment on how demultiplexer performance can be improved, by investigating the effect of the Q factor of devices on the SMSR obtainable. We show that improving the Q factor can increase the SMSR of injected optical combs beyond 30 dB and that when a fixed pump rate relative to the threshold is used, the locking ranges of these high Q demultiplexers remain suitable for their application.
2. Description of the Model
The laser model adopted in this work has previously been proven to accurately replicate the characteristics of lasers with multimode and single-mode lasing [
20,
26,
27]. In this section, we will first summarize the model, then describe how the model was altered to include optical injection.
Consider the electric fields within a laser cavity of length
L as shown in
Figure 1b, and let
and
represent the electric fields propagating to the right at Boundaries 1 and 2; similarly for
and
. The fields at the interfaces can be related to one another by:
where
is the gain per unit distance of the laser cavity,
is the propagation constant, and
and
are the contribution of the spontaneous emission to the fields as they travel to the left and right. The intensity of the field at the left facet
is then given by:
where
represents the single-pass gain seen by the fields in the cavity. We assume that the time-averaged contributions of the terms
and
are zero, and we also assume the magnitude of the spontaneous emission in both directions is equal, so that
. Defining
and integrating over one period from
to
give the power from one longitudinal mode in the laser. Hence, the power in each mode of the laser
I is given by:
This integral can be evaluated as:
where now the subscript
m has been added to indicate that values for the gain, reflection, and spontaneous emission coupling to each mode can differ across the longitudinal modes in the laser. The reflections
and
for the different laser cavities considered in the following section were calculated using a one-dimensional transmission matrix method [
28]. The modal gain dependence is modelled as:
where
is the cavity loss,
L is the length of the gain section of the laser,
is the gain shape of the laser material, and
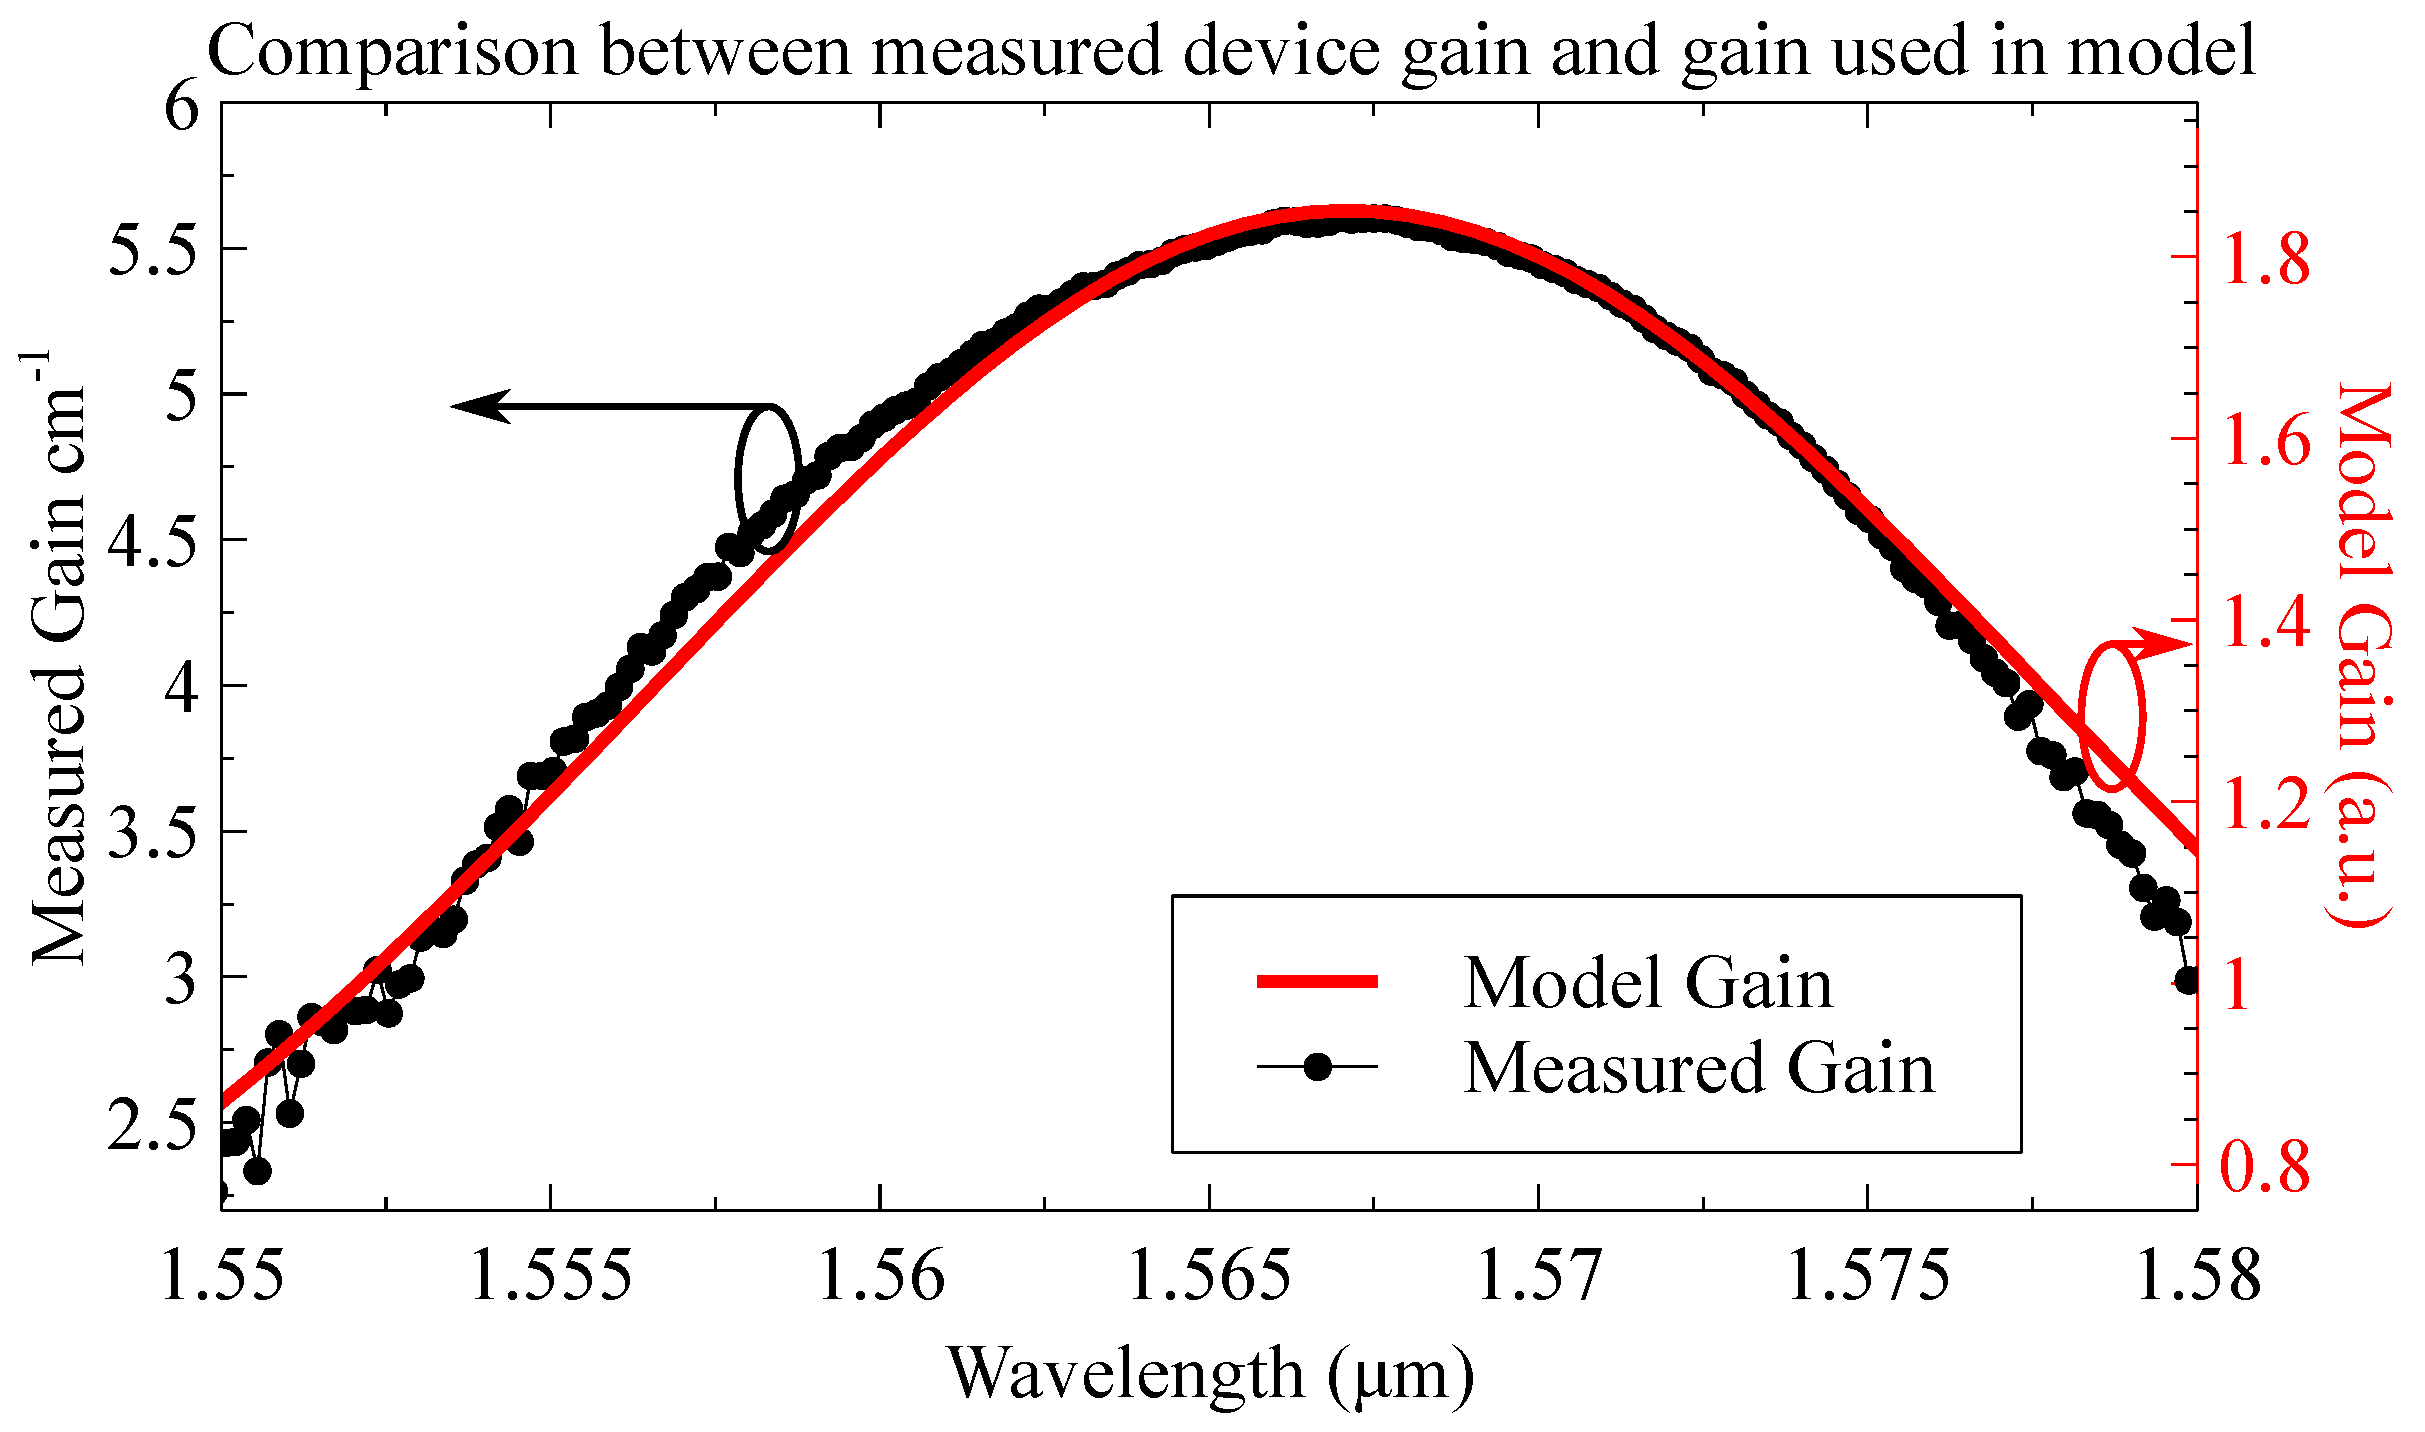
n is the number of free carriers. The gain line shape in the model was chosen to be of the form:
where here,
gives the centre gain wavelength and
a and
are used as fitting parameters to approximate the measured gain.
Figure 2 shows the gain
compared with the measured gain of the InGaAs semiconductor devices tested, and although the asymmetry of the real device gain is not represented, good qualitative agreement is observed around the peak modal gain.
The spontaneous emission in the model is defined as in [
20], by the term
:
where
is the spontaneous emission factor and
is the photon lifetime. The number of free carriers
n is modelled by:
Here,
N is the rate of injected carriers,
is the carrier lifetime, and
takes into account the number of carriers recombining due to stimulated emission in the laser material. The steady state value for the carriers is:
As rate equation models predict the locking range and power in the slave laser under optical injection more accurately [
30], the optical injection in the model uses results derived from a rate equation approach. To derive the required results, we start with the standard injection locking rate equations as reported in [
21,
22]:
Here,
and
are the rates of cavity gain and cavity losses,
is the longitudinal mode spacing,
is the linewidth enhancement factor, and
is the difference between the natural frequencies of the master and slave laser. In the steady state, Equation (
9) gives us a relation between the growth and decay rates inside the laser:
To relate the steady state solution for the amplitude in Equation (
11) to the optical power in the FP modes, we note that one can write the power
in terms of the saturation power of the gain medium by [
21]:
where
is the amount by which the unsaturated gain in the laser exceeds the cavity losses. By assuming that the laser growth rate inside the cavity saturates under injection in the form [
21],
we can eliminate the unknown saturation power level
using Equations (
12) and (
13) and find:
where the last equality follows from Equation (
11). A first-order approximation assuming that
is given in [
21] as:
Hence, using Equation (
15), we can describe how the power in an injection locked mode in the FP model varies with detuning, assuming that our injected optical field strength is small.
From Equation (10), we can also determine the range of frequencies for which the slave laser will be frequency locked. Using Equation (
11) in Equation (10), we can determine the locked phase
of the slave relative to the master:
The range of frequencies for which the slave laser is locked to the master laser can then also be shown to be [
22,
31]:
Hence, using the above, the optical power in each mode of the slave laser can be calculated by solving Equations (
3) and (
8), including the change in optical power as described by Equation (
15) when the slave laser is within the locking conditions. In the following section, the optical mode powers were convolved with a Voigt function to create the wideband spectra presented.
As a steady state solution is presumed in Equation (
8), the dynamical regions of operation of the slave laser, which arise at different injection strengths and detunings, are omitted by the model. However, it will be shown in the following discussion that under these assumptions, this simple model can still accurately model the behaviour of the SMSR of the slave lasers under injection and can even be used to predict qualitatively the suppression obtainable through injection locking a slave laser to a single injection frequency or to one of the lines of an injected optical comb.
3. Comparison between the Experiment and Model
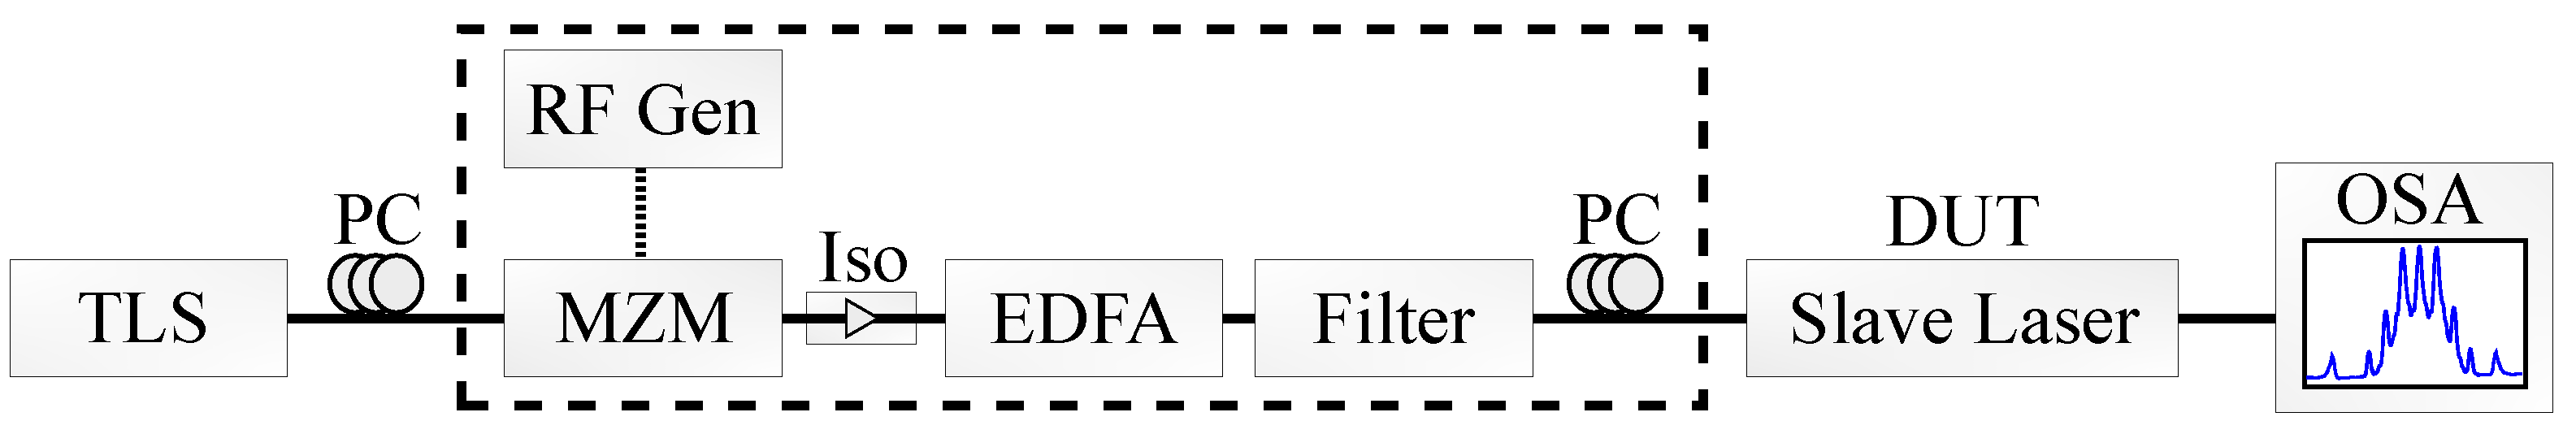
In the following section, experimental results are presented and compared side by side with the corresponding simulated experiments. The experimental setup used to perform the injection locking experiments is shown in
Figure 3. The device under test (DUT) was mounted on a temperature-controlled brass chuck. A tunable laser source (TLS) was used as the master laser. The devices were optically coupled by collecting the light from the uncoated facets using a lensed fibre. To generate the optical combs used in some of the results presented, the components inside the dashed section in
Figure 3 were included in the setup. In these cases, an RF signal generator was used to intensity modulate the master laser signal passing through a LiNbO3 Mach–Zehnder modulator (MZM). An erbium-doped fibre amplifier (EDFA) was used to amplify and control the optical power injected into the device. The output from the slave laser was measured on an optical spectrum analyser (OSA). Polarisation controllers (PC) were used before the MZM and the DUT to maintain polarisation throughout the experiments, as both the comb generation and optical injection aspects of the experiment depend strongly on phase [
32]. As the coupling efficiency between the lensed fibre and the devices tested was unknown, our calculated results are presented using the ratio of the injection strength to the slave laser power (i.e,
) and assume the coupling efficiency was one in all cases.
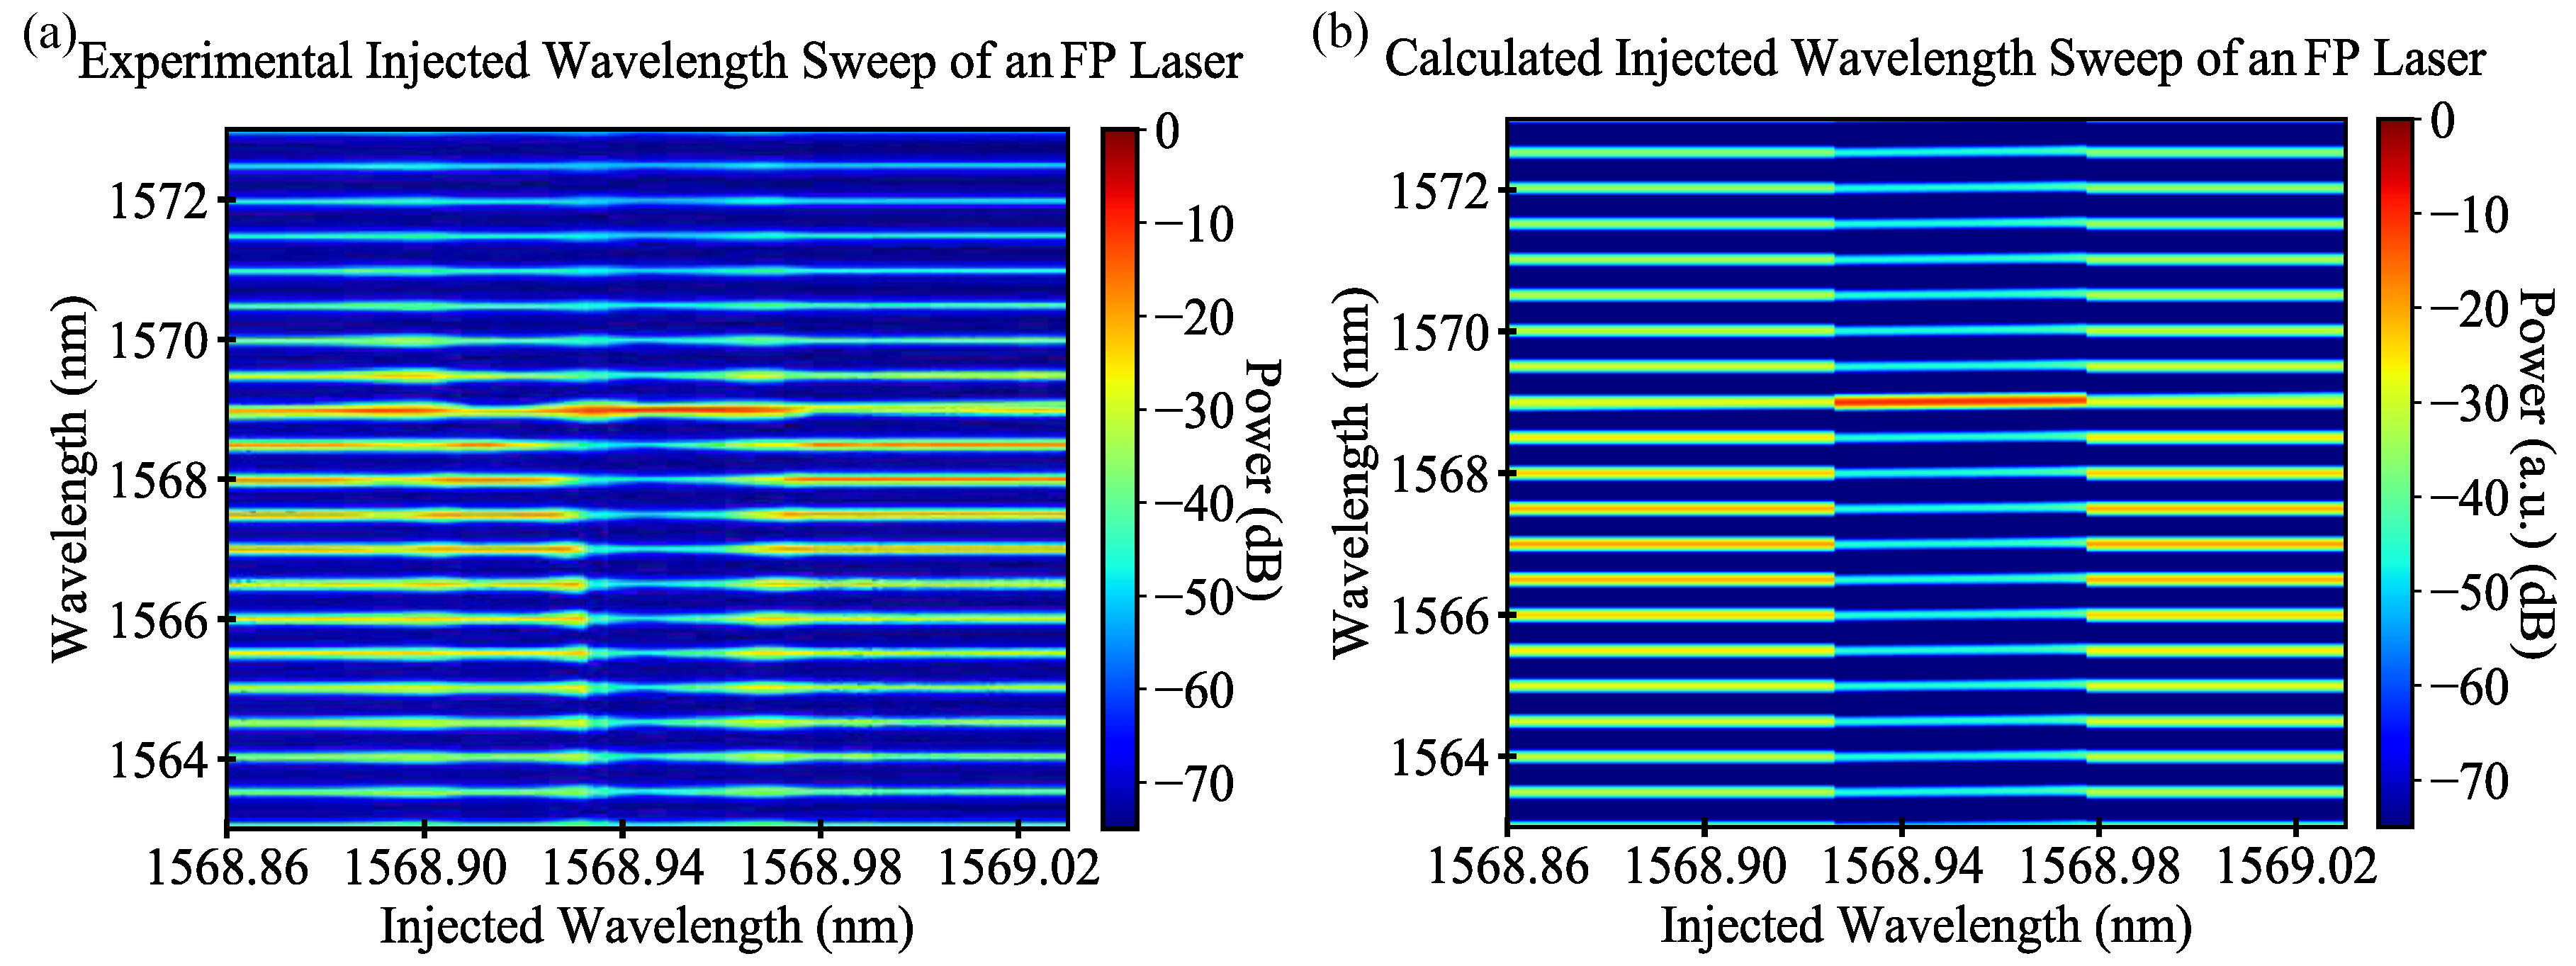
Figure 4 shows a comparison between the measured and the calculated results of a 700
m-long FP laser under optical injection, as the wavelength of the master laser is swept from 1568.95 nm–1569.05 nm in each case.
Figure 4a shows the measured spectrum from the FP device, biased at 45 mA (2.5-times the threshold). The mirrors of the device were cleaved facets, each with an estimated reflection of 30%. At 1568.938 nm, the slave laser locked to the master laser and remained frequency locked for 0.031 nm (or 3.87 GHz). While locked, the side modes of the slave laser were suppressed, and the SMSR was larger than 20 dB over a span of 3.6 GHz, with a maximum SMSR of 35.77 dB.
The simulated results of the same FP sweep are shown in
Figure 4b. The optical spectra were calculated by solving Equations (
3) and (
8), including the change in optical power as described by Equation (
15) when the slave laser was within the locking conditions. The parameters used in all the calculations presented are contained in
Table 1. The unlocked injected signal was amplified by the single-pass gain of the laser at that wavelength. The output spectrum was then convolved with a Voigt profile to simulate the measured spectra on the OSA, in order to compare the results directly. The refractive index (
) of the slave laser was used as a fitting parameter to line up the modes of the simulated spectra with the experiment. The simulated slave laser was biased at 2.5-times the threshold, and the injected wavelength sweep matched that in the experimental trace. The optical spectrum of the slave laser underwent sharp transitions at 1568.933 nm and 1568.978 nm, unlike in the experimental case, as the model only calculated the locked steady state solutions. The complicated dynamics at the locking boundaries cannot be replicated using the steady state assumption in the model. The optical suppression seen as the slave laser reached a maximum of 35.1 dB and had an SMSR of over 20 dB over the whole locking range of 3.74 GHz, which are in good agreement with the experiment.
Other small discrepancies between the simulated and measured traces are present; in the experimental trace, we see that the apparent thickness of each of the modes grows slightly on the edges of the injection region. This is due to the beating of the slave laser with the injected light, causing nearly degenerate four-wave mixing peaks to appear on all modes of the slave laser [
33], at frequencies that could not be resolved on the OSA used. This occurs at very small frequency detunings due to the weak injected power used [
34], and its effect is to broaden slightly what is measured on the OSA. Our model cannot reproduce four-wave mixing due to the steady state assumption.
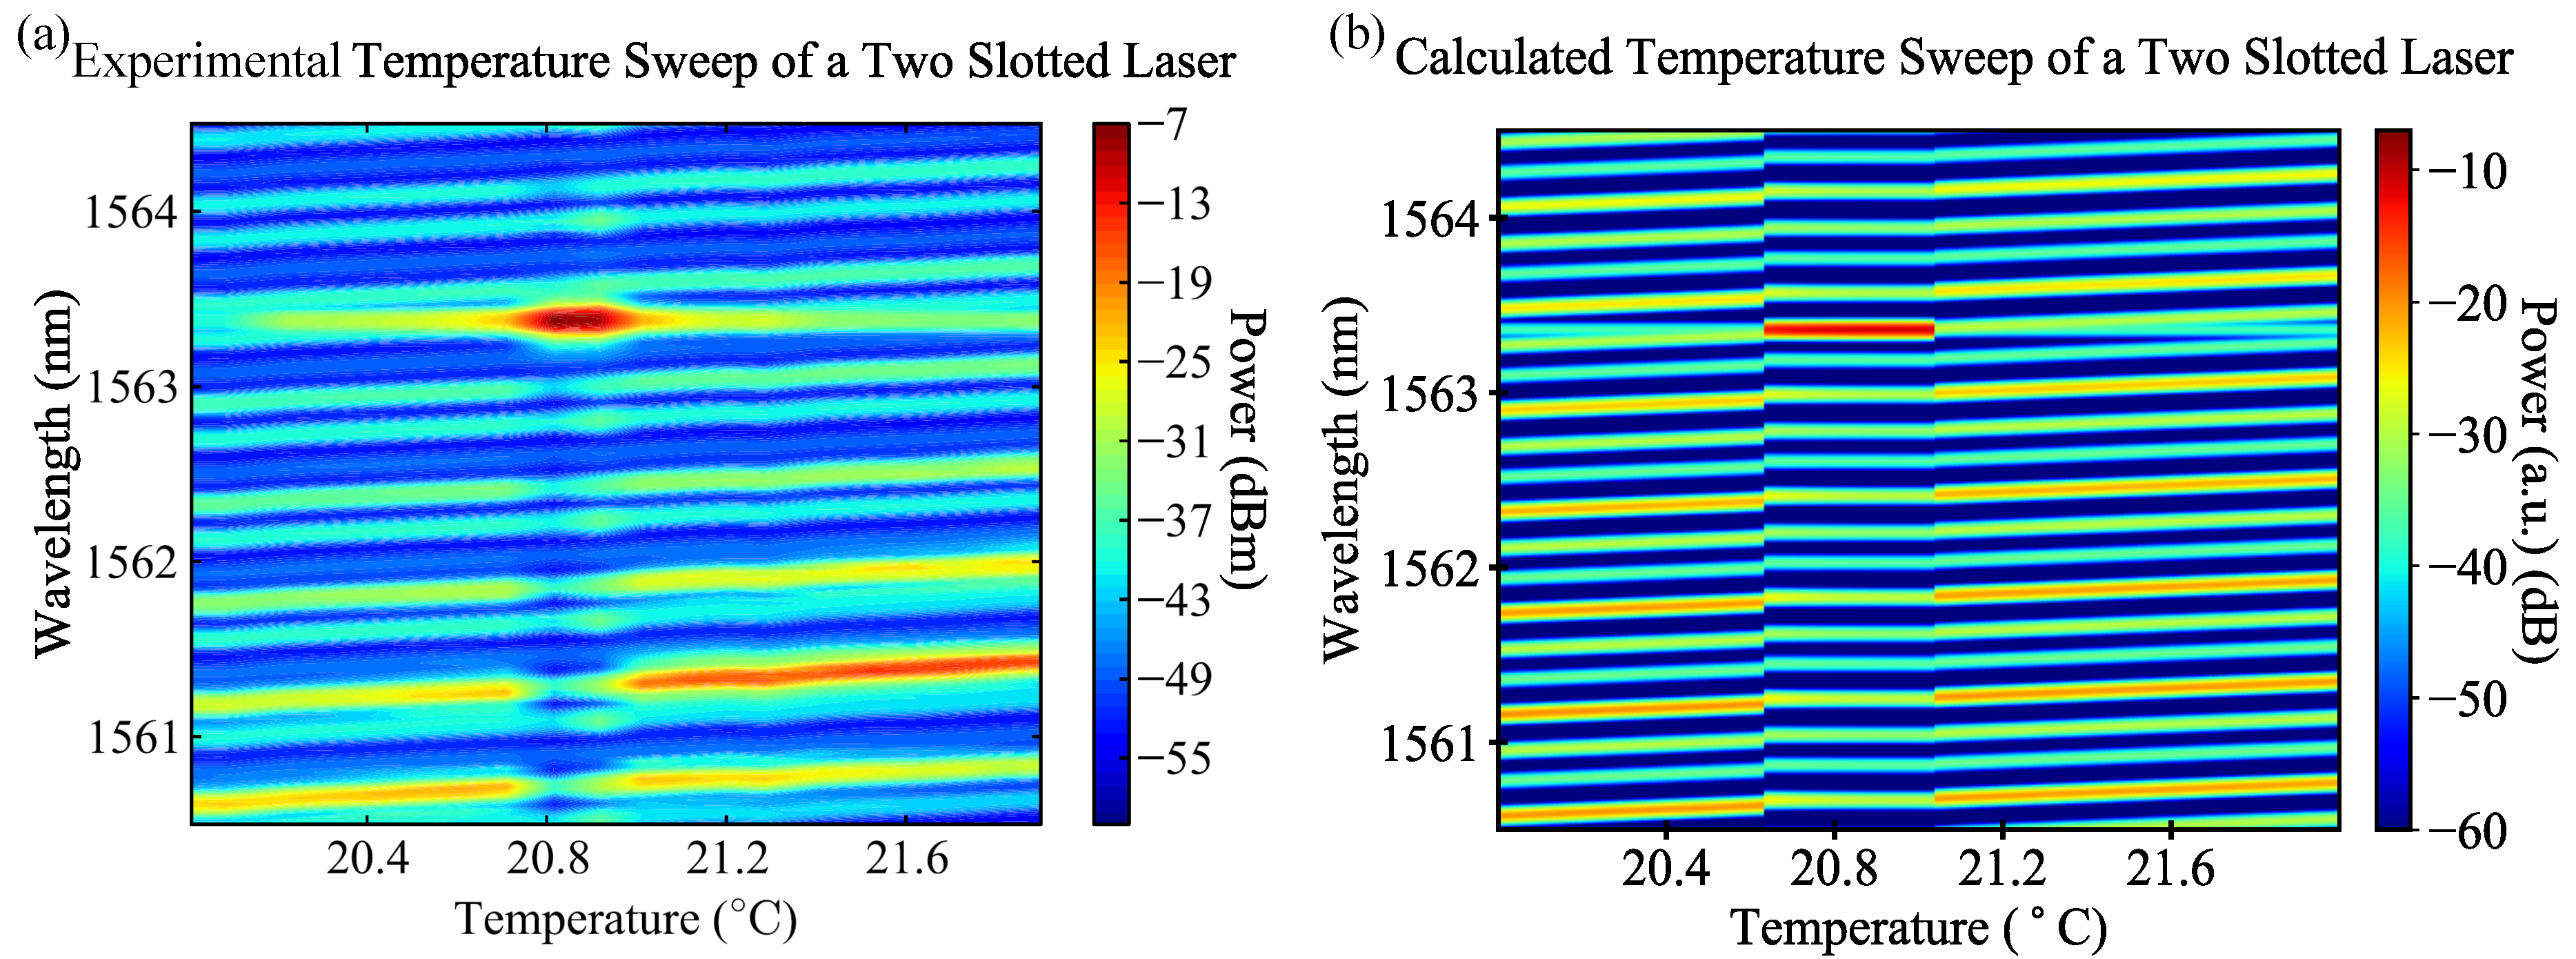
Thermal tuning in the model is shown and compared with the experiment in
Figure 5. The experimental trace presented in
Figure 5a has been taken from [
12]. The slave laser used in this experiment was a two-section, single-mode tunable, slotted Fabry–Pérot (SFP) laser. The slots in these lasers refer to etches made along the ridge of the laser, typically around 1
m wide, which provide optical feedback and increase mode selectivity [
23,
24]. The temperature of the two-section laser was swept over 2
C, with a constant injected wavelength at 1563.35. At 20.9
C, the slave laser frequency locks for approximately 0.24
C of the temperature sweep. The SMSR from the experiment was >20 dB over a frequency span of 1.29 GHz. The matching simulated result in
Figure 5b shows the slave device lock for 0.4
C, with >18 dB SMSR over a frequency span of 0.95 GHz. Thermal tuning was introduced into the model by varying the optical path length of the laser material to match the 0.1 nm
C seen in the experiment, as well as allowing the centre of the material gain to red shift with increasing temperature. The SMSR predicted by the model was slightly lower than experiment, likely due to the limitations in using a one-dimensional transmission matrix to describe the slot in the device [
35]. The optical power in the mode that undergoes the frequency locking has a strong impact on the amplification the injected signal sees when locked, and the mismatch in the power of that mode could be the cause of the different SMSRs predicted.
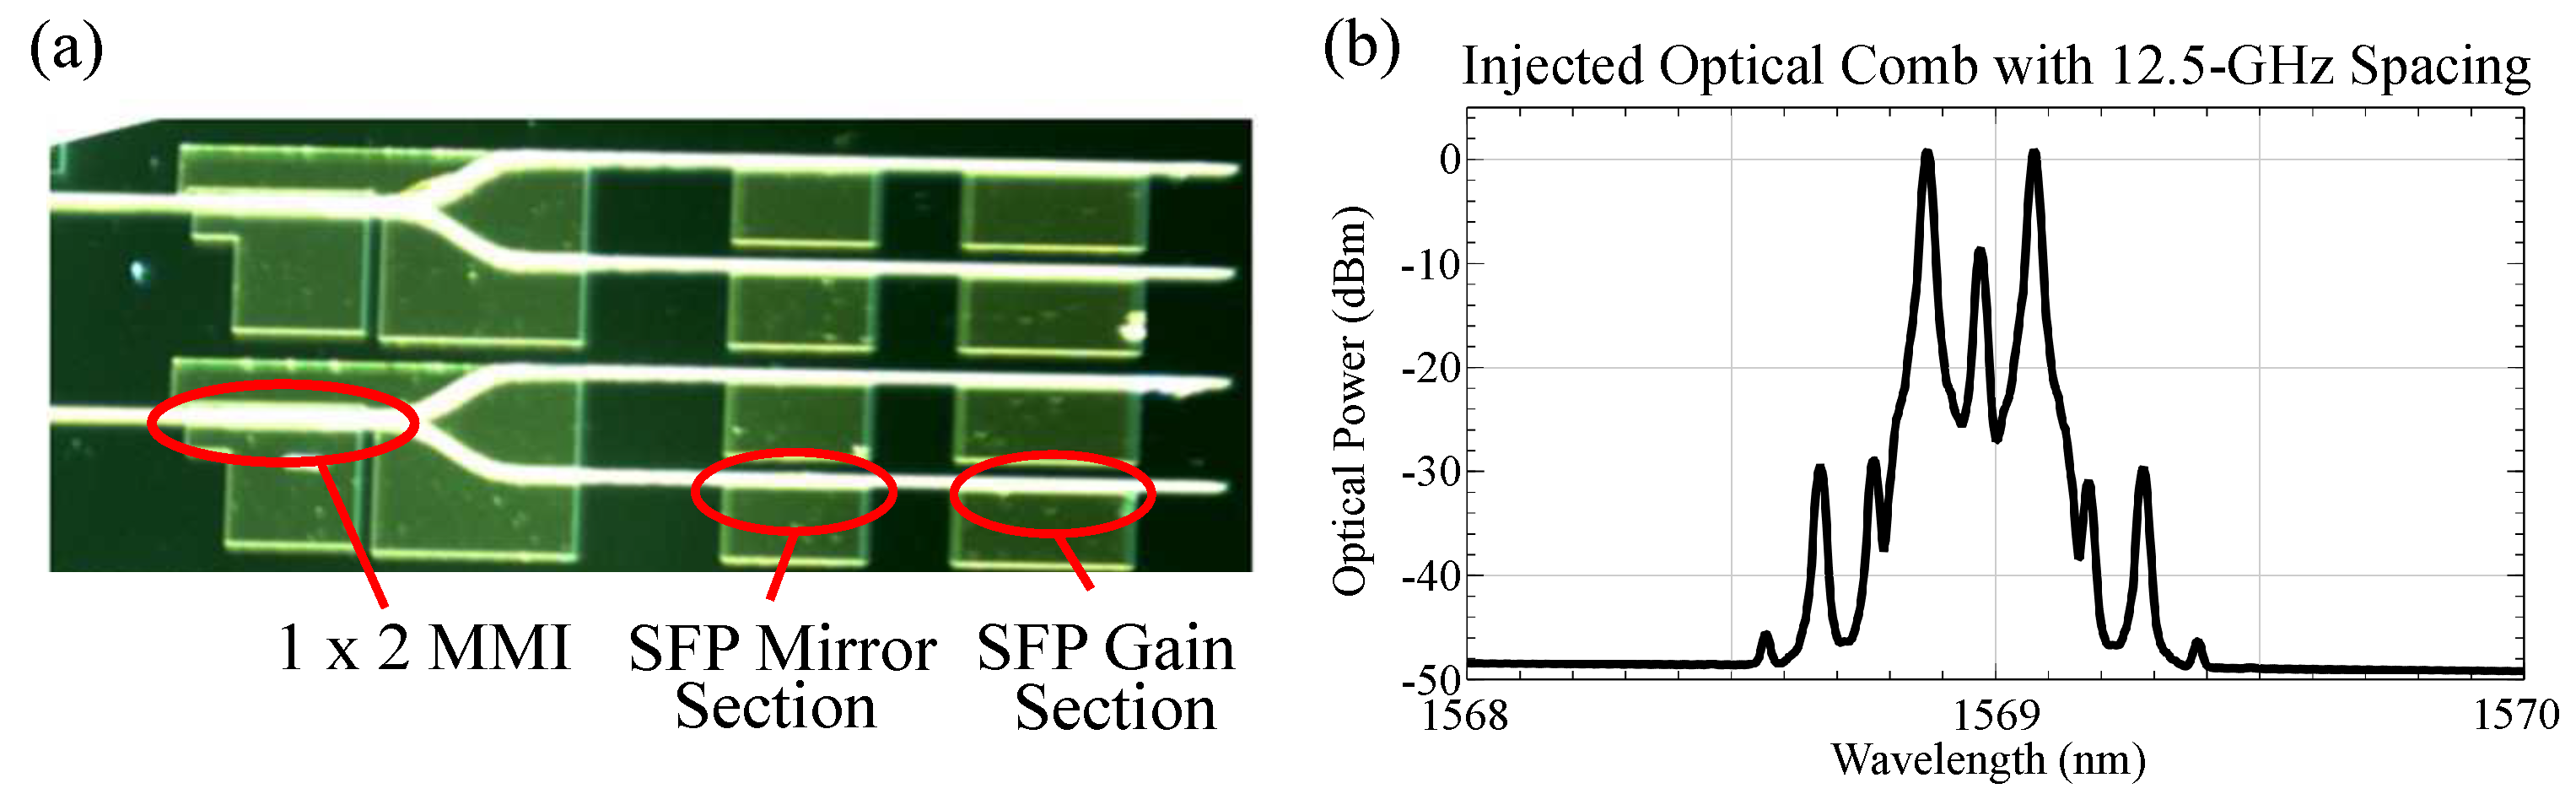
As a final example, results from a
demultiplexer as shown in
Figure 6a were simulated. A two-line optical comb, as shown in
Figure 6b, was injected. Each line of the two-line optical comb locked to the two side modes of the SFP laser, with the centre of the comb (8 dB lower) also interacting with the slave laser’s side mode as it tuned.
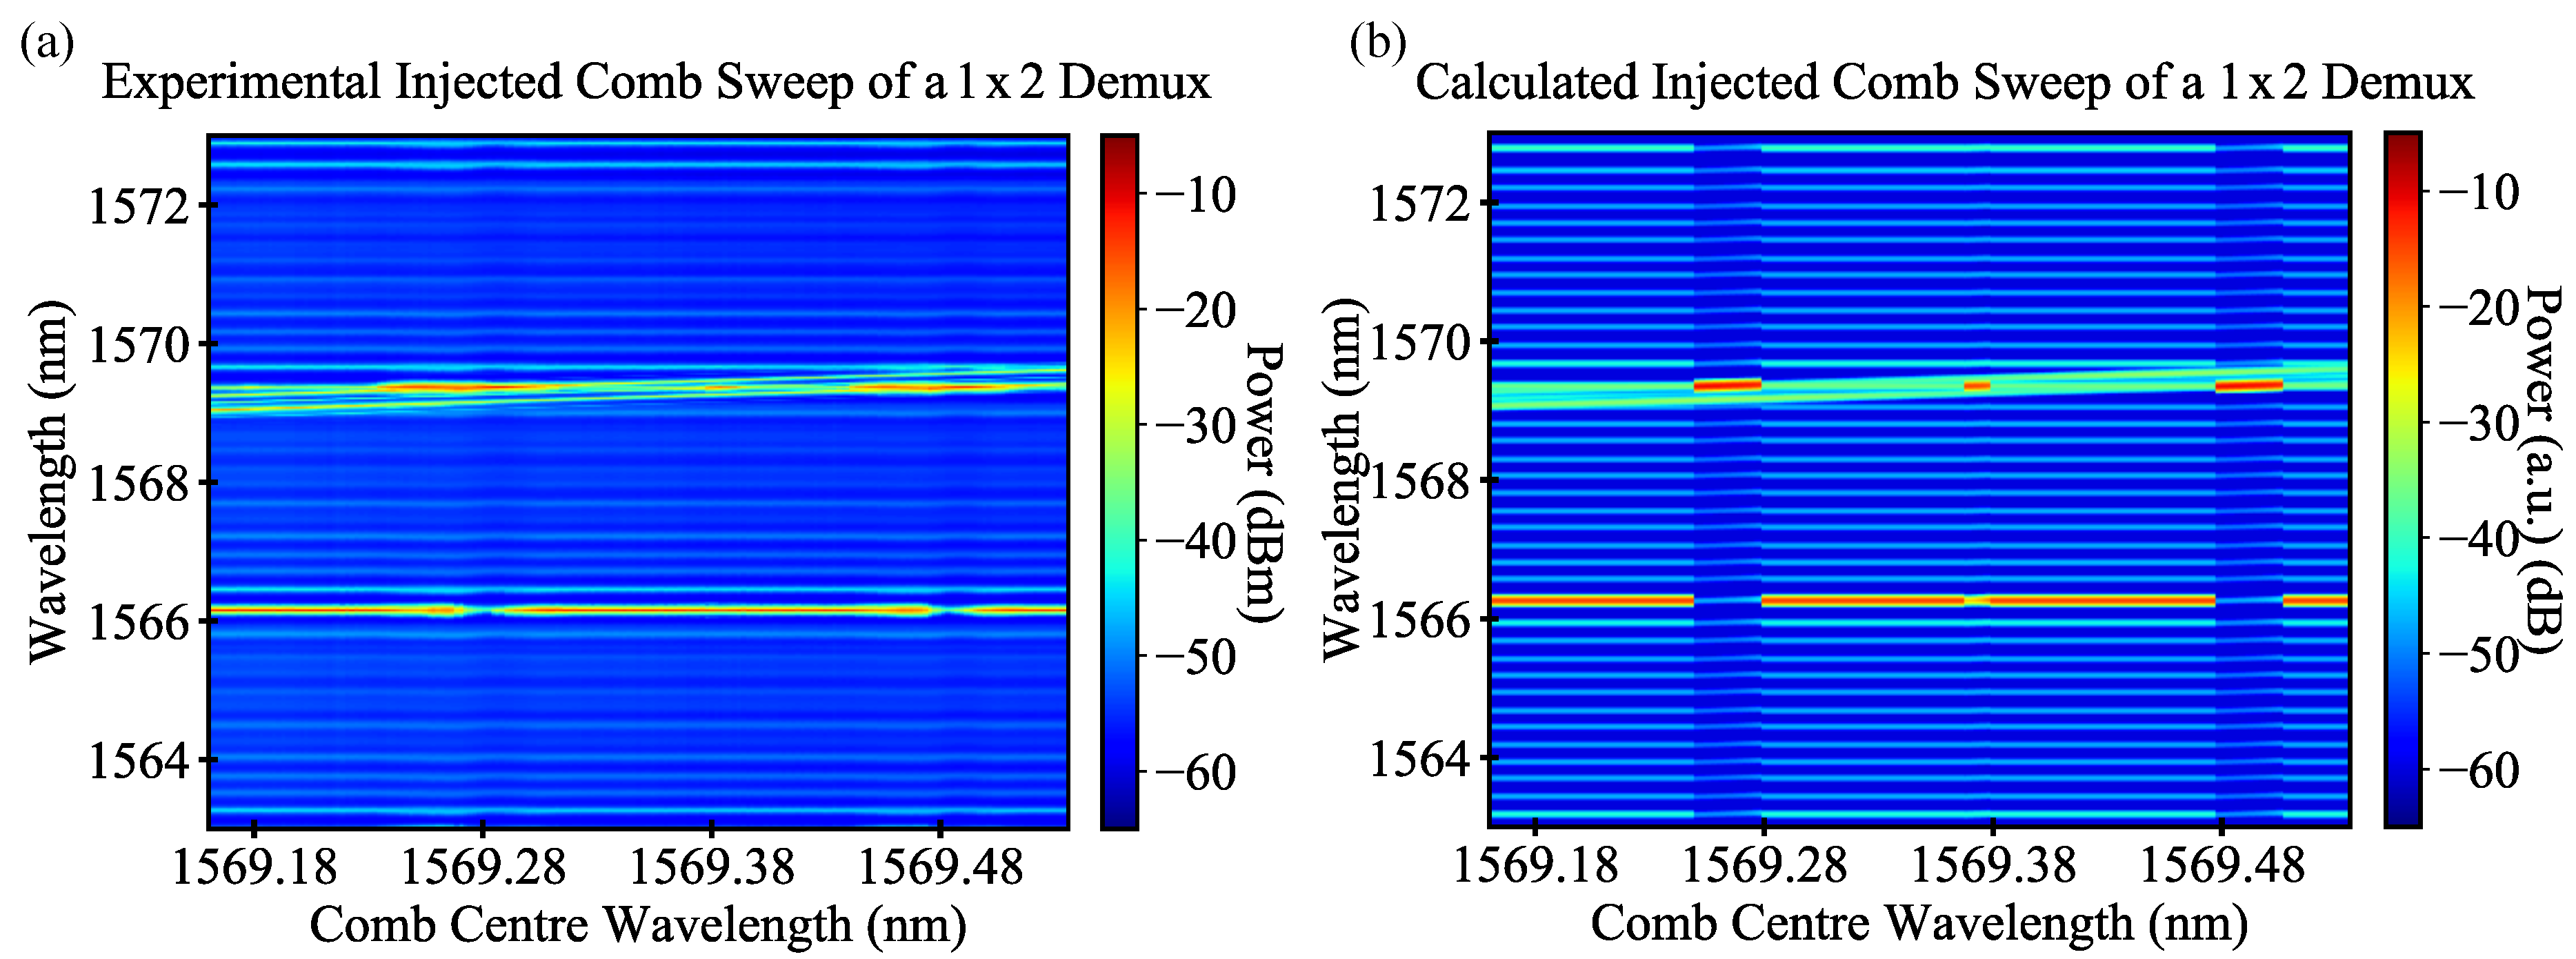
In the experimental trace in
Figure 7a, maximum SMSRs of 18.4 dB and 20.6 dB were achieved as the two strongest comb lines locked to the side mode of the slave laser. The slave laser in the demultiplexer remained locked for spans of 2 GHz and 2.5 GHz, respectively. The straight through line (8 dB lower than the two comb lines) is amplified slightly as it passes over the side mode; however, it does not stably lock to the side mode. In the simulated trace in
Figure 7b, the results obtained are quite similar. The SMSRs were obtained as the comb locked to the side mode, 22.1 dB and 22.9 dB, and the slave laser was locked over 3.2 GHz in each case. The model did predict that the centre line of the comb locked to the side mode; however, at 8 dB less peak power, the injected power was not sufficient to suppress the main lasing mode. The locking ranges in the simulated case were larger than in the experiment again, as bi-stable and dynamical locking regions are included in Equation (
18), but the suppression seen in the model closely resembled what was measured. As the SMSRs obtained when demultiplexing these optical combs do not meet the 30-dB figure required for most telecommunications applications, the following section investigates how the SMSRs of devices can be improved.
4. The Effect of the Cavity Quality Factor on Optical Comb Demultiplexing
We now wish to use our model to identify the parameters of the slave laser, which can be optimised in order to increase the slave laser’s demultiplexing ability. In the case of passive resonators, the quality factor (or Q factor) is related to the frequency selectivity of the resonator, with higher Q cavities acting as better frequency filters than those with low Q. As a result, we start by investigating how the Q factor of the laser cavity affects the SMSR of the injected optical comb. In the following, we vary the Q of an FP laser by varying the reflection of the facets and measuring the Q of the equivalent lossless cavity, given by:
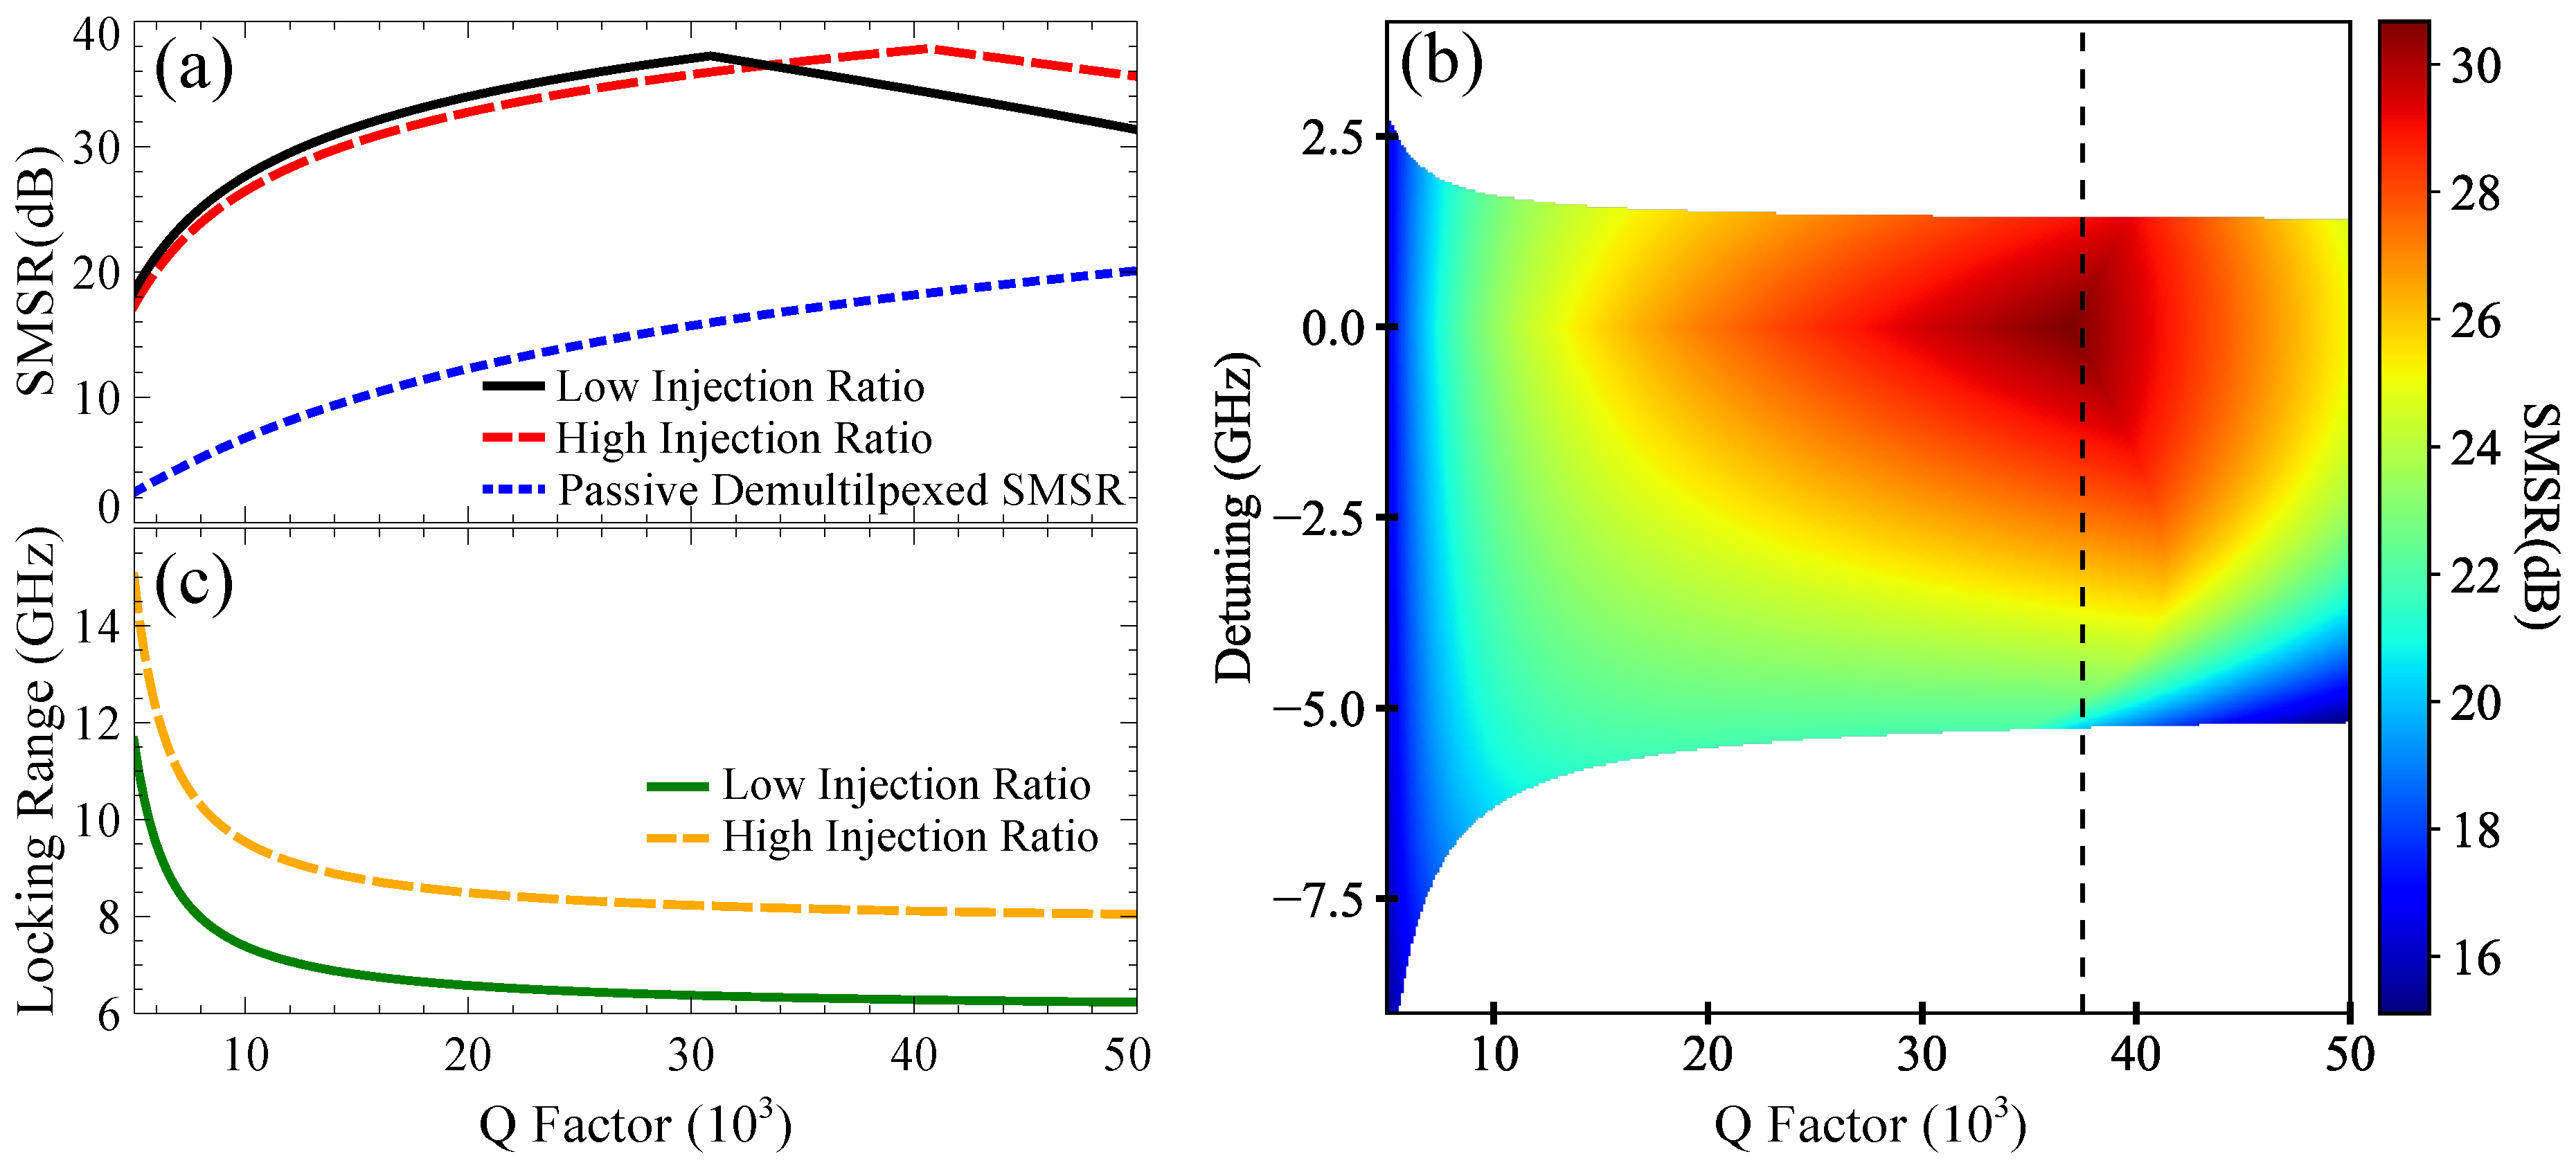
Figure 8a compares the SMSR achieved as the Q of the laser cavity is improved, when injecting a three-line 12.5-GHz optical comb into an FP laser for high and low injection ratios. The slave laser was biased at three-times the threshold for each Q value used, to avoid influencing the results by increasing the pumping of the slave. As the power of the free running slave laser was not constant as the Q factor of devices was increased and a fixed injection strength was used throughout, hence the injection ratios are given for the lowest Q factor in each plot in
Figure 8.
Figure 8a shows that for the lower injection ratio, the SMSR increases with the improved cavity quality factor up until
, with a similar behaviour for the slightly higher ratio. As Q increased past this point, the other longitudinal modes in the laser cavity became less suppressed due to the optical injection, and as a result, eventually, the unlocked FP modes became stronger than the unlocked comb lines passing through the cavity. As shown in the red dashed line in
Figure 8a, stronger injected optical powers suppressed the unlocked FP modes up to a higher Q value. For a qualitative comparison, the SMSR obtainable from a passive FP cavity with equivalent Q is also plotted in
Figure 8a, in a blue dotted line. Notably, the increase in SMSR seen by the injection locked FP laser sees a similar growth rate as the passive case.
The SMSR obtainable also varied with the detuning between the slave laser and the injected optical comb.
Figure 8b shows a colour map of how the SMSR varied as the detuning and Q factor were varied. The importance of the detuning between the slave and master is highlighted, and as the Q factor of the laser increased, the gradient in the SMSR over the detuning increased notably. At
(marked with the vertical dotted line), we see that the SMSR varied by a maximum of 10 dB as the detuning was varied. As a result, even though the slave laser can account for some frequency drift in either the injected comb or its lasing frequency, we have shown that drift can still strongly impact the output SMSR.
An investigation into the behaviour of the locking range of the laser as its quality factor is improved is presented in
Figure 8c, for the two injection ratios used in
Figure 8a. From the comparisons of the model with the experiment in
Section 3, we expect the locking range of real devices to be slightly smaller than what is predicted here. However, the trend shown in
Figure 8c is encouraging, as for higher Q, the locking range tends to a constant value.
We can conclude that higher Q cavities increase the SMSR obtainable. We have found that improving the Q of laser cavities increased the SMSR at a rate comparable to a passive demultiplexer. At higher Q values, the unlocked modes in the FP laser required a higher injected power to be suppressed, and as a result, the side modes became stronger than the unlocked comb lines. The locking range of the slave laser varied slowly in high Q cavities; however, the effect of detuning the slave laser relative to the injected comb increased in sensitivity as Q increased.

 ,
, 


