Article

Holographic Fabrication and Optical Property of Graded Photonic Super-Crystals with a Rectangular Unit Super-Cell

1
Department of Physics, University of North Texas, Denton, TX 76203, USA
2
Department of Electrical Engineering, University of North Texas, Denton, TX 76203, USA
*
Author to whom correspondence should be addressed.
Photonics 2018, 5(4), 34; https://doi.org/10.3390/photonics5040034
Submission received: 25 September 2018 / Revised: 9 October 2018 / Accepted: 9 October 2018 / Published: 11 October 2018

Abstract

:
Recently developed graded photonic super-crystals show an enhanced light absorption and light extraction efficiency if they are integrated with a solar cell and an organic light emitting device, respectively. In this paper, we present the holographic fabrication of a graded photonic super-crystal with a rectangular unit super-cell. The spatial light modulator-based pixel-by-pixel phase engineering of the incident laser beam provides a high resolution phase pattern for interference lithography. This also provides a flexible design for the graded photonic super-crystals with a different ratio of length over the width of the rectangular unit super-cell. The light extraction efficiency is simulated for the organic light emitting device, where the cathode is patterned with the graded photonic super-crystal. The high extraction efficiency is maintained for different exposure thresholds during the interference lithography. The desired polarization effects are observed for certain exposure thresholds. The extraction efficiency reaches as high as 75% in the glass substrate.

1. Introduction

The photonic crystals have been extensively studied for the integration of functional optical devices, photonic band gap engineering, and enhanced light–matter interactions [1,2,3]. Traditional two-dimensional (2D) photonic crystals [4] have uniform lattices, as shown inside the solid green rectangle in Figure 1. The second generation 2D photonic crystals [5,6] have dual lattices with one set of lattices, one set indicated by the blue dots and the other by the red dots in Figure 1. The second-generation photonic crystals have shown enhanced light–matter interactions [5,6]. Very recently, we have studied a new type of photonic crystals titled graded photonic super-crystals (GPSC) [7,8,9,10,11]. Although the lattices are grouped by the blue and red dots, the size of the basis is different in GPSC. The basis size is the gradient, becoming smaller along the arrows for both blue and red lattice sets in Figure 1, and then becoming larger after a quarter of period. The unit cell becomes a unit super-cell in the GPSC, as opposed to the dual lattice in the second-generation photonic crystals. “Period 1” is the period for the traditional photonic crystal, while “Period 2” is the second period in the x-direction for the GPSC, as shown in Figure 1. The lattice described by “Period 1” have a square symmetry, while the lattice described by “Period 2” can have square, hexagonal, or five-fold symmetry [7,8,9,10,11]. Thus, the GPSC can have dual-periods and dual-symmetries. The lattice with “Period 1” can have other symmetries, with a cost of reduced resolution in a phase pattern if a spatial light modulator (SLM) is used in the fabrication [7,8,9,10,11]. The filling fraction of the dielectric material in the GPSC is also the gradient for the regions where the dashed green rectangular region has a high filling fraction and the solid green rectangular region has a low filling fraction.
Multiple-beam-based interference lithography has been used for the fabrication of a photonic crystal template [12,13,14,15,16,17,18,19]. The use of a phase mask or single reflection optical element has greatly reduced the complexity and has improved the mechanical stability of the optical setup [13,14,15,16,17,18,19]. Recently, SLM has been used as an electrically adjustable phase mask for the interference lithography [20,21,22,23,24,25,26,27]. The computer-generated hologram method can be used for the fabrication of the desired structure using SLM. However, the pixel-by-pixel phase engineering in SLM can reach a high resolution in the holographic fabrication [7,10,11,26,27]. Another advantage of using pixel-by-pixel phase engineering is that a Fourier filter can be predicted, and the aforementioned reflective optical element can be integrated for large area holographic fabrication [10]. Using the pixel-by-pixel phase engineering method, graded photonic super-crystals with square [7], hexagonal [7], and five-fold symmetric [11] unit super-cells have been fabricated. These four-, five-, and six-fold structures were formed by four outer beams with large interfering angles, plus four, five, or six inner beams with small interfering angles, respectively [7,11]. The interfering angles of these four common outer beams can be increased using a single reflective optical element for the formation of graded photonic super-crystals with a small Period 1 [10]. The rectangular structures are less symmetric than the four-, five-, and six-fold structures. It is interesting to know whether there is a polarization effect and whether the light extraction can be improved or reduced if the cathode of the organic light emitting device is patterned with less symmetric graded photonic super-crystals.
In this paper, we have studied the holographic fabrication of graded photonic super-crystals with a rectangular unit super-cell. A rectangular unit super-cell in a phase pattern is designed to have a desired ratio of length over width. We have also studied the extraction efficiency and polarization effect of light from the organic light emitting device, where the cathode is patterned with the graded photonic super-crystal. An extraction efficiency of up to 75% can be reached in the simulation.

2. Description of Experimental Methods and Formation of Graded Photonic Super-crystal

A 532 nm laser beam (Cobolt Samba 50 mW) was expanded and collimated using lens and a spatial filter. The phase of the laser beam was modulated using the engineered phase pattern displayed in a phase-only SLM (Holoeye PLUTO). It has an active area of 15.36 × 8.64 mm2 with 1920 × 1080 pixels. The pixel size of the SLM is 8 × 8 μm2 (“P” is the side length of a pixel square = 8 μm, which has been used in this paper). The laser is linearly polarized along the longer side of the active area and is incident onto the SLM with an incident angle of four degrees, relative to the normal of the SLM. As shown in Figure 2a, the diffracted beams from the phase pattern (Figure 2b) are displayed in the SLM and are collected through lens 1 and selected by a Fourier filter at the Fourier plane.
A unit super-cell of the phase pattern is indicated by a dashed red square in Figure 2b. The unit super-cell was divided into two 12 × 12 checkerboard regions and two 12 × 6 checkerboard regions. The gray levels of (190 and 254) are used for the regions inside the dashed green and blue squares, while (128 and 254) are used for the regions outside of the dashed green and blue squares in the unit super-cell. The gray levels were selected based on the diffraction efficiency of a small-period pattern verses a large-period pattern, their ratio, and the formation of a graded photonic super-crystals through simulation [7,11]. A simulation of an interference pattern of multi-beams with measured diffraction efficiencies and a certain exposure threshold was used to determine the gray level selection [11]. A gamma curve modulated a 0π and 2π phase into the laser beam when it as reflected by a gray level of 0 and 255, respectively, and related the phase and gray level almost linearly between 0 and 255. A gray level of 190 corresponds to a phase of (190 × 2π/255). A gray level of 254 was typically used instead of 255, because 255 corresponds to 2π or 0π in the cosine function in the simulation.
When the 532 nm laser is the incident onto the phase pattern in the SLM, it is diffracted using the following equation:
D × sin α i   =   n λ , i   =   1 ,   2 ,   3  
where D is the structural period; α the first order diffraction angle, as defined in Figure 2a and described below; and n is the diffraction order. α1 is the first order diffraction angle due to the periodic array of the gray levels of (128 and 254) or (190 and 254), and can be obtained by setting D = 2P in Equation (1). For a large period in x- and y-directions, D in Equation (1) equals 18P and 24P, and αi equals α3 and α2, respectively. The distance Lsp, Lx, and Ly between the +1 and −1 order diffractions due to small period (SP) 2P arrays, 18P arrays in x-direction, and 24P arrays in the y-direction, and can be measured in Figure 2, respectively. The diffraction condition in Equation (1) was tested by verifying Lsp = 2 × f1 tan(α1), Lx = 2 × f1 tan(α3), and Ly = 2 × f1 tan(α2), as shown in Figure 2a,c. Theoretically, Lsp/Lx = 9 and Lsp/Ly = 12. As measured in Figure 2c, Lsp/Lx = 9.20 and Lsp/Ly = 12.23. The agreement between the measured and theoretical values is high, indicating the correct assignment for D.
In the experimental setup, the lenses with focal lengths of f1 = 400 mm and f2 = 200 mm for lens 1 and lens 2, respectively, were used. The 4f setup, as shown in Figure 2a, was used. The graded photonic super-crystal was fabricated by exposing the dipentaerythritol penta/hexaacrylate (DPHPA) mixture to the inference pattern with similar spin-coating, exposure, and development conditions, as in reference [7,10,11].

3. Results

3.1. Holographic Fabrication Results

The red circles in Figure 2c are the Fourier filter, which is used to allow these eight beams to pass through. These eight beams are represented by the following equations:
E 1 ( r , t )   = E 1 cos [ + ( k   sin θ 1   cos 45 ) x + ( k   sin θ 1   sin 45 ) y + ( k   cos θ 1 ) z ω t + ϕ 1 ]  
E 2 ( r , t )   = E 2 cos [ ( k   sin θ 1   cos 45 ) x + ( k   sin θ 1   sin 45 ) y + ( k   cos θ 1 ) z ω t + ϕ 2 ]  
E 3 ( r , t )   =   E 3 cos [ ( k   sin θ 1   cos 45 ) x ( k   sin θ 1   sin 45 ) y + ( k   cos θ 1 ) z ω t + ϕ 3 ]  
E 4 ( r , t )   =   E 4 cos [ + ( k   sin θ 1   cos 45 ) x ( k   sin θ 1   sin 45 ) y + ( k   cos θ 1 ) z ω t + ϕ 4 ]  
E 5 ( r , t )   =   E 5 cos [ + ( k   sin θ 2   cos β ) x + ( k   sin θ 2   sin β ) y + ( k   cos θ 2 ) z ω t + ϕ 5 ]  
E 6 ( r , t )   = E 6 cos [ ( k   sin θ 2   cos β ) x + ( k   sin θ 2   sin β ) y + ( k   cos θ 2 ) z ω t + ϕ 6 ]  
E 7 ( r , t )   = E 7 cos [ ( k   sin θ 2   cos β ) x ( k   sin θ 2   sin β ) y + ( k   cos θ 2 ) z ω t + ϕ 7 ]  
E 8 ( r , t )   = E 8 cos [ + ( k   sin θ 2   cos β ) x ( k   sin θ 2   sin β ) y + ( k   cos θ 2 ) z ω t + ϕ 8 ]  
where E is the electric field; k is the wave vector; θ1 and θ2 (zenith angle) are the interfering angles of the outer beam and inner beams in Figure 2, respectively; 45° and β are the azimuthal angles for outer and inner beams in Figure 2, respectively; and ϕ is the initial phase of the beam. When the eight beams are overlapped, the intensity distribution in the interference pattern is determined by the following:
I ( r )   =   i   =   1 8 E i 2 ( r , t ) + i < j 8 E i · E j cos [ ( k j k i ) · r + ( ϕ j ϕ i ) ] .
The nine (Equations (2)–(10)) were programed in MATLAB, which produced interference patterns with one example in Figure 3a. The eight-beam interference can also be approximately understood by adding the interference of beams 1–4 and beams 5–8. The inference of beams 1–4 forms a structure with a small period of Λs = 2π/(k sin(θ1) cos(45)), where θ1 is determined by tan(θ1) = f1 tan (α1) ×   2 /f2. Thus, Λs = (f2/f1) 2P. The period Λx in x-direction in the interference among beams 5–8 is different from period Λy in the y-direction, and are calculated as follows: Λx = 2π/(k sin(θ2) cos(β)) and Λy = 2π/(k sin(θ2) sin(β)), where sin(θ2) cos(β) ≃ (Di/f2)(0.5 Lx/Di) and sin(θ2) sin(β) ≃ (Di/f2)(0.5 Ly/Di), as shown in Figure 2c,d. Thus, Λx = (f2/f1) 18P and Λy = (f2/f1) 24P.
A simulated eight-beam interference pattern, as shown in Figure 3a, assumes the same initial phase for all eight beams in Equation (10). The periodicity in the x- and y-directions (Λx, Λy) is labeled for the size of the unit super-cell in the holographic structure in Figure 3a. Although both the square (12 × 12) and rectangular (6 × 12) sub-unit cells are used in Figure 2b, the sub-unit cell, as indicated by the dashed red line, is in a rectangular shape in Figure 3a. The unit super-cell in Figure 3a has a ratio of length over width of Λyx = 24/18, which is obtained from (12 + 12)/(12 + 6), in Figure 2b. The design of the phase pattern is flexible for obtaining a rectangular unit super-cell in a holographic structure. For example, the unit super-cell in the phase pattern can have a sub-unit of k × k and k × m pixels. The obtained holographic structure can have a rectangular unit super-cell with a ratio of side lengths defined by 2k/(k + m).
Figure 3b shows a CCD (attached to the optical microscope) image of the fabricated graded photonic super-crystals in DPHPA. The graded pattern and dual periodicity (one in 4 μm and the others in 18 × 4 μm and 24 × 4 μm) are clearly demonstrated in Figure 3b. The fabricated pattern has a unit super-cell indicated by a dashed red rectangle with a size of (18 × 4 μm) × (24 × 4 μm). The super-cell can be divided into four sub-units, dictated by the blue square in Figure 3b, which correspond to the sub-unit dictated by the dashed red rectangle in simulation in Figure 3a. The lattice has a small period of 4 μm for both the x and y-directions. The graded lattice clusters have a rectangular symmetry. Thus, we have a graded photonic super-crystal with square lattices and rectangular lattice clusters.
The diffraction pattern of the fabricated sample is shown in Figure 3c, using a 532 nm laser. Near the 0th order diffraction spot, there are several high order diffractions. In the four corners, there are more than nine diffraction spots in each, due to the small periodic lattice and graded feature. The multiple-order diffraction indicates not only the quality of the fabricated sample, but also the strong light-matter interaction, which can be used for light extraction, as described in next section.

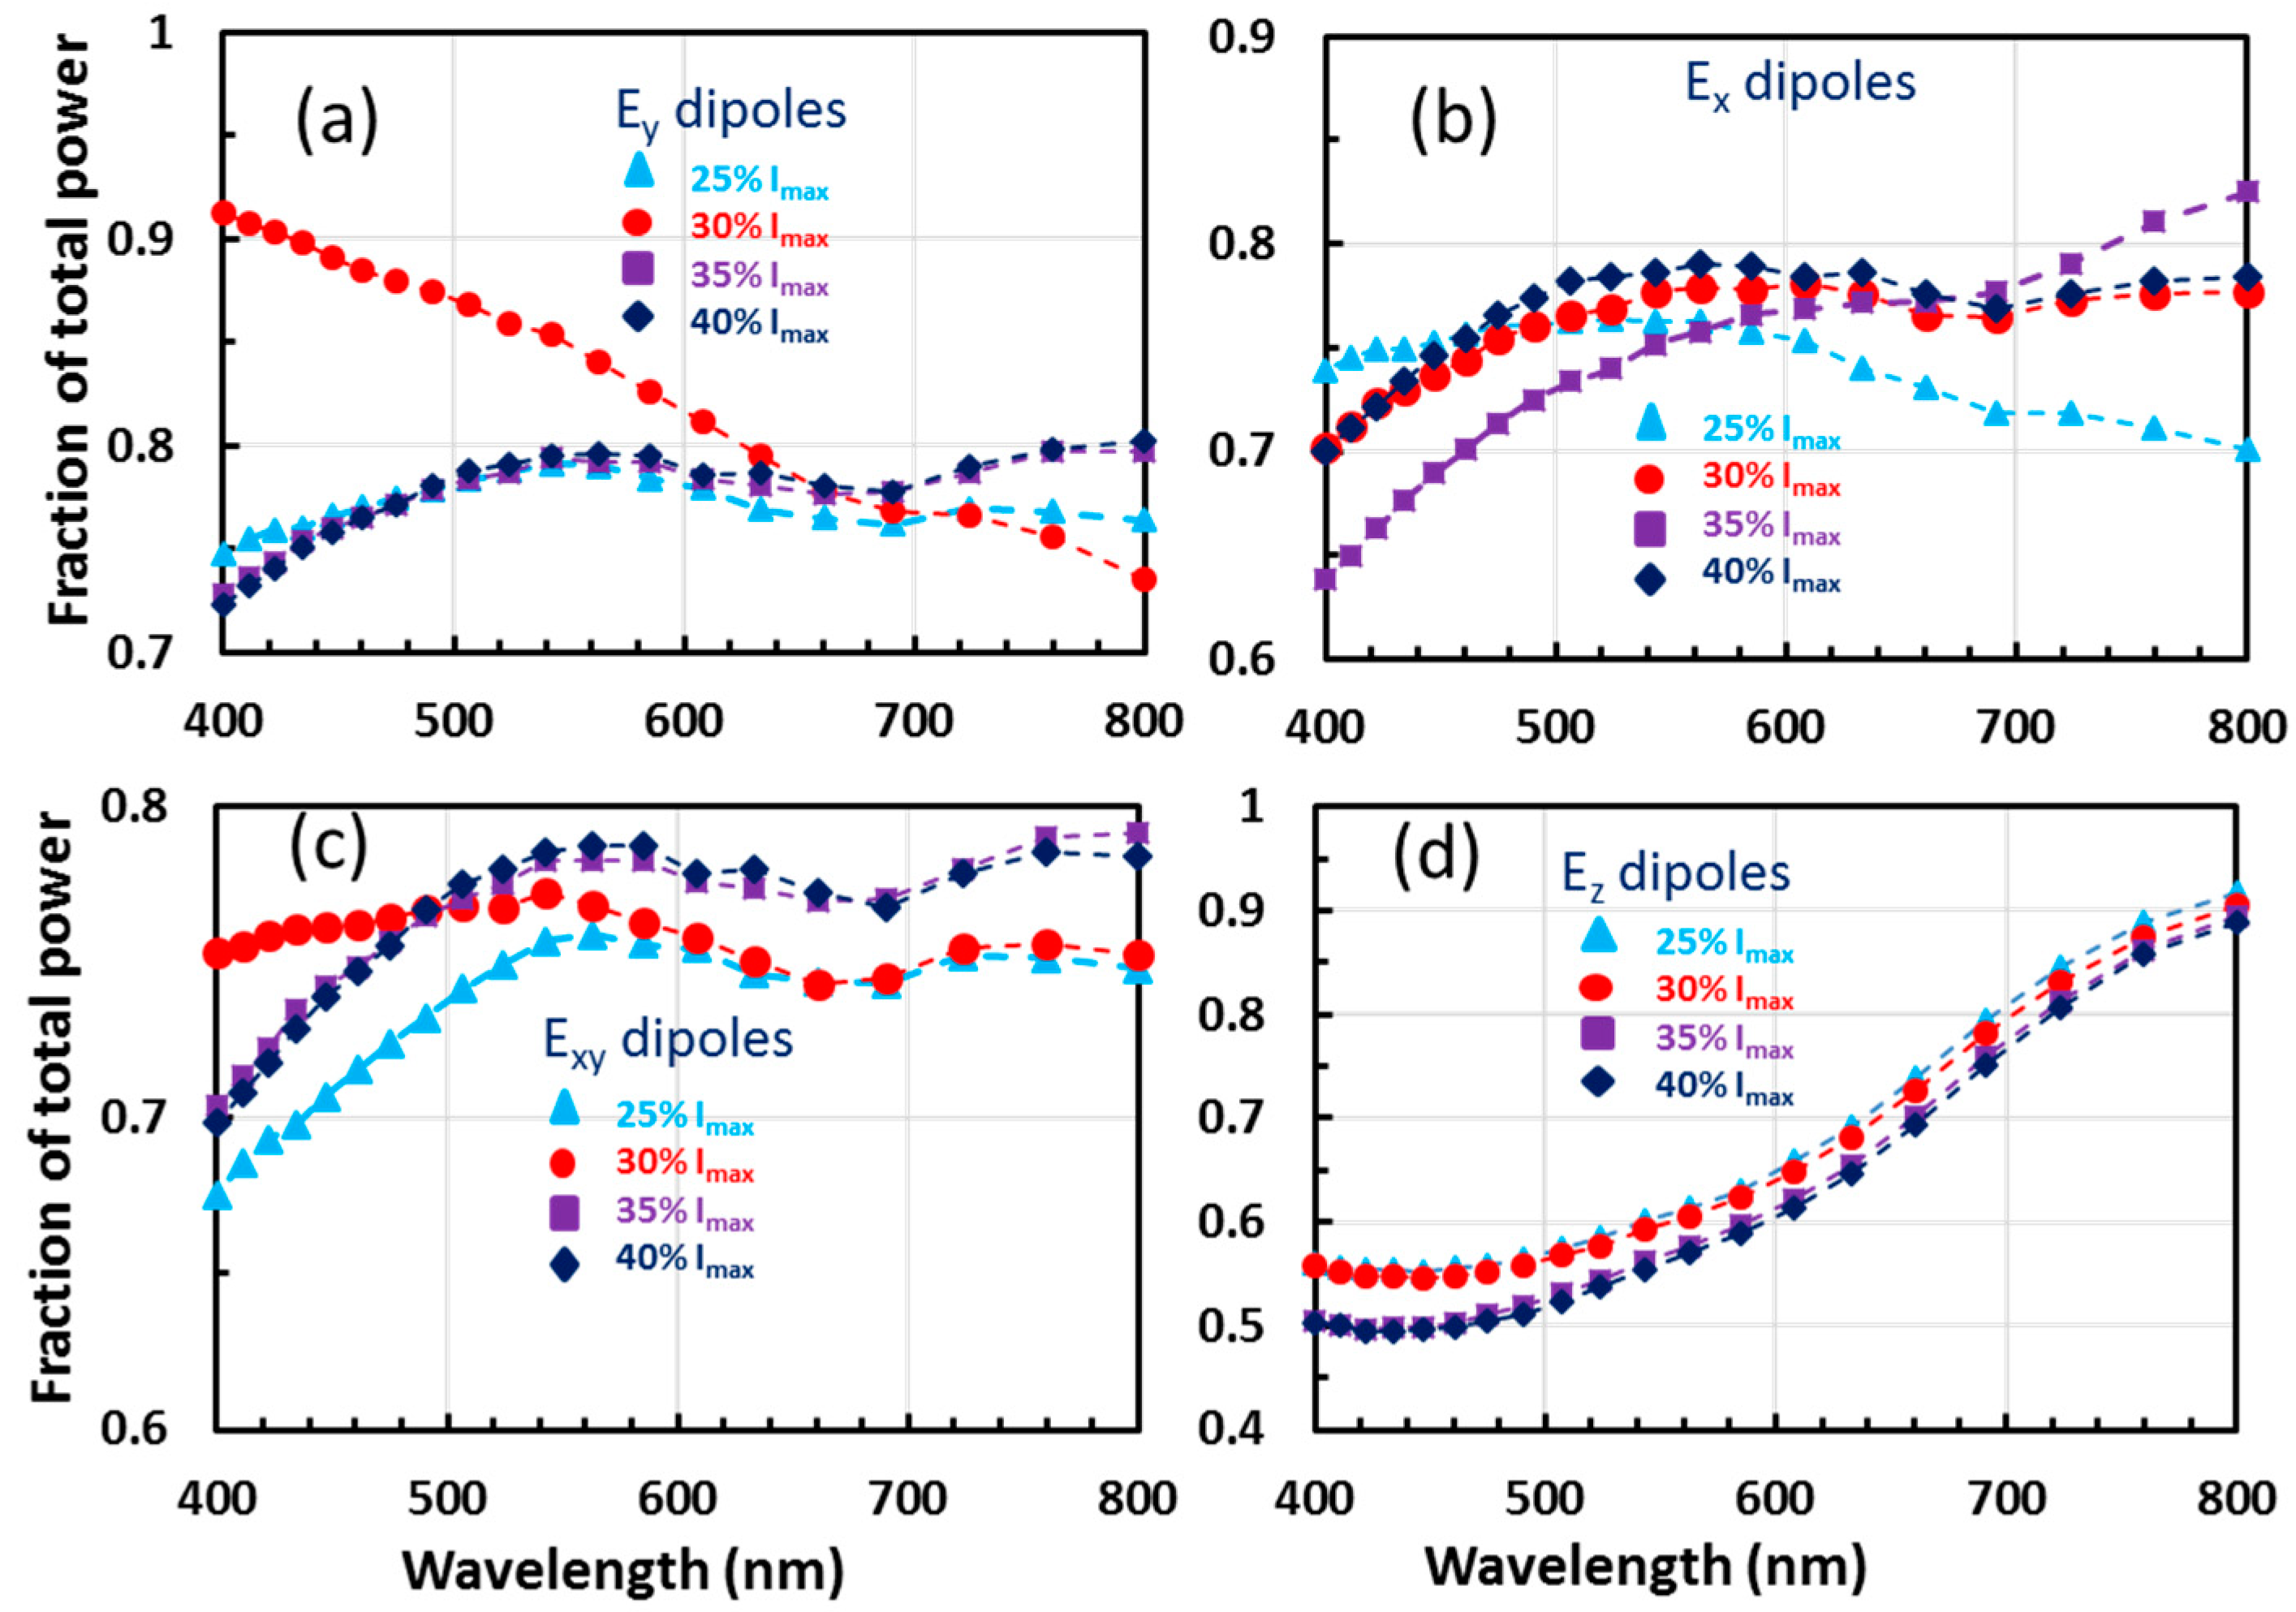
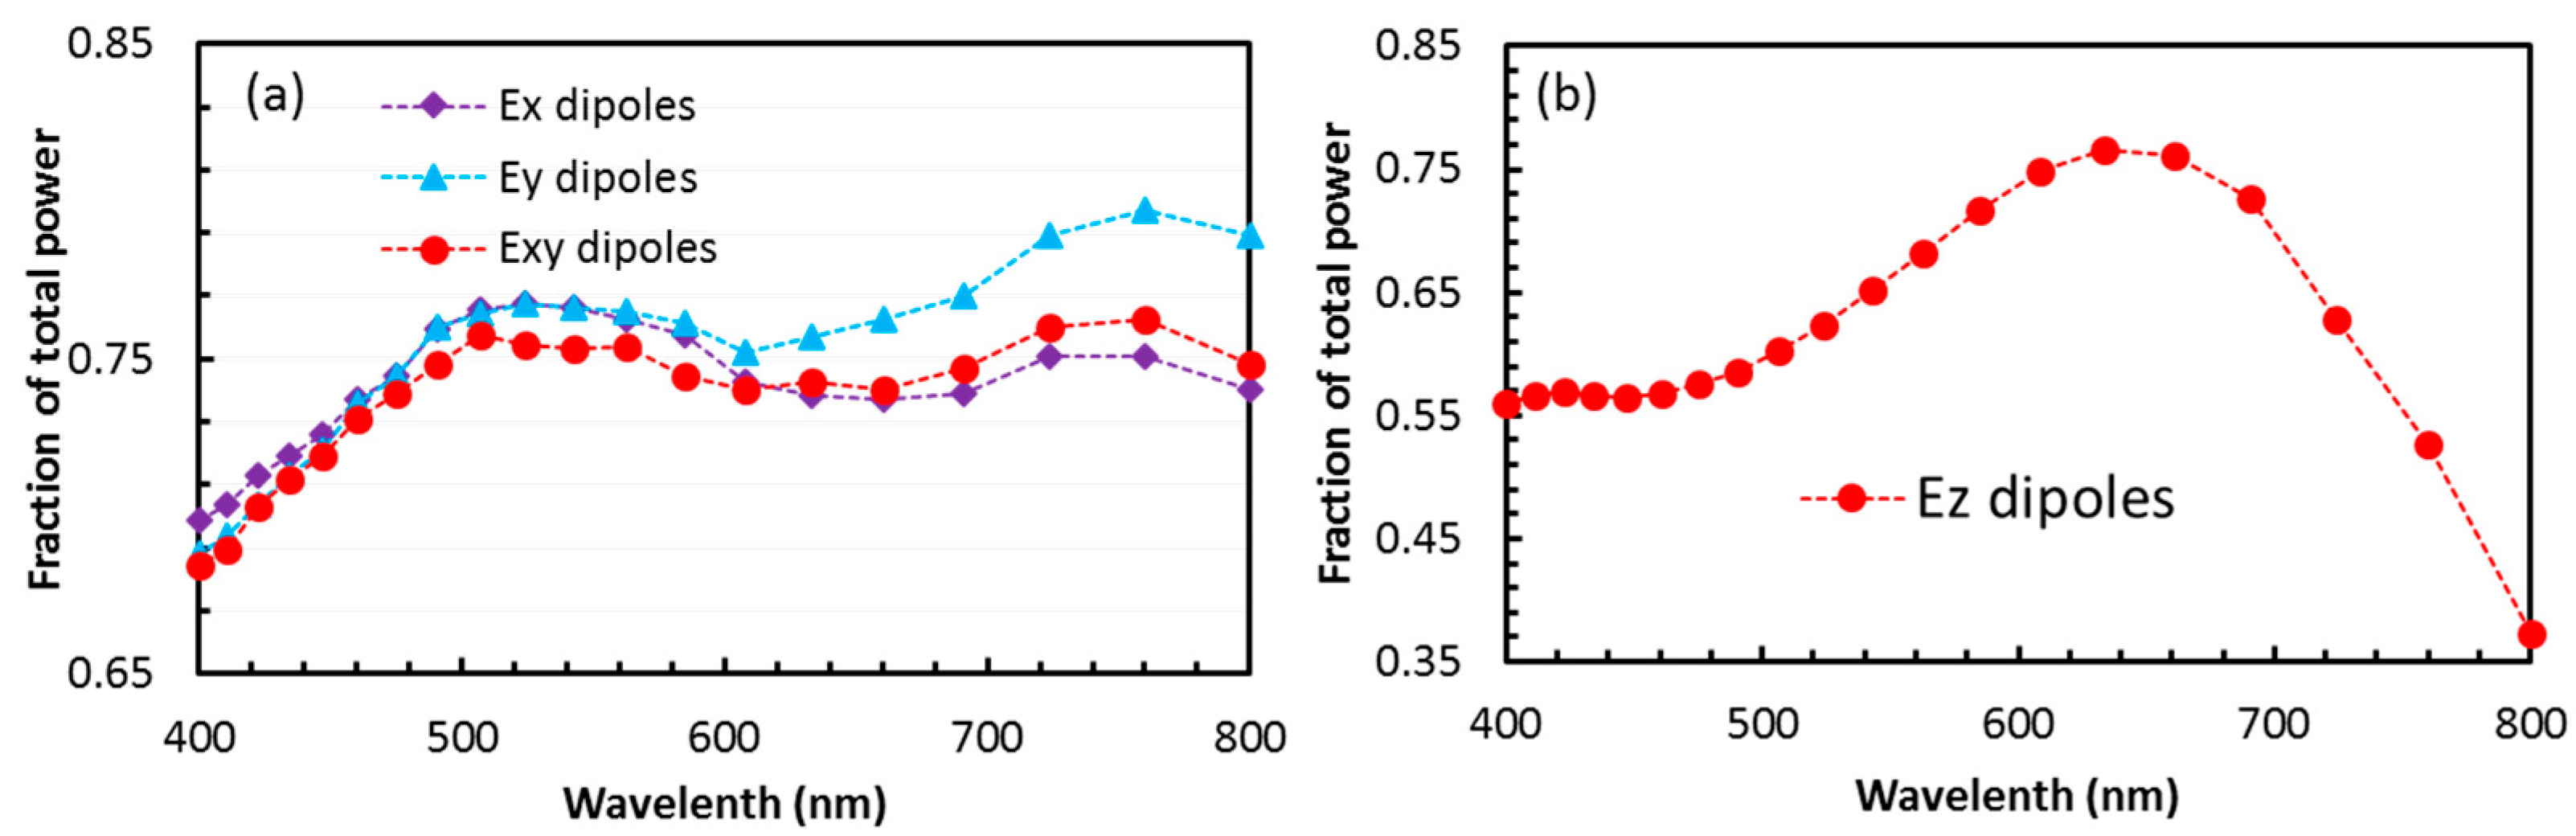
3.2. Simulation of Light Extraction Efficiency

In this section, we simulated the light extraction efficiency in the organic light emitting device (OLED), where the cathode is patterned with the graded photonic super-crystal with the rectangular unit super-cell, using the MIT Electromagnetic Equation Propagation (MEEP) simulation tool [28]. The small period of 4 μm, in Figure 3, can be reduced to a desirable value using the single reflective optical element method [10]. In this simulation, a lattice period (small period) of 1 μm is used, as shown in Figure 4a. The 100 nm organic-layer (ORG) includes the light emitting layer, electron transport layer, and the hole transport layer. We assigned refractive indices n for the glass (n = 1.45), organic (n = 1.8), and indium tin oxide (ITO) (n = 1.8) layers [8,29]. Ten different incoherent electric point-dipole sources were placed along a vertical line in the center of the ORG layer and dipoles with different polarization directions are assigned [29]. The interference pattern in Figure 3a can be divided into four sections. The top two sections have a low-intensity lattice set starting from the top-left corner of each section, indicated by the yellow lines. The bottom two sections have a high-intensity lattice set starting from the corner, as indicated by the blue lines. The simulation results should be the same if we select a quarter of unit super-cell or the whole one, based on our experience [8,9,11]. One case for the simulation of different sections, described in Figure 4, is from the literature [9]. To save the computation time, a quarter of the unit super-cell (bottom left section in Figure 3a) was used in the simulation. Figure 4b shows a permittivity structure output from the MEEP tool with a sub-unit cell size of 9a × 12a (a = 1000 nm). Due to the large unit super-cell (12 × 9 times larger than the one in the traditional photonic crystal), we performed parallel simulations using the Simpetus Electromagnetic Simulation Platform in Amazon Web Services (AWS). The E-field intensity was monitored, as shown in Figure 4c for example, in the glass substrate in OLED. The fraction of the total power as a function of the wavelength can be obtained for the light in the glass substrate, light absorbed by Al cathode (in plasmonic mode), and trapped as a waveguide mode, as shown in Figure 4d.
The light intensity in air in fraction is 6.6% less than that in the glass substrate, as simulated for other structures [11]. However, the simulation of the extraction efficiency into the glass substrate takes much less time. To save the computation time and focus on the fabrication effect, we simulated the extraction efficiency into the glass substrate for OLED, where the cathode (Al) is patterned with the graded photonic super-crystal holographically formed under different exposure thresholds. Figure 5 shows the percentage of light in the glass substrate over the total power as a function of the wavelengths for the rectangular sub-unit, as shown in Figure 4b. The laser exposure thresholds of 25%, 30%, 35%, and 40% of the maximum intensity Imax were used. The results for the dipole polarization of E in the y-, x-, xy-, and z-directions are shown in Figure 5a–d, respectively. Overall, the extraction efficiency is between 70% and 80% for the dipole polarization in the xy plane, except for the exposure threshold of 30% Imax for the Ey dipole polarization. The extraction efficiency is 86.8% for the Ey dipoles for the 30% Imax threshold, while they are 76.6% for the Ex dipoles at 524 nm. It is reasonable, because the graded intensity is modulated in a higher number of steps along a length of the rectangle in the y-direction, rather than the x-direction. If a polarization effect is needed in an OLED [30], a grade photonic super-crystal with a rectangular unit super-cell can help to reach the goal. For the laser exposure threshold of the 30% Imax, the maximum extraction efficiency is at the infrared range beyond 800 nm. Further study in the discussion section will shift the wavelength for the maximum efficiency toward the visible range. The extraction efficiency for the Ez dipoles in Figure 5d is not significantly dependent on the exposure threshold, as the groove depth of 40 nm in Figure 4a is fixed in the simulation. An overall light extraction efficiency, ρ, can be calculated using the average efficiency of the dipoles polarized in xy (parallel dipole) and z (perpendicular dipole) [8,29], as follows:
ρ   =   2 3 ρ x y + 1 3 ρ z
It should be noted that ρxy and ρz are also the average efficiency for ten dipoles. The extraction efficiency is calculated to be 71.5% at 563 nm and 73.6% at 633 nm. Under all of the exposure threshold conditions, the lowest overall extraction efficiency is 64.9% at 434 nm in the visible range.

4. Discussion

The simulation parameters used in Figure 4 and Figure 5 are the same as the graded photonic super-crystal with a square super-unit [8], where the maximum efficiency for the Ez dipoles occurred at 400 or 760 nm. The maximum efficiency of the Ez dipoles in Figure 5 was in the infrared range beyond 800 nm. If we scale down the lattice period from 1000 nm to 750 nm, the wavelength for the maximum efficiency is expected to be shifted from 800 to 800 × 750/1000 = 600 nm. Figure 6 shows the simulated extraction efficiency for OLED, where the cathode is patterned with a graded photonic super-crystal with a sub-unit cell size of 9a × 12a (a = 750 nm) with a similar groove depth of 40 nm. There are no large differences in the extraction efficiencies for the Ex, Ey, and Exy dipoles in Figure 6a. As shown in Figure 6b, the wavelength for the maximum extraction efficiency is 633 nm, close to the expected wavelength. In the range between 608 and 690 nm, the extraction efficiency is above 75%.
The high-light extraction efficiency can be understood through the effective light coupling condition provided by the graded photonic super-crystals in Equation (12) [31], as follows:
2 π λ n e f f 2 π λ sin ( θ )   =   R  
where neff is the effective refractive index of the graded photonic super-crystal, λ is the wavelength in free space, and R is the reciprocal lattice vector. The effective refractive index is related to the filling fraction f by Equation (13), as follows:
n e f f   =   n m e t a l 2 f + n o r g 2 ( 1 f )  
where nmetal and norg are the refractive index of the metal and organic material in the graded photonic super-crystal, respectively. Due to the graded filling fraction in the graded photonic super-crystal, the coupling condition can be met by many wavelengths simultaneously.
The wavelength-dependent plasmonic loss is related to the size of the basis at the lattice of the graded photonic super-crystal [32]. When the sizes of the basis at neighboring lattices are different, as shown in Figure 4a (d1 and d2), the plasmonic resonance condition is destroyed, thus less plasmonic loss can be seen in the simulation.

5. Conclusions

A graded photonic super-crystal with a rectangular unit super-cell has been holographically fabricated through the pixel-by-pixel phase engineering of a laser beam in SLM. The design of the phase pattern in the SLM has shown a capability to fabricate the graded photonic super-cell with a desired ratio of length over width in the rectangular unit super-cell. A light extraction efficiency of up to 75% has been predicted in simulations from the OLED, where the cathode is patterned with the graded photonic super-cell. A good extraction efficiency tolerance to the holographic fabrication has been predicted for the OLED devices.

Author Contributions

S.H., N.H., and D.L. performed the simulations; O.S., D.L., and N.H. performed the holographic fabrication; S.H. and D.L. contributed the parallel computation tools; Y.L. analyzed the data; Y.L., S.H., and O.S. wrote the paper. All of the authors read and commented on the manuscript.

Funding

This research was funded by U.S. National Science Foundation, grant number 1661842.

Conflicts of Interest

The authors declare no conflict of interest. The founding sponsors had no role in the design of the study; in the collection, analyses, or interpretation of data; in the writing of the manuscript; and in the decision to publish the results.

References

  1. Tandaechanurat, A.; Ishida, S.; Guimard, D.; Nomura, M.; Iwamoto, S.; Arakawa, Y. Lasing oscillation in a three-dimensional photonic crystal nanocavity with a complete bandgap. Nat. Photonics 2011, 5, 91–94. [Google Scholar] [CrossRef]
  2. Ergin, T.; Stenger, N.; Brenner, P.; Pendry, J.B.; Wegener, M. Three-dimensional invisibility cloak at optical wavelengths. Science 2010, 328, 337–339. [Google Scholar] [CrossRef] [PubMed]
  3. Qi, M.; Lidorikis, E.; Rakich, P.T.; Johnson, S.G.; Joannopoulos, J.D.; Ippen, E.P.; Smith, H.I. A three-dimensional optical photonic crystal with designed point defects. Nature 2004, 429, 538–542. [Google Scholar] [CrossRef] [PubMed]
  4. Joannopoulos, J.D.; Villeneuve, P.R.; Fan, S.H. Photonic crystals: Putting a new twist on light. Nature 1997, 386, 143–149. [Google Scholar] [CrossRef]
  5. Rinnerbauer, V.; Shen, Y.; Joannopoulos, J.D.; Soljačić, M.; Schäffler, F.; Celanovic, I. Superlattice photonic crystal as broadband solar absorber for high temperature operation. Opt. Express 2014, 22, A1895–A1906. [Google Scholar] [CrossRef] [PubMed]
  6. Rinnerbauer, V.; Lausecker, E.; Schäffler, F.; Reininger, P.; Strasser, G.; Geil, R.D.; Joannopoulos, J.D.; Soljačić, M.; Celanovic, I. Nanoimprinted superlattice metallic photonic crystal as ultraselective solar absorber. Optica 2015, 2, 743–746. [Google Scholar] [CrossRef] [Green Version]
  7. Lowell, D.; Lutkenhaus, J.; George, D.; Philipose, U.; Chen, B.; Lin, Y. Simultaneous direct holographic fabrication of photonic cavity and graded photonic lattice with dual periodicity, dual basis, and dual symmetry. Opt. Express 2017, 25, 14444–14452. [Google Scholar] [CrossRef] [PubMed]
  8. Hassan, S.; Lowell, D.; Lin, Y. High light extraction efficiency in organic light-emitting diodes by patterning the cathode in graded superlattice with dual periodicity and dual basis. J. Appl. Phys. 2017, 121, 233104. [Google Scholar] [CrossRef]
  9. Hassan, S.; Lowell, D.; Adewole, M.; George, D.; Zhang, H.; Lin, Y. Extraordinary light trapping enhancement in silicon solar cell patterned with graded photonic super-crystals. Photonics 2017, 4, 50. [Google Scholar] [CrossRef]
  10. Lowell, D.; Hassan, S.; Adewole, M.; Philipose, U.; Chen, B.; Lin, Y. Holographic fabrication of graded photonic super-crystals using an integrated spatial light modulator and reflective optical element laser projection system. Appl. Opt. 2017, 56, 9888–9891. [Google Scholar] [CrossRef]
  11. Lowell, D.; Hassan, S.; Sale, O.; Adewole, M.; Hurley, N.; Philipose, U.; Chen, B.; Lin, Y. Holographic fabrication of graded photonic super-quasi-crystal with multiple level gradients. Appl. Opt. 2018, 57, 6598–6604. [Google Scholar] [CrossRef] [PubMed]
  12. Campbell, M.; Sharp, D.N.; Harrison, M.T.; Denning, R.G.; Turberfield, A.J. Fabrication of photonic crystals for the visible spectrum by holographic lithography. Nature 2000, 404, 53–56. [Google Scholar] [CrossRef] [PubMed]
  13. Lin, Y.; Herman, P.R.; Darmawikarta, J. Design and holographic fabrication of tetragonal and cubic photonic crystals with phase mask: Toward the mass-production of three-dimensional photonic crystals. Appl. Phys. Lett. 2005, 86, 071117. [Google Scholar] [CrossRef]
  14. Chanda, D.; Abolghasemi, L.E.; Haque, M.; Ng, M.L.; Herman, P.R. Multi-level diffractive optics for single laser exposure fabrication of telecom-band diamond-like 3-dimensional photonic crystals. Opt. Express 2008, 16, 15402–15414. [Google Scholar] [CrossRef] [PubMed]
  15. Ohlinger, K.; Zhang, H.; Lin, Y.; Xu, D.; Chen, K.P. A tunable three layer phase mask for single laser exposure 3D photonic crystal generations: Bandgap simulation and holographic fabrication. Opt. Mater. Express 2008, 1, 1034–1039. [Google Scholar] [CrossRef]
  16. Chan, T.Y.M.; Toader, O.; John, S. Photonic band-gap formation by optical-phase-mask lithography. Phys. Rev. E 2006, 73, 046610. [Google Scholar] [CrossRef] [PubMed]
  17. Xu, D.; Chen, K.P.; Harb, A.; Rodriguez, D.; Lozano, K.; Lin, Y. Phase tunable holographic fabrication for three-dimensional photonic crystal templates by using a single optical element. Appl. Phys. Lett. 2009, 94, 231116. [Google Scholar] [CrossRef]
  18. George, D.; Lutkenhaus, J.; Lowell, D.; Moazzezi, M.; Adewole, M.; Philipose, U.; Zhang, H.; Poole, Z.L.; Chen, K.P.; Lin, Y. Holographic fabrication of 3D photonic crystals through interference of multi-beams with 4 + 1, 5 + 1 and 6 + 1 configurations. Opt. Express 2014, 22, 22421–22431. [Google Scholar] [CrossRef] [PubMed]
  19. Lutkenhaus, J.; Farro, F.; George, D.; Ohlinger, K.; Zhang, H.; Poole, Z.; Chen, K.P.; Lin, Y. Holographic fabrication of 3D photonic crystals using silicon based reflective optics element. Opt. Mater. Express 2012, 2, 1236–1241. [Google Scholar] [CrossRef] [Green Version]
  20. Xavier, J.; Boguslawski, M.; Rose, P.; Joseph, J.; Denz, C. Reconfigurable optically induced quasicrystallographic three-dimensional complex nonlinear photonic lattice structures. Adv. Mater. 2010, 22, 356–360. [Google Scholar] [CrossRef] [PubMed]
  21. Arrizón, V.; Sánchez-de-la-Llave, D.; Méndez, G.; Ruiz, U. Efficient generation of periodic and quasi-periodic non-diffractive optical fields with phase holograms. Opt. Express 2011, 34, 10553–10562. [Google Scholar] [CrossRef] [PubMed]
  22. Boguslawski, M.; Rose, P.; Denz, C. Increasing the structural variety of discrete nondiffracting wave fields. Phys. Rev. A 2011, 84, 013832. [Google Scholar] [CrossRef]
  23. Behera, S.; Joseph, J. Single-step optical realization of bio-inspired dual-periodic motheye and gradient-index-array photonic structures. Opt. Lett. 2016, 41, 3579–3582. [Google Scholar] [CrossRef] [PubMed]
  24. Lutkenhaus, J.; George, D.; Moazzezi, M.; Philipose, U.; Lin, Y. Digitally tunable holographic lithography using a spatial light modulator as a programmable phase mask. Opt. Express 2013, 21, 26227–26235. [Google Scholar] [CrossRef] [PubMed]
  25. Lutkenhaus, J.; George, D.; Arigong, B.; Zhang, H.; Philipose, U.; Lin, Y. Holographic fabrication of functionally graded photonic lattices through spatially specified phase patterns. Appl. Opt. 2014, 53, 2548–2555. [Google Scholar] [CrossRef] [PubMed]
  26. Ohlinger, K.; Lutkenhaus, J.; Arigong, B.; Zhang, H.; Lin, Y. Spatially addressable design of gradient index structures through spatial light modulator based holographic lithography. J. Appl. Phys. 2013, 114, 213102. [Google Scholar] [CrossRef]
  27. Lutkenhaus, J.; Lowell, D.; George, G.; Zhang, H.; Lin, Y. Holographic Fabrication of Designed Functional Defect Lines in Photonic Crystal Lattice Using a Spatial Light Modulator. Micromachines 2016, 7, 59. [Google Scholar] [CrossRef]
  28. Oskooi, A.F.; Roundy, D.; Ibanescu, M.; Bermel, P.; Joannopoulos, J.D.; Johnson, S.G. MEEP: A flexible free-software package for electromagnetic simulations by the FDTD method. Comput. Phys. Commun. 2010, 181, 687–702. [Google Scholar] [CrossRef]
  29. Oskooi, A. Texturing the cathode of white organic light-emitting diodes with a lattice of nanoscale scatterers for enhanced light out-coupling. Appl. Phys. Lett. 2015, 106, 041111. [Google Scholar] [CrossRef]
  30. Grell, M.; Bradley, D.D.C. Polarized luminescence from oriented molecular materials. Adv. Mater. 1999, 11, 895–905. [Google Scholar] [CrossRef]
  31. Shi, J.; Pollard, M.E.; Angeles, C.A.; Chen, R.; Gates, J.C.; Charlton, M.D.B. Photonic crystal and quasi-crystals providing simultaneous light coupling and beam splitting within a low refractive-index slab waveguide. Sci. Rep. 2017, 7, 1812. [Google Scholar] [CrossRef] [PubMed]
  32. Adewole, M.; Lowell, D.; Hassan, S.; George, D.; Zhang, H.; Cui, J.; Lin, Y. Broadband plasmonic total light absorption in an Al-doped ZnO/spacer/silver stack patterned with graded photonic super-crystal. Res. J. Opt. Photonics 2017, 1, 1. [Google Scholar]
Figure 1. Image of a graded photonic super-crystals: the lattices can be grouped by blue and red dots. The size of the basis becomes smaller along the blue and red arrows, and then becomes larger after a quarter of “Period 2”. The filling fraction of the dielectric material is higher inside the dashed green rectangle than the solid green rectangle. The graded photonic super-crystals have a unit super-cell as indicated by Period 2 in x-direction.
Photonics 05 00034 g001
Figure 2. (a) Schematic of the optical setup for the holographic fabrication. The spatial light modulator (SLM) is used to display the phase patterns. The diffracted beams from the SLM are filtered at the Fourier plane and form interference patterns through a 4f imaging system of lens 1 and lens 2. α1, α2, and α3 are the first order diffraction angles due to the periodic array of 2P (“P” is the side length of a pixel square = 8 μm, which has been used in this paper) pixels in x and y directions, 24P pixels in y direction, and 18P pixels in x-direction in the phase pattern in (b), respectively. θ1 and θ2 (zenith angle) are the interfering angles of the outer beam and inner beams in (c), respectively. (b) An enlarged view of the designed phase patterns. A unit super-cell is indicated by the dashed red square. Inside the unit-cell, there are two 12 × 12 square pixel patterns and two 12 × 6 square pixel patterns. The gray levels of (190 and 254) correspond to the dashed green and blue regions, while (128 and 254) correspond to the remaining regions inside the unit super-cell. (c) The laser diffraction pattern from the phase pattern in (b) at the Fourier plane. A Fourier filter is used to allow the diffraction spots inside the red circles passing through. (d) Schematic of eight beams corresponding to the outer and inner beams in (c) for the interference lithography. β is an azimuthal angle for one of inner beams in (c).
Photonics 05 00034 g002
Figure 3. (a) Simulated eight-beam interference pattern; (b) the charge-coupled device (CCD, attached to an optical microscope) image of the fabricated graded photonic super-crystal in dipentaerythritol penta/hexaacrylate (DPHPA); (c) diffraction pattern of a fabricated sample from 532 nm laser.
Photonics 05 00034 g003
Figure 4. (a) Schematic of the organic light emitting device (OLED) where the cathode (Al) is patterned with the graded photonic super-crystal that has a rectangular unit super-cell; (b) output of the structure design from the simulation software MIT Electromagnetic Equation Propagation (MEEP); (c) electric-field intensity in the glass substrate in OLED at the location 740 nm away from indium tin oxide (ITO) layer; (d) the fraction of the total emitted power in glass substrate, both in the surface plasmonic mode and in the waveguide.
Photonics 05 00034 g004
Figure 5. (a) Fraction of total emitted power (light in glass substrate over total emitted power) as a function of the wavelengths for different exposure thresholds of 25% Imax, 30% Imax, 35% Imax, and 40% Imax for the Ey dipoles (a), Ex dipoles (b), Exy dipoles (c), and Ez dipoles (d).
Photonics 05 00034 g005
Figure 6. Fraction of total emitted power as a function of wavelengths with an exposure threshold of 35% Imax for the Ex, Ey, and Exy dipoles (a), and the Ez dipoles (b) for the OLED patterned with the graded photonic super-crystal with a sub-unit cell size of 9a × 12a (a = 750 nm).
Photonics 05 00034 g006

