Article

Frequency Tuning and Modulation of a Quantum Cascade Laser with an Integrated Resistive Heater

1
Laboratoire Temps-Fréquence, Institut de Physique, Université de Neuchâtel, CH-2000 Neuchâtel, Switzerland
2
Alpes Lasers SA, CH-2072 Saint-Blaise, Switzerland
*
Author to whom correspondence should be addressed.
Photonics 2016, 3(3), 47; https://doi.org/10.3390/photonics3030047
Submission received: 23 June 2016 / Revised: 25 July 2016 / Accepted: 26 July 2016 / Published: 30 July 2016
(This article belongs to the Special Issue Quantum Cascade Lasers - Advances and New Applications)

Abstract

:
We present a detailed experimental investigation of the use of a novel actuator for frequency tuning and modulation in a quantum cascade laser (QCL) based on a resistive integrated heater (IH) placed close to the active region. This new actuator is attractive for molecular spectroscopy applications as it enables fast tuning of the QCL wavelength with a minor influence on the optical output power, and is electrically-controlled. Using a spectroscopic setup comprising a low-pressure gas cell, we measured the tuning and modulation properties of a QCL emitting at 7.8 μm as a function of the active region and IH currents. We show that a current step applied to the IH enables the laser frequency to be switched by 500 MHz in a few milliseconds, as fast as for a step of the current in the active region, and limited by heat dissipation towards the laser sub-mount. The QCL optical frequency can be modulated up to ~100 kHz with the IH current, which is one order of magnitude slower than for the QCL current, but sufficient for many spectroscopic applications. We discuss the experimental results using a thermal model of the heat transfer in terms of cascaded low-pass filters and extract the respective cut-off frequencies. Finally, we present a proof-of-principle experiment of wavelength modulation spectroscopy of a N2O transition performed with a modulation of the IH current and show some potential benefits in comparison to QCL current modulation, which results from the reduced associated amplitude modulation.

1. Introduction

Quantum cascade lasers (QCLs) [1] are widely used in high resolution molecular spectroscopy and trace gas sensing applications in the mid-infrared spectral region owing to their unique spectral and wavelength tuning properties. QCLs can be designed to emit in a broad wavelength region ranging from below 4 μm to more than 10 μm based on the mature InP semiconductor material. Singlemode continuous wave operation with output powers reaching more than 100 mW is routinely achieved nowadays at room temperature using a distributed feedback (DFB) grating [2], or by placing the QCL chip in an external cavity configuration [3]. QCLs can be continuously tuned in wavelength through their temperature or injection current. Temperature tuning is rather slow as the QCL temperature is generally controlled with a thermo-electrical cooler (TEC) through a fairly massive sub-mount. However, with a typical temperature-tuning coefficient of (Δν/ν)/T ≈ 10−4 K−1 corresponding to ~3 GHz/K in the wavelength range of 8 μm, a large tuning range can be achieved by varying the QCL temperature with a moderate change of the optical output power. Temperature tuning is, thus, mainly used for large but slow frequency sweeping. On the other hand, the QCL wavelength can be rapidly changed with the injection current, at frequencies exceeding 100 kHz [4]. However, the tuning range is limited and current modulation induces a significant change of the emitted optical power. QCL current modulation is widely used in sensitive spectroscopic techniques for trace gas sensing like wavelength/frequency modulation spectroscopy (WMS/FMS) [5,6] or photoacoustic spectroscopy (PAS) [
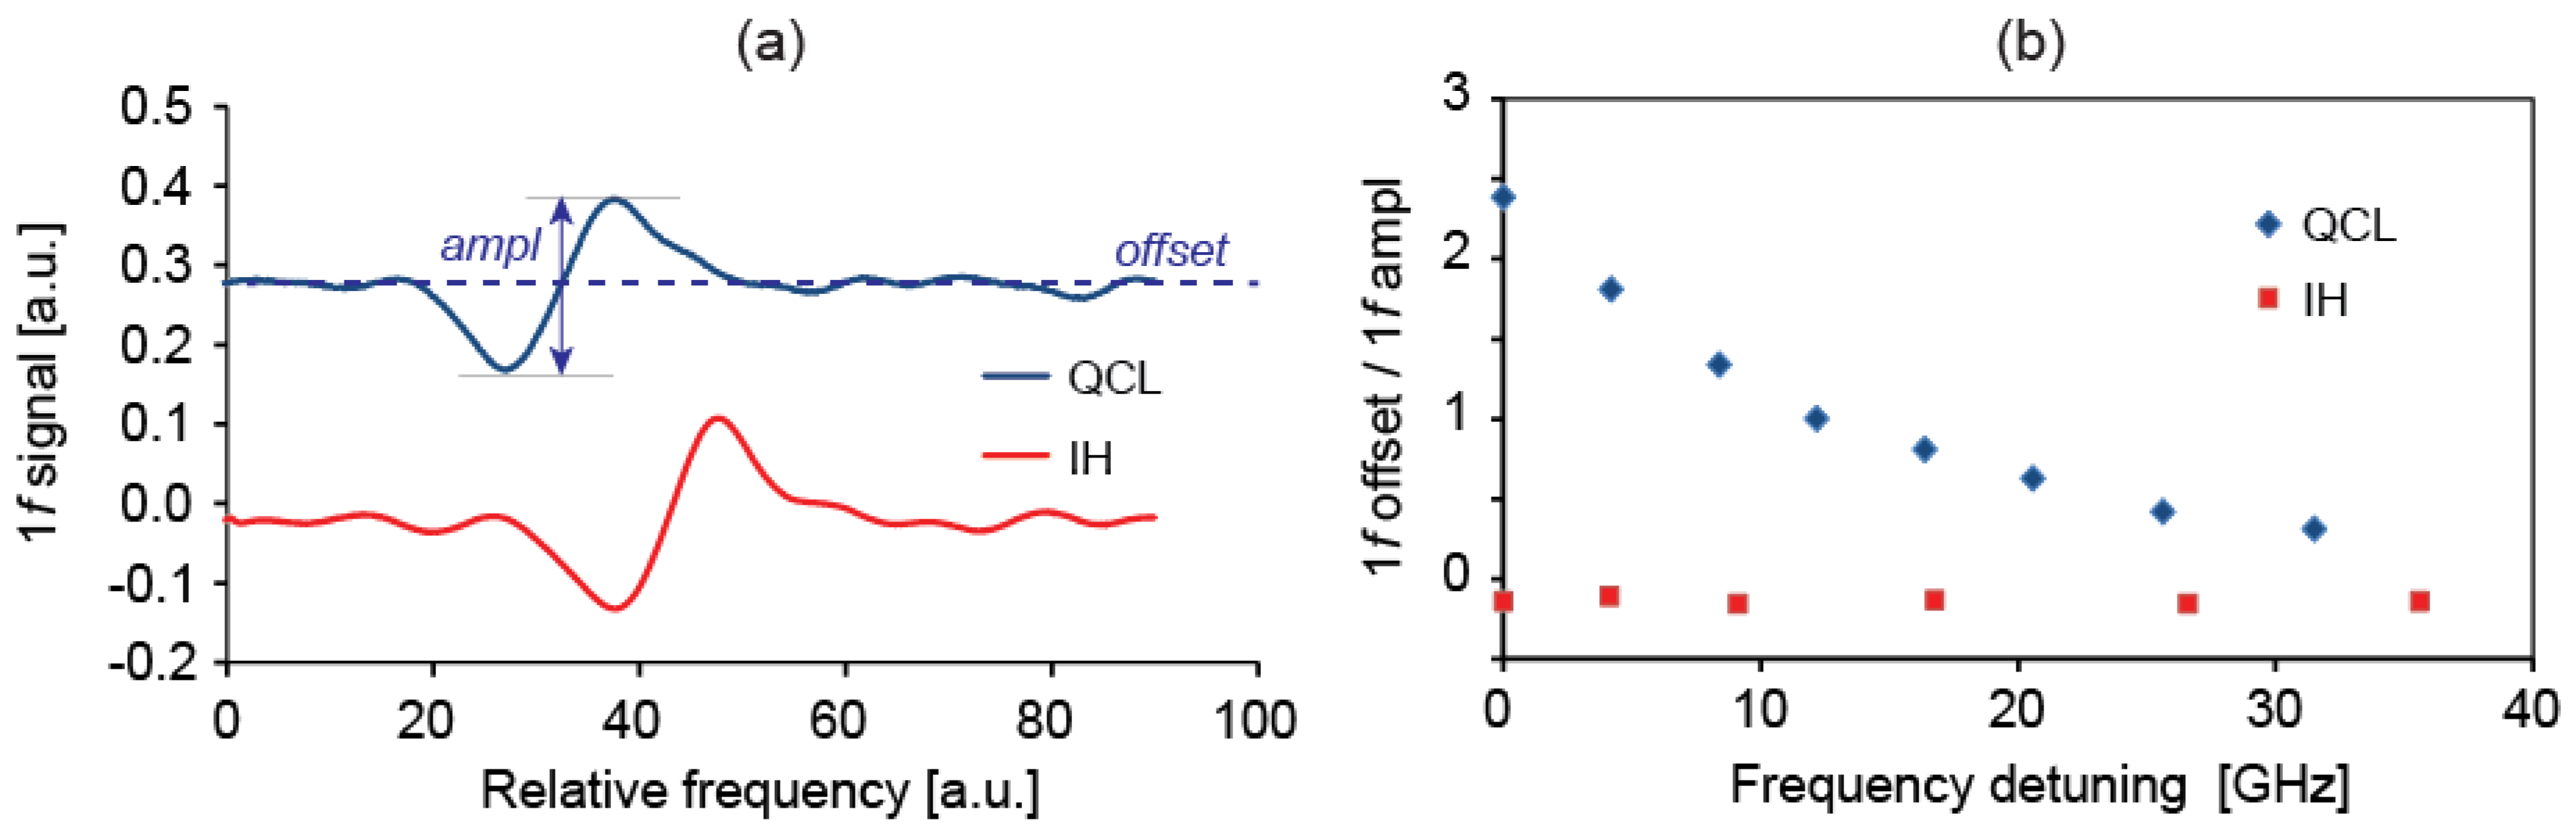
7]. Each of these techniques involves a modulation of the laser wavelength and a harmonic demodulation of the output signal detected after light-gas interaction (optical signal in WMS or acoustic signal in PAS). A derivative-like signal of the gas absorption feature is thus obtained, which is used to quantify the gas concentration. However, the strong variation in the optical power induced by the QCL current modulation leads to residual amplitude modulation (RAM). This RAM can distort the harmonic signals of a gas absorption line, in particular by inducing an offset in the first harmonic signal (1f detection) that can be detrimental in some applications, for instance when using this signal as an error signal in a feedback loop to stabilize a laser at the center of a molecular or atomic transition. RAM also results in an asymmetry of the second harmonic signal (2f detection) of a gas absorption line.
A novel tuning actuator in QCLs was recently developed by Alpes Lasers. It consists of a small heating element incorporated next to the active region of DFB QCLs [8]. This integrated heater (IH) is a resistive element driven by an electrical current, which heats the laser via Joule’s dissipation. This novel design allows the temperature of the active region to be varied much faster than by direct temperature control with a TEC, with a reduced associated change in optical power compared to QCL current modulation. These properties make this new tuning actuator attractive for gas phase spectroscopy applications.
The IH current also constitutes a novel channel to apply fast corrections for frequency stabilization and noise reduction in a QCL. Electrical feedback applied to the QCL current is the standard approach to stabilize a QCL to an optical reference, such as a molecular transition or the resonance of an optical cavity, where an error signal proportional to the QCL frequency fluctuations is generated. However, other methods have been demonstrated for frequency noise reduction in QCLs that circumvent the use of an optical reference by exploiting the correlation observed between fluctuations of the optical frequency and of the voltage between the QCL terminals [9]. Using the QCL voltage noise as an error signal to reduce the frequency noise requires another actuator that enables fast internal temperature corrections to be applied to the QCL. The reason is that temperature variations were identified to be the major contribution in the conversion of the terminal voltage noise into frequency noise in QCLs [9]. Such a correction signal cannot be applied directly to the QCL current, as it would simply transpose the QCL voltage noise into current noise without significantly changing the fluctuations of the electrical power dissipated in the laser that are responsible for the frequency noise. Therefore, a fast control of the internal temperature of a QCL for noise reduction was implemented by Tombez et al. by illuminating the top surface of the QCL with a near-infrared laser radiation that could be quickly modulated [10]. A feedback bandwidth in the range of 300 kHz was, thus, obtained. Another approach reported by Sergachev et al., consisted of driving the QCL at constant electrical power instead of constant current, which was realized using fast signal processing of the measured voltage noise [11]. The novel actuator based on an IH is attractive for the realization of such noise reduction loops in a significantly simpler and more compact implementation. However, prior to this, a first step consists in properly characterizing the properties of this new IH actuator.
In this article, we present a detailed characterization of the modulation properties of such new IH in a QCL emitting at 7.8 μm. The reported characterization includes the tuning coefficients, frequency modulation transfer function, as well as the step response. As an example of applications that can benefit from this new actuator, we present a proof-of-principle experiment of WMS of N2O using a modulation of the IH current, and compare it to the standard approach of injection current modulation.

2. Materials and Methods

The QCL manufactured by Alpes Lasers incorporates an integrated resistive heater, as described by Bismuto et al. [
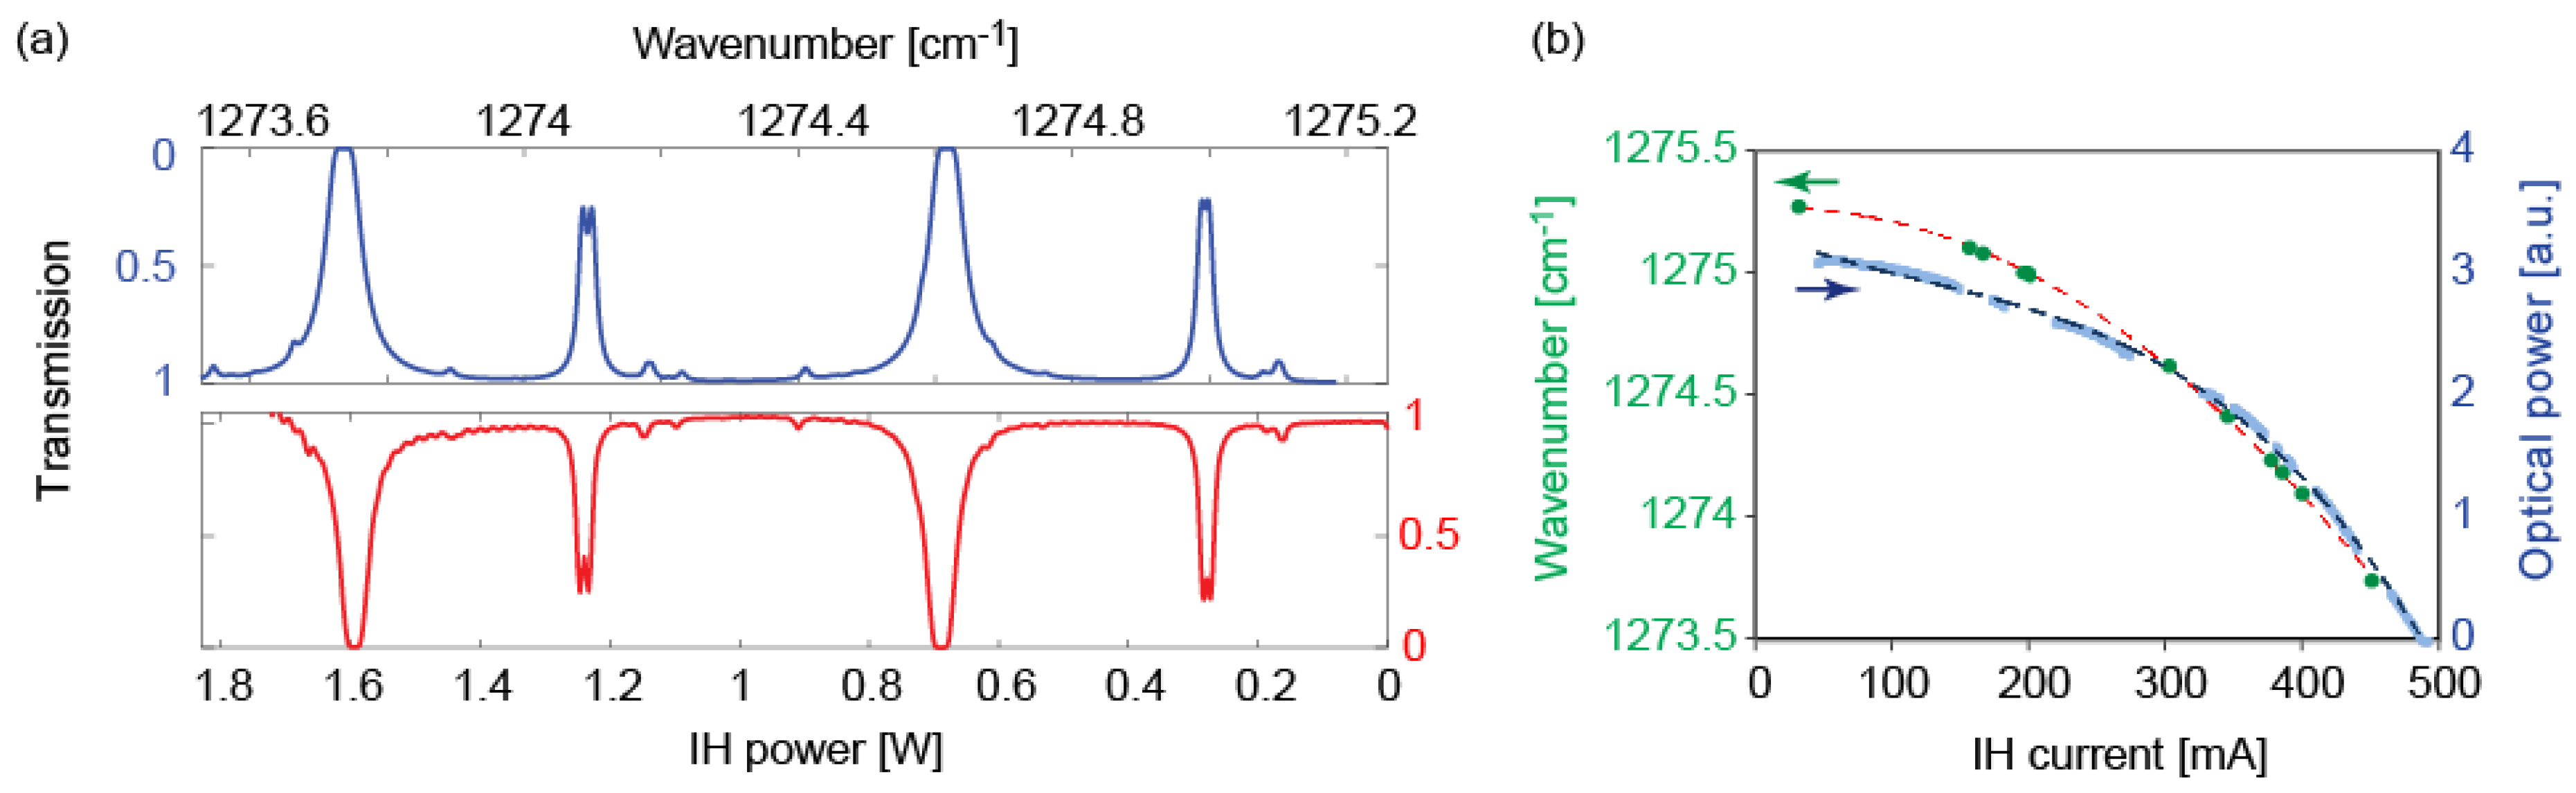
8]. The laser is a buried-heterostructure DFB-QCL with a width of the active region of 10.3 μm and a length of 2.25 mm. The integrated heater has a thickness of 2 μm and a width of 8 μm, and is located at a distance of ~1 μm from the active region. The QCL emits in the spectral range between 1273 and 1278 cm
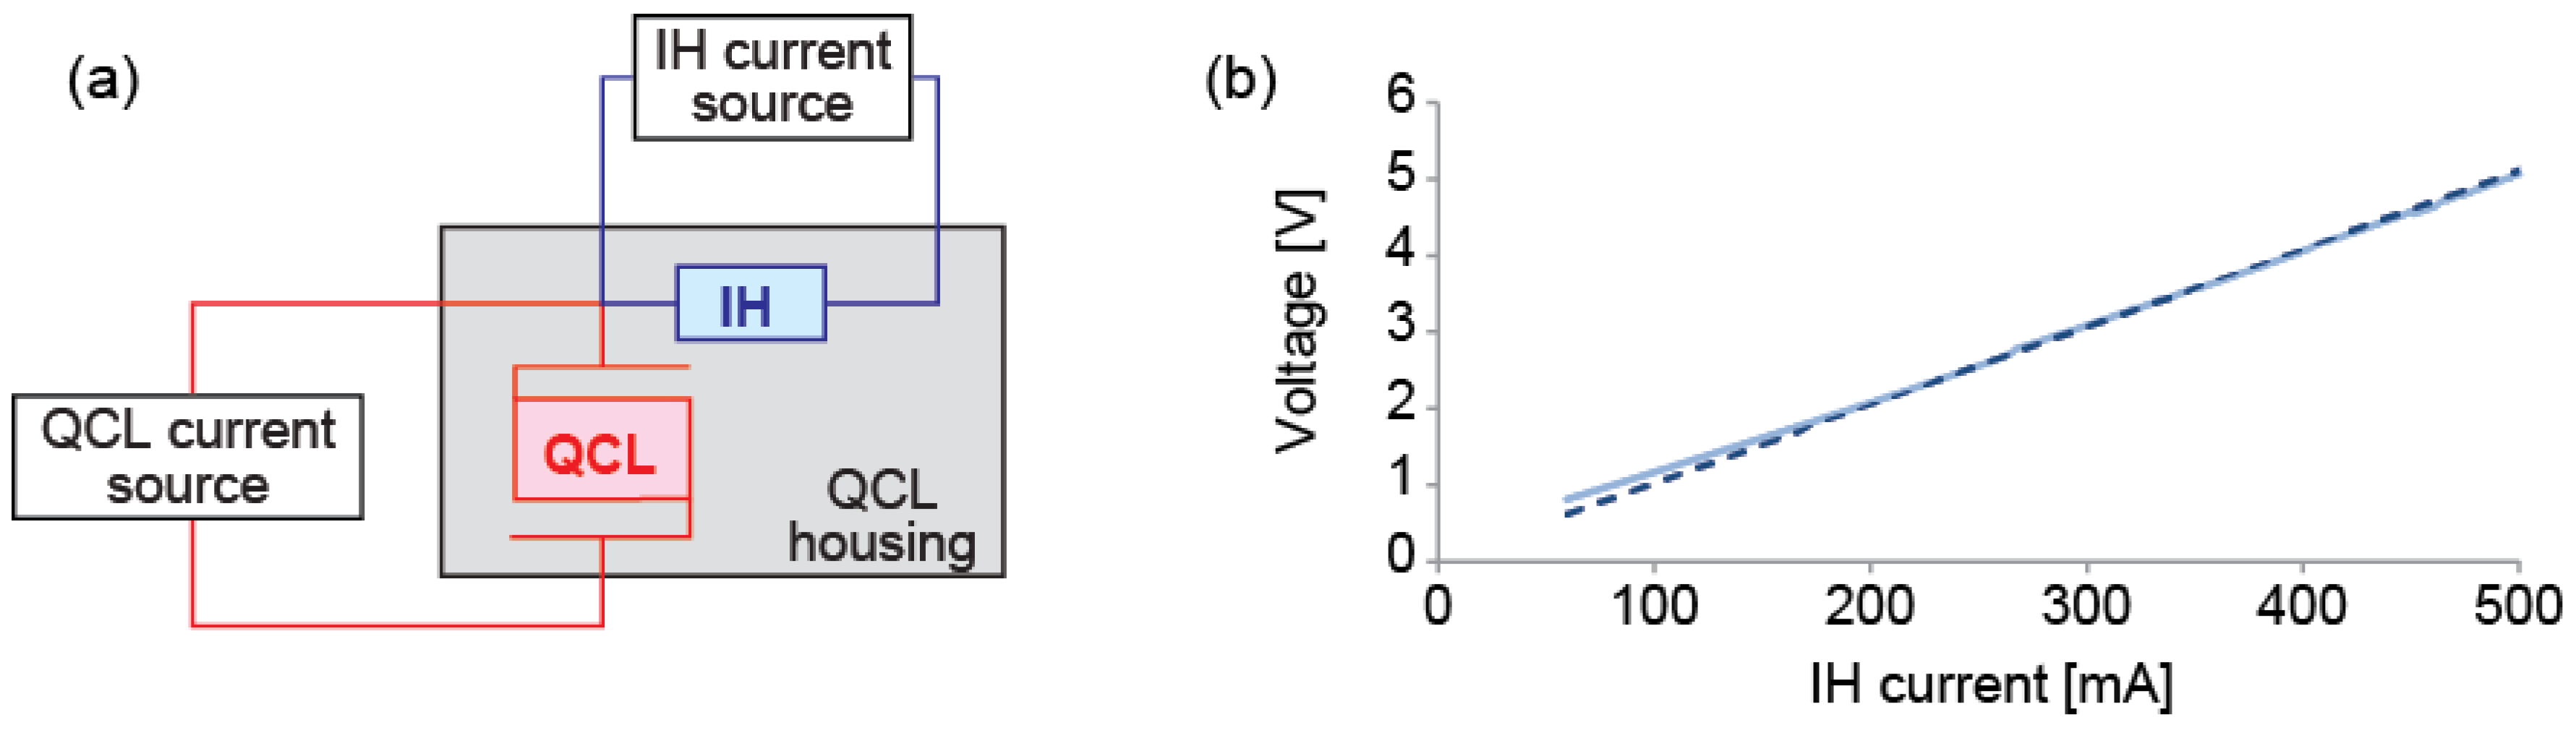
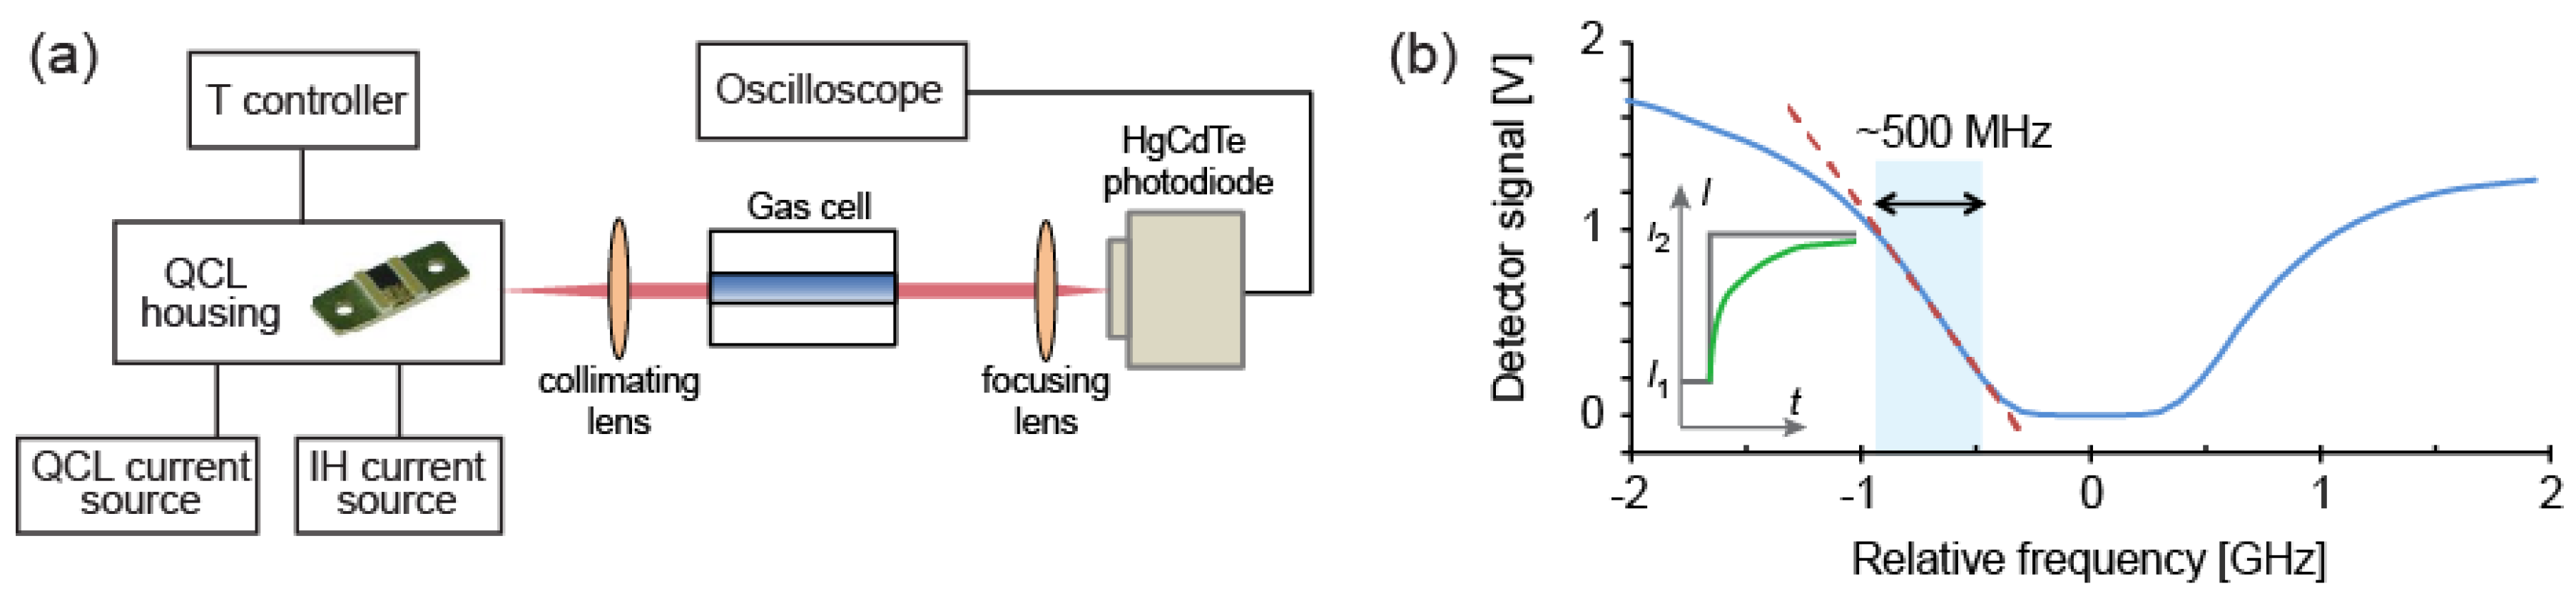
−1 within a temperature range of 0 °C to 45 °C and delivers up to 80 mW of output power. It was mounted on a copper sub-mount housed in a modified version of the laser laboratory housing (LLH) of Alpes Lasers, which accommodated the additional electrical connections to drive the IH. The laser and the IH share a common electrical potential at the laser cathode, as shown in Figure 1a, and were driven by two separate home-made low-noise current sources [9]. These drivers can deliver a current up to 1 A and have a noise spectral density lower than 1 nA/Hz1/2 at Fourier frequencies higher than 1 kHz. This feature generally enables accessing the frequency noise inherent to a QCL itself, without technical limitation resulting from the QCL current source [12]. The IH has a nearly ohmic response, as shown in Figure 1b, with an assessed resistance of ~9 Ω that is almost independent of temperature. The QCL temperature was regulated at the mK level with a double-stage TEC and a negative thermal coefficient (NTC) resistor as temperature sensor, controlled by a home-made temperature regulator.
The frequency tuning, impulse response and modulation transfer function of the laser were measured using a spectroscopic set-up that involved a 10-cm long low-pressure gas cell filled with a nominal pressure of 10 mbar of pure N2O. However, the imperfect tightness of the cell induced a contamination by air at a total pressure of ~70 mbar (see 
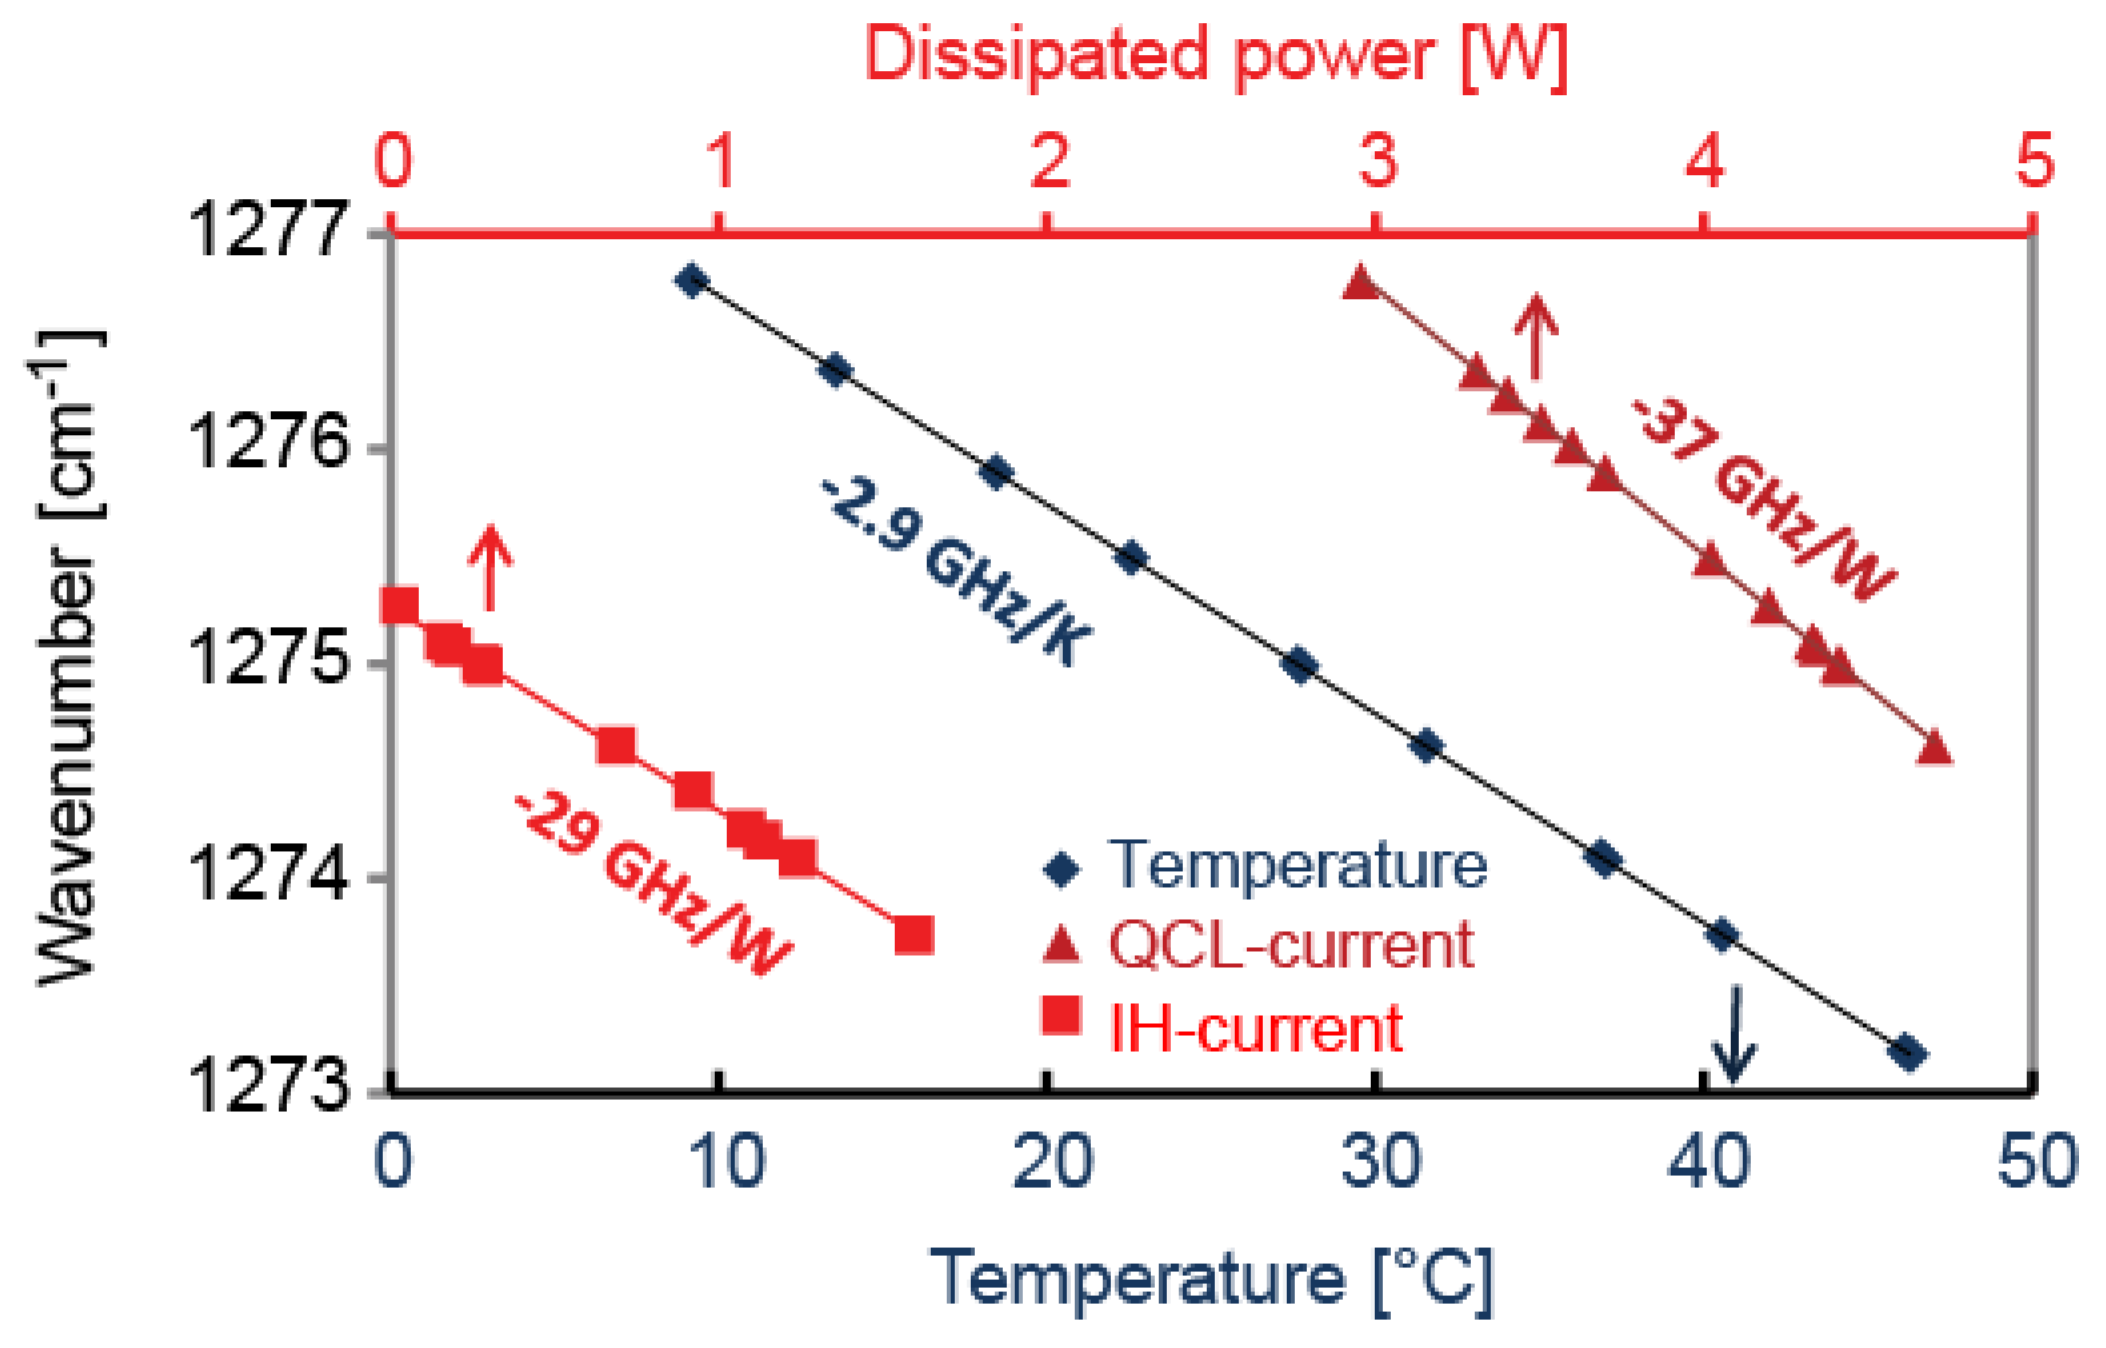
Section 3.1), which broadened the absorption lines. The tuning coefficients as a function of temperature, injection current and IH current were obtained by performing a large frequency scan with each actuator and comparing the position of several N2O absorption lines to their reference frequency extracted from the HITRAN database [
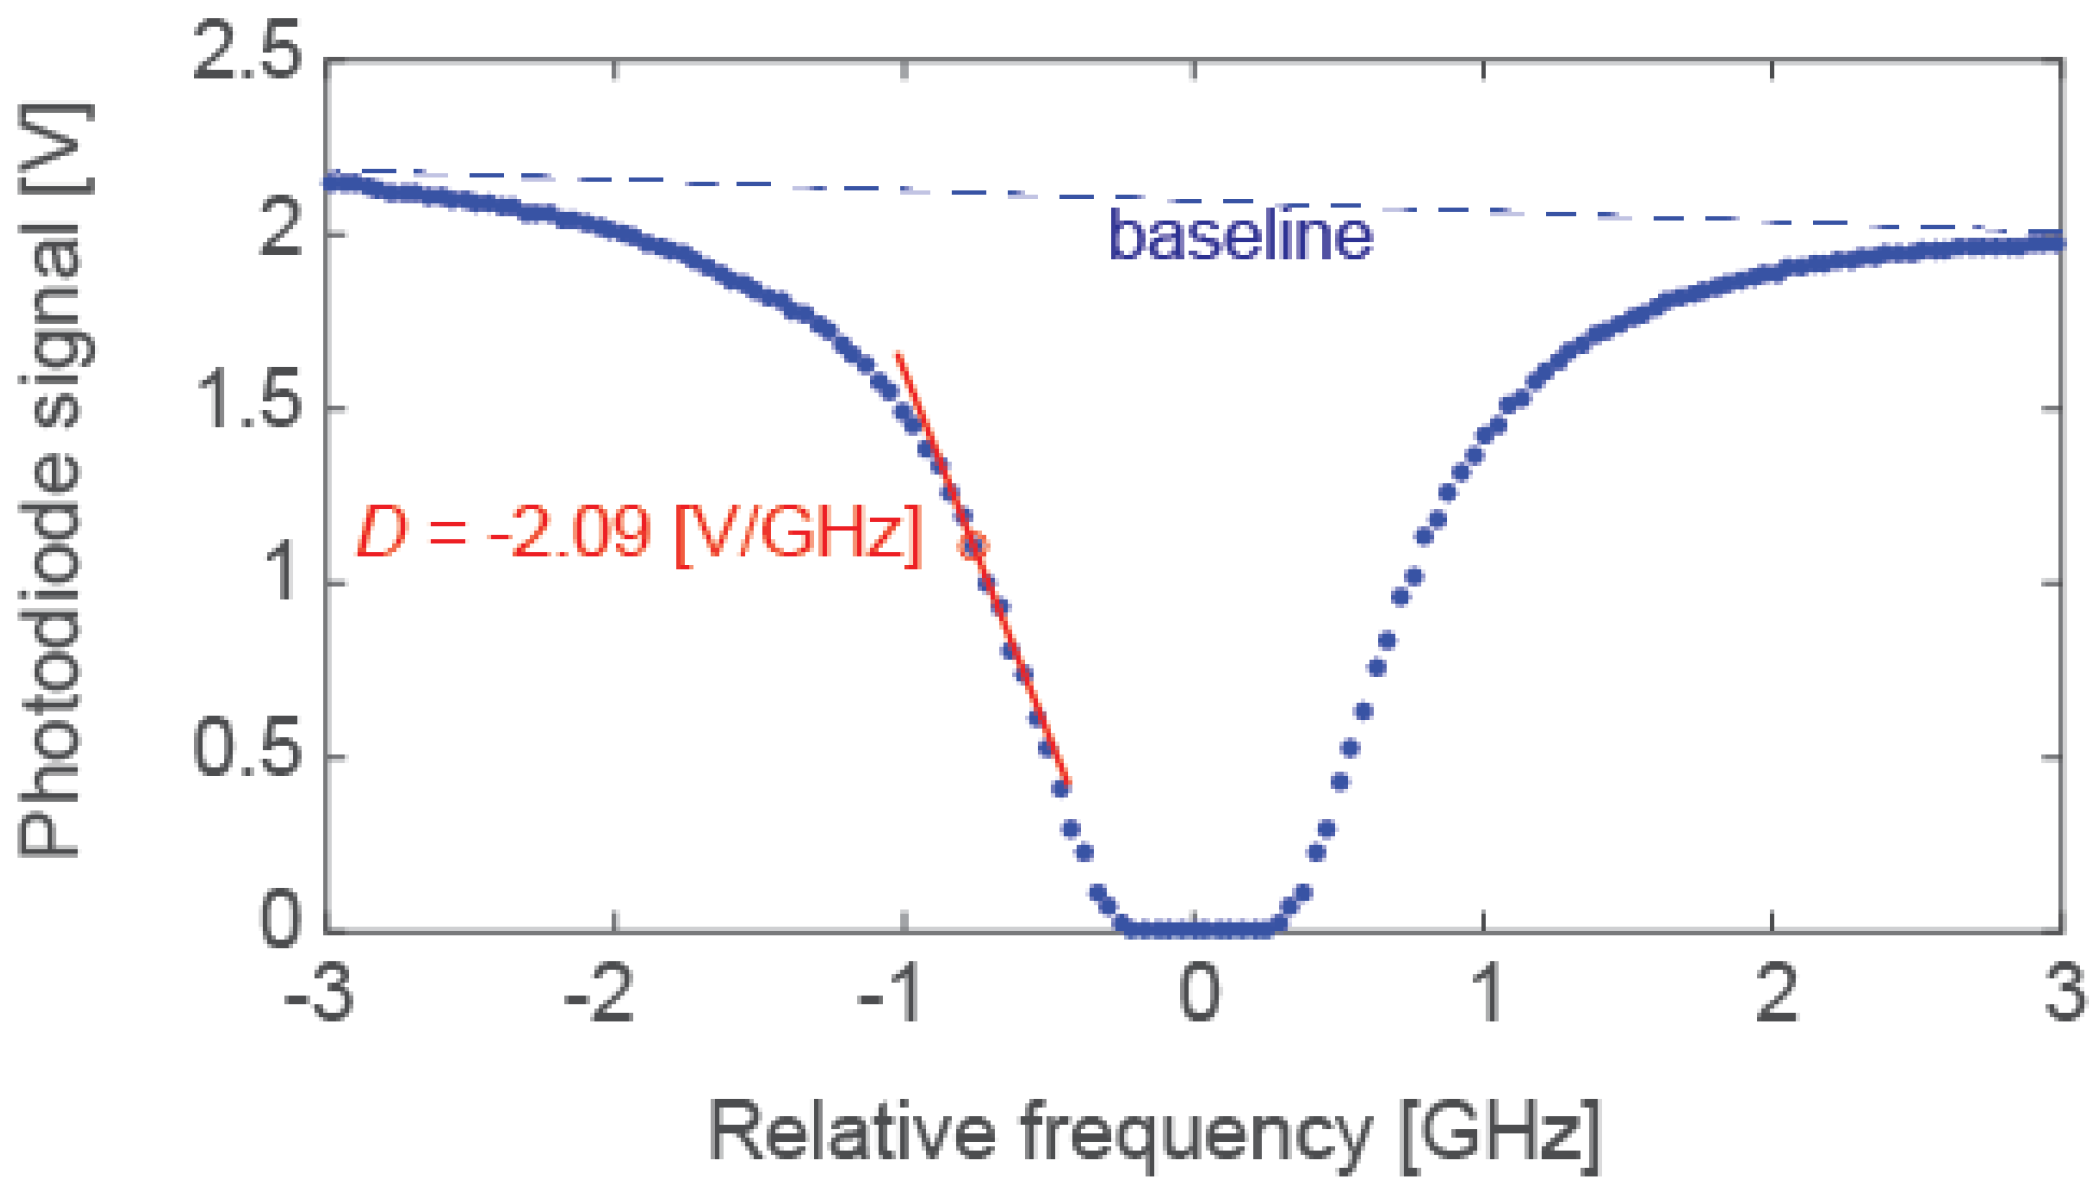
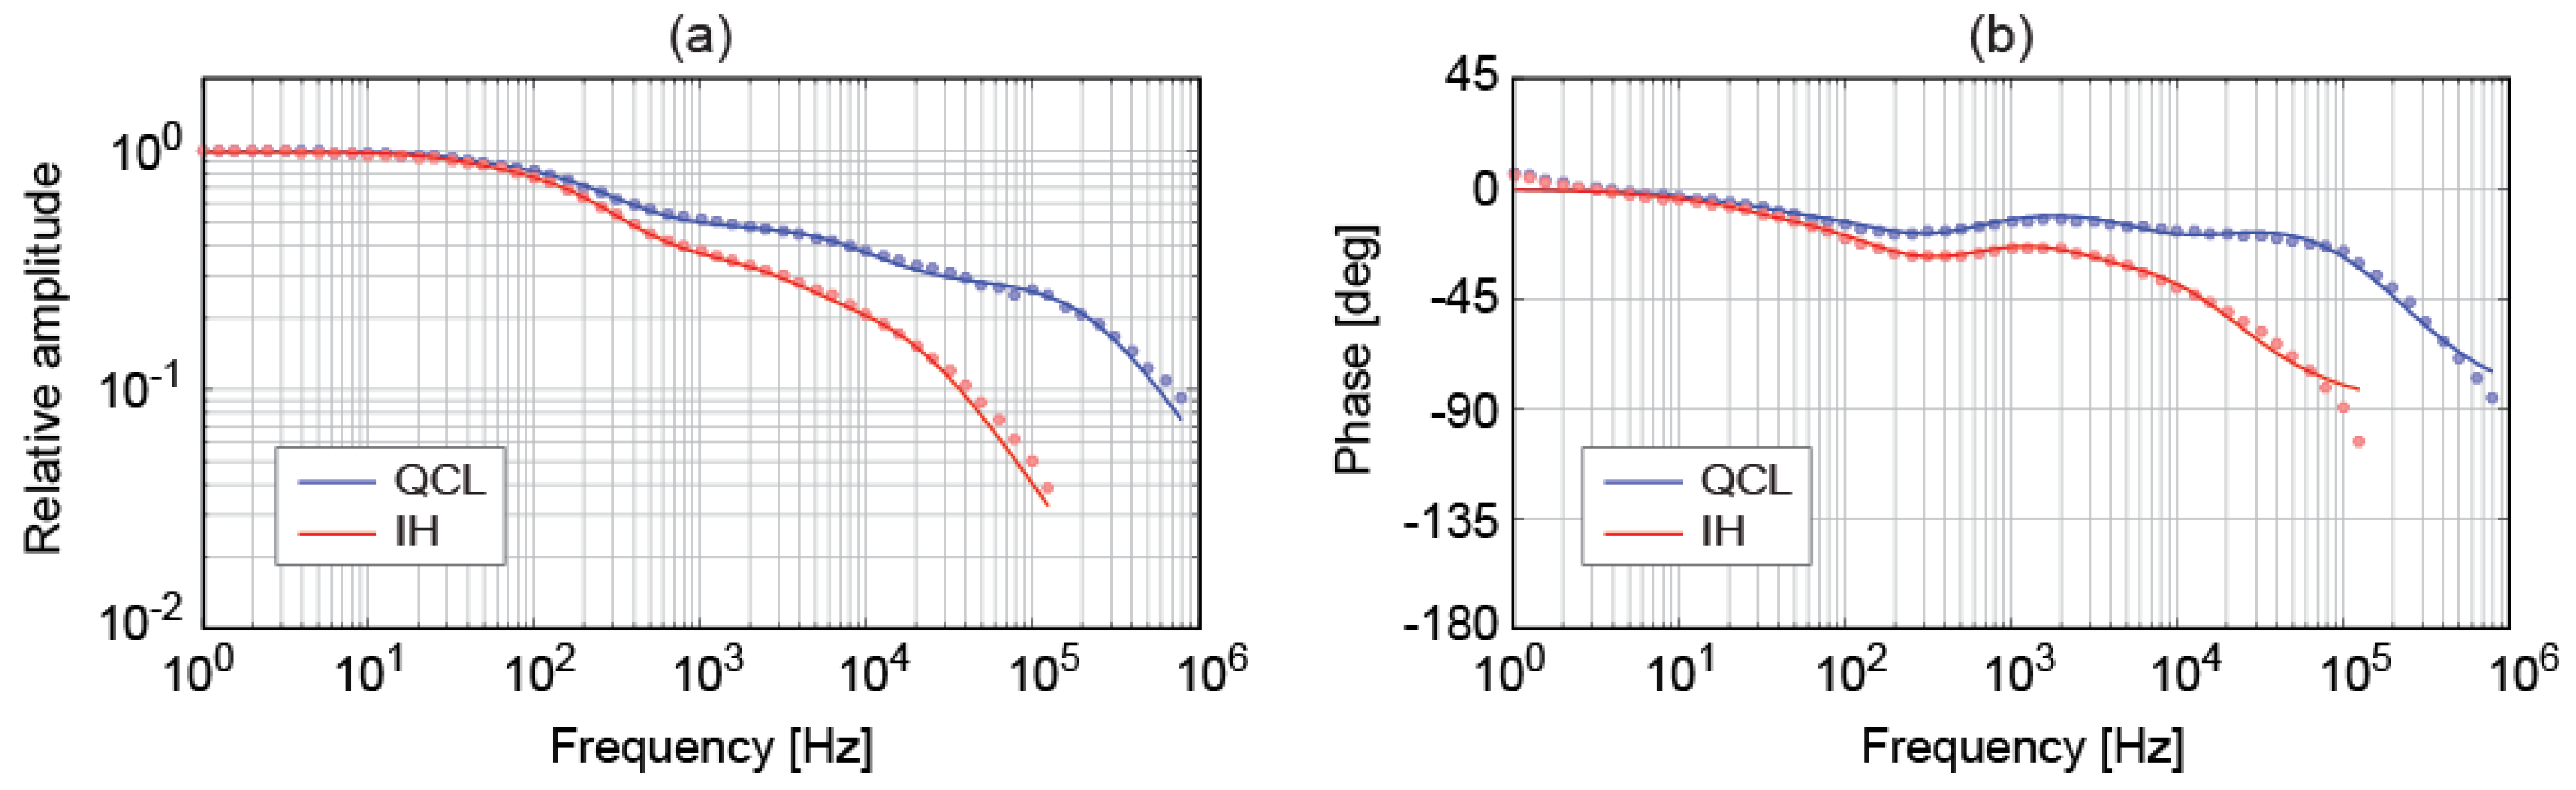
13]. The frequency modulation (FM) response of the QCL was measured by tuning the laser to the side of an absorption line used as a frequency discriminator that linearly converted the frequency modulation of the laser (induced by a small modulation of the injection current or of the IH current) into intensity modulation that was detected with a photodiode (PVI-4TE-5 from Vigo, Ozarow Mazowiecki, Poland, with a bandwidth of 100 MHz). The resulting intensity modulation was measured in amplitude and phase using a lock-in amplifier and converted into frequency modulation using the measured slope of the absorption line (see Figure 2).
Finally, the applicability of the IH for spectroscopy applications was evaluated by the measurement of the first harmonic WMS signal of a N2O transition obtained by modulating either the IH current or the QCL current at the same frequency of 25 kHz and at different IH or QCL currents.

3. Results

3.1. Tuning Coefficients

The static tuning coefficients of the QCL were determined from the position of various N2O absorption lines measured during a scan (see Figure 3a) and plotted as a function of the reference frequency extracted from the HITRAN database [13] for temperature (T), injection current (IQCL) and IH current (IIH) tuning, respectively.
Tuning of the QCL injection current or sub-mount temperature results in a nearly linear frequency sweep. On the other hand, the frequency tunes quadratically with the IH current as shown in Figure 3b, resulting from the Ohm’s law dependence. The quadratic response also shows that the IH affects the QCL frequency purely thermally through Joule’s dissipation. This leads to a linear response of the laser frequency as a function of the electrical power dissipated in the IH that is displayed in Figure 4 in comparison with the temperature and QCL-current tuning curves. The assessed tuning coefficients are −2.9 GHz/K (vs temperature), −37 GHz/W (vs dissipated power in the active region from the QCL current) and −29 GHz/W (vs. dissipated power in the IH), respectively. The power tuning coefficient for the IH is slightly lower than for the QCL current, as the heat dissipation occurs at a slightly larger distance from the active area, thus resulting in a lower heating of this latter region. The corresponding thermal resistance Rth associated with the heating of the laser active region by the dissipated power P was determined from the ratio of the power and temperature tuning coefficients, Rth = (Δν/ΔP)/(Δν/ΔT). It amounts to Rth, QCL = 12.8 (K/W) and Rth, IH = 10 (K/W), respectively, for the heat sources resulting from the QCL current and IH current.

3.2. Tuning Speed

The tuning speed of the QCL has been determined from the frequency step response to a change of the injection current, IH current, and temperature, respectively. For this measurement, the laser was tuned to the side of a N2O absorption line, as illustrated in Figure 5. The optical power transmitted through the gas absorption cell was monitored on an oscilloscope using a fast photodiode. A small step of current (1.2 mA for the QCL or 6.6 mA for the IH) or of temperature (0.16 K) was applied, producing a frequency change of approximately 500 MHz. The temporal evolution of the QCL frequency was linearly converted into a change of the transmitted optical power in the side of the absorption line.
The monitored signals were recorded on the oscilloscope and are displayed in Figure 6 (for a temperature step) and in Figure 7 (for a step of the QCL or IH current). Here, the frequency change resulting from a step of the IH current is nearly as fast as for a step of the injection current: a frequency step of 500 MHz is achieved in a similar timescale of a few milliseconds. In comparison, the temperature control with the TEC is approximately four orders of magnitude slower. The temporal response observed for a temperature step applied to the QCL sub-mount is well approximated by a single exponential decay with a long time constant of ~100 s (dashed line in Figure 6).
In contrast, the temporal response to a step of the QCL or IH current shows a very different behavior (Figure 7) characterized by a strong deviation from a single exponential response, which indicates that different thermal time constants are involved in the system. For a step of the QCL current, a very fast change of the optical frequency is first observed with a time constant τ1 < 1 μs, which is not completely resolved in the plot. This very short time constant is attributed to the fast resulting heating of the QCL active zone. It is followed by another fairly fast change (τ2 ≈ 20 μs), which is believed to result from the heat dissipation in the laser substrate. Then, it takes more time for the heat to dissipate into the copper sub-mount, and possibly in the soldering, as a result of their relatively high thermal inertia. This leads to two longer time constants τ3 ≈ 0.7 ms and τ4 ≈ 4 ms, respectively. These longer time constants are clearly visible in the semi-log plot of the QCL frequency evolution shown in Figure 7a.
For a change of the IH current, a similar temporal response is observed (Figure 7b), which is dominated by the time constants τ3 ≈ 0.8 ms and τ4 ≈ 4 ms that are close to the case of the QCL current. However, the first two time constants are not as short (τ1 ≈ 8 μs and τ2 ≈ 50 μs, respectively). This results from the fact that the heat is not directly generated in the active region, but at some distance from it, and some time is needed until the dissipated heat reaches the active region.
The cut-off frequency fi = 1/(2πτi) associated to each of these time constants will be better identified in the measurement of the frequency modulation (FM) transfer functions of the laser presented in Section 3.3.

3.3. Frequency Modulation Response

The FM transfer functions obtained for a modulation of the QCL injection current or IH current are displayed in Figure 8 (in amplitude and phase) for different average IH currents. The FM response with respect to the QCL injection current modulation is independent of the IH current. For IH current modulation, the FM response (in terms of frequency tuning coefficient per unit of IH current, in GHz/mA) scales almost linearly with the average IH current as a result of the quadratic thermal response of the heater, previously shown in Figure 3b. If expressed per unit of dissipated electrical power (in GHz/W), the tuning coefficient for the IH at low modulation frequency becomes nearly independent of the average IH current, on the order of 20 GHz/W that is in good agreement with the value previously obtained for the DC tuning coefficient. The FM response for QCL injection current shows a bandwidth of ~1 MHz, corresponding to a drop of 10 dB in amplitude and to an associated phase shift of −90°, a value that is acceptable in a feedback loop to stabilize the frequency of a QCL to an optical reference. For a modulation of the IH current, a bandwidth of around 100 kHz is typically achieved, defined in the same way as for the QCL current modulation.
In order to investigate more quantitatively these FM transfer functions and get a deeper understanding of the observed dynamic responses, we modelled the thermal response R(f) of the QCL (obtained by normalizing the dynamic FM response by its value at 1 Hz) by cascaded first-order low-pass filters that describe the heat extraction in different parts of the laser following the model previously used by Tombez et al. [4]. By considering that the output frequency of the laser is mainly determined by the average temperature in the active region and that the applied current modulation (to the heater or active region) induces a proportional variation of the electrical power dissipated in the device, the measured FM responses, thus, also represent the laser thermal response R(f):
R ( f ) = Δ T Δ P ( f ) = i R i 1 + j f / f i
In this equation, the Ri represent the thermal resistances and the fi the characteristic frequencies (thermal cut-off frequencies) associated to the different parts of the laser, which also depend on the corresponding thermal capacities Ci:
f i = 1 2 π R i C i
This simple model was used to simultaneously fit the experimental data in magnitude and phase to determine the different time constants. In contrast to the model used in Reference [4], which made use of three different low-pass filters, we added here a 4th filter with a low cut-off frequency f4 to take into account the longest time constant τ4 previously observed in the step response shown in Figure 7. As this 4th filter was not clearly apparent in the measured transfer functions, its cut-off frequency f4 = 1/(2πτ4) was directly determined from the slow decay observed in the step response and was not considered as a free parameter in the fit. We also extracted the relative contribution ri of the thermal resistance of each part of the QCL structure to the total thermal resistance:
r i = R i i R i
The fitted model is plotted along with the measured frequency modulation responses in Figure 9 and shows a very good agreement in terms of amplitude and phase. The cut-off frequencies fi retrieved from the fit for the modulation of the QCL and IH currents are listed in Table 1 together with the relative weight ri of each filter. These frequencies were used in the modeled step responses displayed in Figure 7, which were also in good agreement with the experimental data. For the QCL current modulation, the highest cut-off frequency is ~220 kHz, whereas it is one order of magnitude lower for IH modulation. This results from the fact that the heat is generated at some distance from the active region with the IH, and the temperature of the active region cannot be changed as fast as with a change of the QCL current that acts directly onto the active region.

3.4. Preliminary Application in WMS

The IH offers an alternative channel to modulate the emission frequency of the QCL at a relatively high speed. A benefit of this actuator is the capability to act directly on the internal temperature of the active region, thus offering new possibilities to reduce the frequency noise of a QCL in an all-electrical configuration using the voltage noise measured between the QCL terminals as an error signal [10]. Another potential benefit of modulating the QCL frequency through the IH current is the reduced associated RAM that can be achieved in some conditions in comparison to the modulation of the QCL injection current. This property is attractive when using the first harmonic (1f) signal of a molecular or atomic absorption line obtained in WMS to frequency-stabilize a QCL. In this case, the RAM constitutes an undesired spurious effect that generally degrades the stabilization performance as a result of the background offset present in the 1f signal. The importance of this offset depends on several parameters, such as the ratio between the FM and AM indices of the laser, but also on the phase shift between AM and FM, and on the phase of the 1f demodulation.
The traditional injection current modulation used to modulate the frequency of a QCL is naturally accompanied by some RAM as the optical power scales linearly with the injection current. This RAM produces the background offset in the 1f signal of an absorption line, whose amplitude depends on the phase of the 1f demodulation. This phase can be adjusted to cancel out the offset component due to RAM [14], but this can lead at the same time to a strong reduction of the amplitude of the 1f signal of the absorption line (induced by the laser FM), depending on the phase shift between AM and FM. Modulating the IH current to generate a WMS signal is an alternative method that can present some advantages in terms of RAM. In contrast to the QCL injection current that directly influences the output power by changing the population inversion of the gain medium, the IH current has only an indirect effect on the output power via the induced temperature change. The resulting variation of the optical power is thus weaker and can reduce the RAM impact in WMS.
To illustrate the attractiveness of the IH current modulation for WMS, we present here a proof-of-principle experiment performed on a N2O absorption line with a modulation of the IH current and we compare the results with the standard approach of injection current modulation. For this purpose, we modulated the QCL frequency with a 25-kHz sine wave signal applied either to the QCL injection current or to the IH current and we demodulated the photodiode signal detected at the output of the gas cell at the modulation frequency using a lock-in amplifier. In addition, the laser current was slowly swept with a triangular signal at 10 Hz to scan through the absorption line and the 1f signal was recorded on an oscilloscope during this sweep. Both the modulation depth and the phase of the lock-in detection were adjusted to maximize the amplitude of the 1f signal of the gas absorption line.
The first harmonic WMS signals obtained for a modulation of the QCL injection current and of the IH current are shown in Figure 10a. Both curves were obtained for a QCL injection current of ~420 mA at a laser sub-mount temperature of ~20 °C. In the case of injection current modulation, no current was applied to the IH. For IH current modulation, a DC bias current of ~170 mA was applied on top of the modulation and the QCL temperature was slightly decreased by ~2 K to compensate for the resulting frequency shift of ~6 GHz and to keep the laser on the N2O transition. The derivative signal of the absorption line sits on a background offset that directly results from the intensity modulation of the emitted light. This offset is large in the case of a modulation of the QCL injection current, as it directly modulates the laser gain and therefore the optical power. However, the relative importance of the RAM, and thus the magnitude of the background offset in the WMS 1f signal, has a significant dependence on the average QCL current: the relative magnitude of the offset decreases when the QCL injection current increases, as the relative power modulation is reduced accordingly, whereas the FM tuning coefficient has only a minor dependence. This relative reduction of the RAM is illustrated in Figure 10b, which shows the ratio between the background offset (arising from RAM) and the peak-to-peak amplitude of the spectroscopic component of the N2O absorption line (arising from FM) in the detected 1f signal obtained for QCL and IH current modulation at different QCL (respectively IH) currents. For a modulation of the IH current, the offset in the 1f signal is tiny as the optical power varies only due to the resulting temperature change. The offset has also an opposite sign compared to the QCL current modulation, as the optical power decreases with increasing IH current as illustrated in Figure 3b, whereas it increases with the injection current. Furthermore, the relative magnitude of the background offset in the WMS 1f signal (and thus the importance of RAM) remains almost constant at any IH current, which illustrates the good decoupling between frequency and amplitude modulation when modulating the IH current.

4. Conclusions and Outlook

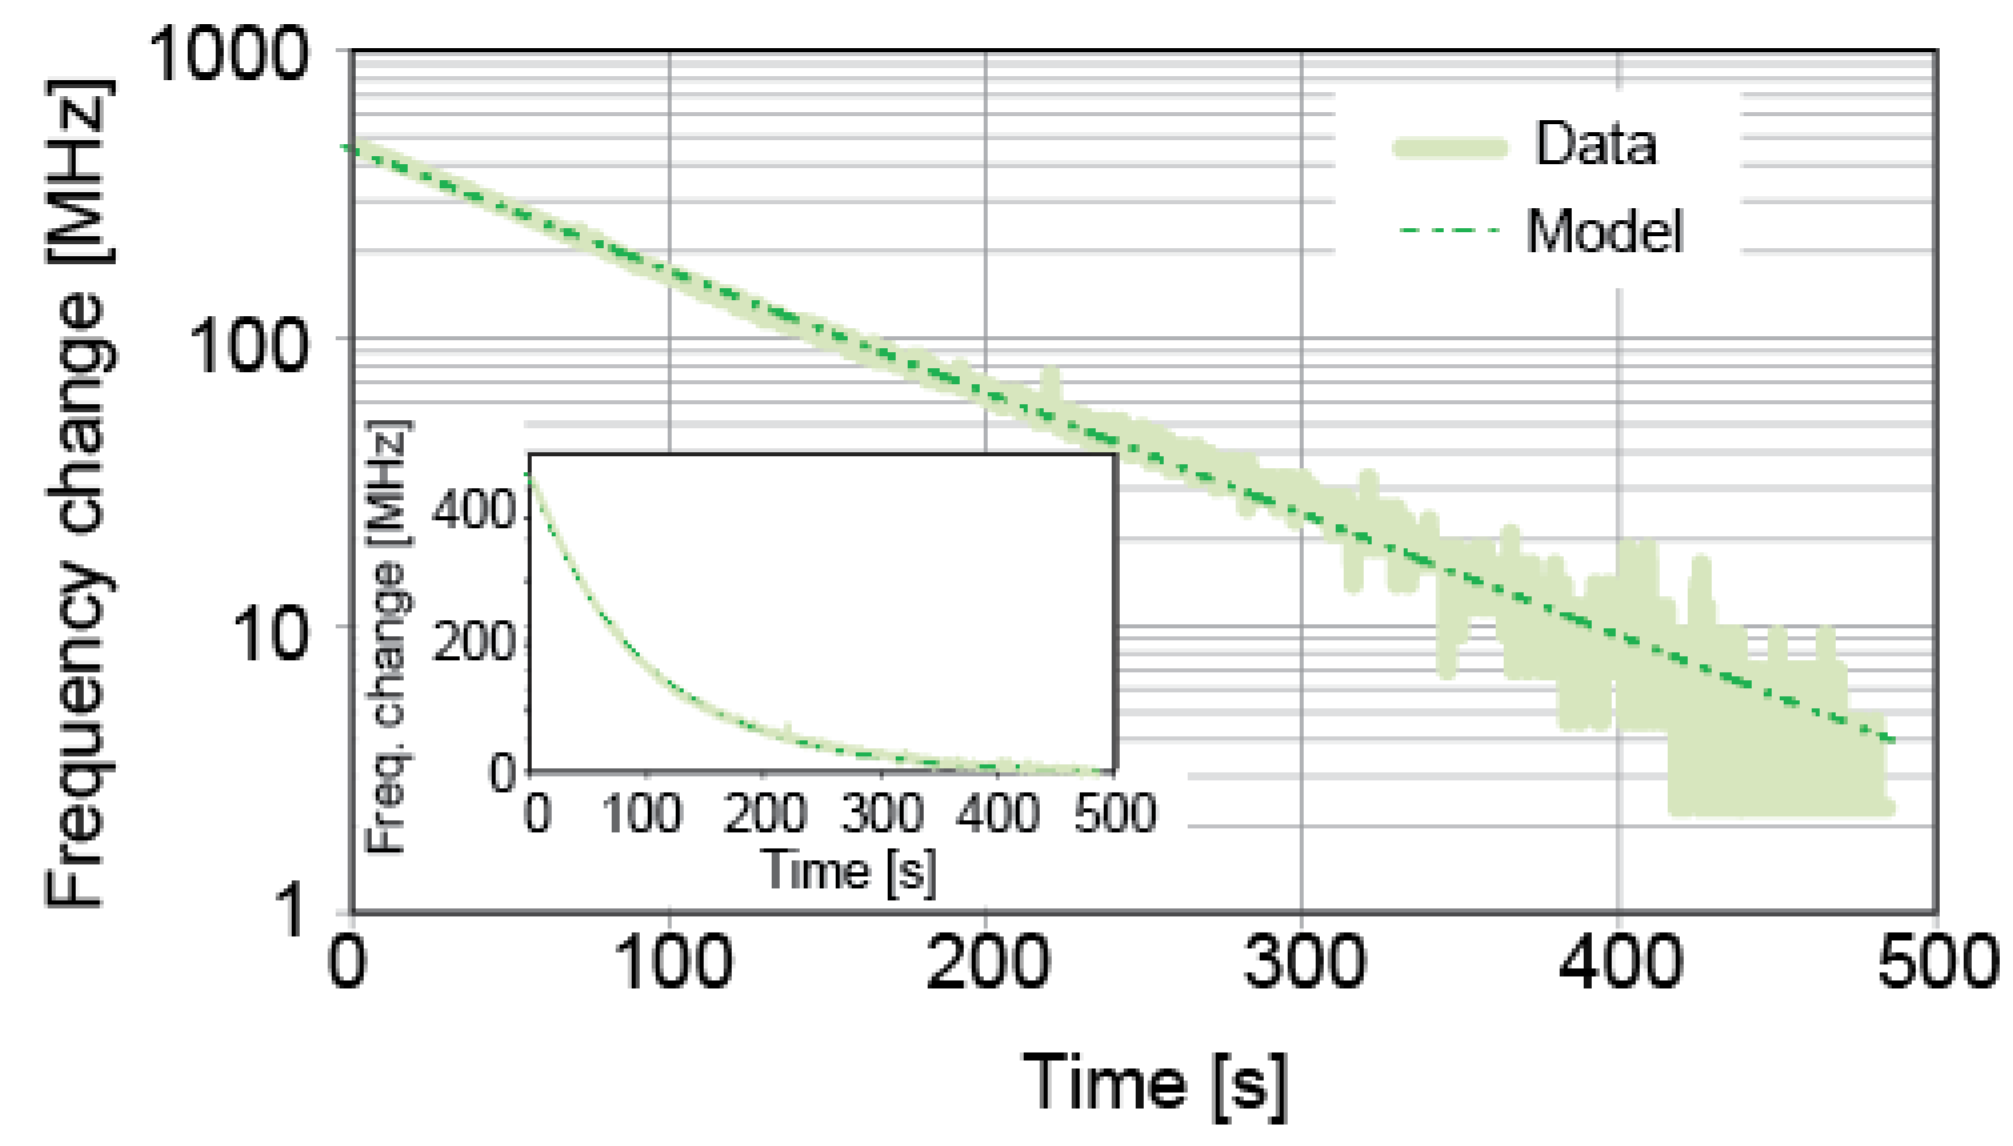
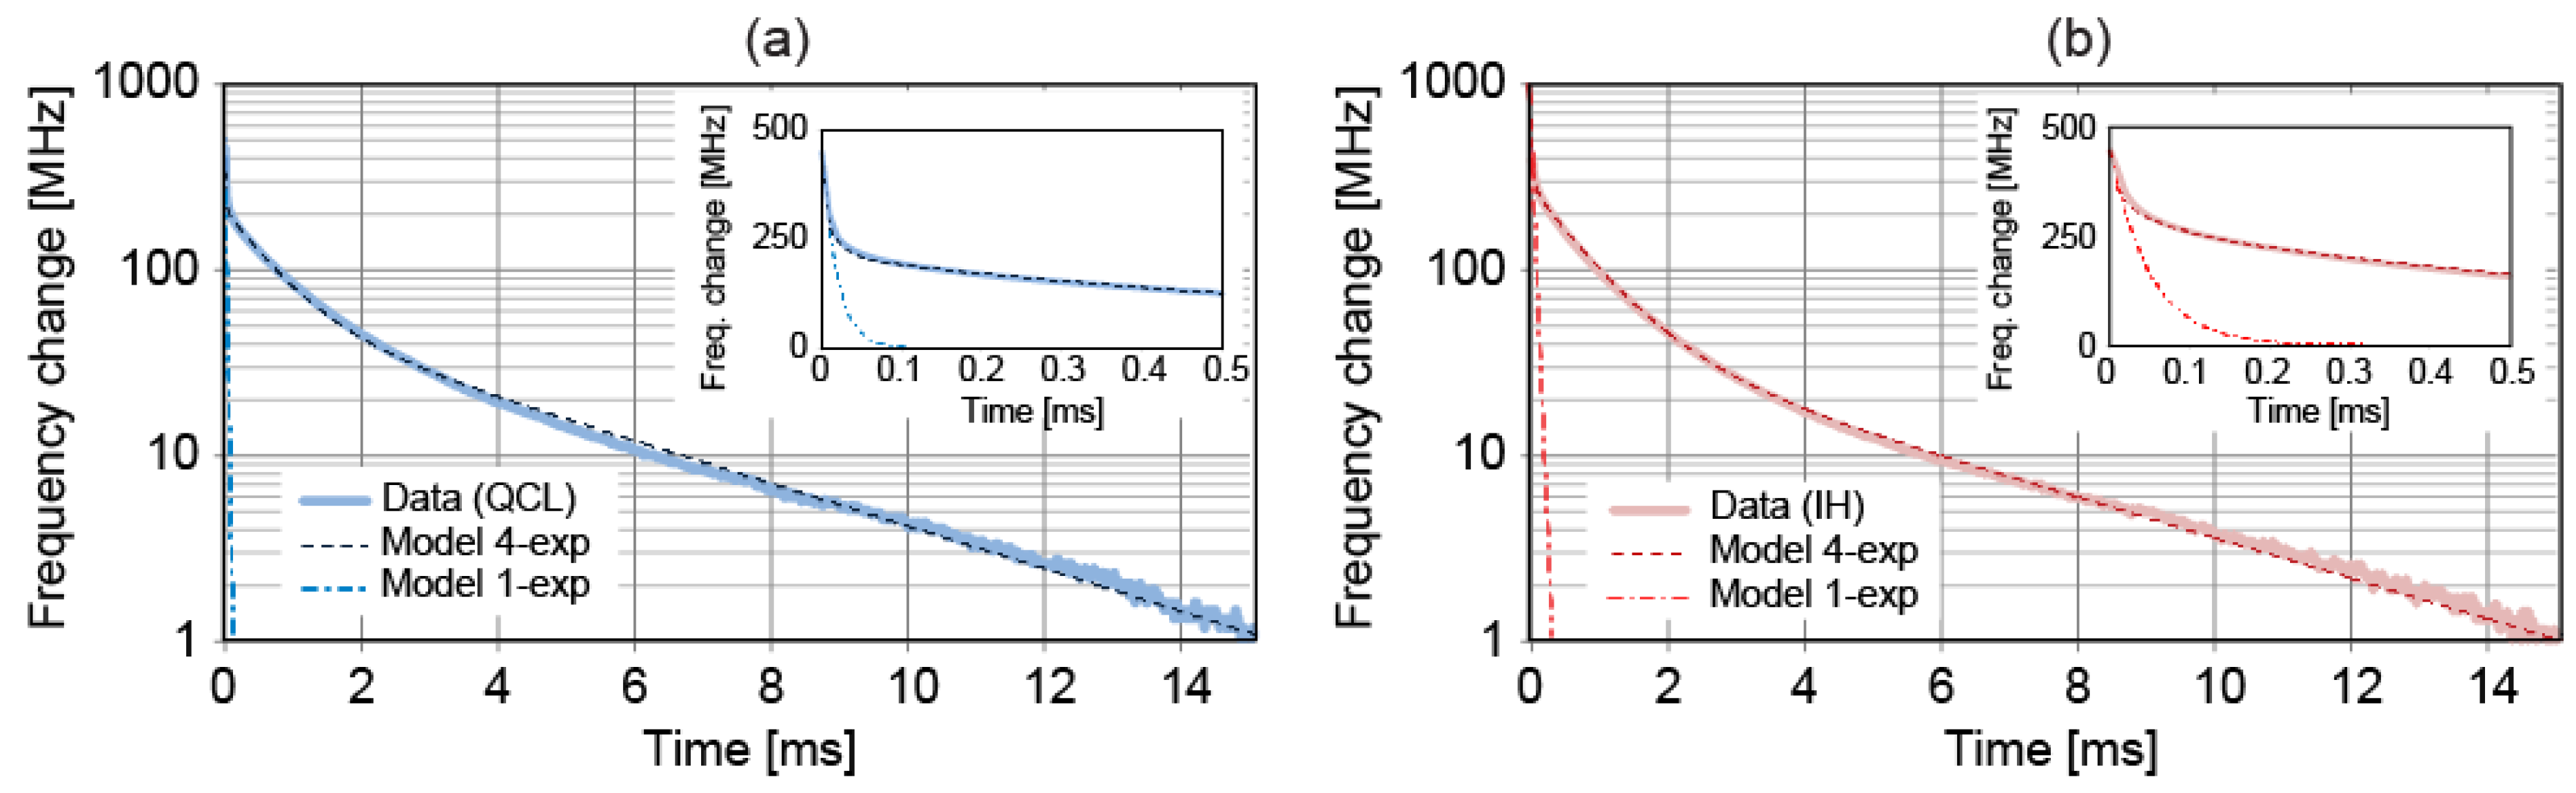
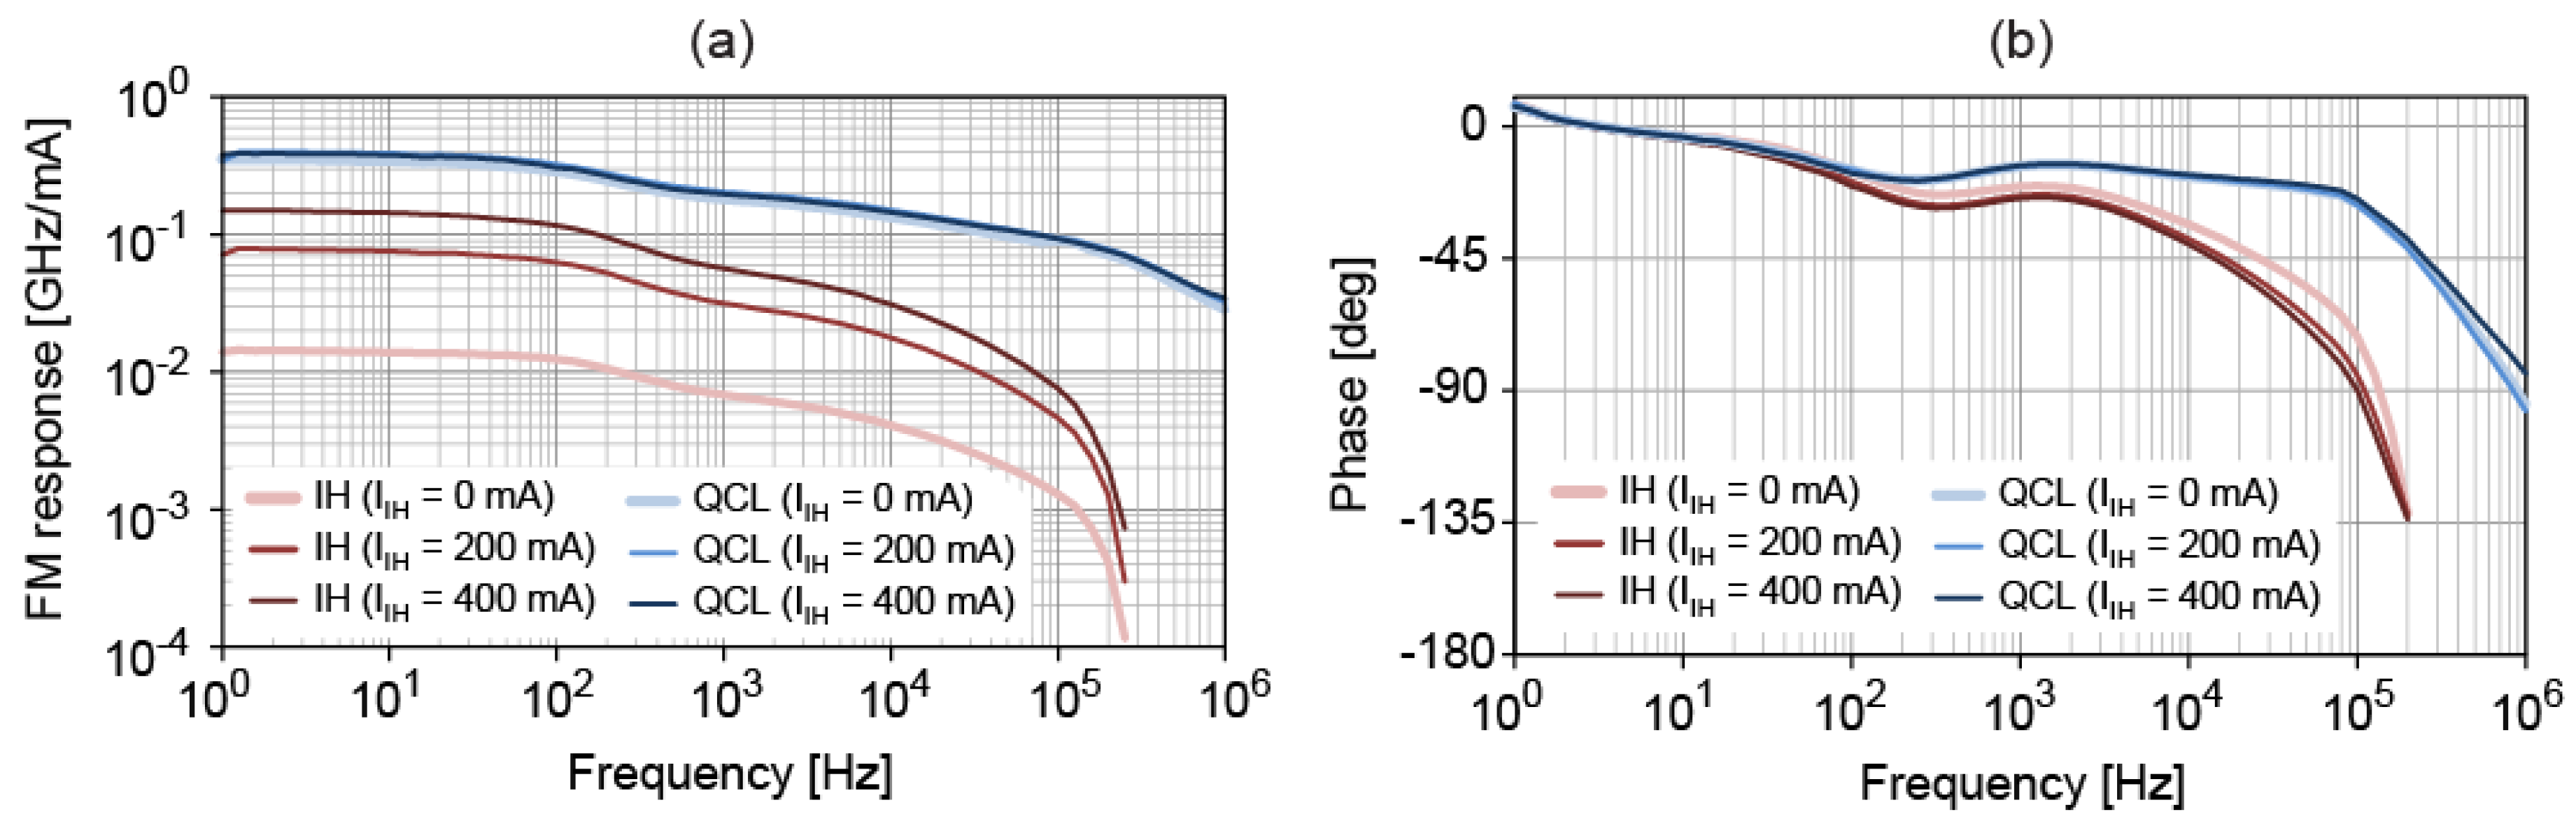
In conclusion, we have characterized in detail a new frequency tuning actuator in a QCL emitting at 7.8 μm. A resistive IH placed in the vicinity of the active region can be electrically controlled, enabling fast changes of the internal temperature of the laser to be applied, which results in a fast control of the emission frequency. The laser output frequency has a linear dependence on the electrical power dissipated in the resistive heater and this frequency tuning occurs with a minor change of the emitted optical power. The impulse response of the laser frequency to a current step applied to the IH is as fast as for a step change of the QCL current and a frequency change of 500 MHz was achieved in a few milliseconds, limited by the head dissipation out of the active region towards the laser sub-mount. For a sine modulation, the QCL current remains approximatively one order of magnitude faster and enables frequency-modulating the QCL radiation with a bandwidth in the MHz range (corresponding to a drop in amplitude of ~10 dB and an associated phase shift of −90°), whereas the bandwidth is limited to ~100 kHz when modulating the IH current. A thermal model was presented to describe the transfer functions experimentally measured for a modulation of the QCL current and IH current. Four different time constants were determined and identified to the heat dissipation in different parts of the device. The shortest time constant is one order of magnitude shorter in the case of QCL current modulation, corresponding to a cut-off frequency higher than 200 kHz, compared to ~20 kHz for IH current modulation.
Nevertheless, the modulation bandwidth achieved with the IH is sufficient for most spectroscopic applications of QCLs, such as WMS for trace gas sensing or laser stabilization. Modulating the IH current also has the further advantage of a reduced RAM compared to a direct modulation of the QCL current in some conditions. We showed a proof-of-principle demonstration of the benefit of this decoupled frequency/amplitude modulation in the case of the 1f signal of a N2O absorption line, where the spectroscopic signal was almost free of background offset for a modulation of the IH current, whereas a higher offset was observed when modulating the QCL current. In this latter case, the relative magnitude of the background offset could be reduced by adjusting the phase of the demodulation, or by operating the QCL at a higher current. However, the first solution might also lead to a decrease of the amplitude of the absorption signal depending on the phase shift between AM and FM induced by the current modulation. For the modulation of the IH current, the relative background offset is fairly independent of the DC current, as both the optical frequency and output power of the QCL have a similar dependence on the IH current.
Finally, the new IH provides an additional channel to apply fast frequency corrections to a QCL for frequency stabilization and noise reduction. This is attractive to reduce the short-term linewidth of a QCL without using an optical reference such as a molecular transition, by directly exploiting the noise on the voltage between the QCL terminals, as previously demonstrated [10,11]. Whereas a former implementation used an external near-infrared laser diode shining on the top surface of a QCL for fast control of the QCL internal temperature, the new IH provides a much more compact all-electrical solution that we will investigate in the future.

Acknowledgments

The authors from the University of Neuchâtel would like to acknowledge the financial support from the Swiss National Science Foundation (SNSF) and by the Swiss Confederation Program Nano-Tera.ch, scientifically evaluated by the SNSF.

Author Contributions

A.B. and Y.B. designed the laser used in this work. T.G. and S.B. processed it and tested it. C.T. contributed to the initial characterization of QCLs with integrated heaters. S.S. conceived and supported the characterization experiments. K.G. performed the measurements. K.G. and S.S. analyzed the data. K.G., S.S., A.B. and Y.B. discussed the experimental data. T.S. oversaw the work.

Conflicts of Interest

The authors declare no conflict of interest.

Abbreviations

The following abbreviations are used in this manuscript:
AMAmplitude modulation
DFBDistributed feedback
FMFrequency modulation
FMSFrequency modulation spectroscopy
IHIntegrated heater
LLHLaser laboratory housing
PASPhotoacoustic spectroscopy
QCLQuantum cascade laser
RAMResidual amplitude modulation
TECThermo-electrical cooler
WMSWavelength modulation spectroscopy

References

  1. Faist, J.; Capasso, F.; Sivco, D.L.; Sirtori, C.; Hutchinson, A.L.; Cho, A.Y. Quantum Cascade Laser. Science 1994, 264, 553–556. [Google Scholar] [CrossRef] [PubMed]
  2. Faist, J.; Gmachl, C.; Capasso, F.; Sirtori, C.; Sivco, D.L.; Baillargeon, J.N.; Cho, A.Y. Distributed feedback quantum cascade lasers. Appl. Phys. Lett. 1997, 70, 2670–2672. [Google Scholar] [CrossRef]
  3. Maulini, R.; Beck, M.; Faist, J.; Gini, E. Broadband tuning of external cavity bound-to-continuum quantum-cascade lasers. Appl. Phys. Lett. 2004, 84, 1659–1661. [Google Scholar] [CrossRef]
  4. Tombez, L.; Cappelli, F.; Schilt, S.; Domenico, G.D.; Bartalini, S.; Hofstetter, D. Wavelength tuning and thermal dynamics of continuous-wave mid-infrared distributed feedback quantum cascade lasers. Appl. Phys. Lett. 2013, 103, 31111. [Google Scholar] [CrossRef]
  5. Supplee, J.M.; Whittaker, E.A.; Lenth, W. Theoretical description of frequency modulation and wavelength modulation spectroscopy. Appl. Opt. 1994, 33, 6294–6302. [Google Scholar] [CrossRef] [PubMed]
  6. Bjorklund, G.C. Frequency-modulation spectroscopy: A new method for measuring weak absorptions and dispersions. Opt. Lett. 1980, 5, 15–17. [Google Scholar] [CrossRef] [PubMed]
  7. Sigrist, M.W. Trace gas monitoring by laser photoacoustic spectroscopy and related techniques (plenary). Rev. Sci. Instrum. 2003, 74, 486–490. [Google Scholar] [CrossRef]
  8. Bismuto, A.; Bidaux, Y.; Tardy, C.; Terazzi, R.; Gresch, T.; Wolf, J.; Blaser, S.; Muller, A.; Faist, J. Extended tuning of mid-IR quantum cascade lasers using integrated resistive heaters. Opt. Express 2015, 23, 29715–29722. [Google Scholar] [CrossRef] [PubMed]
  9. Schilt, S.; Tombez, L.; Tardy, C.; Bismuto, A.; Blaser, S.; Maulini, R.; Terazzi, R.; Rochat, M.; Südmeyer, T. An experimental study of noise in mid-infrared quantum cascade lasers of different designs. Appl. Phys. B 2015, 119, 189–201. [Google Scholar] [CrossRef]
  10. Tombez, L.; Schilt, S.; Hofstetter, D.; Südmeyer, T. Active linewidth-narrowing of a mid-infrared quantum cascade laser without optical reference. Opt. Lett. 2013, 38, 5079–5082. [Google Scholar] [CrossRef] [PubMed]
  11. Sergachev, I.; Maulini, R.; Bismuto, A.; Blaser, S.; Gresch, T.; Bidaux, Y.; Müller, A.; Schilt, S.; Südmeyer, T. All-electrical frequency noise reduction and linewidth narrowing in quantum cascade lasers. Opt. Lett. 2014, 39, 6411–6414. [Google Scholar] [CrossRef] [PubMed]
  12. Tombez, L.; Schilt, S.; Francesco, J.; Führer, T.; Rein, B.; Walther, T.; Domenico, G.; Hofstetter, D.; Thomann, P. Linewidth of a quantum-cascade laser assessed from its frequency noise spectrum and impact of the current driver. Appl. Phys. B 2012, 109, 407–414. [Google Scholar] [CrossRef]
  13. Rothman, L.S.; Gordon, I.E.; Babikov, Y.; Barbe, A.; Benner, D.C.; Bernath, P.F.; Birk, M.; Bizzocchi, L.; Boudon, V.; Brown, L.R.; et al. The HITRAN2012 molecular spectroscopic database. J. Quant. Spectrosc. Radiat. Transf. 2013, 130, 4–50. [Google Scholar] [CrossRef]
  14. Schilt, S.; Thévenaz, L.; Robert, P. Wavelength Modulation Spectroscopy: Combined Frequency and Intensity Laser Modulation. Appl. Opt. 2003, 42, 6728–6738. [Google Scholar] [CrossRef] [PubMed]
Figure 1. (a) Electrical connection scheme of the QCL with IH with their respective current source; (b) current-voltage response of the IH at a sub-mount temperature of 25 °C. The data points (light blue) are well approximated by the pure ohmic response described by the dashed dark blue line.
Photonics 03 00047 g001
Figure 2. Example of N2O absorption line used as a frequency discriminator to measure the FM response of the QCL. The P11e line of the vibrational band ν1 of N2O located at 1275.5 cm−1 was used in this case and is shown here. The absorption spectrum was measured by tuning the QCL or IH current and recording the voltage of the photodiode at the output of the reference gas cell. The current axis was converted into a relative frequency using the separately measured tuning coefficient. The operating point is shown by the red circle and the linear range by the red line with a slope D.
Photonics 03 00047 g002
Figure 3. (a) N2O absorption spectrum measured by tuning the QCL with the electrical power dissipated in the IH (bottom spectrum obtained at T = 25 °C and IQCL = 450 mA) and corresponding N2O absorption spectrum calculated from HITRAN database [13] for a N2O pressure of 10 mbar diluted in air (total pressure of 70 mbar) over a pathlength of 10 cm (upper spectrum). The reference spectrum is inverted for the clarity of the figure. The total pressure in the reference cell that resulted from air contamination arising from the imperfect cell tightness was estimated to be ~70 mbar from comparisons between measured and calculated spectra; (b) corresponding static tuning curve as a function of the IH current (green markers: experimental points; red dashed line: quadratic fit) and associated variation of the optical power (blue markers: Experimental points; blue dashed line: 3rd order polynomial fit). The experimental data of the optical power were extracted from the measured transmission through the N2O cell; the gaps in the data result from the presence of N2O absorption lines that have been removed.
Photonics 03 00047 g003
Figure 4. Static tuning coefficients of the QCL measured for temperature, QCL-current and IH-current tuning, respectively (markers: Experimental points; lines: Linear fits).
Photonics 03 00047 g004
Figure 5. (a) Experimental principle of the QCL frequency step response measurement using an absorption line of N2O; (b) the side of the absorption profile (blue curve) corresponding to the P11e line of N2O at 1275.5 cm−1 acts as a frequency discriminator (dashed red line) that linearly converts the change of the laser frequency into a change of the transmitted optical power detected by a photodiode. A current step of the QCL, IH or TEC was applied (from I1 to I2, see inset) to produce an exponential frequency change (schematized by the green line) of approximately 500 MHz that was recorded by an oscilloscope.
Photonics 03 00047 g005
Figure 6. Temporal evolution of the QCL optical frequency measured for a step change of the TEC temperature of ~0.16 K, displayed in a semi-log scale. The inset shows a linear representation. The experimental data are well approximated by a single exponential decay with a time constant of ~100 s (dashed-dotted line).
Photonics 03 00047 g006
Figure 7. Temporal evolution of the QCL optical frequency measured for a step change of the QCL current (a) and IH current (b), displayed in a semi-log scale. The insets show a linear representation of the initial 0.5-ms decay. The temporal response does not correspond to a single exponential decay of time constant τ2 (dashed-dotted lines), but is modelled by the sum of four decaying exponential terms (dashed lines).
Photonics 03 00047 g007
Figure 8. FM transfer function in amplitude (a) and phase (b) obtained for a modulation of the QCL-current (blue lines) and IH-current (red lines), both at different IH currents IIH.
Photonics 03 00047 g008
Figure 9. Relative FM response of the QCL obtained under direct modulation of the injection current (blue points) or IH current (red points) and fitted model (solid lines). Both amplitude (a) and phase (b) responses are shown. A global phase shift of 180° was added to all phase plots.
Photonics 03 00047 g009
Figure 10. (a) Comparison of the first harmonic WMS signal of a N2O line obtained for QCL injection current and IH current modulation (at T ≈ 20 °C and IQCL ≈ 420 mA), showing the strongly reduced background offset obtained for IH current modulation; (b) ratio between the offset and the amplitude of the 1f signal obtained for QCL and IH modulation at different QCL (IH) currents, converted into a corresponding frequency detuning. For each value of the QCL (IH) current, the laser temperature was slightly varied to keep the laser frequency around the considered N2O transition. At each DC current, the amplitude of the applied modulation was adjusted to maximize the peak-to-peak amplitude of the 1f signal.
Photonics 03 00047 g010
Table 1. Cut-off frequencies fi and relative weights ri of the different low-pass filters obtained from the fit of the transfer functions for QCL and IH current modulation. The frequency f4 was fixed from the longest time constant τ4 observed in the step response of Figure 7.
Modulationf1 (kHz)r1f2 (kHz)r2f3 (Hz)r3f4 (Hz)r4
QCL current2200.278.30.202300.36420.17
IH current19.60.183.20.162000.46400.20

