Abstract
A rapidly-swept external-cavity quantum cascade laser with an open-path Herriott cell is used to quantify gas-phase chemical mixtures of D2O and HDO at a rate of 40 Hz (25-ms measurement time). The chemical mixtures were generated by evaporating D2O liquid near the open-path Herriott cell, allowing the H/D exchange reaction with ambient H2O to produce HDO. Fluctuations in the ratio of D2O and HDO on timescales of <1 s due to the combined effects of plume transport and the H/D exchange chemical reaction are observed. Noise-equivalent concentrations (1σ) (NEC) of 147.0 ppbv and 151.6 ppbv in a 25-ms measurement time are determined for D2O and HDO, respectively, with a 127-m optical path. These NECs are improved to 23.0 and 24.0 ppbv with a 1-s averaging time for D2O and HDO, respectively. NECs <200 ppbv are also estimated for N2O, 1,1,1,2–tetrafluoroethane (F134A), CH4, acetone and SO2 for a 25-ms measurement time. The isotopic precision for measurement of the [D2O]/[HDO] concentration ratio of 33‰ and 5‰ is calculated for the current experimental conditions for measurement times of 25 ms and 1 s, respectively.
1. Introduction
Rapid, sensitive and accurate quantification of chemical mixtures using laser absorption spectroscopy in the mid-infrared (MIR) spectral region is important for a variety of remote and open-path sensing applications. These applications include the measurement of atmospheric pollutants, industrial effluents and combustion products [1,2,3]. For measurements of chemical mixtures in the gas phase, an MIR laser source that is broadly-tunable with a high wavelength tuning rate and a narrow spectral resolution is desirable. A broadly-tunable MIR laser source maximizes the number of chemicals that can be identified in the mixture, while a high wavelength tuning rate reduces the measurement time for chemical mixtures that are either chemically reactive and/or in turbulent environments. The wavelength tuning rate needs to be sufficient such that the time to collect a single spectrum is short enough that the change in the chemical species concentrations over the acquisition time interval is negligible. A narrow spectral resolution is beneficial to differentiate overlapping absorption signals in gas phase mixtures from chemicals with narrow or broad spectral features.
External cavity quantum cascade lasers (ECQCLs) have the broad wavelength tuning range (Δλ/λ > 10%) required for the analysis of complex chemical mixtures. ECQCLs have been used successfully for the analysis of solutions containing biomolecules [4,5] and to track the progress of relatively slow chemical reactions in solution [6]. Due to constraints associated with the design of the wavelength tuning elements found in many ECQCLs, most ECQCL sources are unable to achieve the wavelength tuning rates necessary to permit the acquisition of an entire broadband spectrum on timescales <1 s and cannot monitor the composition of chemical mixtures in reactive or turbulent environments. There are commercially available ECQCLs that are capable of scanning over >100 cm−1 at 100 Hz [7] and rapidly-swept ECQCLs that have been designed with intra-cavity microelectromechanical (MEMS) or acousto-optics modulators as wavelength tuning elements that can be swept over >100 cm−1 on sub-ms timescales [6,8,9]. Unfortunately, these rapidly-swept ECQCL systems have broad spectral resolutions around ~1 cm−1 that are insufficient for measuring chemicals with narrow spectral features in gas phase chemical mixtures.
The broad wavelength coverage provided by ECQCLs is also important for isotopic analysis of gas-phase chemical mixtures. The measurements of isotope ratios in gas-phase chemical mixtures can be used to monitor physical and chemical processes relevant to atmospheric chemistry, biology, geology and medicine [10,11,12,13,14,15,16,17,18]. A number of distributed feedback (DFB)-QCL-based sensors have been developed to measure the isotope ratios in gas-phase chemical mixtures; however, due to the limited wavelength coverage offered by DFB-QCLs, the conventional scheme for isotope ratio measurement involves the measurement of two rovibrational transitions: one for each isotopologue/isotopomer [10,12,13,14,17]. This two-line measurement approach requires careful selection of transitions to minimize the effects of gas temperature and to avoid spectral interference from nearby lines of other chemical species. The broadband spectra that can be collected using an ECQCL permit multiple lines and band contours to be measured for the isotopically-substituted chemicals of interest and other chemical species. By fitting of the broadband spectral data to a spectral model, the temperature of the gas sample can be extracted. The ability to extract the temperature of the sample is of particular interest for open-path remote sensing applications where knowledge of the gas temperature may be limited. The problems from spectral interference can also be alleviated if the developed model includes spectral contributions from the interfering chemical species. Additionally, the broad wavelength tuning range of an ECQCL also enables isotope ratio measurements for large chemicals, such as volatile organic compounds, that have broad rotationally-unresolved vibrational bands. Despite these advantages for open-path isotope ratio measurements, there is only one report of the application of a pulsed ECQCL for the measurement of 13CO2/12CO2 isotope ratios, and this was performed in a hollow waveguide gas cell [11].
Recently, we presented results from the detailed characterization of a rapidly-swept ECQCL system for open-path trace-gas sensing of chemicals [19]. This system used an open-path Herriot cell configured to provide an optical path length of 127 m and was swept over its entire tuning range (>100 cm−1) at rates up to 200 Hz while preserving a spectral resolution <0.2 cm−1. Rapid and sensitive open-path measurements of F134A and N2O plumes generated in the laboratory were demonstrated with this system, yielding 1σ noise-equivalent concentrations (NEC) <100 ppbv for a 127-m optical path length in a single spectral measurement time of 5 ms [19]. In this paper, the capability of a rapidly-swept ECQCL system to perform broadband isotope ratio measurements in transient sources, such as chemical plumes, is demonstrated. To test this capability, a chemical plume of D2O and HDO was generated by evaporating D2O liquid near an open-path Herriott cell. This example system was selected because it provides a challenge for a broadband measurement approach due to the rapidly time-varying [D2O]/[HDO] isotope ratio in the plume. The time-dependent concentrations of D2O and HDO were measured at an acquisition rate of 40 Hz. Based on an Allan deviation analysis of the system performance, NECs <200 ppbv are obtained in a 25-ms measurement time for N2O, F134A, CH4, acetone, SO2, HDO and D2O with the current system and a 127-m open-path Herriott cell. These NECs are achieved despite the presence of strong interference from water absorption in the collected spectra. Using the NECs estimated for HDO and D2O, combined with the average concentrations observed in the D2O plume studies, isotopic precisions of 33‰ and 5‰ for the measurement of the [D2O]/[HDO] concentration ratio were calculated at integration times of 25 ms and 1 s, respectively. The isotopic precision found in this study is comparable to what has been reported for isotope ratio measurements using DFB-QCL-based systems [12,13,14,15,18,20], demonstrating the capability of a rapid broadband spectral acquisition approach for gas phase isotope ratio measurements in turbulent environments.
2. Experimental Section
2.1. Optical Layout and Data Collection
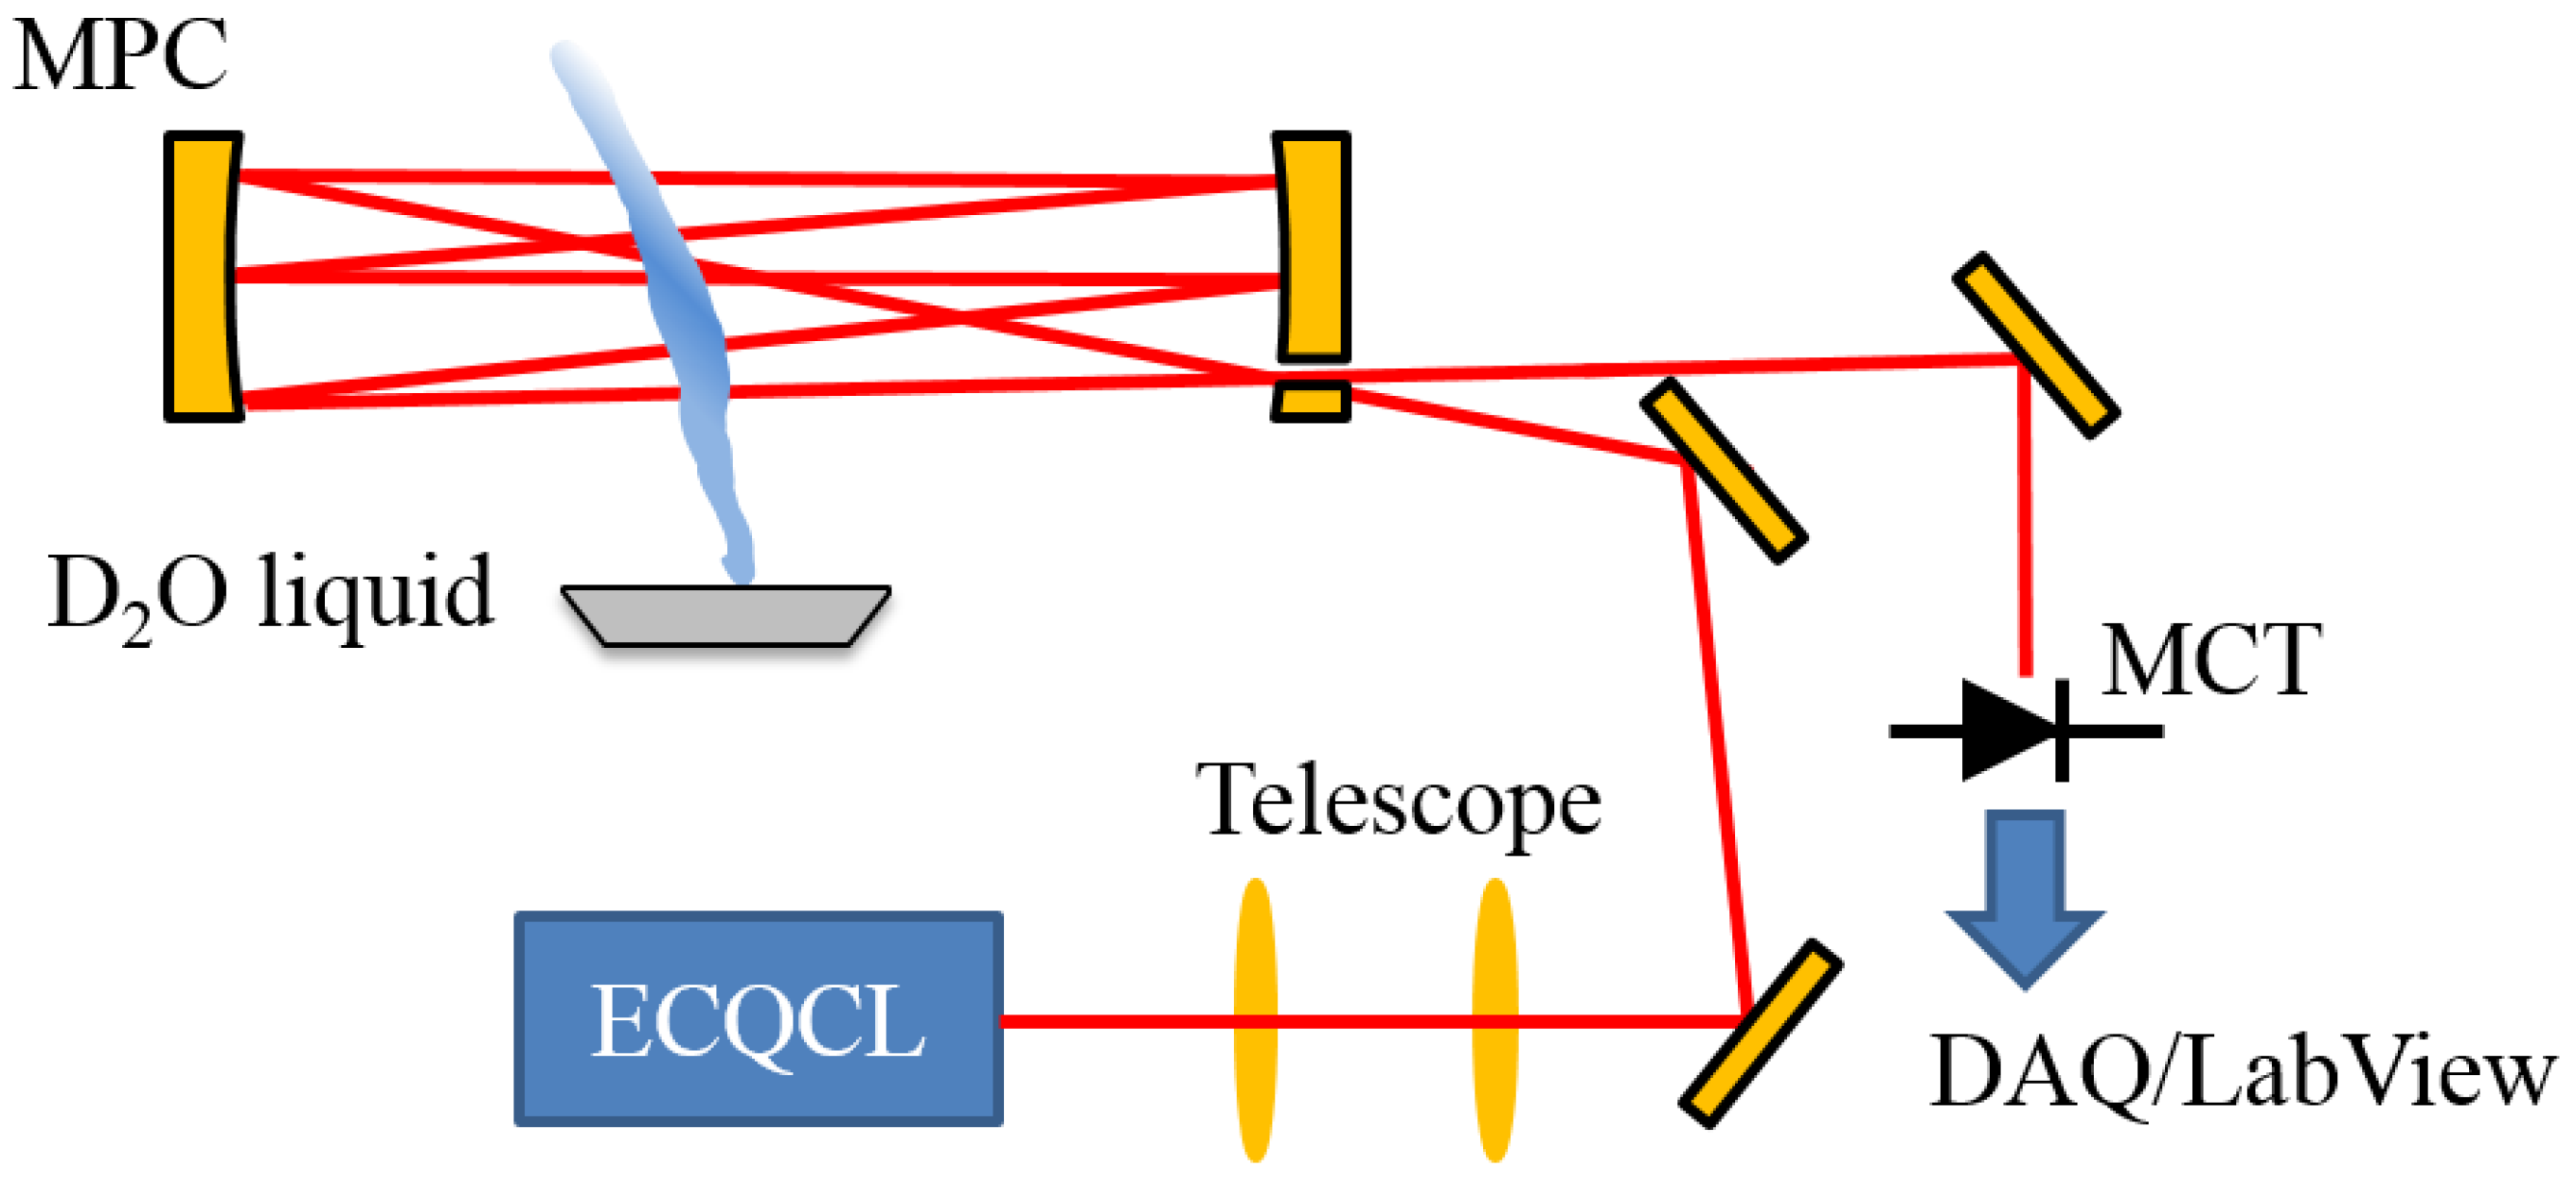
As the experimental setup, the data collection and data analysis used in this current study have been described in prior work [19,21,22]; these details will be summarized in this section. A simplified diagram of the experimental layout is illustrated in Figure 1. The rapidly-swept ECQCL used in this work is a custom system [22] that has been used in point sensors for trace-gas measurements [21,22,23,24], stand-off measurements of explosive compounds [25] and hyperspectral microscopy [26,27,28]. For the experiments presented here, the ECQCL is swept over a 110-cm−1 tuning range (1280–1390 cm−1) by a 20 Hz sinusoidal modulation of the angle of an intra-cavity mirror attached to a galvanometer. This corresponds to a spectral acquisition rate of 40 Hz, because the laser is swept through its entire tuning range twice during one galvanometer modulation period. The laser current is amplitude modulated from 0–580 mA at a frequency of 100 kHz with a 50% duty cycle using a square wave signal applied to the modulation input of a custom low-noise current controller [29]. Amplitude modulation of the ECQCL current is used to reject low-frequency noise from the experiment and to mitigate the impact of external-cavity mode-hops on the light intensity output from the laser.

Figure 1.
A diagram of the experimental configuration used for the collection of data in this study. The acronyms in the figure are defined as follows: MPC: Herriott multi-pass cell; MCT: liquid nitrogen-cooled mercury cadmium telluride (MCT) photodetector with pre-amplifier; DAQ: digital acquisition system.
The output light from the ECQCL is coupled to an open-path Herriott cell using a 2-lens telescope. The 6 inch-diameter protected gold-coated concave mirrors are separated by 0.75 m and configured for an optical path of 127 m. The light exiting the Herriott cell was directed to a liquid nitrogen-cooled MCT detector (PV-12-1, Fermionics Corp., Simi Valley, CA, USA) that is paired with a custom low-noise pre-amplifier. The voltage output from the pre-amplifier is recorded by a National Instruments DAQ (NI USB-6366, Austin, TX, USA). The detector voltage is recorded simultaneously with the voltage from the galvanometer encoder and the voltage of the current modulation waveform applied to the laser current controller. The DAQ system also generates the voltage signals for the modulation of the galvanometer angle and the laser current. Synchronization of the modulation signals and reading of the detector, encoder and current modulation voltages is controlled by a LabView data collection program. The data collection program also performs demodulation of the intensity signal on the MCT detector at the current modulation frequency of 100 kHz. Additional details regarding the software-based demodulation process are provided in Brumfield et al. [19]. The demodulated intensity signals and encoder voltages are saved to a file for post-processing.
For the HDO/D2O isotopic mixture measurements in this work, a small metal sample tray containing ~1 mL of D2O liquid (Acros Organics, 100% D2O) was placed beneath the Herriott cell. The evaporation of the D2O liquid generated a plume of D2O and HDO that slowly diffused into the laboratory air and drifted into the beam path of the Herriott cell.
2.2. Spectral Processing and Analysis
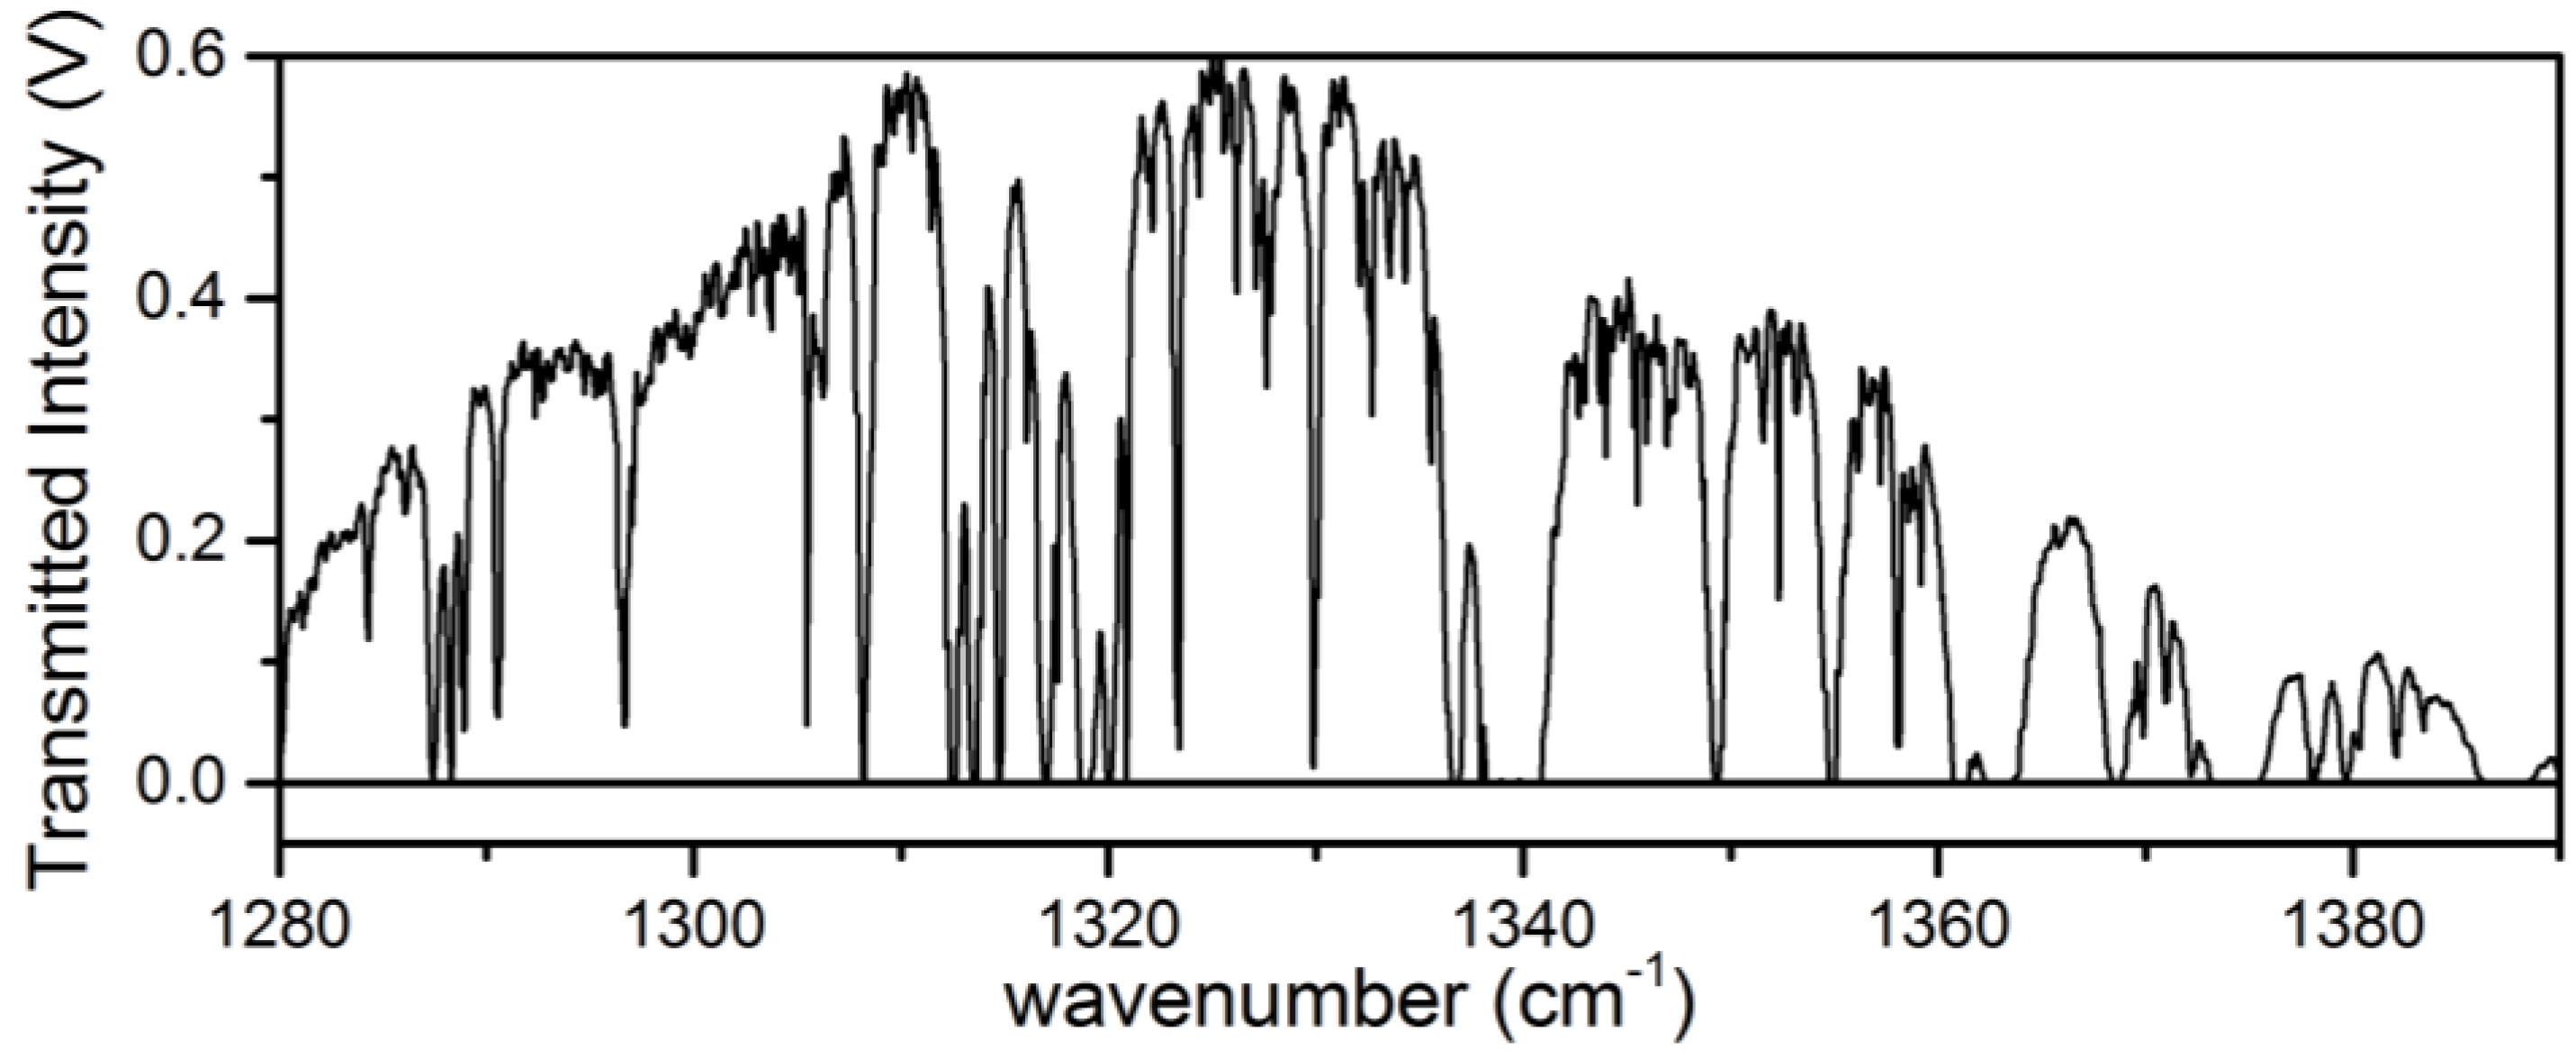
Processing of the raw transmitted intensity data to absorbance was performed offline following a similar procedure for the analysis of swept ECQCL spectral data that has been described in prior work [19,21,22]. First, the transmitted intensity spectrum from each galvanometer period is split into two separate intensity spectra corresponding to the up and down sweep of the encoder voltage. Due to small differences in how the galvanometer behaves based on the direction that the galvanometer angle is swept, spectra collected during the up and down sweep must be treated separately in the wavelength calibration steps. A set of intensity spectra is used to create an average transmitted intensity background spectrum (I0). Figure 2 provides an example of the average transmitted intensity measured through the Herriott cell as the ECQCL is swept over its tuning range. The transmitted intensity spectra used to generate I0 are selected over a time interval when there are no intentional chemical releases near the open-path Herriott cell. The average background spectrum is used in the wavelength calibration procedure and to convert the remaining transmitted intensity spectra in the dataset to base-10 absorbance. To convert the encoder voltage to wavelength, we used a calibration procedure using the wavelength positions of 8 isolated water lines present in I0. The resulting wavelength-versus-encoder voltage data are then fit to the grating equation, and the values extracted for the coefficients in the grating equation are then used to convert the encoder voltages to wavelength for the remaining intensity spectra in the dataset. After wavelength calibration, the intensity spectra are then converted to base-10 absorbance by taking the negative log of the ratio of the intensity spectrum with the background intensity spectrum: A10 = −log(I/I0). It is important to note that with this analysis scheme, the calculated absorbance is always referenced to the time interval when I0 is calculated [21,22].

Figure 2.
An example of a transmitted intensity spectrum through the Herriott cell over the tuning range of the ECQCL.
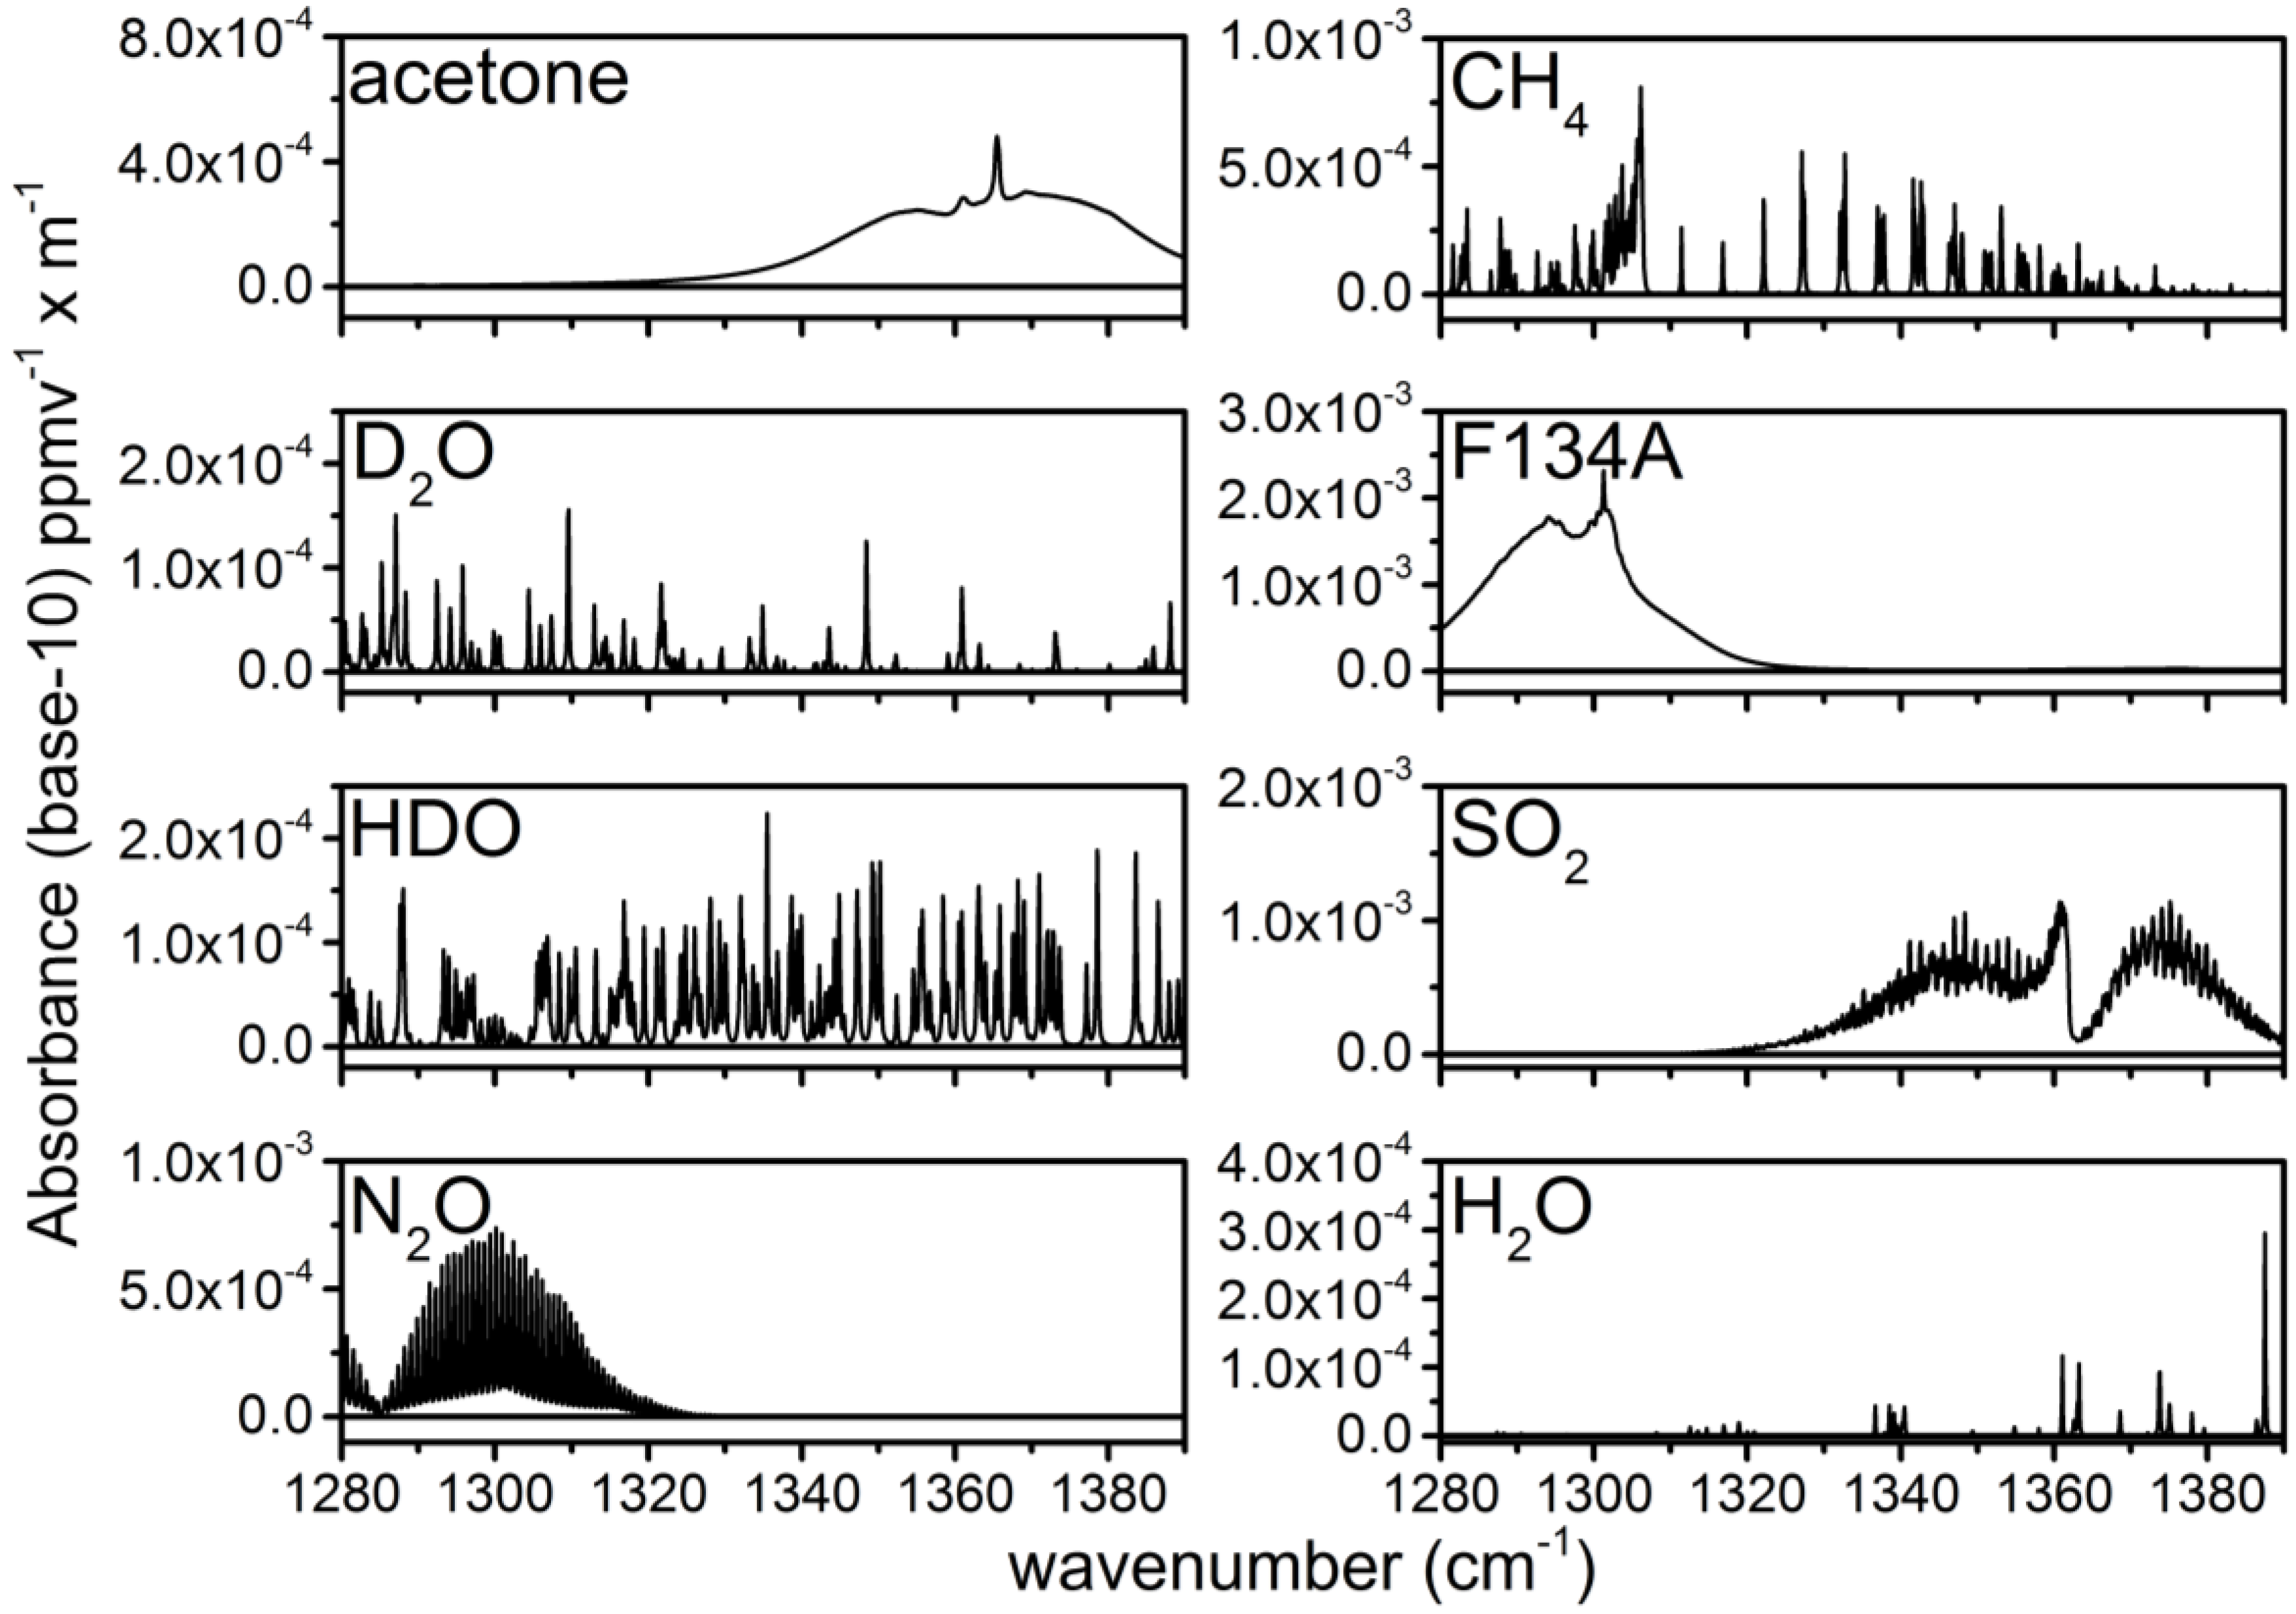
The concentrations of chemical species are obtained by applying a weighted least squares (WLS) fitting routine to the absorbance spectra. Nine basis vectors are used in the WLS analysis of the absorbance data. Seven of these basis vectors are library spectra taken from the NWIR database: acetone, D2O, HDO, N2O, CH4, F134A and SO2 [30]. These library spectra are plotted in Figure 3. All of the library spectra have been convolved with a Gaussian slit function with an FWHM of 0.12 cm−1 to account for the average 1-s spectral resolution of the ECQCL at a 40-Hz acquisition rate [19]. The spectral resolution reflects the linewidth of the swept ECQCL source and is the result of a combination of factors: (1) the wavelength chirp resulting from the amplitude modulation of the laser current; (2) averaging over external cavity mode-hops (~0.03 cm−1); and (3) the rate that the DAQ can sample the intensity waveform measured by the detector [21]. Vectors are provided for a slope and an offset in the WLS fit. The square of the transmitted intensity spectrum (I2) is used as the weighting factor in the WLS fit to marginalize the contribution from portions of the absorbance spectrum where the transmitted light intensity is low. Because the sample absorbance is always relative to the time interval when I0 was collected, the extracted species concentrations from the WLS analysis are also referenced back to their concentrations during the I0 time period. The concentrations extracted from this analysis can be either positive or negative, and this is dictated by how the concentrations of the chemicals change between the time period of the sample measurement and the collection of the I0 spectral data [21,22].

Figure 3.
Library spectra taken from the NWIR database. The gas labels are provided in the upper left of each panel.
3. Results and Discussion
3.1. Analysis of an Isotopic Mixture Containing HDO and D2O
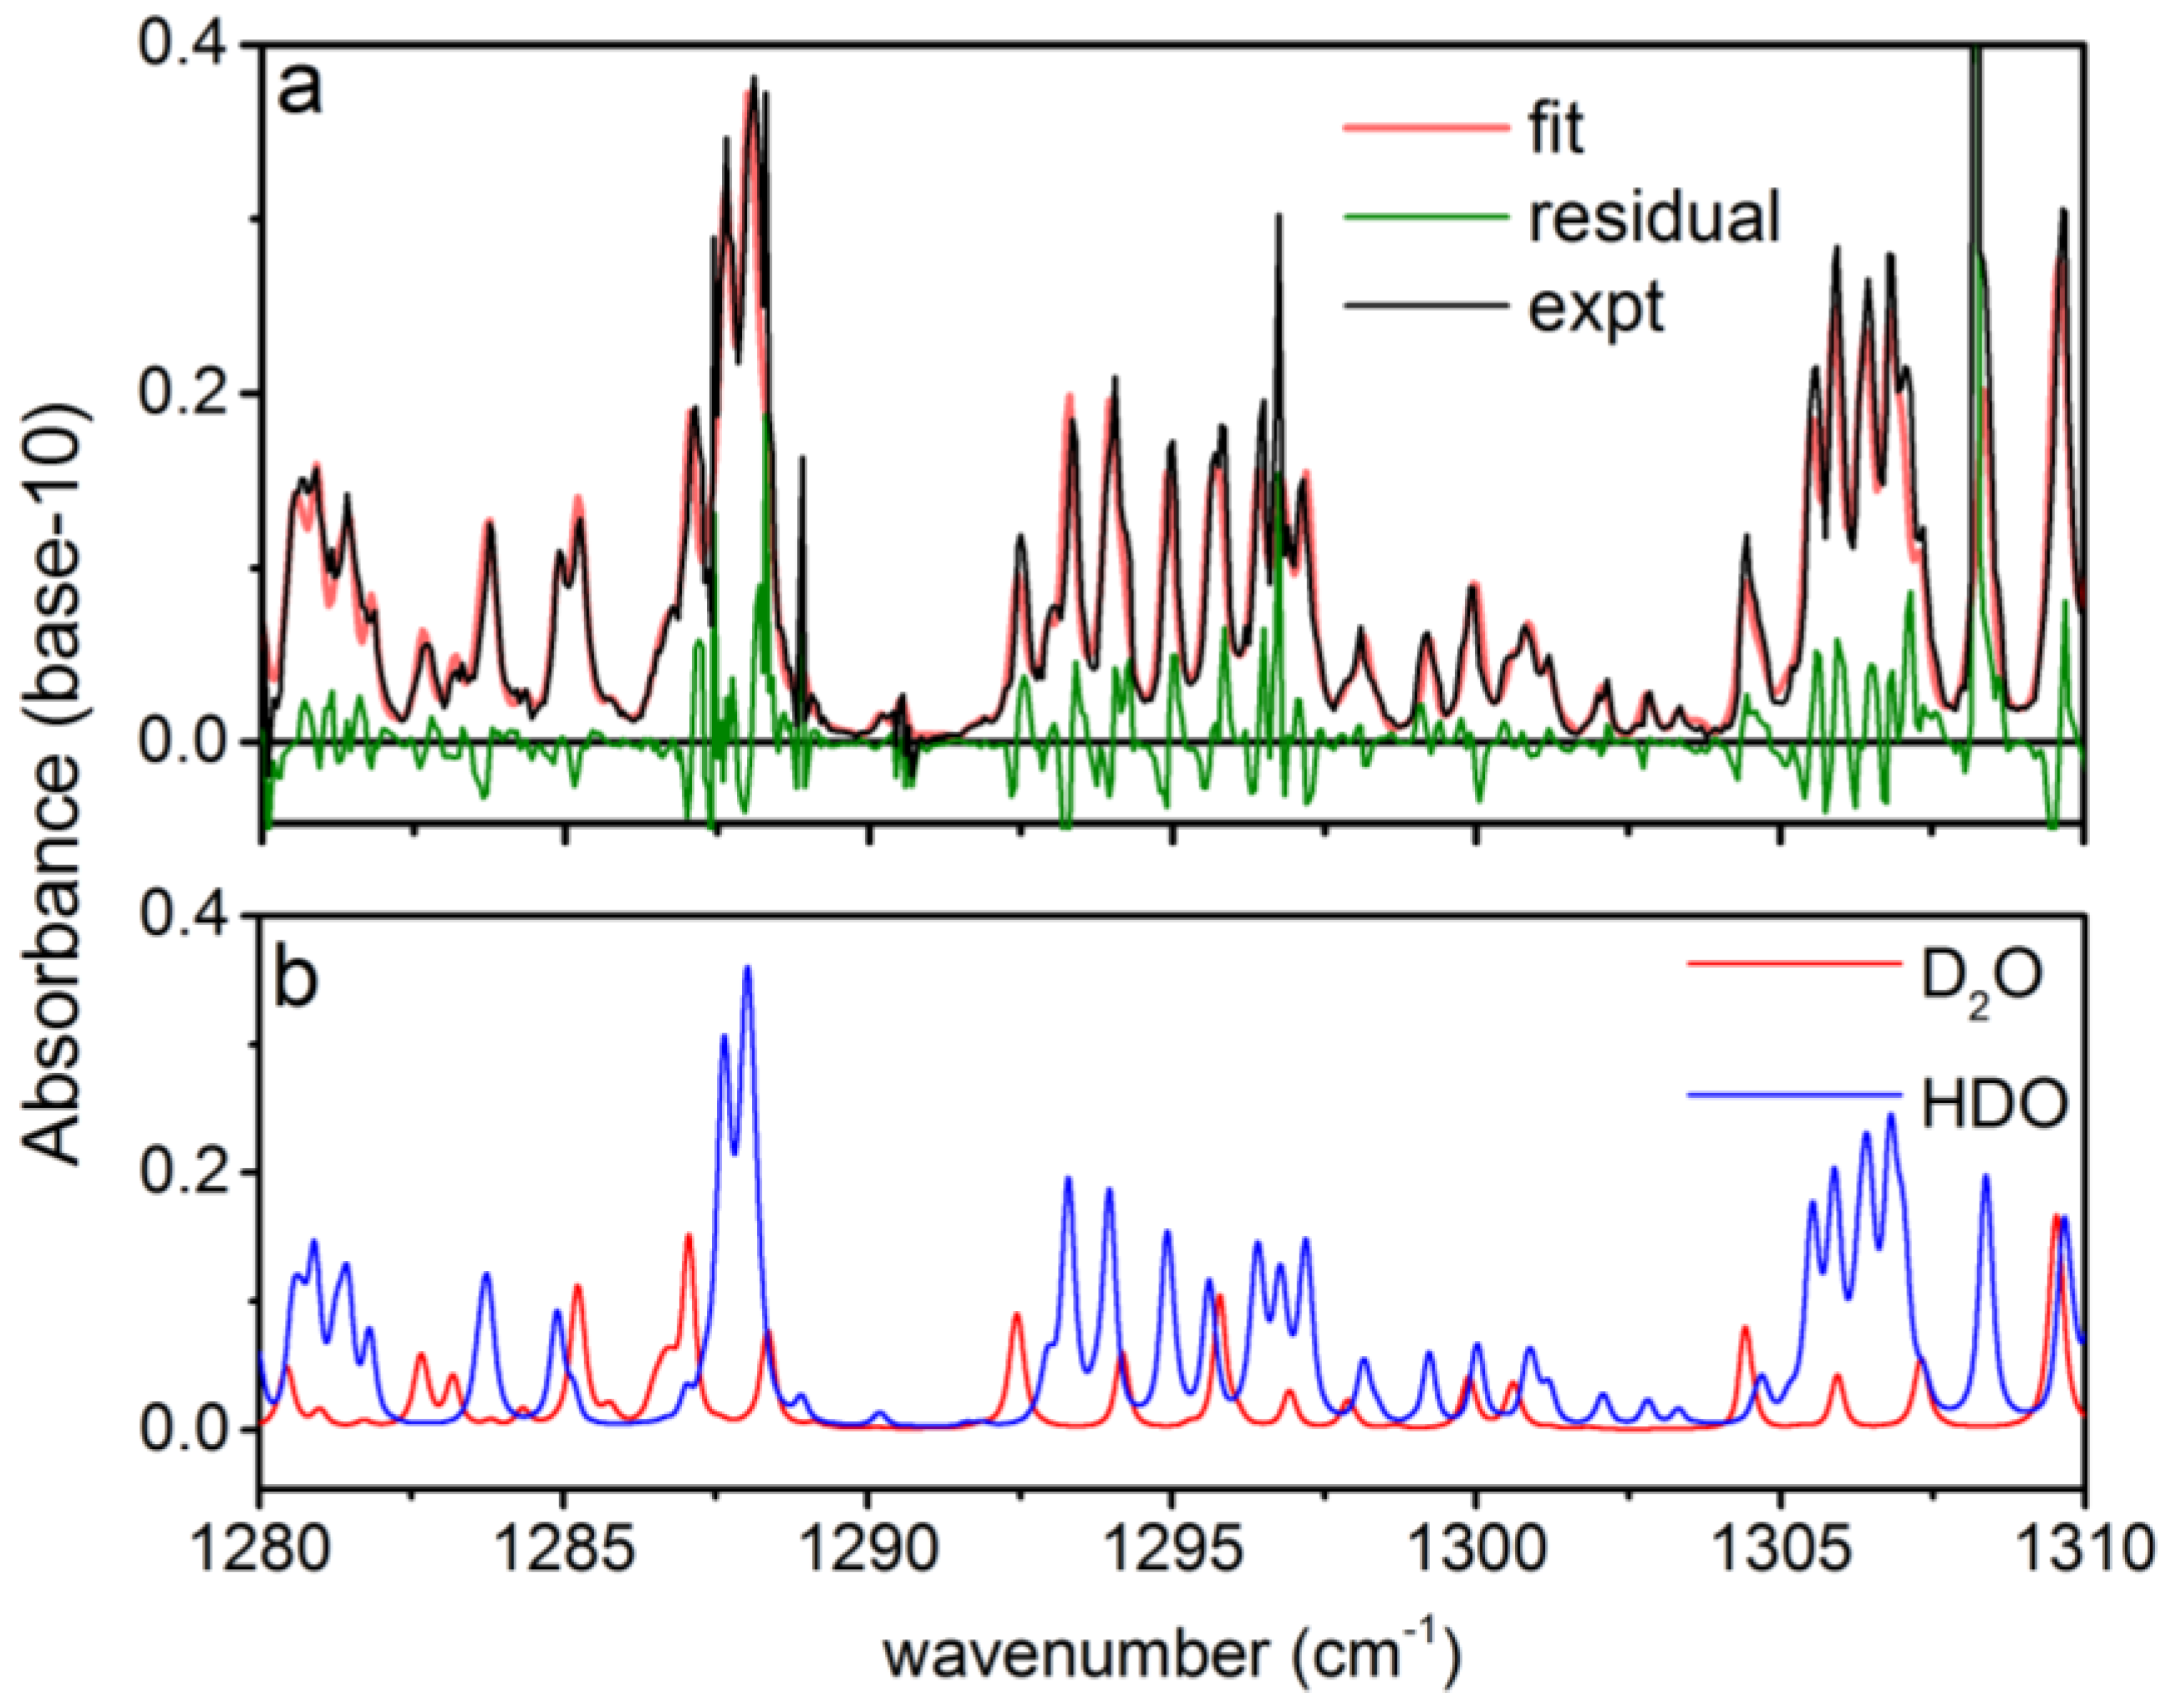
To demonstrate the capability of the rapidly-swept ECQCL to measure isotope ratios in reactive chemical mixtures, a liquid sample of D2O was placed beneath the open-path Herriott cell. As the D2O liquid evaporated, the plume interacted with ambient H2O, and the rapid H/D exchange reaction generated HDO. This resulted in a plume with a time-varying isotope ratio of D2O and HDO that drifted into the optical path of the Herriott cell and was measured with the swept ECQCL source. In Figure 4a, an example absorbance spectrum over a portion of the full tuning range is provided that illustrates simultaneous detection of D2O and HDO from the plume generated by the liquid D2O sample. Excellent qualitative agreement is observed between the experimental spectrum and the best fit produced by the WLS analysis. In Figure 4a, some structure is present in the residuals for the WLS fit. These residuals reflect small systematic errors in the absolute wavelength calibration of the ECQCL scan. While there are errors in the absolute wavelength calibration, prior work has shown that the swept ECQCL source demonstrates excellent sweep-to-sweep repeatability of the wavelength calibration [19,21], and it is the precision of the wavelength calibration that ultimately governs our detection limits for various chemicals. In Figure 4b, the individual spectral contributions from D2O and HDO from the WLS analysis are shown, demonstrating how the narrow 0.12-cm−1 spectral resolution of the ECQCL system aids in resolving partially-overlapped D2O and HDO spectral features.
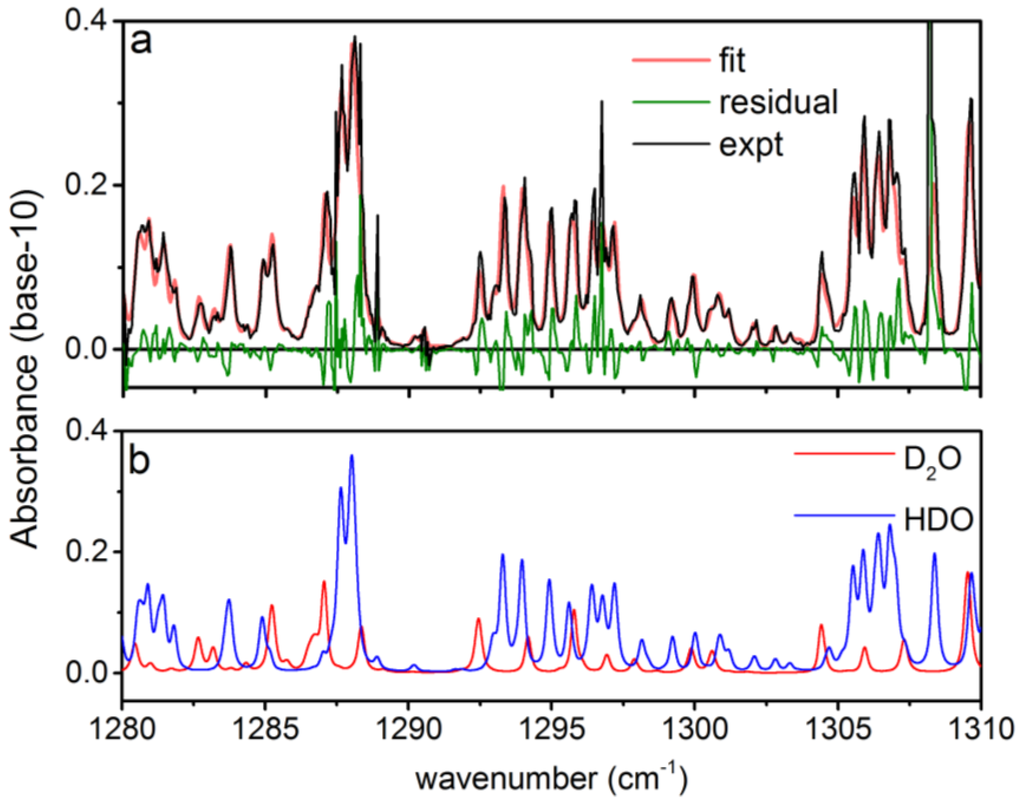
Figure 4.
Example spectral measurement of D2O and HDO from 1280–1310 cm−1: (a) a single experimental spectrum (expt) is shown along with the corresponding best fit (fit) and residual; (b) the contribution to the absorbance from D2O and HDO for the best fit spectrum in (a). The spectrum shown in (a) is the result of averaging 1 s of spectral data while operating at an acquisition rate of 40 Hz.
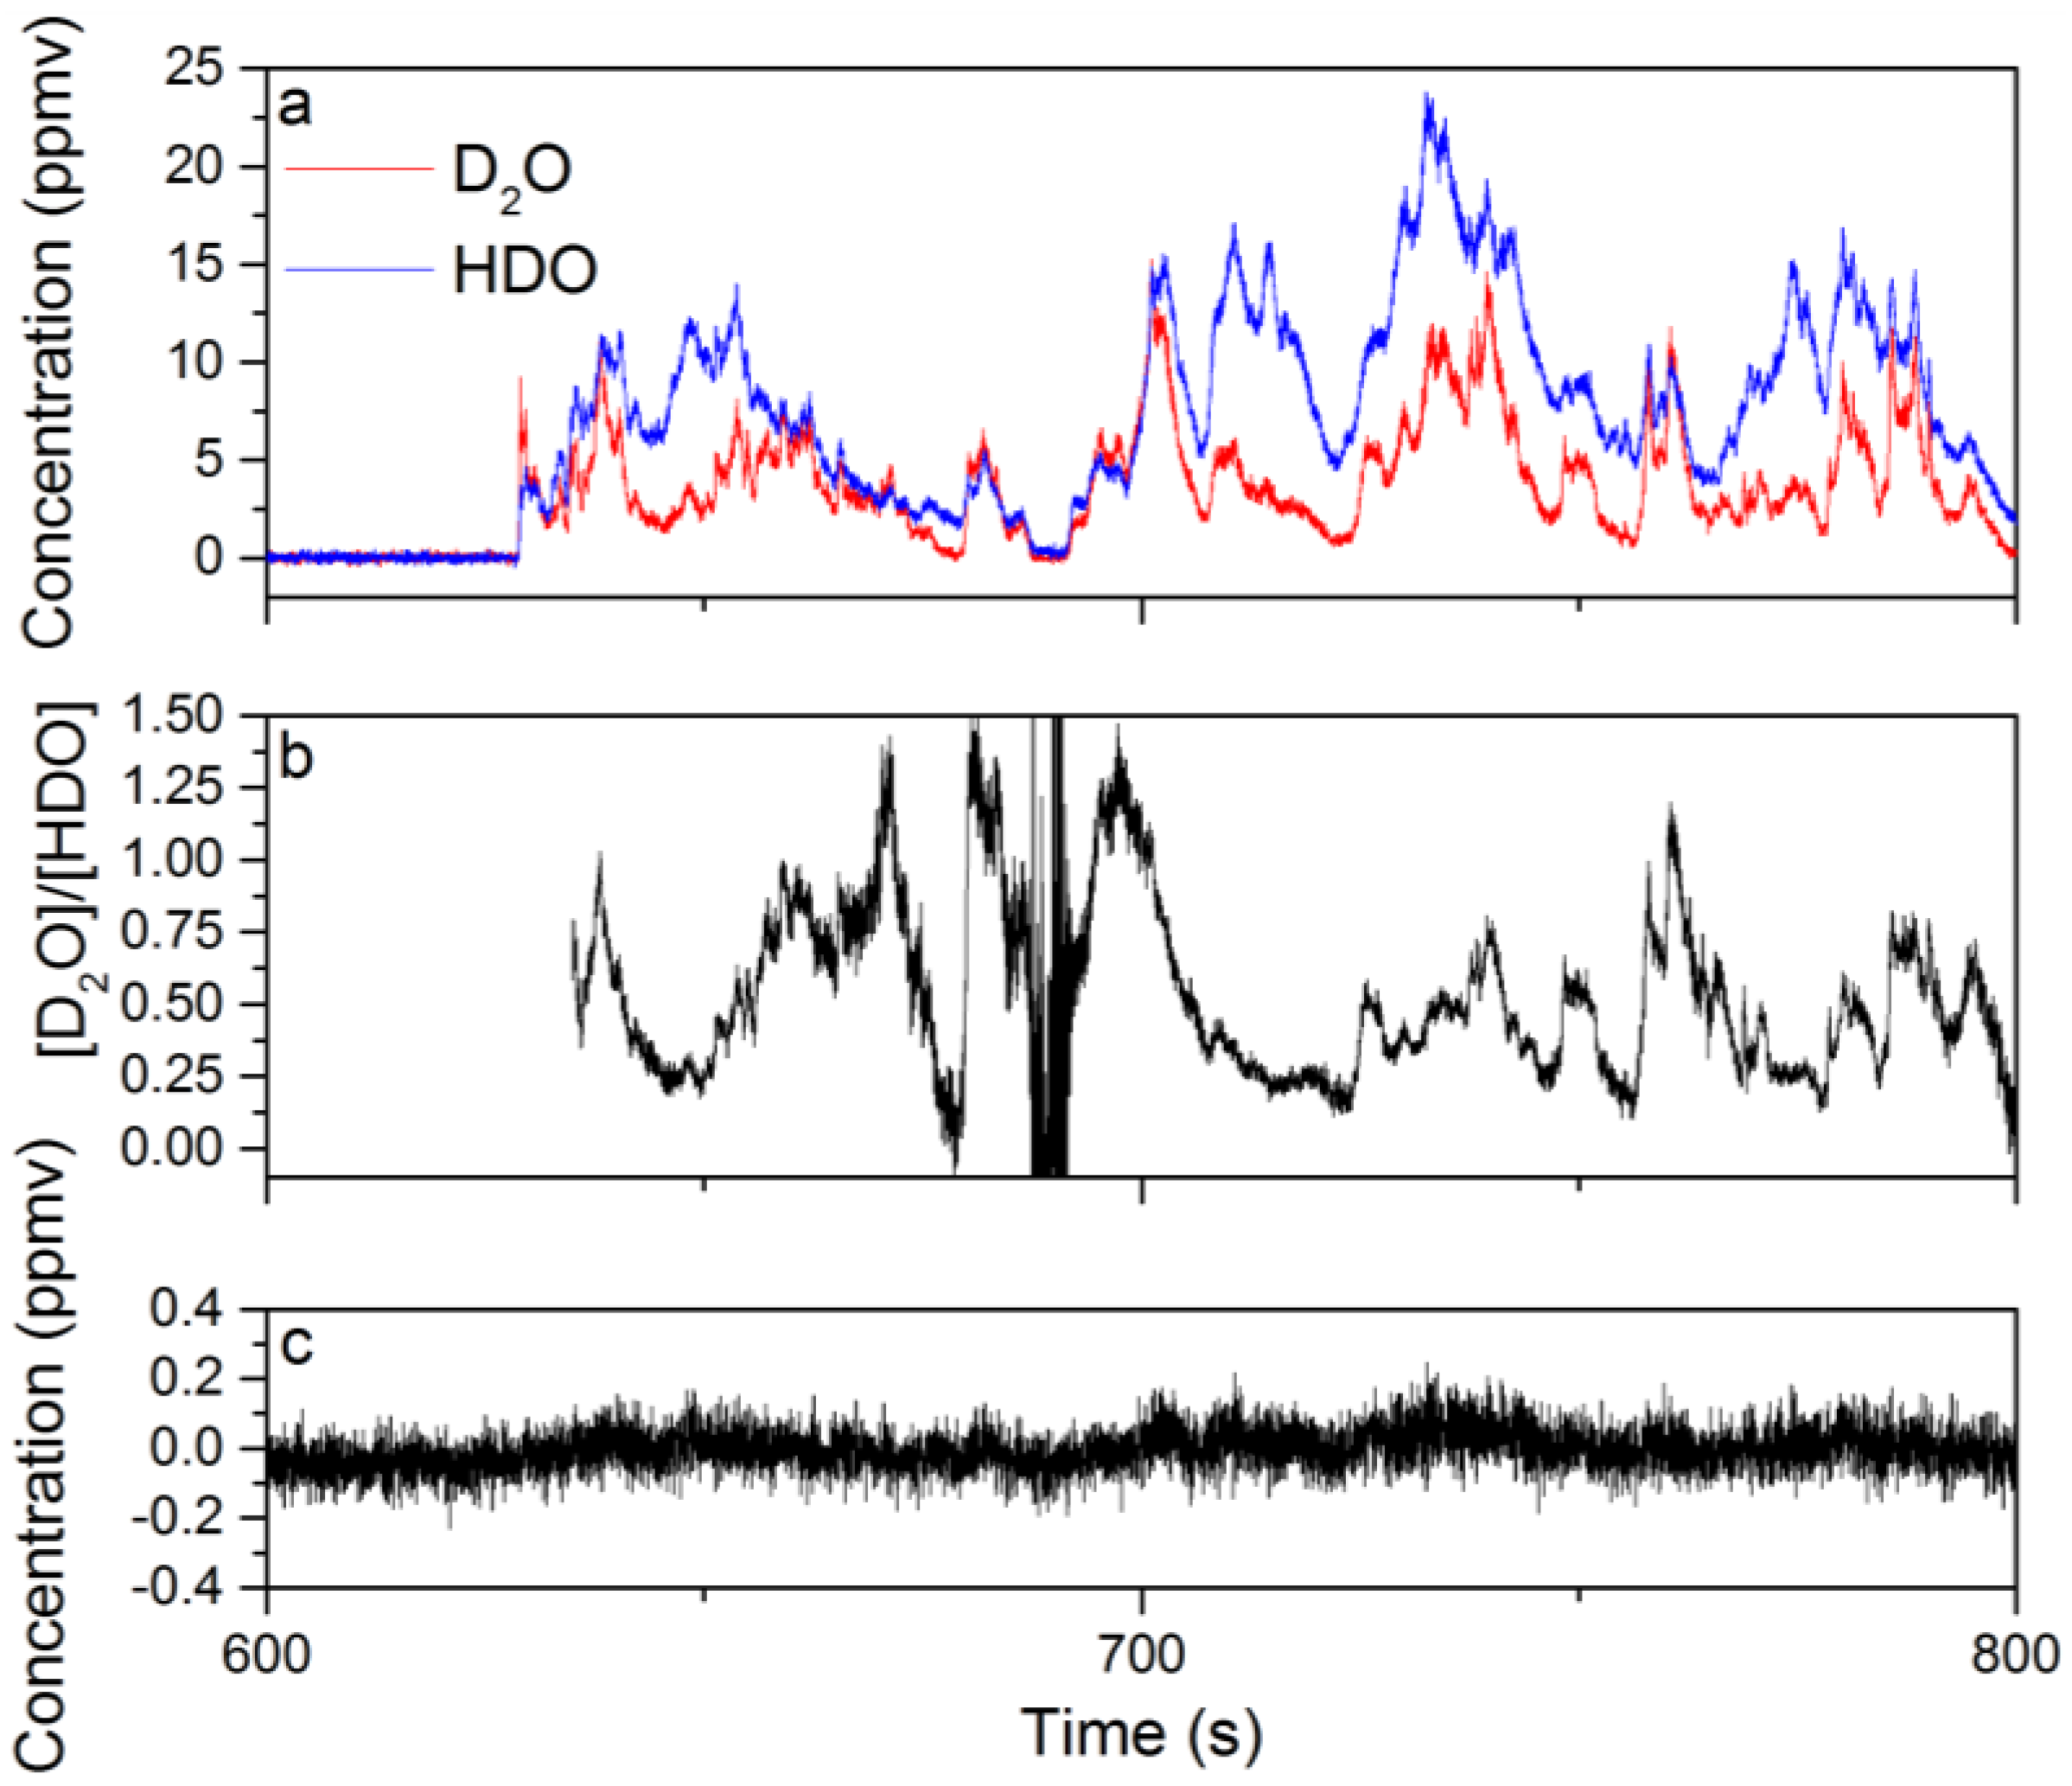
In Figure 5a, the time dependence of the D2O and HDO species concentrations extracted from the WLS analysis are shown for data acquired from 600–800 s in 25-ms intervals. Six hundred and thirty seconds of spectral data were recorded without the D2O liquid beneath the Herriott cell, and the first 500 s of spectra were used to generate I0 for the calculation of the sample absorbance. Based on Figure 5a, the relationship between the concentrations of D2O and HDO is complex with significant concentration changes on sub-1-s timescales. In general, there is a positive correlation between the D2O and HDO concentrations; however, the degree of correlation varies in time. This is demonstrated by the time dependence of the D2O to HDO concentration ratio shown in Figure 5b. The fluctuation in the concentration/isotope ratio indicates that a combination of plume transport properties and chemistry plays an important role in the measured D2O and HDO concentrations. The transport properties of the plume are important because portions of the plume that have interacted longer with ambient water vapor will be enriched in HDO due to the H/D exchange reaction. If these parts of the plume then drift into the probe volume of the Herriott cell, the measured concentration of HDO will increase. Figure 5c shows the recorded change in the CH4 concentration, which is expected to nominally be zero. The amount of concentration cross-talk observed for CH4 is at most 2–3-times larger than the 1σ uncertainty in the chemical species concentration before the introduction of D2O beneath the Herriott cell. A similar degree of cross-talk is also observed for the other chemicals in the WLS analysis. These results show that the WLS approach correctly identifies and quantifies the chemicals present in the mixture.

Figure 5.
The time-dependent concentrations extracted from the WLS fitting of spectral data collected during the evaporation of D2O liquid near the Herriott cell while operating at a 40-Hz acquisition rate: (a) the concentrations for D2O and HDO from 600–800 s of data; (b) the ratio of the D2O to HDO concentration calculated using concentration data from 635–800 s; (c) the time-dependent concentration for CH4 extracted from WLS analysis of the same dataset is provided.
3.2. Calculation of NECs for D2O, HDO and Other Chemicals
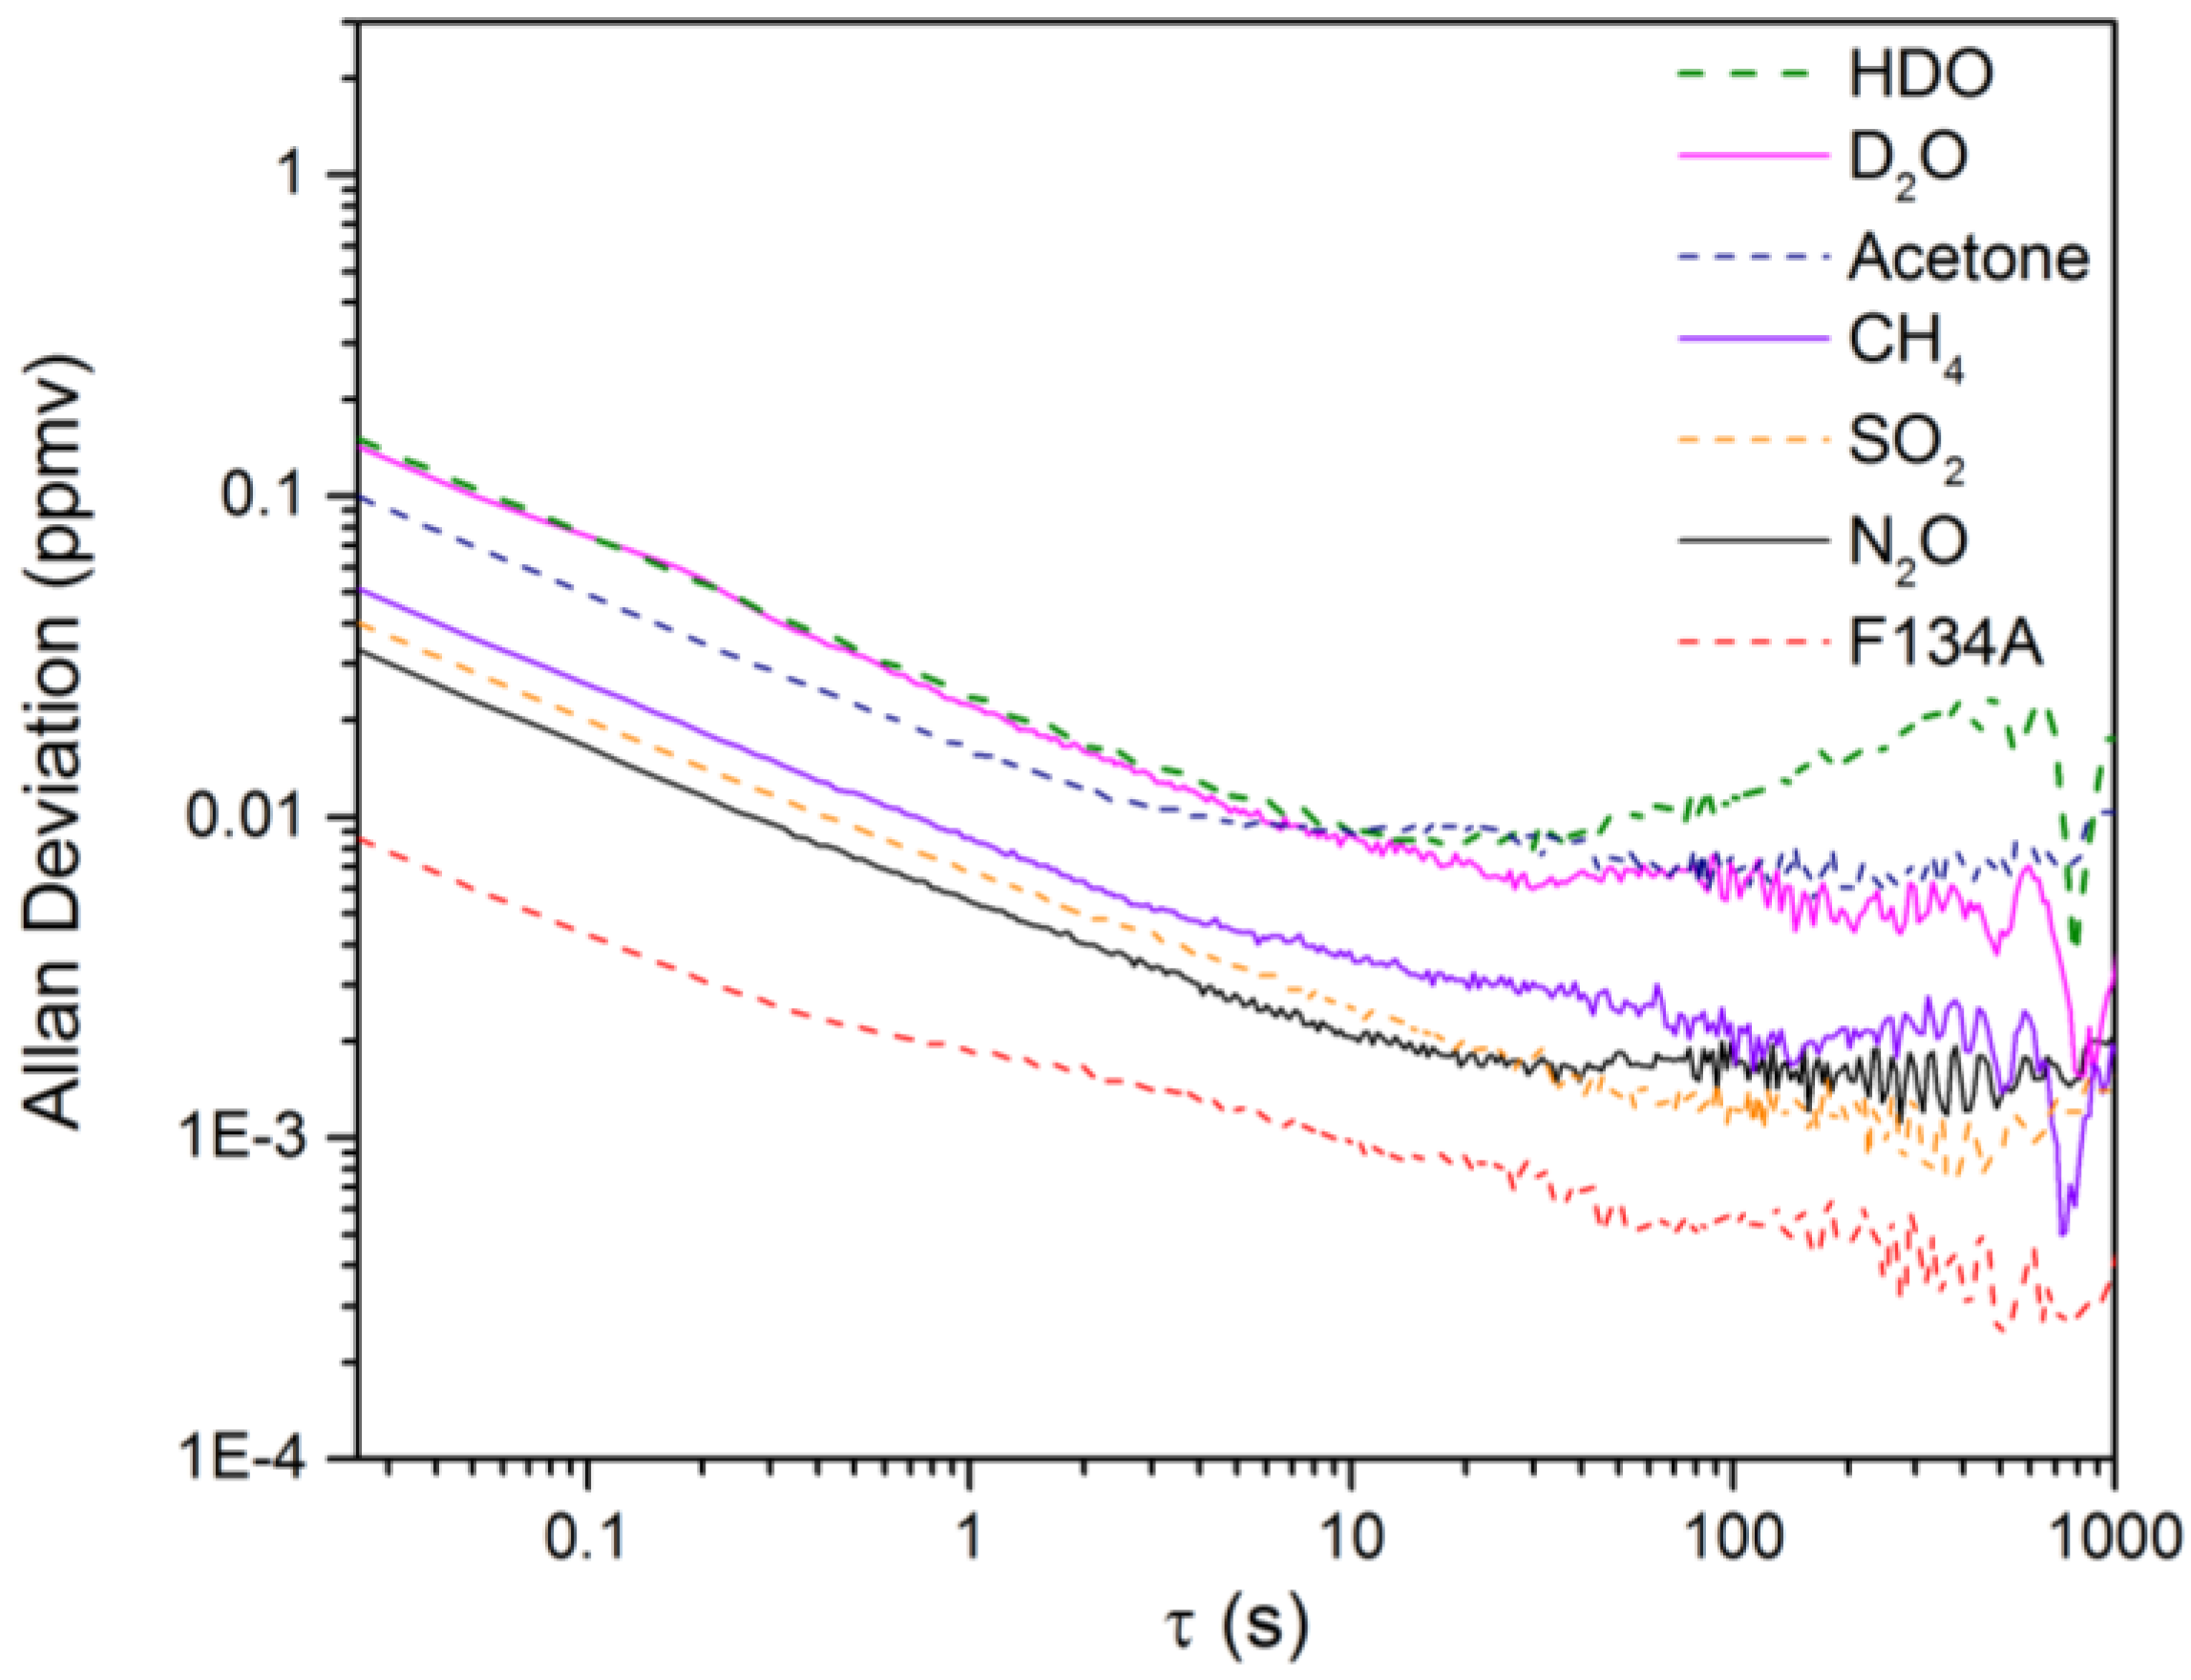
The NECs for D2O, HDO and the five other chemicals using the open-path rapidly-swept ECQCL system were determined by following a method used in previous swept ECQCL studies [19,21]. First, one hour of spectra was collected at an acquisition rate of 40 Hz in the absence of chemical releases. The first 14,400 spectra (6 m) recorded were used to generate I0 for the calculation of the absorbance spectra of the remaining 129,600 spectra (54 m) in the dataset. The WLS fitting algorithm was then applied to the absorbance data. By carrying out this process, the extracted species concentrations account for the effects of spectral noise and drift in the measurement. An example of a time-dependent chemical concentration dataset extracted from this analysis is provided for N2O in Figure 6. Figure 6 demonstrates that there is negligible drift in the N2O concentration over the 54-m time interval, and this is the typical result observed for the other six chemicals in the WLS library. An Allan deviation analysis was applied to the time-dependent concentration data to obtain the relationship between the NECs and the integration time for all of the chemical species in the WLS fitting library. The results of the Allan analysis are shown in Figure 7. Table 1 provides a summary of the NECs and noise-equivalent column densities (NECDs) for all of the chemical species considered at integration times of 25 ms and 1 s.
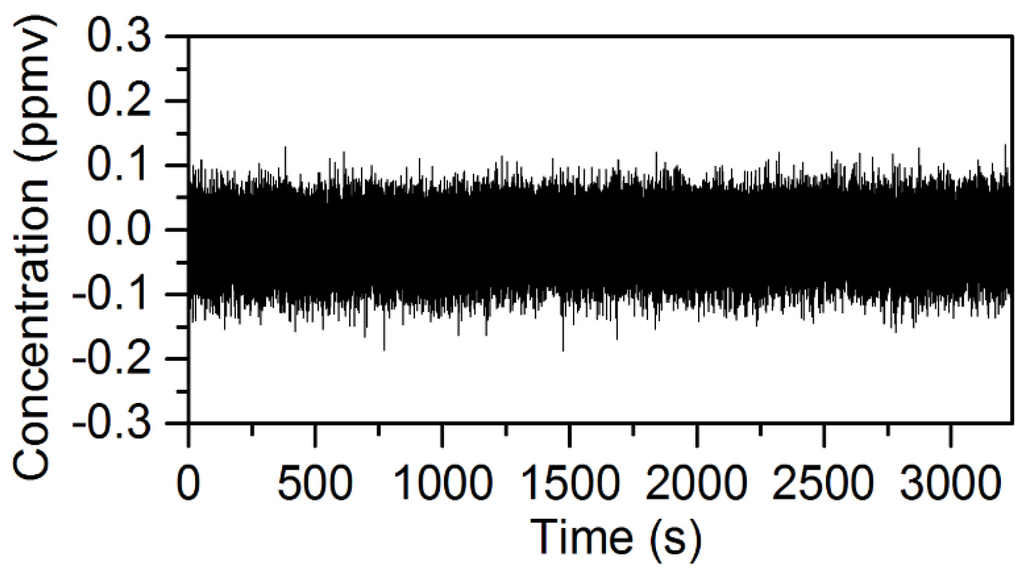
Figure 6.
Plot of the time-dependent chemical concentration of N2O retrieved from the WLS analysis of 56 min of spectral data collected at an acquisition rate of 40 Hz.
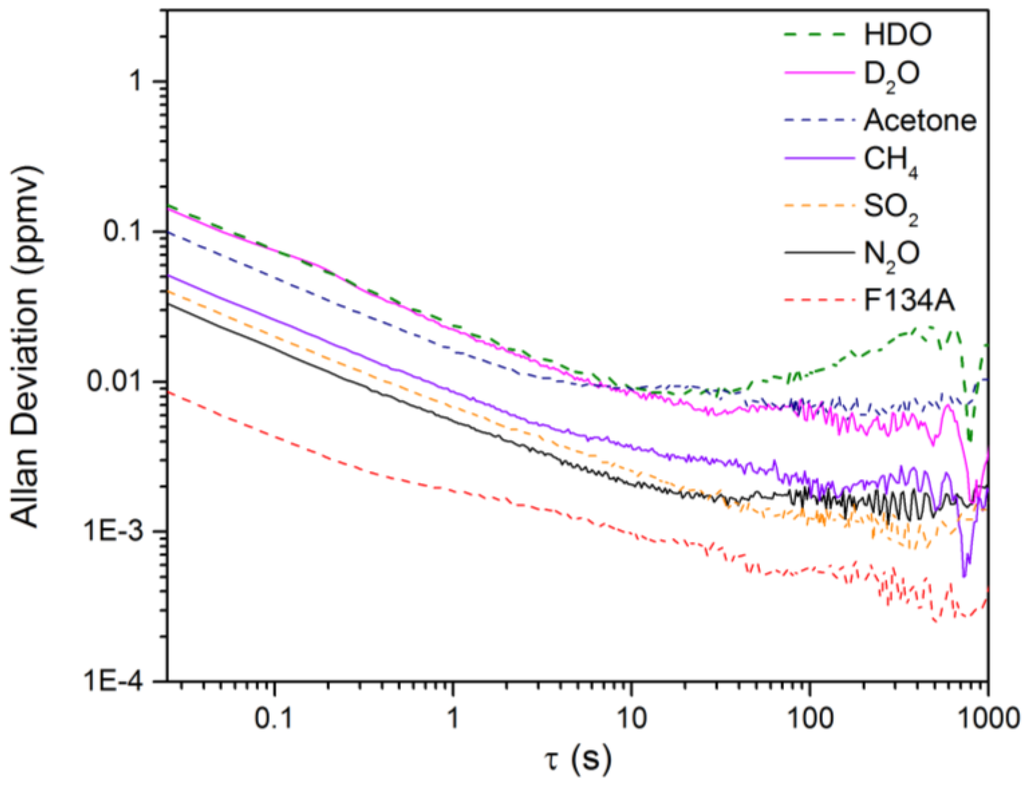
Figure 7.
The Allan deviation plots resulting from the WLS analysis of the NEC data.

Table 1.
A comparison of the NECs and NECDs obtained from the Allan deviation analysis of the time-dependent species concentrations in the absence of chemical releases. NECDs are calculated using the 127-m optical path of the Herriot cell and the NEC concentrations obtained from the Allan deviation analysis (see Figure 7). The corresponding peak absorbance for each chemical is taken from the NWIR library spectra (see Figure 1).
Based on the data presented in Table 1, all of the reported NECs are <200 ppbv for a measurement time of 25 ms. For D2O and HDO, NECs of 147.0 and 151.6 ppbv are estimated, respectively, for a 25-ms measurement time. From Figure 7, we can see that the detection limits for D2O and HDO are white noise limited out to 10 s and reach a minimum NEC of ~10 ppbv for both chemicals. By 1 s, the NECs for all of the remaining chemicals are on the order of 10 ppbv or less. Table 1 has been organized in descending order based on the peak absorbance observed for the library spectrum of each chemical species. The corresponding NECDs generally follow the expected inverse relationship, with increasing value as the peak absorbance grows smaller.
3.3. Evaluation of the Isotopic Precision for Measurement of [D2O]/[HDO]
The plume measurements and analysis of the detection limits for D2O and HDO discussed in Section 3.1 and Section 3.2 provide the necessary information to evaluate the isotopic precision of the swept ECQCL open-path measurement. Unlike conventional atmospheric isotope ratio measurements with static isotope ratio standards and trace concentrations of isotopically-substituted chemicals, we have an enriched isotopic chemical mixture with a rapidly fluctuating concentration and isotopic ratio in a chemical plume. In traditional delta notation, the change in the isotope ratio with respect to a standard is given by:
where we define Rmeasured = [D2O]measured/[HDO]measured. In this work, we are using a value of 0.5 for Rstandard, and this corresponds to the average ratio observed in Figure 5b from the D2O plume studies. This value is likely due to the interaction of the highly-enriched plume of D2O vapor reacting with water vapor in the laboratory air that is dominated by H2O, with each reactive collision producing two HDO molecules. The value for Rstandard is taken from experimental measurements because our isotopic enrichment of deuterium is far from the natural abundance, and there is no commonly-accepted standard that matches the isotopic composition in the chemical plume. By adopting our experimentally-measured Rstandard into Equation (1), we are using the standard per mil notation to describe our isotopic precision for measurements with respect to the average isotopic composition of the plume.
The isotopic precision of our measurements in per mil notation can be calculated through standard error propagation using the variance formula as shown in Equation (2):
where Δ[D2O] and Δ[HDO] are the uncertainties in measuring the D2O and HDO concentrations, Δδ[D2O] is the uncertainty in the per mil measurement of the [D2O]/[HDO] ratio and ∂(δ[D2O])/∂[D2O] and ∂(δ[D2O])/∂[HDO] are the partial derivatives of Equation (1) with respect to the D2O and HDO concentrations. In Equation (2), the assumption is made that there is no uncertainty associated with Rstandard.
After evaluation of the partial derivatives and assuming that the deviation between Rmeasured and Rstandard is small, Equation (2) can be simplified to:
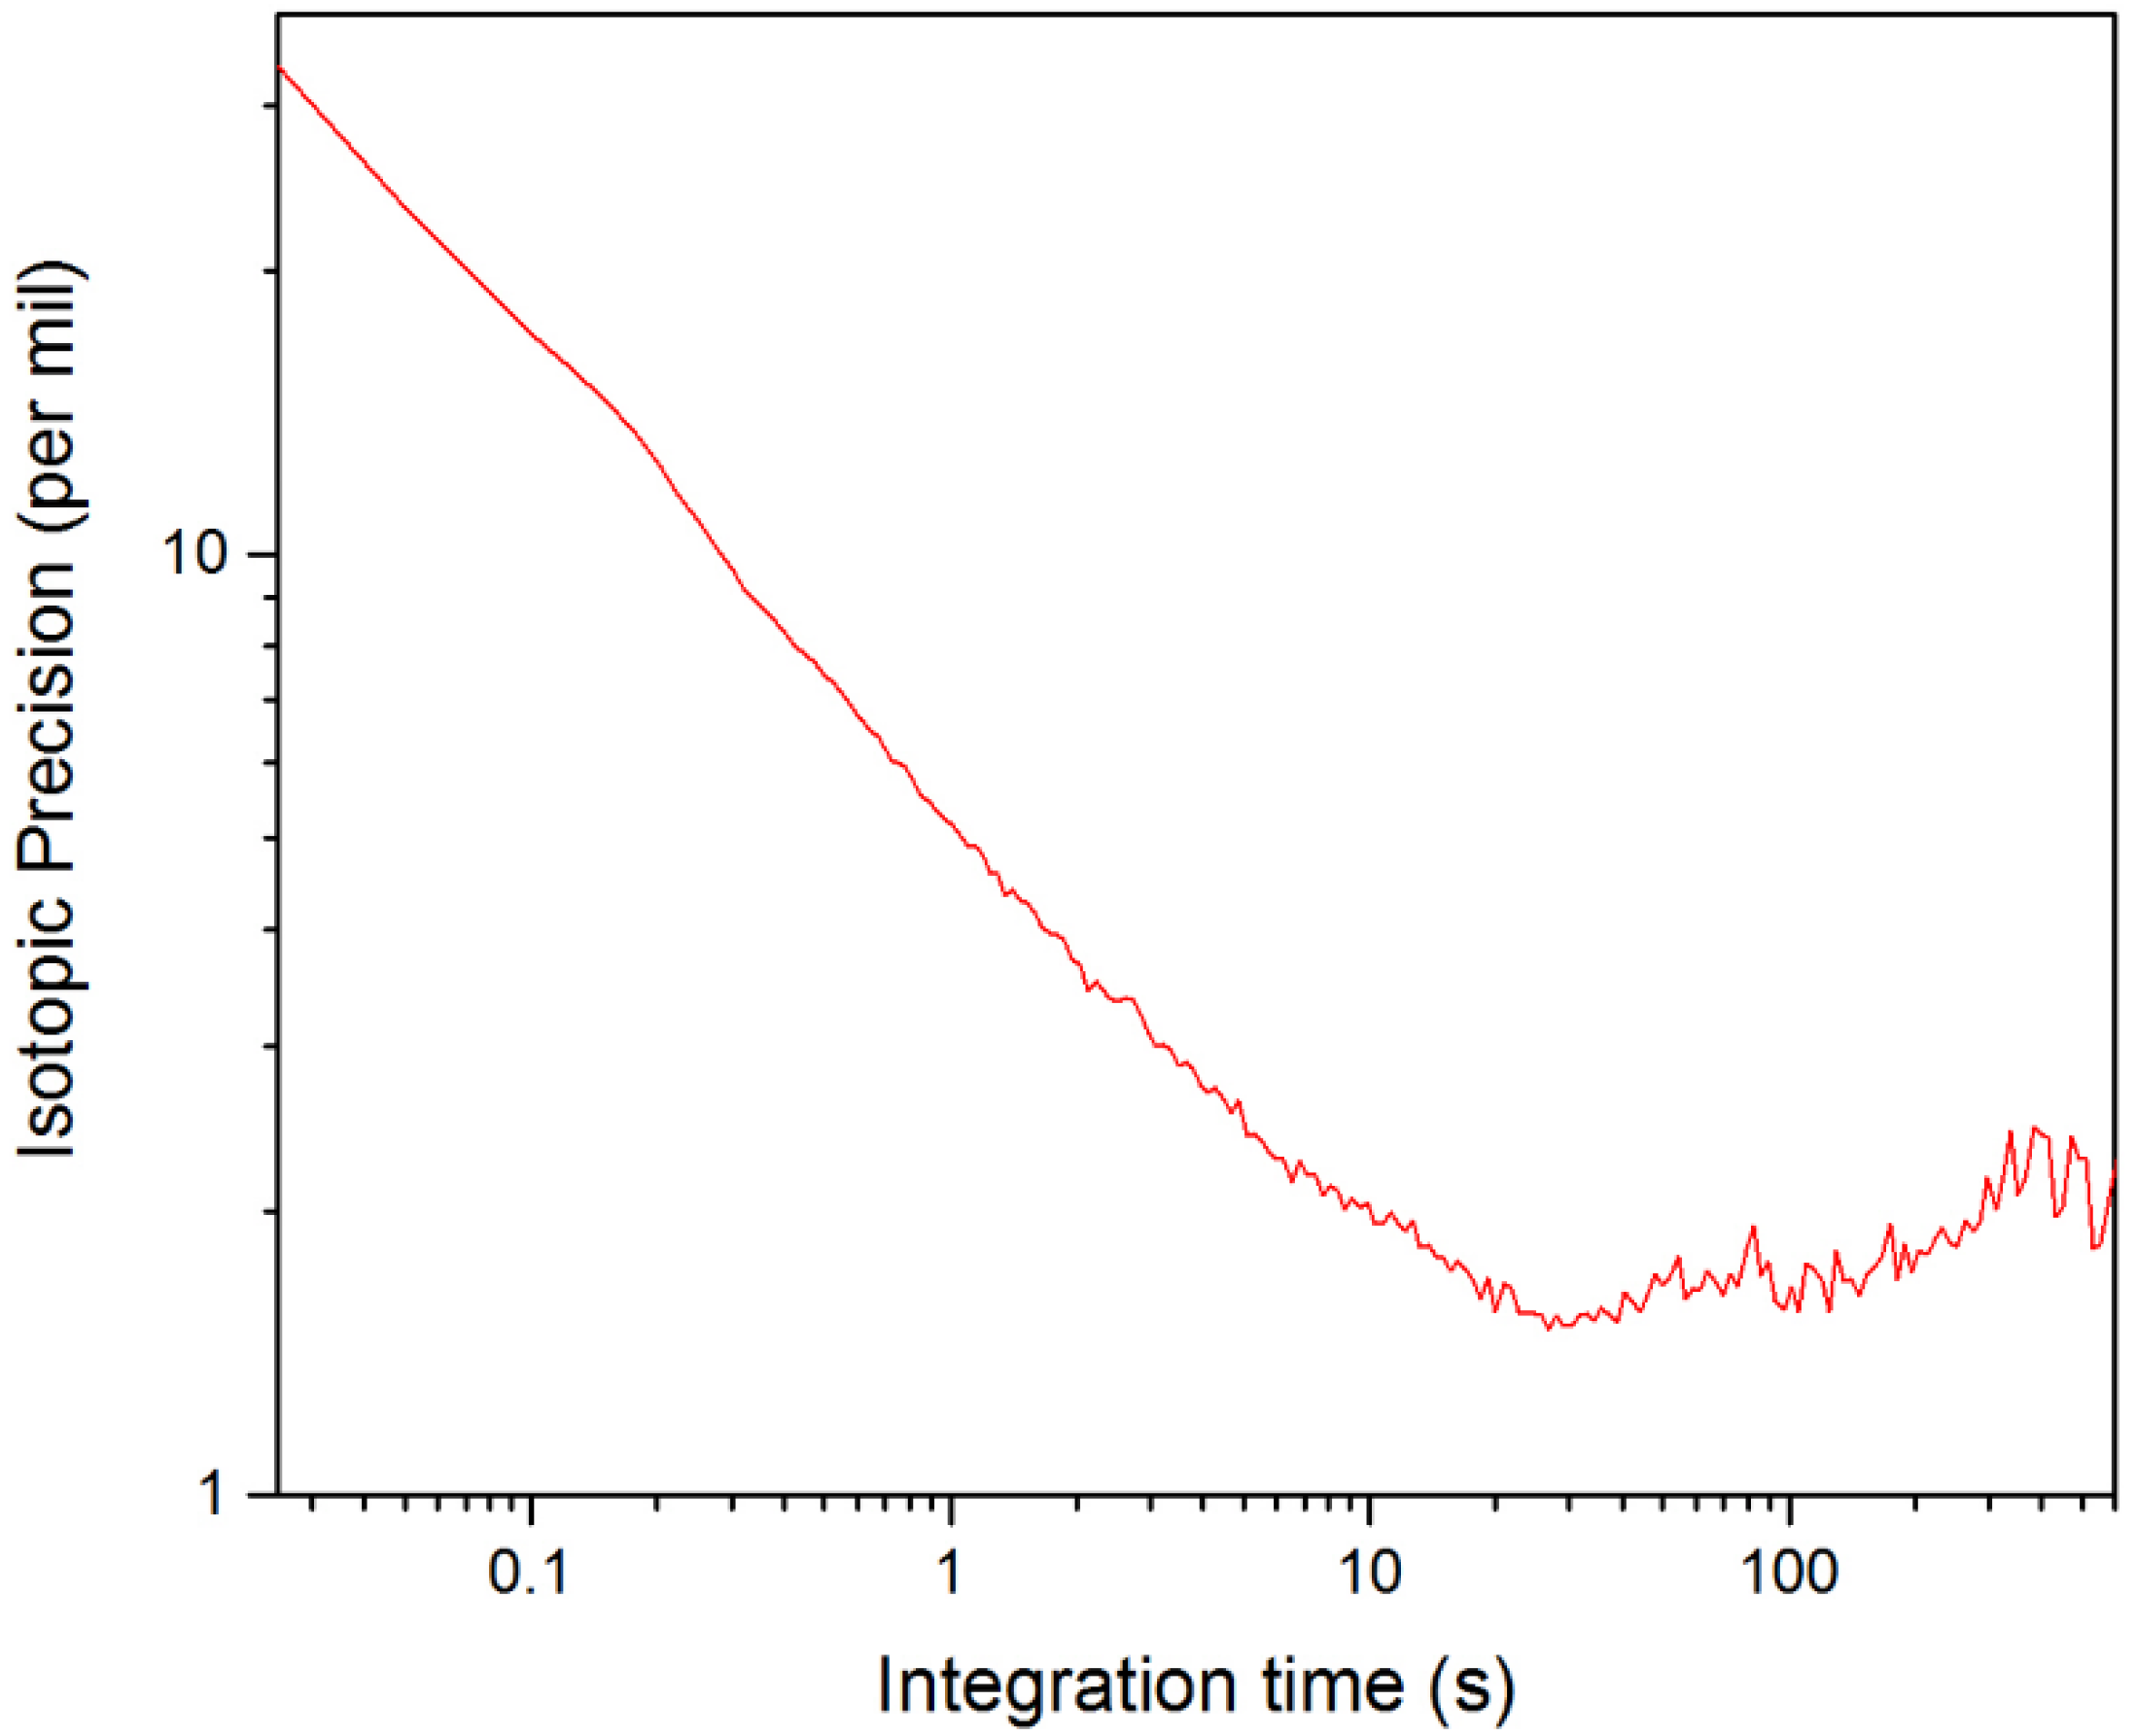
As expected, the isotopic precision also depends on the concentrations of species being measured. Values for Δ[X] for various measurement times can be taken directly from the Allan deviation analysis presented in Figure 7. In Figure 8, the Allan deviation data from Figure 7 has been combined with Equation (3) to produce an Allan plot illustrating how the isotopic precision for δ([D2O]) varies with measurement time. To generate the Allan plot in Figure 8, we assumed standard concentrations of 10 ppm and 5 ppm for HDO and D2O, respectively, which are reasonable when compared to the measured concentrations in Figure 5a. Based on Figure 8, the calculated isotopic precision for measurement times of 25 ms and 1 s is 33‰ and 5‰, respectively.

Figure 8.
Allan plot of the isotopic precision of δ([D2O]) from NEC data.
For increased isotopic precision, lines with a higher cross-section could be selected or measurements could be performed on samples with higher concentrations. To explore how the isotopic precision varies with concentration, we vary the total concentration of D2O and HDO:
When Equation (4) is combined with an Rstandard value, the concentrations for HDO and D2O are given as follows:
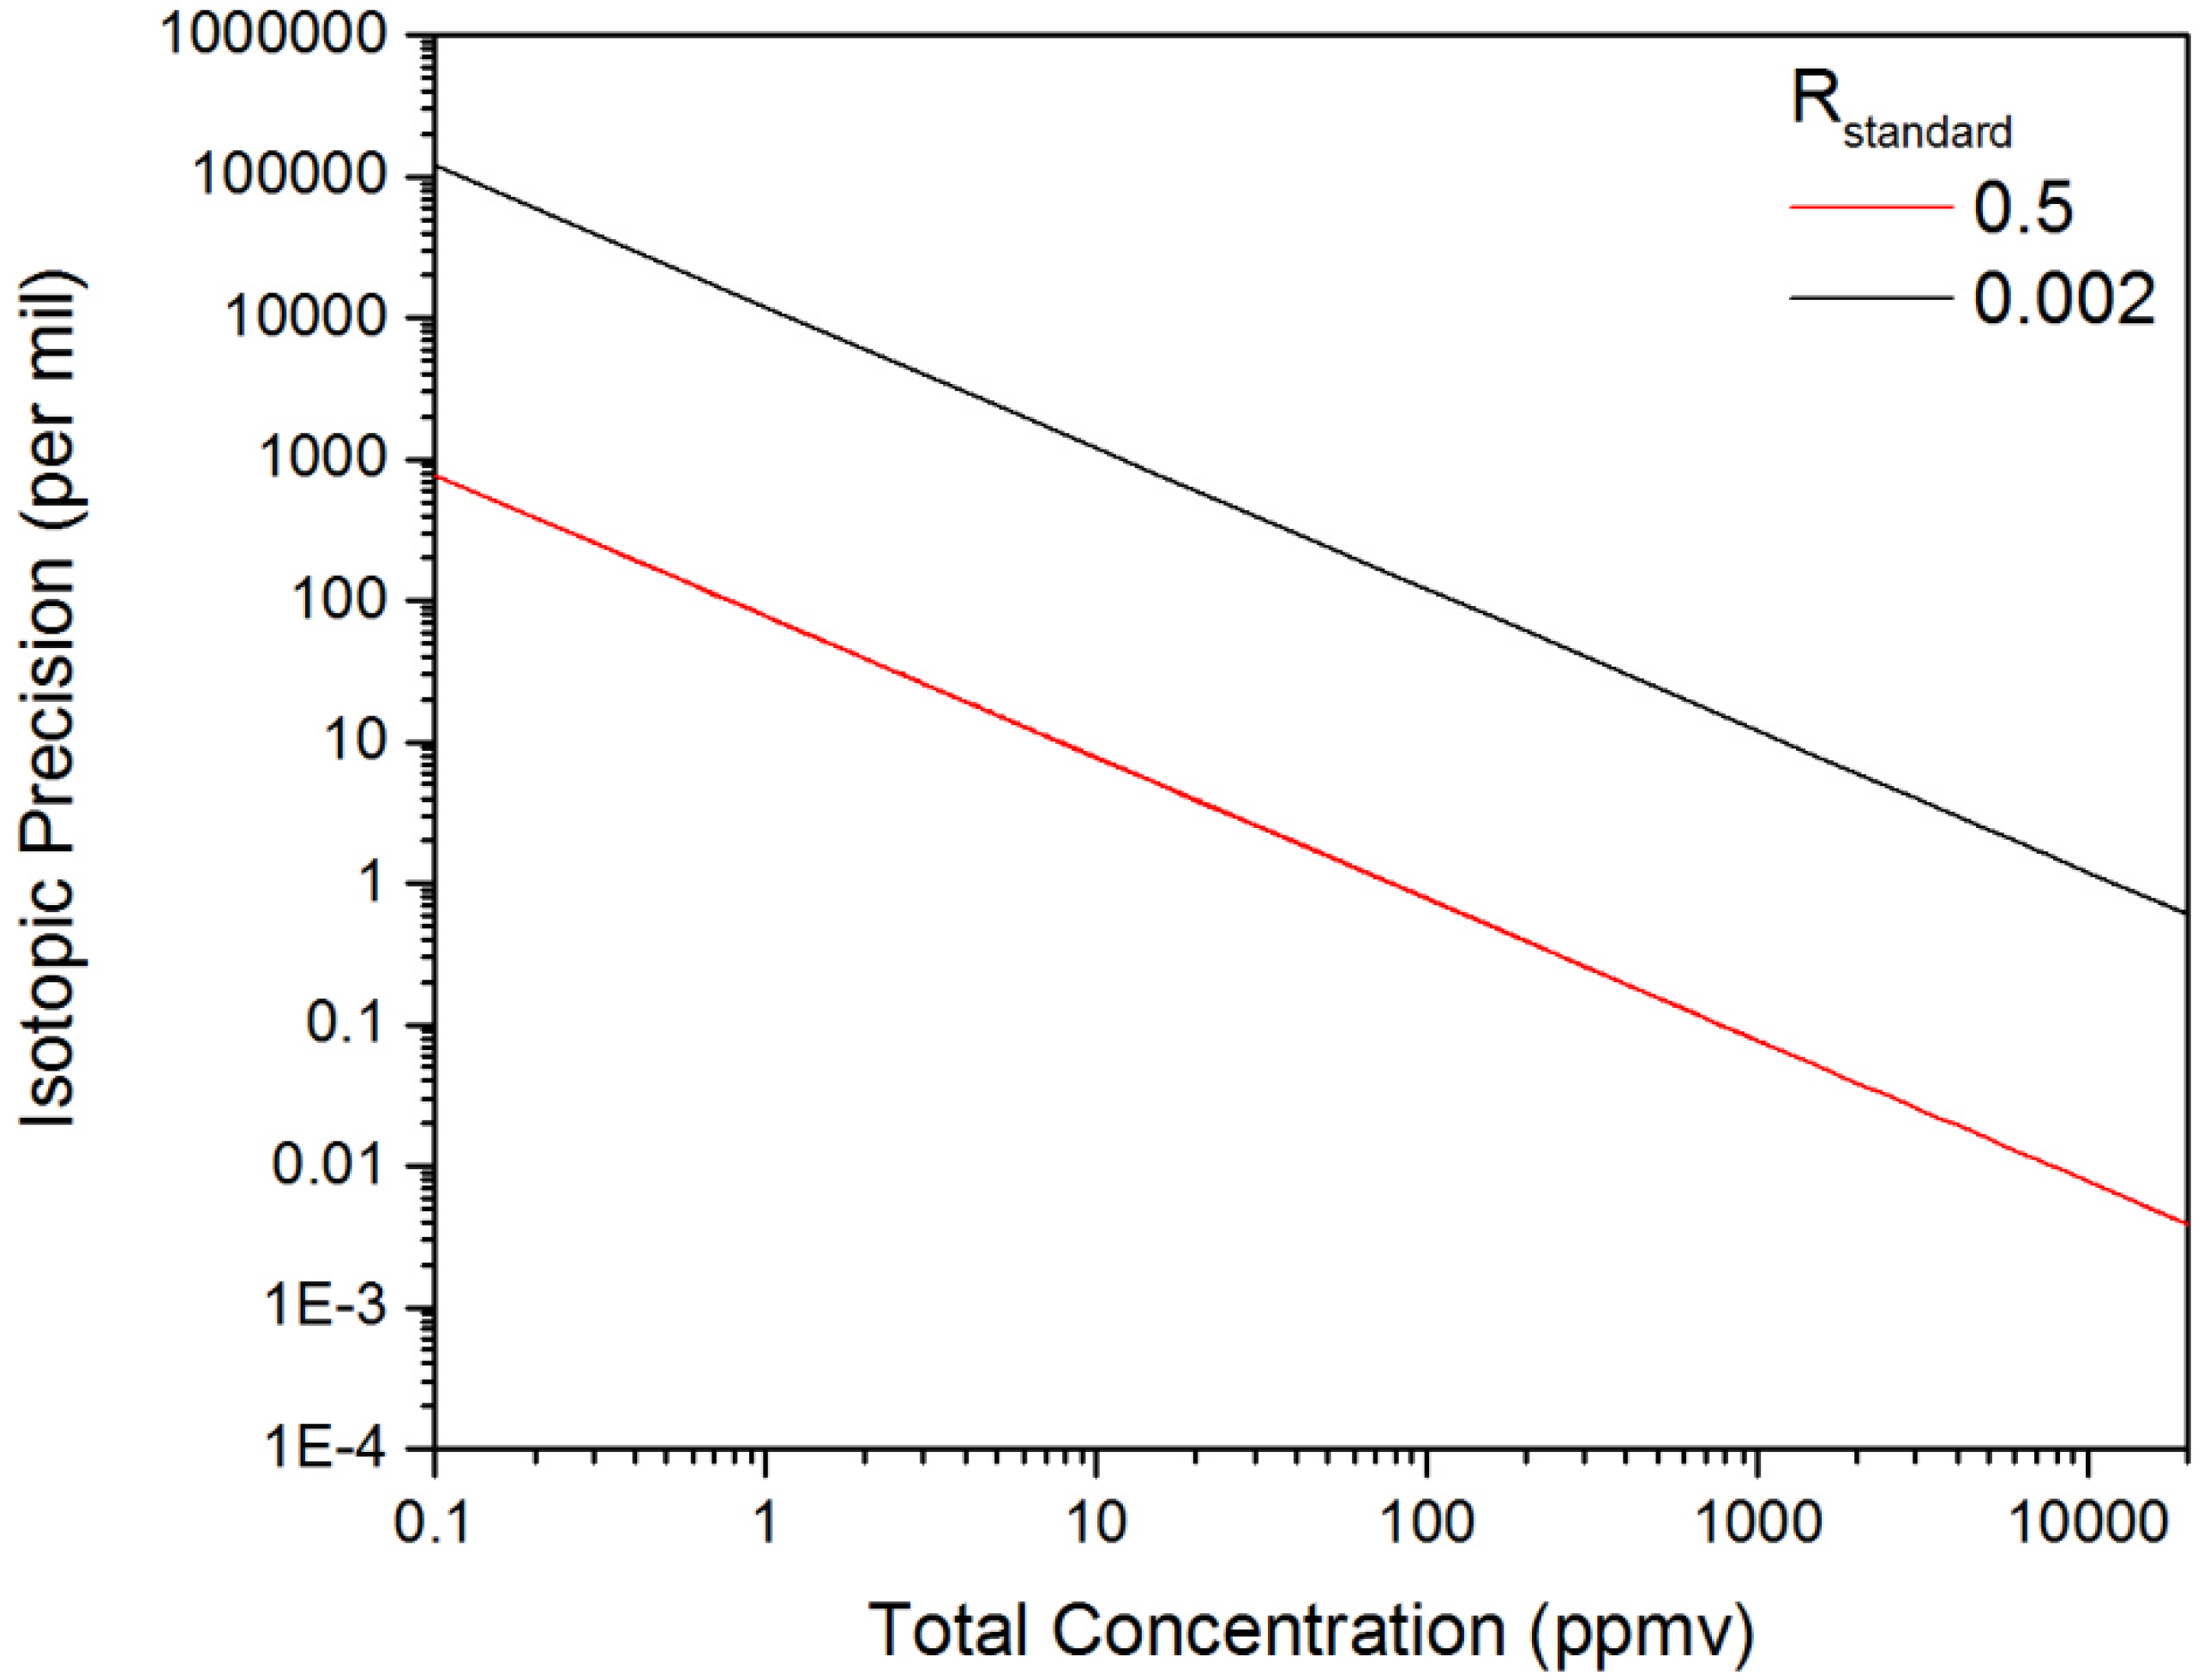
The concentrations from Equations (5) and (6) were inserted into Equation (3) for the calculation of Δ(δ([D2O])). Figure 9 provides an estimate for the isotopic precision with Δ[X] values taken from Figure 7 for D2O and HDO at a measurement time of 1 s. Figure 9 reveals that increasing the total concentration by a factor of 6.7 from 15–100 ppmv results in a corresponding improvement in the isotopic precision from 5‰–0.77‰ for a 1-s measurement. For decreasing total concentrations, we see the size of the uncertainty in the isotope ratio increase significantly as the relative uncertainty in the measurement of the minor isotope grows. These extremely large values for the isotopic precision correspond to the scenario where the uncertainty in measurement of the minor isotope concentration is much larger than the actual concentration, and in this limit, the measurement of the isotope ratio is not feasible.
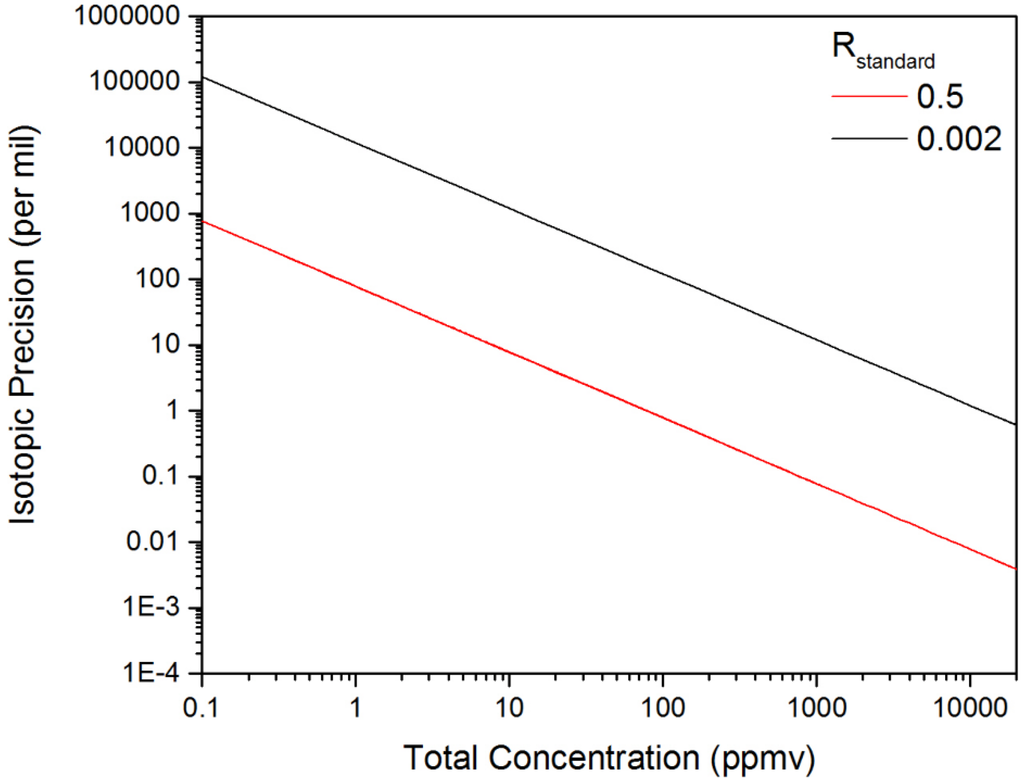
Figure 9.
The dependence of the isotopic precision on the total concentration of D2O and HDO. The two plots correspond to the calculated isotopic precision in a one-second measurement time for Rstandard values of 0.5 and 0.002.
The isotopic precision observed with the swept ECQCL is comparable with the reported isotopic precision values obtained using DFB-QCL-based systems, such as for δ13C in CO2 [13,15], δ15N in N2O [12,20] and NO [18] and δ18O in H2O [14]. These isotopic precisions are reported over a broad range of integration times, sample concentrations and gas cell pressures, but generally fall within a ~0.1–10‰ range. While the observed isotopic precision benefits from the measurement of an isotopically-enriched gas sample with an Rstandard of 0.5, this is offset by the relatively small total concentration of 15 ppmv. This can be demonstrated by scaling our isotopic precision with respect to the total species concentration and the value of Rstandard. As an example, an isotopic precision of 0.25‰ in 1 s was reported for the measurement of the H218O/H216O isotope ratio using a DFB-QCL [14]. In that study, the water vapor concentration was ~15,000 ppmv, and the Rstandard was ~0.002 for H218O/H216O (based on the mean ocean water standard [10]). The results of scaling our isotopic precision using an Rstandard value of 0.002 are provided in Figure 9. At a total concentration of 15,000 ppmv, an isotopic precision of 0.80‰ in 1 s is estimated, which is only three-times larger than that reported for the DFB-QCL-based water isotope ratio measurement [14].
4. Conclusions
A rapidly-swept ECQCL has been used for open-path measurements of an isotope ratio in a gas-phase chemical mixture. A chemical mixture of D2O and HDO was used as a test case for demonstrating the capability of a swept ECQCL source for broadband isotope ratio measurements in chemical plumes where the isotope ratio is varying rapidly in time due to the interplay between the plume transport and the rapid H/D exchange reaction with ambient H2O. The swept ECQCL source was capable of monitoring the open-path concentrations of D2O and HDO in a plume at a 40-Hz (25 ms) acquisition rate with marginal concentration cross-talk for the other chemical species used in the WLS fitting analysis. While this capability has been specifically demonstrated with a D2O chemical plume, the rapidly-swept broadband spectroscopy approach using an ECQCL source can be applied to other reactive or turbulent chemical systems where the isotope ratio is varying rapidly in time.
Based on an Allan analysis of the rapidly-swept ECQCL system performance, a NEC of ~150 ppbv is calculated for D2O and HDO in a 25-ms measurement time with the open-path Herriott cell. Overall, the NECs for F134A, SO2, CH4, N2O, acetone, HDO and D2O were <200 ppbv for a 25-ms measurement time, and for a 1-s integration time, they are reduced further to <50 ppbv. The results from this study demonstrate that a rapidly-swept ECQCL can be used for analysis of gas-phase chemical mixtures of rapidly-changing isotopic composition, with the ability to quantify chemical species with both narrow and broad spectral features. Furthermore, sub-ppmv detection limits were realized for all chemicals despite pervasive interference from strong water absorption over the 1280–1390 cm−1 spectral window.
The NEC information obtained for measurements of D2O and HDO led to an analysis of the isotopic precision of the swept ECQCL instrument. By using the average observed concentrations for D2O and HDO from the plume studies, an isotopic precision of 33‰ and 5‰ is calculated for measurement times of 25 ms and 1 s, respectively. The 33‰ precision achieved in 25 ms demonstrates the capability for the swept ECQCL to be used for measuring isotopic ratios in turbulent and/or reactive plumes. Overall, the isotopic precision obtained from our open-path swept ECQCL studies is competitive with other isotope ratio measurements made using DFB-QCLs [12,13,14,15,18,20], demonstrating the capability of the broadband spectral measurement approach with an ECQCL when compared to the conventional two spectral line measurement approach. This broadband spectral measurement capability opens up the possibility for isotope ratio measurements of large molecules with broad rotationally-unresolved vibrational bands.
Acknowledgments
This work was supported by the DOE/NNSA Office of Nonproliferation and Verification Research and Development (NA-22). The Pacific Northwest National Laboratory is operated for the U.S. Department of Energy (DOE) by the Battelle Memorial Institute under Contract No. DE-AC05-76RL01830.
Author Contributions
Brian E. Brumfield, Matthew S. Taubman and Mark C. Phillips conceived of and designed the experimental layout. Brian E. Brumfield carried out the experiments and analyzed the data. Brian E. Brumfield and Mark C. Phillips wrote the paper.
Conflicts of Interest
The authors declare that there are no conflicts of interest.
Abbreviations
The following abbreviations are used in this manuscript:
| 1,1,1,2-tetrafluoroethane | F134A |
| DFB | Distributed feedback |
| MIR | Mid-infrared |
| ECQCL | External-cavity quantum cascade laser |
| MEMS | Microelectromechanical |
| NEC | Noise equivalent concentration |
| DAQ | Digital acquisition system |
| MCT | Mercury cadmium telluride |
| WLS | Weighted least squares |
| NECD | Noise-equivalent column density |
References
- Gong, L.; Lewicki, R.; Griffin, R.J.; Flynn, J.H.; Lefer, B.L.; Tittel, F.K. Atmospheric ammonia measurements in Houston, TX using an external-cavity quantum cascade laser-based sensor. Atmos. Chem. Phys. 2011, 11, 9721–9733. [Google Scholar] [CrossRef]
- Stockwell, C.E.; Yokelson, R.J.; Kreidenweis, S.M.; Robinson, A.L.; DeMott, P.J.; Sullivan, R.C.; Reardon, J.; Ryan, K.C.; Griffith, D.W.T.; Stevens, L. Trace gas emissions from combustion of peat, crop residue, domestic biofuels, grasses, and other fuels: Configuration and Fourier transform infrared (FTIR) component of the fourth Fire Lab at Missoula Experiment (FLAME-4). Atmos. Chem. Phys. 2014, 14, 9727–9754. [Google Scholar] [CrossRef]
- Spearrin, R.M.; Ren, W.; Jeffries, J.B.; Hanson, R.K. Multi-band infrared CO2 absorption sensor for sensitive temperature and species measurements in high-temperature gases. Appl. Phys. B 2014, 116, 855–865. [Google Scholar] [CrossRef]
- Brandstetter, M.; Genner, A.; Anic, K.; Lendl, B. Tunable external cavity quantum cascade laser for the simultaneous determination of glucose and lactate in aqueous phase. Analyst 2010, 135, 3260–3265. [Google Scholar] [CrossRef] [PubMed]
- Brandstetter, M.; Sumalowitsch, T.; Genner, A.; Posch, A.E.; Herwig, C.; Drolz, A.; Fuhrmann, V.; Perkmann, T.; Lendl, B. Reagent-free monitoring of multiple clinically relevant parameters in human blood plasma using a mid-infrared quantum cascade laser based sensor system. Analyst 2013, 138, 4022–4028. [Google Scholar] [CrossRef] [PubMed]
- Wagner, J.; Ostendorf, R.; Grahmann, J.; Merten, A.; Hugger, S.; Jarvis, J.P.; Fuchs, F.; Boskovic, D.; Schenk, H. Widely tuneable quantum cascade lasers for spectroscopic sensing. Proc. SPIE 2015, 9370. [Google Scholar] [CrossRef]
- Kotidis, P.; Deutsch, E.R.; Goyal, A. Standoff detection of chemical and biological threats using miniature widely tunable QCLs. Proc. SPIE 2015, 9467. [Google Scholar] [CrossRef]
- Lyakh, A.; Barron-Jimenez, R.; Dunayevskiy, I.; Go, R.; Patel, C.K.N. External cavity quantum cascade lasers with ultra rapid acousto-optic tuning. Appl. Phys. Lett. 2015, 106, 141101. [Google Scholar] [CrossRef]
- Hugger, S.; Fuchs, F.; Jarvis, J.; Kinzer, M.; Yang, Q.K.; Driad, R.; Aidam, R.; Wagner, J. Broadband-tunable external-cavity quantum cascade lasers for the spectroscopic detection of hazardous substances. Proc. SPIE 2013, 8631. [Google Scholar] [CrossRef]
- Joly, L.; Zéninari, V.; Parvitte, B.; Courtois, D.; Durry, G. Water-vapor isotope ratio measurements in air with a quantum-cascade laser spectrometer. Opt. Lett. 2006, 31, 143–145. [Google Scholar] [CrossRef] [PubMed]
- Worle, K.; Seichter, F.; Wilk, A.; Armacost, C.; Day, T.; Godejohann, M.; Wachter, U.; Vogt, J.; Radermacher, P.; Mizaikoff, B. Breath Analysis with Broadly Tunable Quantum Cascade Lasers. Anal. Chem. 2013, 85, 2697–2702. [Google Scholar] [CrossRef] [PubMed]
- Mohn, J.; Tuzson, B.; Manninen, A.; Yoshida, N.; Toyoda, S.; Brand, W.A.; Emmenegger, L. Site selective real-time measurements of atmospheric N2O isotopomers by laser spectroscopy. Atmos. Meas. Tech. 2012, 5, 1601–1609. [Google Scholar] [CrossRef]
- Kasyutich, V.L.; Martin, P.A. 13CO2/12CO2 isotopic ratio measurements with a continuous-wave quantum cascade laser in exhaled breath. Infrared Phys. Technol. 2012, 55, 60–66. [Google Scholar] [CrossRef]
- Wang, W.E.; Michel, A.P.M.; Wang, L.; Tsai, T.; Baeck, M.L.; Smith, J.A.; Wysocki, G. A quantum cascade laser-based water vapor isotope analyzer for environmental monitoring. Rev. Sci. Instrum. 2014, 85, 10. [Google Scholar] [CrossRef] [PubMed]
- Nelson, D.D.; McManus, J.B.; Herndon, S.C.; Zahniser, M.S.; Tuzson, B.; Emmenegger, L. New method for isotopic ratio measurements of atmospheric carbon dioxide using a 4.3 μm pulsed quantum cascade laser. Appl. Phys. B 2008, 90, 301–309. [Google Scholar] [CrossRef]
- Barthel, M.; Sturm, P.; Hammerle, A.; Buchmann, N.; Gentsch, L.; Siegwolf, R.; Knohl, A. Soil H218O labelling reveals the effect of drought on C18OO fluxes to the atmosphere. J. Exp. Bot. 2014, 65, 5783–5793. [Google Scholar] [CrossRef] [PubMed]
- Wang, Y.; Nikodem, M.; Zhang, E.; Cikach, F.; Barnes, J.; Comhair, S.; Dweik, R.A.; Kao, C.; Wysocki, G. Shot-noise Limited Faraday Rotation Spectroscopy for Detection of Nitric Oxide Isotopes in Breath, Urine, and Blood. Sci. Rep. 2015. [Google Scholar] [CrossRef] [PubMed]
- Zhang, E.; Huang, S.; Ji, Q.X.; Silvernagel, M.; Wang, Y.; Ward, B.; Sigman, D.; Wysocki, G. Nitric Oxide Isotopic Analyzer Based on a Compact Dual-Modulation Faraday Rotation Spectrometer. Sensors 2015, 15, 25992–26008. [Google Scholar] [CrossRef] [PubMed]
- Brumfield, B.E.; Taubman, M.S.; Suter, J.D.; Phillips, M.C. Characterization of a swept external cavity quantum cascade laser for rapid broadband spectroscopy and sensing. Opt. Express 2015, 23, 25553–25569. [Google Scholar] [CrossRef] [PubMed]
- Li, J.S.; Zhang, L.Z.; Yu, B.L. Site-selective nitrogen isotopic ratio measurement of nitrous oxide using a TE-cooled CW-RT-QCL based spectrometer. Spectrochim. Acta Part A Mol. Biomol. Spectrosc. 2014, 133, 489–494. [Google Scholar] [CrossRef] [PubMed]
- Phillips, M.C.; Taubman, M.S.; Bernacki, B.E.; Cannon, B.D.; Stahl, R.D.; Schiffern, J.T.; Myers, T.L. Real-time trace gas sensing of fluorocarbons using a swept-wavelength external cavity quantum cascade laser. Analyst 2014, 139, 2047–2056. [Google Scholar] [CrossRef] [PubMed]
- Phillips, M.C.; Taubman, M.S.; Bernacki, B.E.; Cannon, B.D.; Schiffern, J.T.; Myers, T.L. Design and performance of a sensor system for detection of multiple chemicals using an external cavity quantum cascade laser. Proc. SPIE 2010, 7608. [Google Scholar] [CrossRef]
- Phillips, M.C.; Taubman, M.S.; Kriesel, J. Use of external cavity quantum cascade laser compliance voltage in real-time trace gas sensing of multiple chemicals. Proc. SPIE 2015, 9370. [Google Scholar] [CrossRef]
- Phillips, M.C.; Taubman, M.S. Trace-gas sensing using the compliance voltage of an external cavity quantum cascade laser. Proc. SPIE 2013, 8726. [Google Scholar] [CrossRef]
- Suter, J.D.; Bernacki, B.; Phillips, M.C. Spectral and angular dependence of mid-infrared diffuse scattering from explosives residues for standoff detection using external cavity quantum cascade lasers. Appl. Phys. B 2012, 108, 965–974. [Google Scholar] [CrossRef]
- Phillips, M.C.; Suter, J.D.; Bernacki, B.E. Hyperspectral microscopy using an external cavity quantum cascade laser and its applications for explosives detection. Proc. SPIE 2012, 8268. [Google Scholar] [CrossRef]
- Craig, I.M.; Taubman, M.S.; Lea, A.S.; Phillips, M.C.; Josberger, E.E.; Raschke, M.B. Infrared near-field spectroscopy of trace explosives using an external cavity quantum cascade laser. Opt. Express 2013, 21, 30401–30414. [Google Scholar] [CrossRef] [PubMed]
- Phillips, M.C.; Bernacki, B.E. Hyperspectral microscopy of explosives particles using an external cavity quantum cascade laser. Opt. Eng. 2013, 52, 061302. [Google Scholar] [CrossRef]
- Taubman, M.S. Low-noise high-performance current controllers for quantum cascade lasers. Rev. Sci. Instrum. 2011, 82, 064704. [Google Scholar] [CrossRef] [PubMed]
- Sharpe, S.W.; Johnson, T.J.; Sams, R.L.; Chu, P.M.; Rhoderick, G.C.; Johnson, P.A. Gas-phase databases for quantitative infrared spectroscopy. Appl. Spectrosc. 2004, 58, 1452–1461. [Google Scholar] [CrossRef] [PubMed]

© 2016 by the authors; licensee MDPI, Basel, Switzerland. This article is an open access article distributed under the terms and conditions of the Creative Commons Attribution (CC-BY) license (http://creativecommons.org/licenses/by/4.0/).