Abstract
The actual metabolic capacity of the liver is crucial for disease identification, liver therapy, and liver tumor resection. By combining induced drug metabolism and high sensitivity IR spectroscopy of exhaled air, we provide a method for quantitative liver assessment at bedside within 20 to 60 min. Fast administration of 13C-labelled methacetin induces a fast response of liver metabolism and is tracked in real-time by the increase of 13CO2 in exhaled air. The 13CO2 concentration increase in exhaled air allows the determination of the metabolic liver capacity (LiMAx-test). Fluctuations in CO2 concentration, pressure and temperature are minimized by special gas handling, and tracking of several spectrally resolved CO2 absorption bands with a quantum cascade laser. Absorption measurement of different 12CO2 and 13CO2 rotation-vibration transitions in the same time window allows for multiple referencing and reduction of systematic errors. This FLIP (Fast liver investigation package) setup is being successfully used to plan operations and determine the liver status of patients.
1. Introduction
Exhaled air provides information on the concentration of volatile organic compounds, oxygen, CO2, and other gases (e.g., HCN) in the blood. These compounds can reflect metabolic processes and storage of gases inhaled before [1]. One of the main compounds in exhaled air is CO2. Concentration changes of CO2 in exhaled air can result from the metabolism of nutrients and from changes in metabolism. Therefore, it is a difficult task to assign concentration changes to a specific metabolic process. The LiMAx test (liver maximal capacity) describes a procedure to assign 13CO2 concentration changes in exhaled breath to a single metabolic process in liver cells. The most important point is fast intravenous (IV) administration of the drug 13C-methacetin—much faster than the redistribution processes within the human body. The drug 13C-methacetin is solely metabolized by the enzyme cytochrome P450 1A2 (CYP450 1A2) into 13CO2 and paracetamol. Since CYP450 1A2 exists only in liver cells, the additionally generated 13CO2 reflects the metabolism of the liver. Under normal conditions, the proportion of exhaled 13CO2 in the breath volume amounts to 1% of the exhaled 12CO2 due to its natural abundance, and is about 0.02%–0.05% of the exhaled volume. The ratio, R, of 13CO2 to 12CO2 is expected to be constant and is measured to identify alterations due to additional metabolic processes of administered 13C enriched substrates [2]. Typically, this ratio (R) is constant with only small and slow variations of less than ±1‰ reflecting the natural abundance of 13C in nutrients [3]. Upon administration of 13C-methacetin, followed by metabolization into 13CO2, R increases on a time scale of the metabolic process. The change of R as a function of time is plotted as DOB (Delta over baseline) kinetic in per-mil.
The LiMAx test uses the maximum of the DOB kinetics to calculate the LiMAx value using Equation (1) [4]:
Here, DOB(tmax) is the maximum of the DOB kinetics, and DOB(t0) the constant value before 13C-methacetin administration. The amplitude of the DOB kinetics is directly proportional to the LiMAx value. The natural abundance of 13C is taken into account by RPDB = 0.0112375 [5], P is the calculated average molar CO2 production of the patient [6,7], m is the body weight of the patient, and M is the molar mass of methacetin. The administered dose of 13C-methacetin was 2 mg/kg body weight. The LiMAx value provides a personalized measure of a metabolic liver parameter. This value encompasses an average property of the metabolic capacity of the liver, since CYP450 1A2 is evenly distributed in the liver cells. Specific information on metabolic processes in liver subsections or on circulatory problems in the liver are not included. Nevertheless, information on the metabolic liver status is essential for operations, in particular, liver operations. Included in the clinical routine, the LiMAx test allows for a reduction in the mortality rate after liver resections by more than 70% [8,9].
For an individual patient, the accuracy of the LiMAx value is dominated by the precision of the detection of the DOB kinetics. Here, we describe the FLIP device (fast liver investigation package) developed for precise measurement of the DOB kinetics at bedside.
2. Materials and Methods
2.1. Handling of Breath Gas
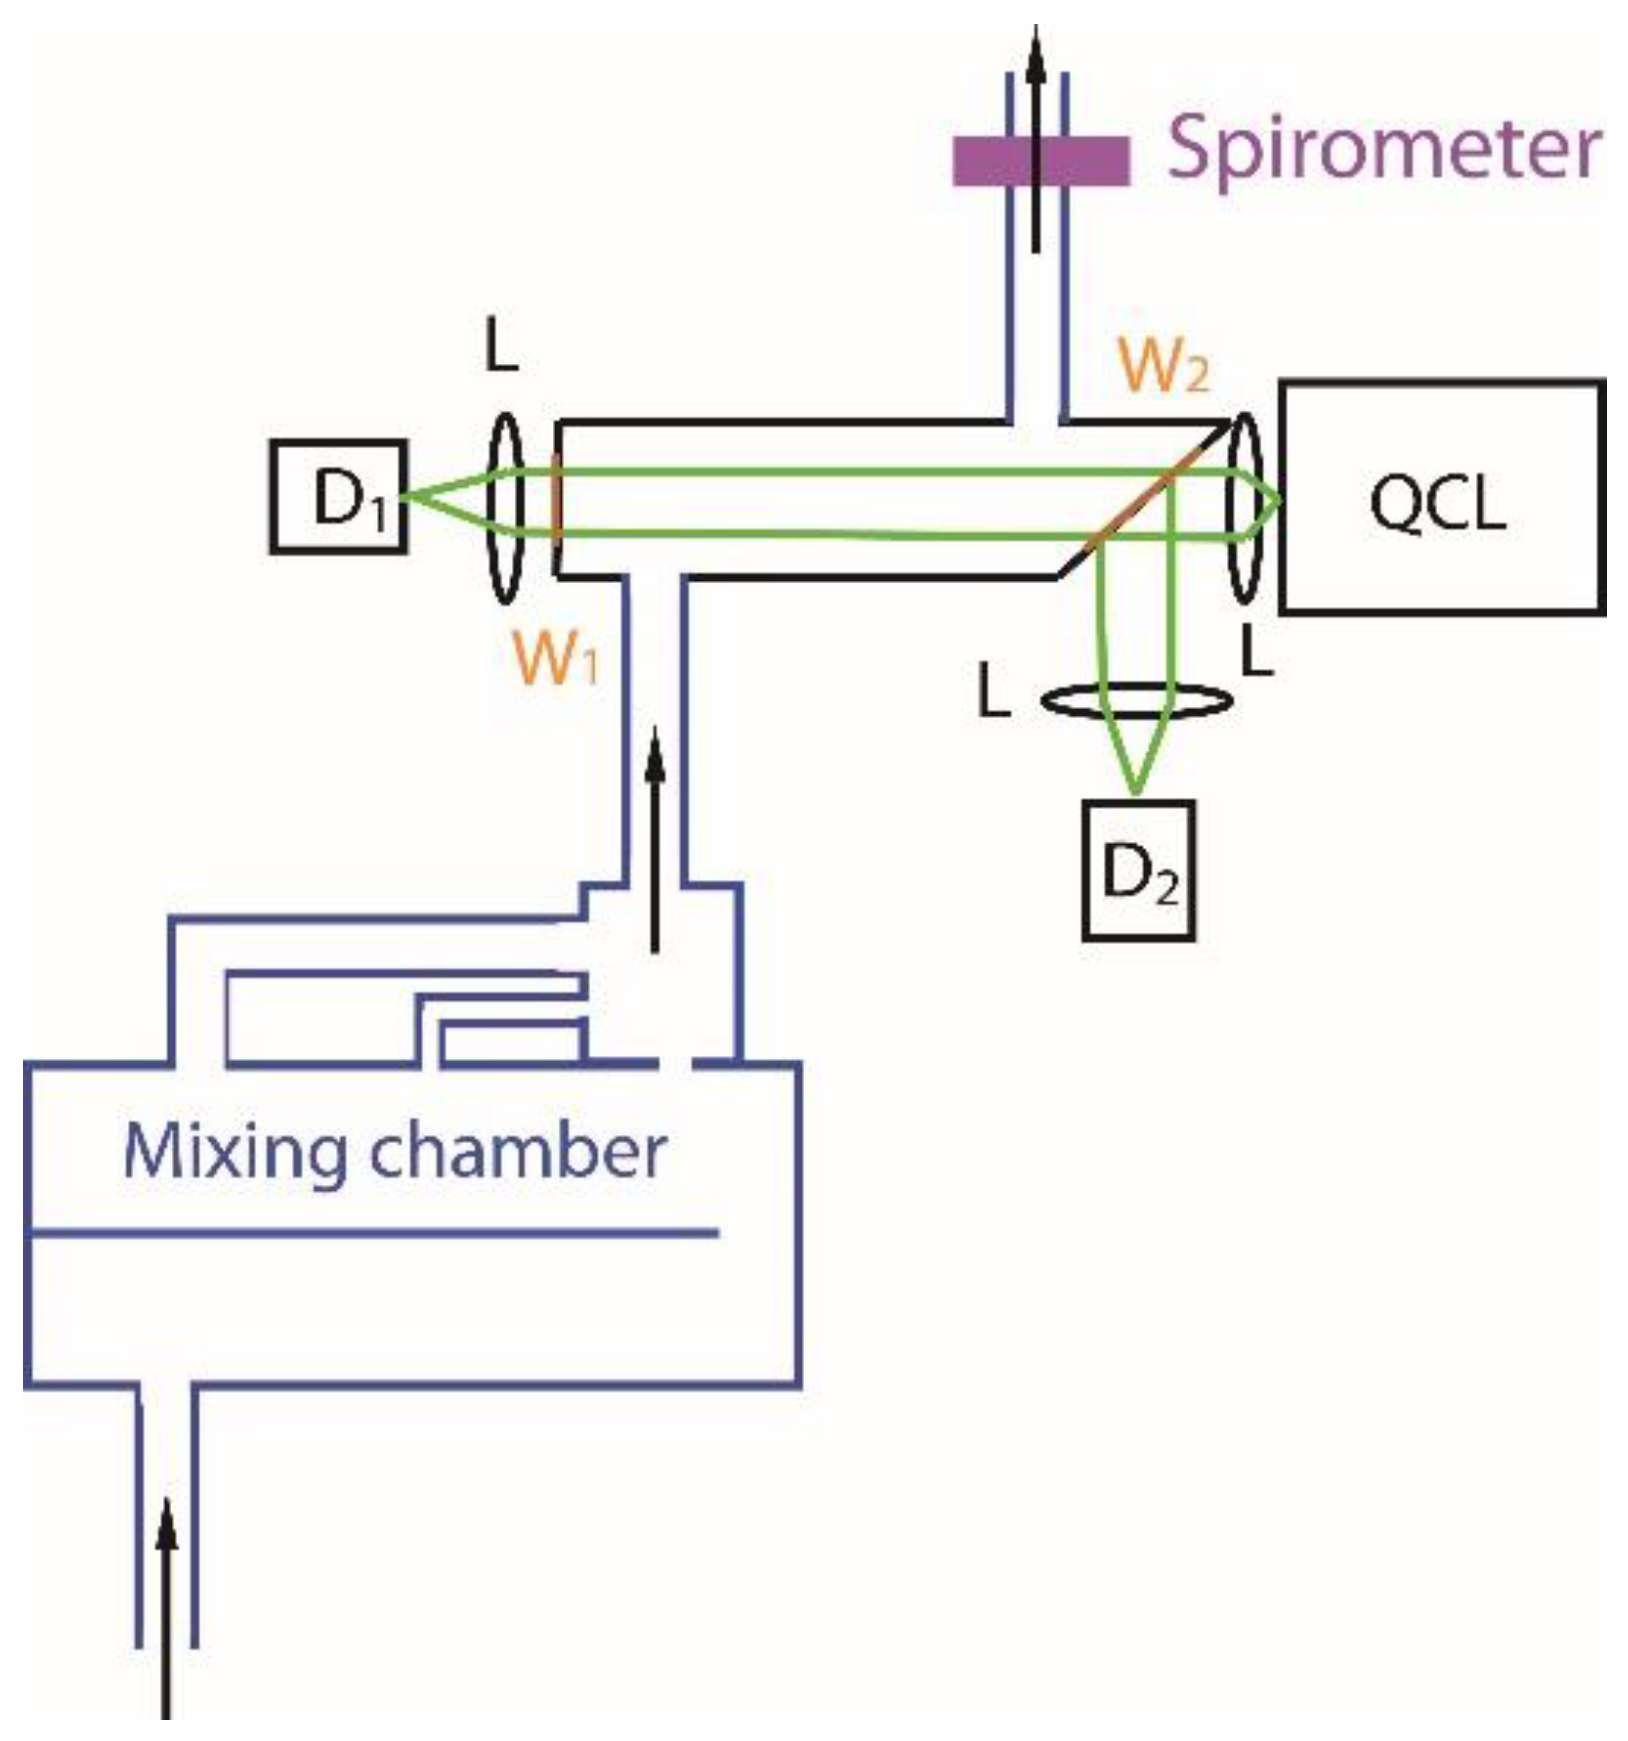
A single exhaled breath contains a mixture of gases, changing in concentration and composition, during exhalation. Typically, the CO2 concentration is maximal at the final part of the exhaled air, since this volume stays the longest in the lung and is minimal at the beginning due to the non-enrichment of the inhaled air [10]. In Figure 1, the CO2 concentration is depicted for several breaths as a function of time (black line). The concentration was measured by spectrally broad integrated absorption of rotation-vibration transitions of 13CO2 and 12CO2 [11]. The setup we used for all measurements is depicted in Figure 2. The prototype of this FLIP setup was described earlier [10]. Here, we focus on differences made to develop the FLIP device for medical certification and daily application in a hospital. As depicted in Figure 2, the complete breath is exhaled into the FLIP device. The respiration of the person transports the gas into and through the sample chamber. Every new breath presses the previous breath out of the FLIP device. No valves or pumps are needed. While the whole breath flows through the FLIP, absorption measurements were performed in the sample chamber.

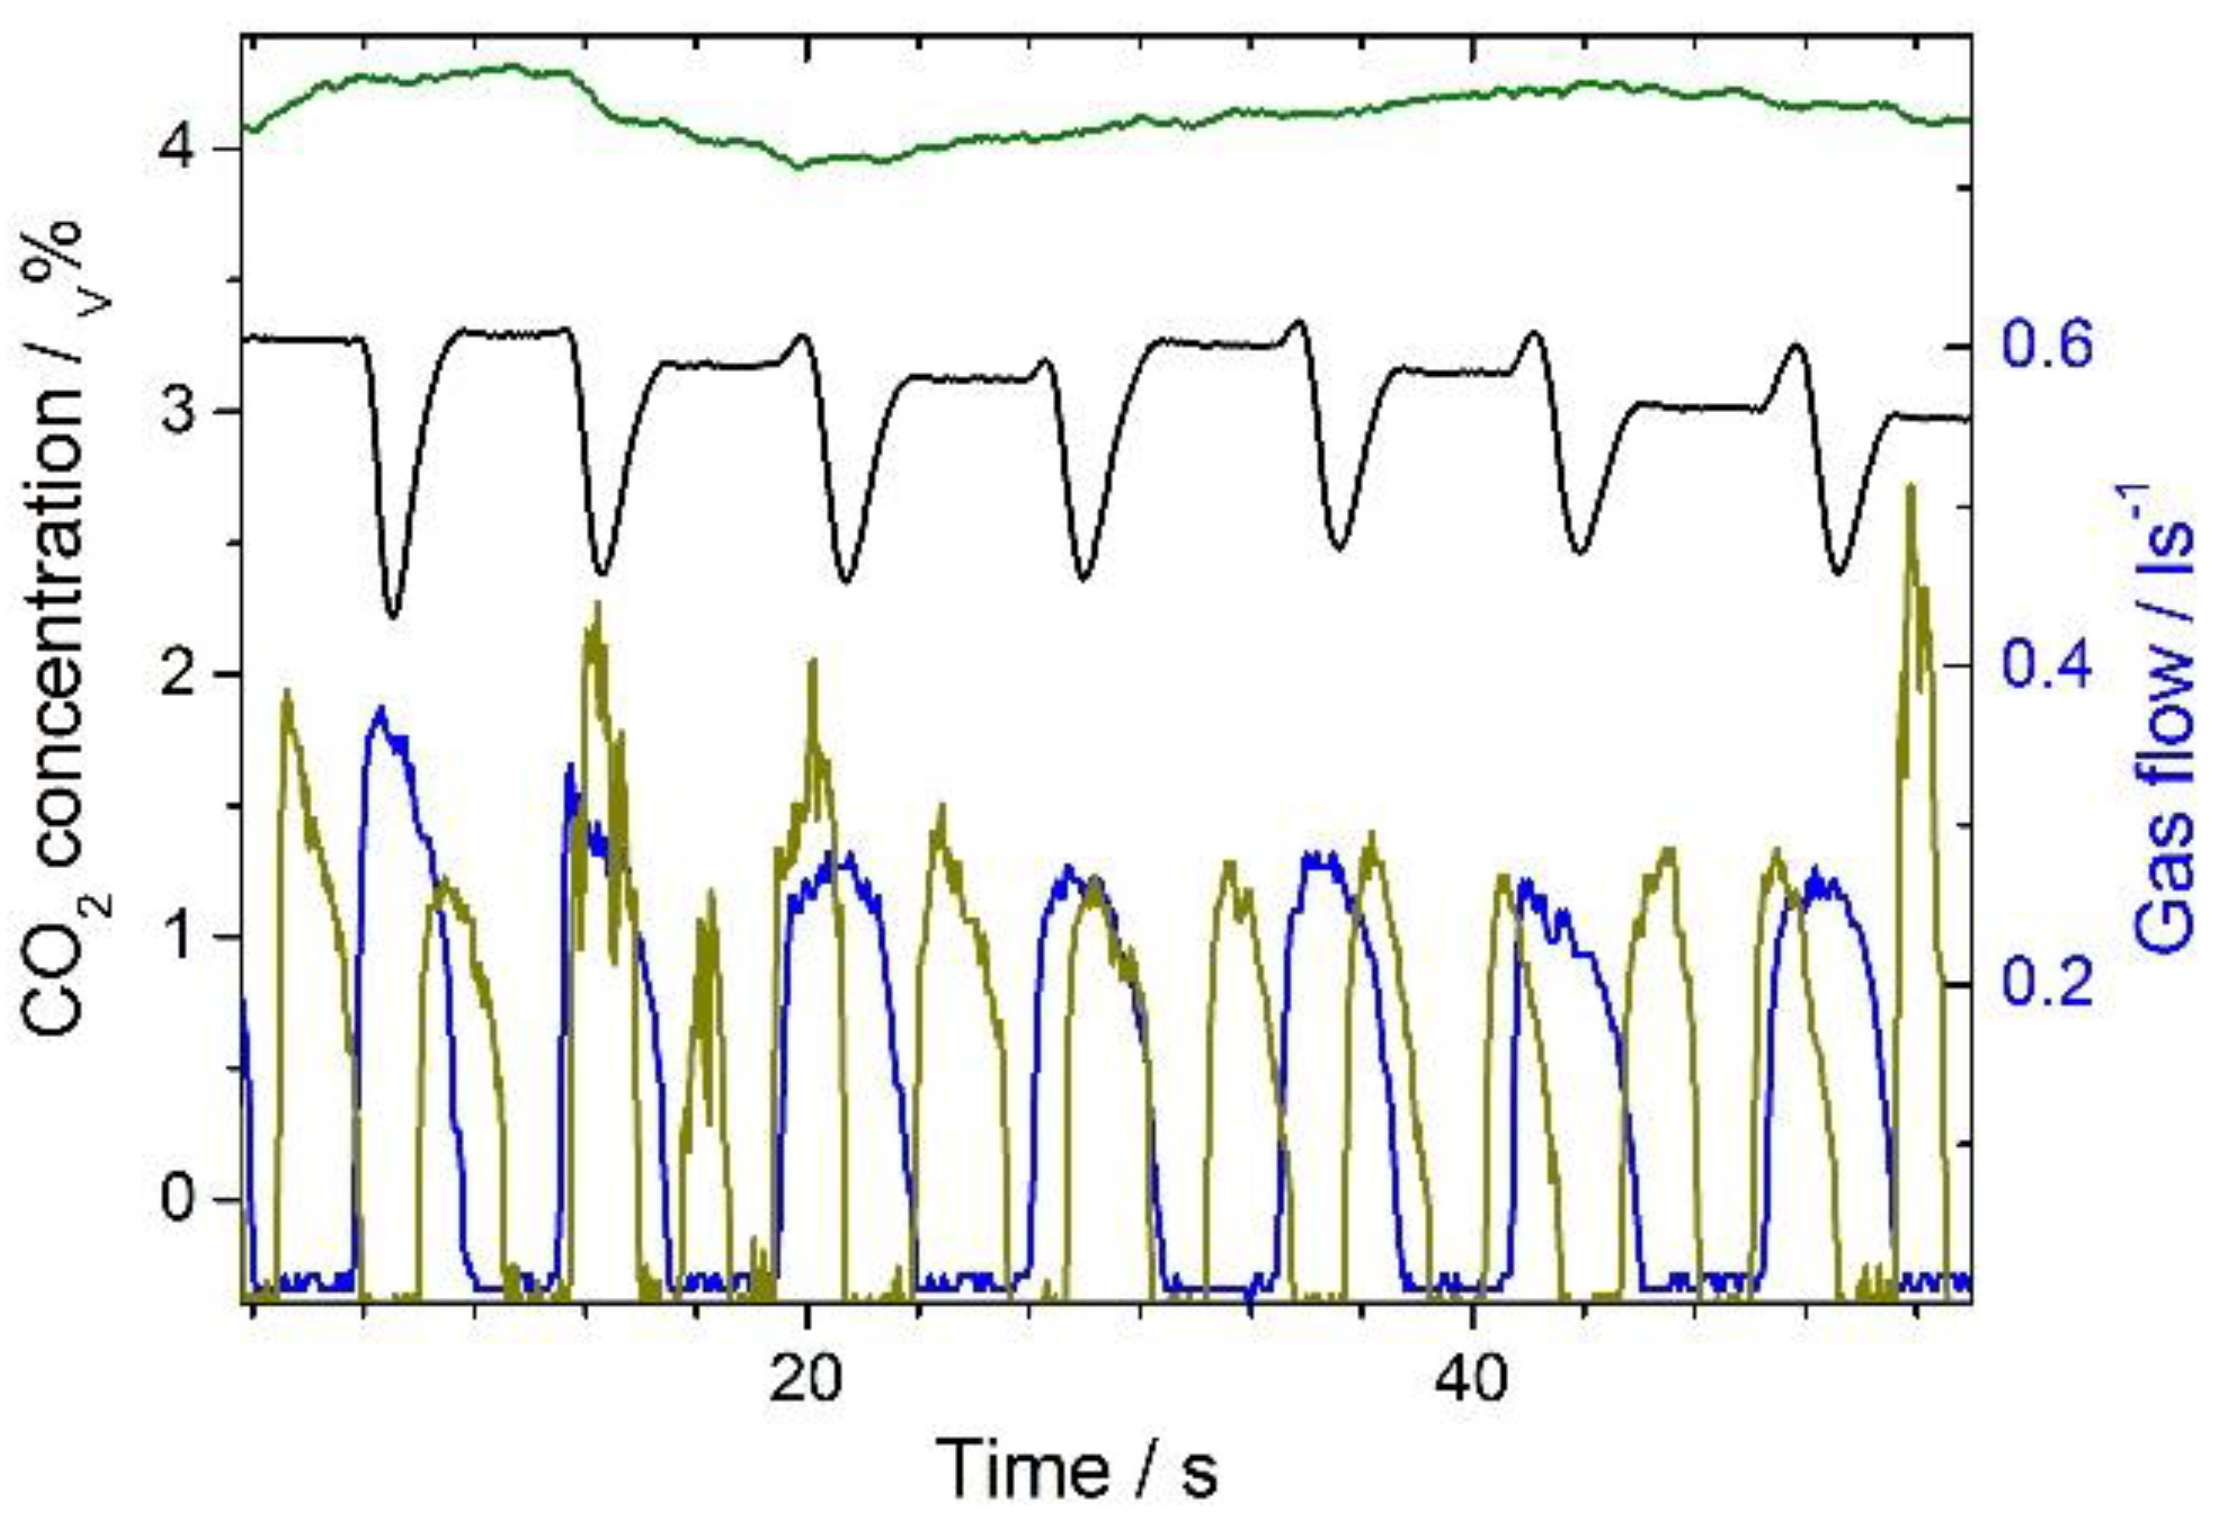
Figure 1.
CO2 concentrations of exhaled breaths (left scale) and the associated gas flow induced by the breathing cycle (right scale): Successive exhaled breaths measured in the FLIP (fast liver investigation package) device without mixing chamber: CO2 concentration (black line) and gas flow (blue line), concentration changes are mainly due to alterations of the alveolar air proportion; successive exhaled breaths measured in the FLIP device with mixing chamber: CO2 concentration (green line) and gas flow (dark yellow line).
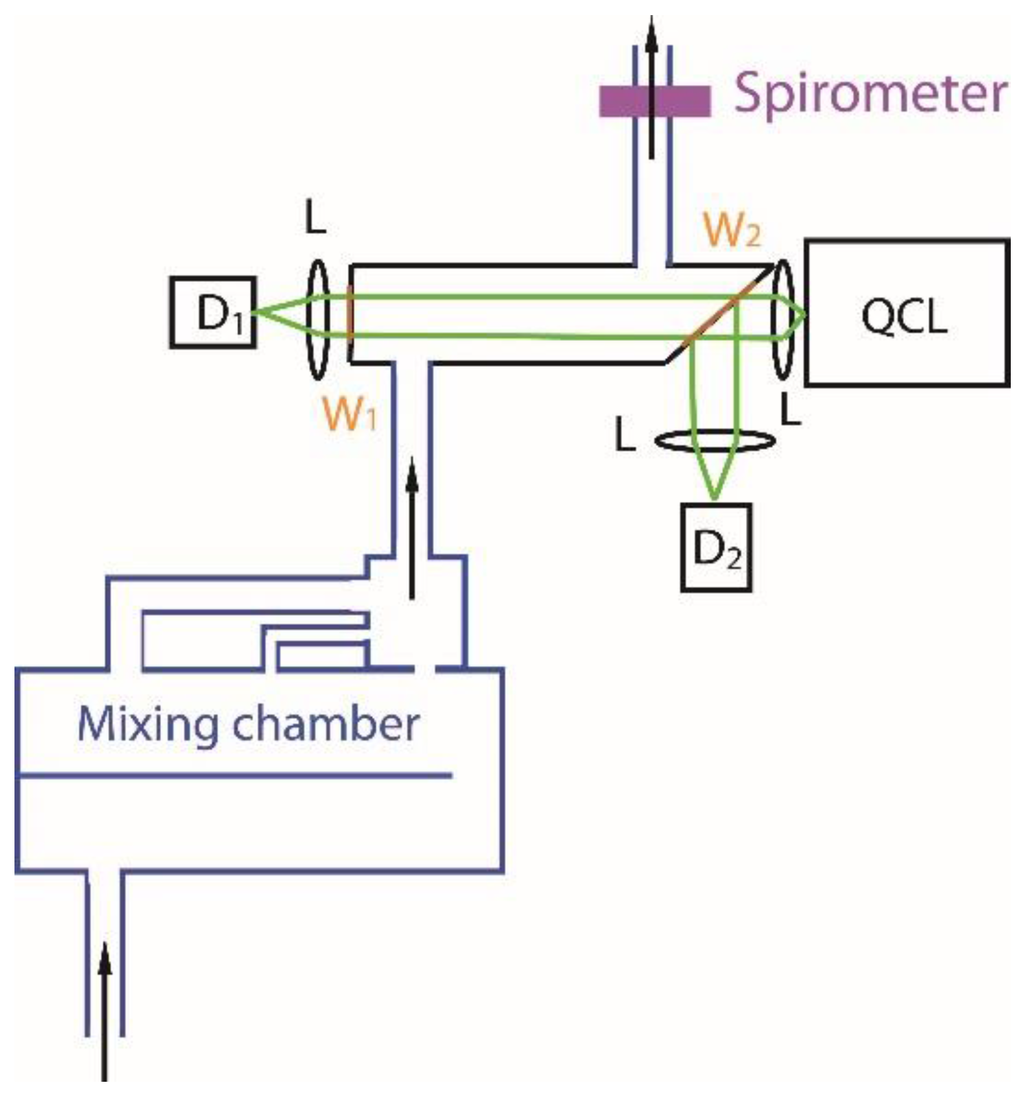
Figure 2.
Schematic setup of a FLIP device with mixing chamber, sample chamber with sapphire windows, detectors D1 and D2, quantum cascade laser (QCL), lenses L, and flow meter. The exhaled breath is pushed through the setup by respiration (see arrows). Note, the cross section of the whole setup is kept constant to ensure a laminar flow of the gas. The sample chamber, framed by the two sapphire windows W1 and W2, has a length of 10 cm, and a cross sectional area of 5 cm2.
In Figure 1, the detected CO2 concentration and the gas flow is presented for two situations. First, the complete setup is used, second, the measurements were performed without the mixing chamber depicted in Figure 2. Without the mixing chamber, the black line reflects the concentration change in the sample chamber, and, the blue line, the gas flow. The decrease of the concentration reflects the first part of the breath with low a CO2 concentration, followed by the second part of the breath with an increasing CO2 concentration. Between the breaths (blue line), the gas concentration stays constant in the sample chamber, as indicated by the plateaus (black line). Thus, diffusion of CO2 out of the chamber is slow and negligible. The gas flow was measured by a spirometer (Go-Link)—with home built calibration—indicating the breath cycle and movement of the gas [11]. Combination of the gas flow, the sample chamber size, and the concentration allows determination of the absolute exhaled CO2 amount as a function of time. The concentration of the exhaled CO2 depicted in Figure 1 shows rather constant CO2 concentrations in the later part of exhalation, with relative changes of about 0.6%. These small alterations are on the same order as expected relative to the changes of 13CO2 exhalation after 13C-methacetin administration in the LiMAx test. It has been long known that alveolar gas exchange is dependent on ventilation, pulmonary perfusion, and the blood:air partition coefficient, and that breath samples are not well reproducible [12]. Thus, the 12CO2 and 13CO2 concentrations have to be measured at the same or on a time scale much faster than the breath cycle. In the beginning of exhalation, the CO2 concentration is low since the inhaled air is poorly mixed with gas from the alveolar region. With an increasing fraction of alveolar air, the concentration rises strongly until the contribution by the air in the airways is negligible. Hence, the concentration varies strongly during the complete breath cycle, making high demands on the dynamic range of the measurement device. Moreover, the temperature of the exhaled gas changes with increasing residence time in the lung, and the pressure of the exhaled air also varies during exhalation. In order to balance the inhomogeneity of the concentration, and temperature we used a mixing chamber of an average breath volume of ~0.5 L. The mixing chamber is depicted in Figure 2 and consists of a part with a sympatex membrane reducing the water content in the breath. In the second part, the gas is mixed by several continuations at three different positions along the gas stream, as detailed elsewhere [13]. As presented in Figure 1 (green line), the mixing chamber smooths the CO2 concentration considerably, enabling measurements with a high signal to noise ratio for successive breaths. In the whole setup, the cross section is constant to ensure a laminar gas flow. Furthermore, the setup always has an open gas exit, as depicted in Figure 2, preventing pressure increase in the device.
2.2. Spectral Tuning
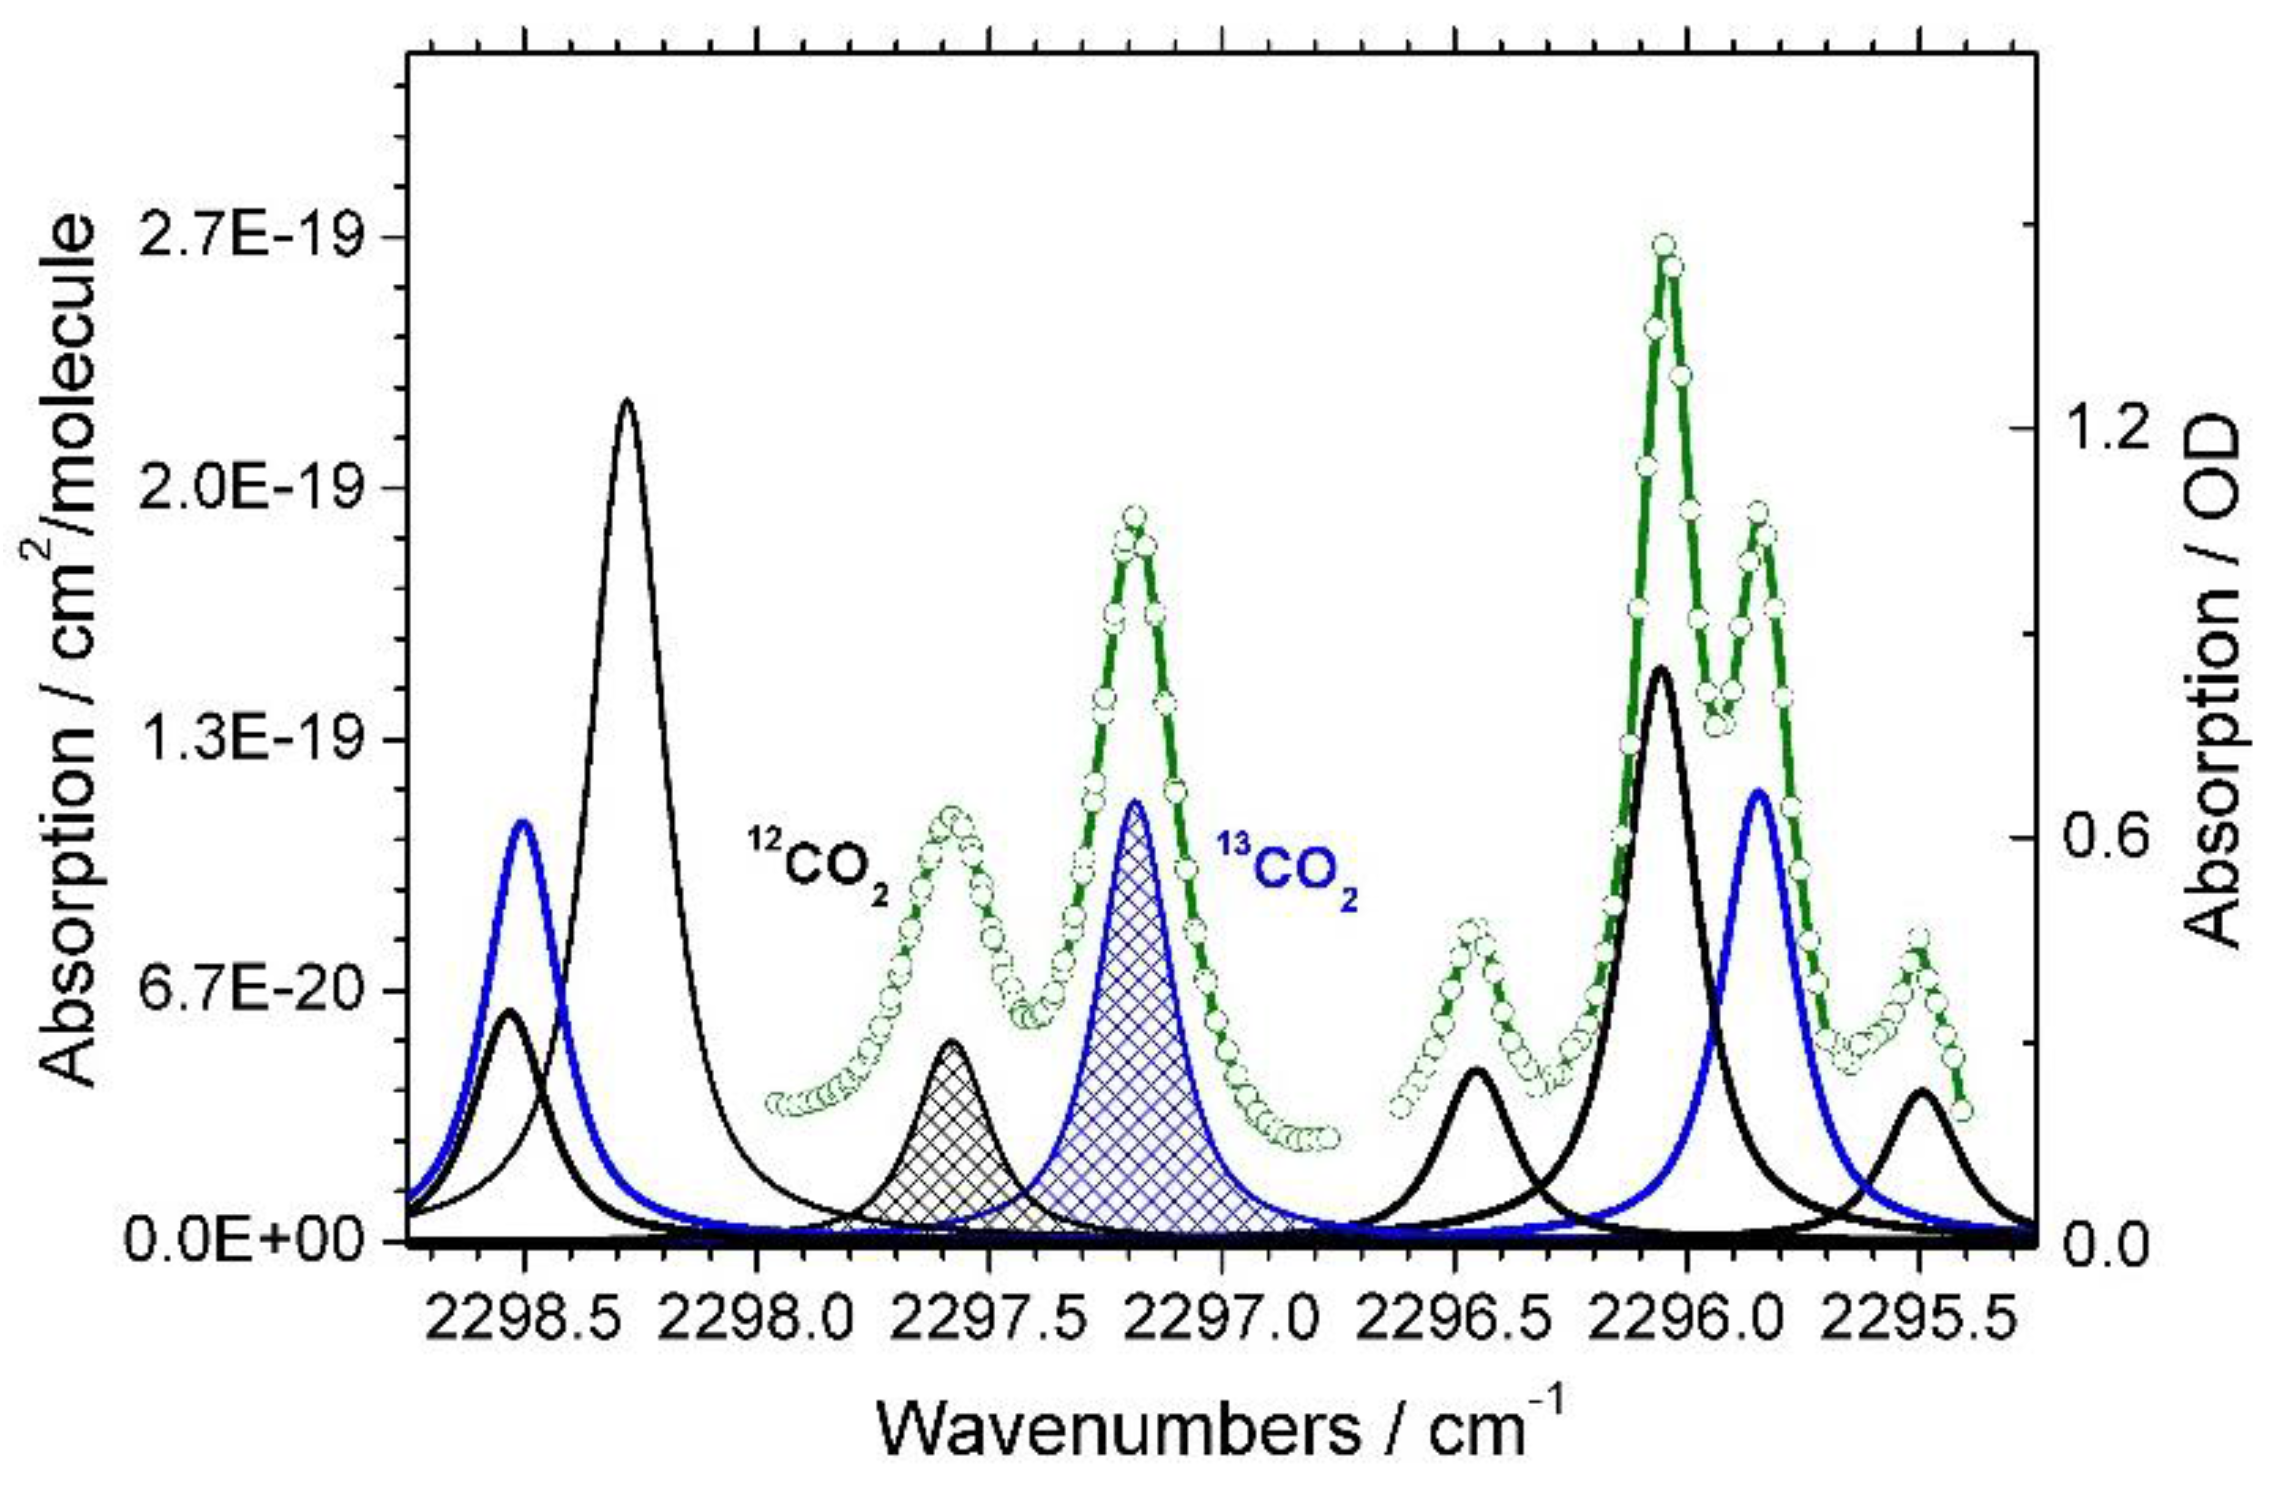
We decided to use infrared (IR) absorption spectroscopy to measure the concentration of 12CO2 and 13CO2 in exhaled air, because this method is very fast and achieves a high sensitivity and resolution. The high sensitivity is essential, because the dosage of methacetin should be as low as possible. As is visible in Figure 3, the high spectral resolution is needed for exact separation of 12CO2 and 13CO2 contributions in the breath without any cross-talk. Comparing the slow exhalation time of a breath on a time scale of seconds with the fast measurement of a spectrum presented in Figure 3 on a time scale of ms, it is evident that the fast method allows for multiple averages on a time scale of almost constant breath concentration. Rotation-vibration transitions of 12CO2 and 13CO2 absorption with a relative high extinction coefficient in the spectral range around 2200 cm−1 to 2400 cm−1 [10].

Figure 3.
Selected spectral window and simulated positions of 12CO2 (black lines) and 13CO2 (blue lines) absorption. Left scale: Absorption in cm2 per molecule as a function of wavenumber. Positions and absorption/extinction coefficients were taken from the HITRAN (High Resolution Transmission) database for a simulated linewidth of 0.19 cm−1 (FWHM) Right scale: Detected absorption in optical density OD (without units) according to Lambert Beer law (green circles and lines, right scale).
A spectral region where absorptions of 12CO2 and 13CO2 in the exhaled breath have the same order of magnitude is depicted in Figure 3. An optimal light source to spectrally resolve the absorption lines in this spectral range is a quantum cascade laser (QCL) [14,15,16]. Our pulsed QCL from Alpes Lasers with a driver unit from neoplas control GmbH is tunable in a spectral window of about 2 cm−1 width within 10 ms by a voltage ramp (sweep) and a laser repetition rate of 100 kHz. Another 10 ms was used to let the QCL temperature equilibrate. Thus, we collect spectra with 50 Hz. Our home built electronics enables us to detect up to 1000 spectral positions per sweep. The exact frequency positions are calibrated by the known absorption frequencies, and the linearity by measurements with a Ge etalon (MG optical solutions GmbH). The spectral position of the QCL is adjusted by a temperature controller to 2298 cm−1 (neoplas control GmbH).
2.3. Spectral Readjustment
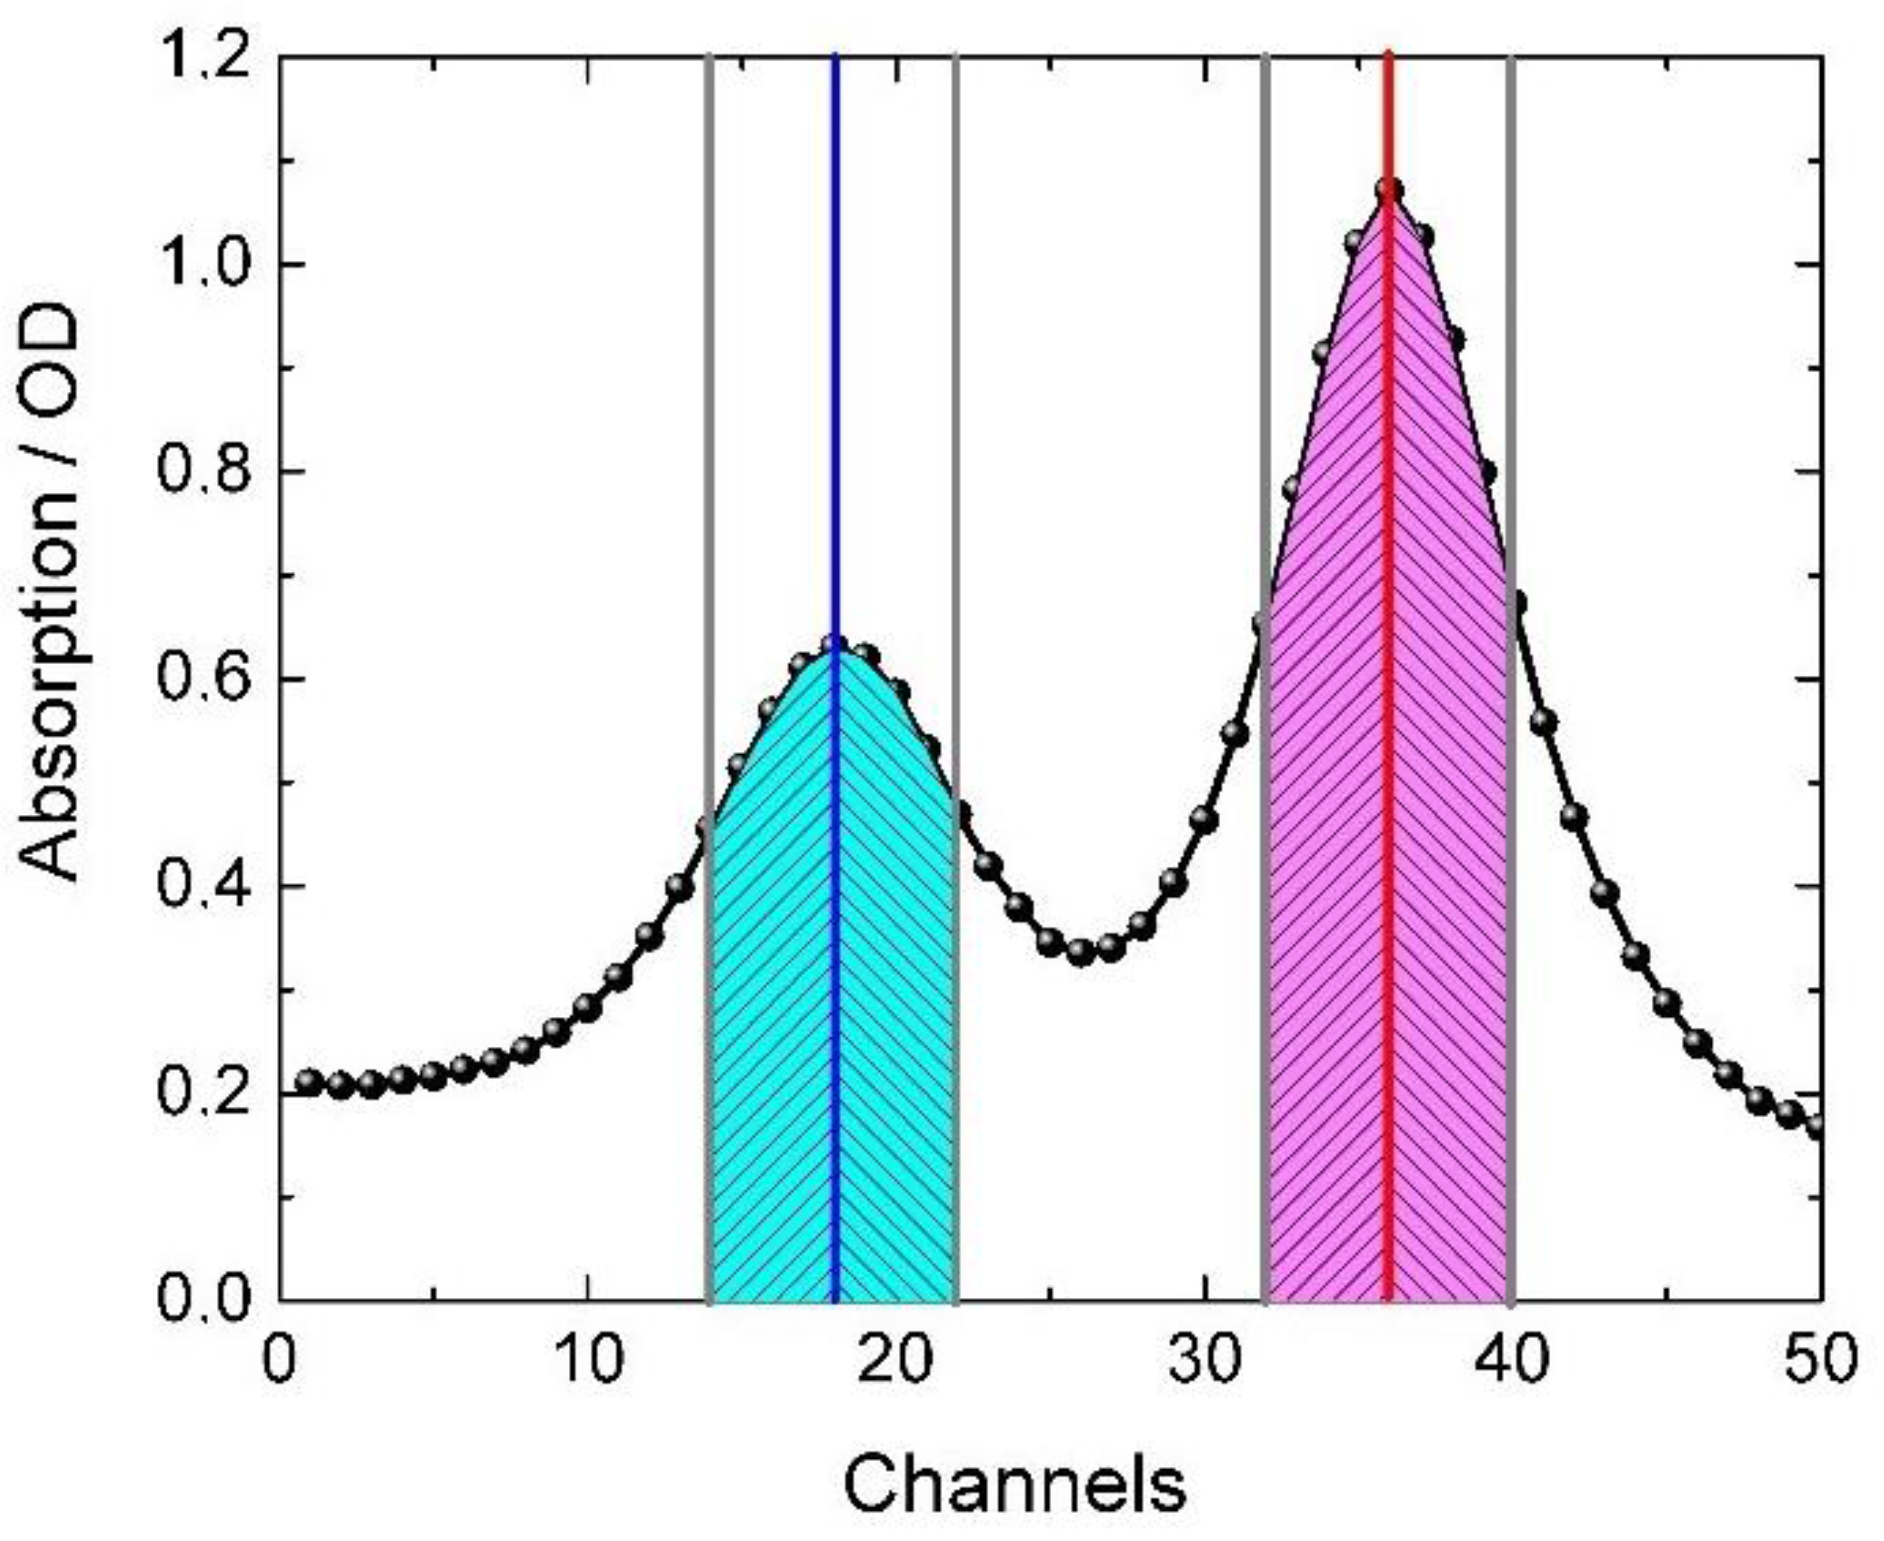
With this setup we are able to perform repetitive measurements of absorption spectra as depicted in Figure 3. Nevertheless, the temperature controller showed some small fluctuations resulting in clearly visible spectral shifts in the absorption spectrum. Therefore, we use the positions of the absorption peaks to readjust the temperature controller by an automatic feedback loop. A robust method to identify spectral shifts is presented in Figure 4. Symmetric to the maximum of each absorption peak, we integrated areas on the high energy (left) and low energy (right) side of the peak. A change of the ratio of both areas were used as an indication of a spectral peak shift. The spectral shift is corrected by readjustment of the temperature controller. This procedure results in absorption spectra without detectable spectral shifts, i.e., with spectral shifts smaller than ~0.01 cm−1. This enabled us to average multiple spectra to increase the signal to noise ratio. This procedure was used during measurements of DOB kinetics is shown in Figure 5.

Figure 4.
Absorption spectrum measured by the voltage ramp [17]. The peak positions at channel 18 (blue line) and channel 36 (red line) reflect 12CO2 and 13CO2 absorption lines, respectively. This method can be used without calibration and conversion of channels to wavenumbers. Every datapoint defines a channel. Integrated areas, symmetric to the left and right of the absorption maxima of both peaks are highlighted (crosshatched areas). The ratio of crosshatched areas for each peak are used to identify peak position shifts. Presented absorption lines are crosshatched in Figure 2.
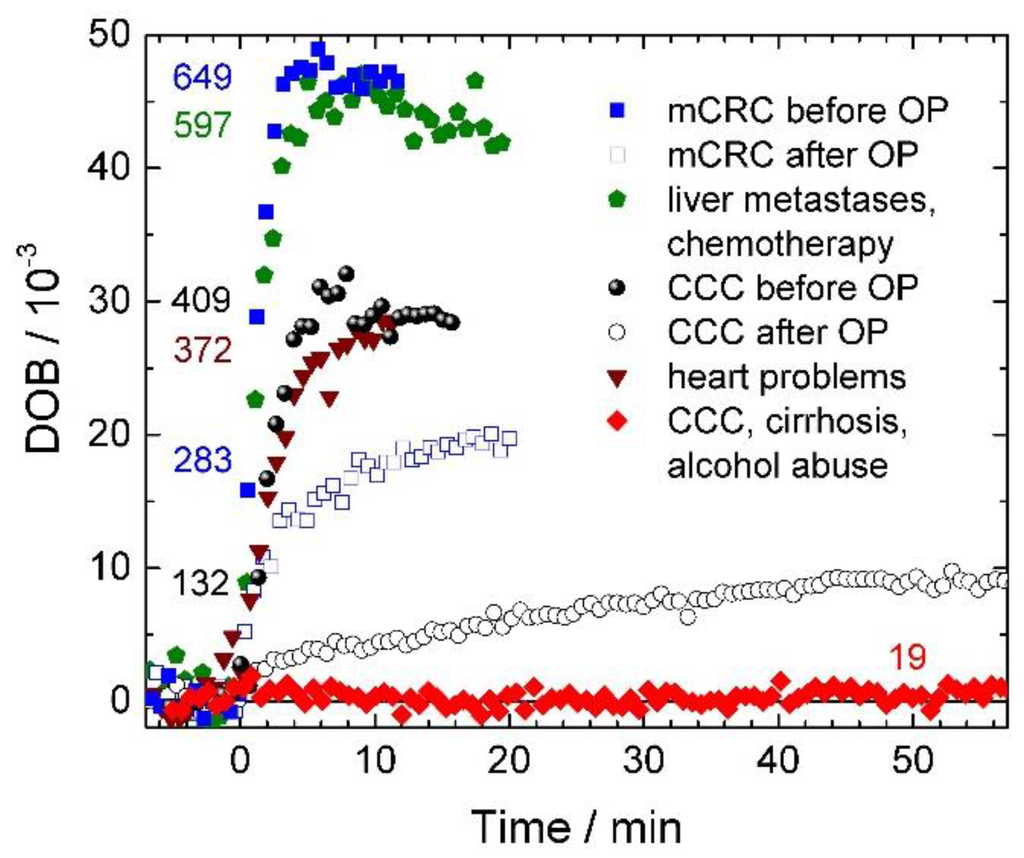
Figure 5.
DOB kinetics of five different patients (blue, green, black, wine, and red) with different liver statuses as a function of time. Administration of 13C-methacetin is at time zero. A patient with mCRC (metastatic colorectal cancer) before and after operation (filled and open blue squares), patient with liver metastases and after chemotherapy (green pentagon), patient with CCC (cholangiocellular carcinoma), before and after operation (filled and open black circles), patient with heart problems (wine triangles), and a patient with CCC, cirrhosis, and alcohol abuse (red diamond). LiMAx values in µg/kg/h for presented DOB kinetics are given as numbers next to the kinetics.
2.4. Setup
The setup is depicted in Figure 2. The exhaled air flows through the mixing chamber (blue box) into the sample chamber (black box) where the concentrations are measured continuously. The gas flow is measured behind the sample chamber with a spirometer (magenta box) before the gas left the setup. We use a special face mask with valves separating inhaled and exhaled air, allowing only exhalation into the setup. Data acquisition is performed at 100 kHz with a laser repetition rate of 100 kHz, and 16 bit resolution (A/D converter). As presented in Figure 2, the laser pulse of several nanoseconds is collimated and split by the entrance window of the sample chamber (W2, orange line) into a probe and reference beam. The reference beam is directed and focused on a MCT (photovoltaic mercury cadmium telluride, from Laser components) detector D2 to measure the intensity signal I2 without breath gas absorption. The probe beam passes through the sample chamber filled with exhaled air. Then the beam is focused on a MCT detector D1 to measure the intensity signal I1. The direct absorption of the exhaled air is calculated from I1 and I2 at every specific wavenumber using Lambert Beers law. We used a pulsed distributed feedback QCL from Alpes Lasers with an average output power of ~1 mW tuned to a spectral position at 2298 cm−1 by temperatures of about 10 °C. By scanning the QCL a whole absorption spectrum is obtained (see Figure 3). Typically, we average up to five absorption spectra before simulating the spectra with a multi Lorentzian-fit. The areas under the Lorentzian fits correspond to the absorption in the sample and are used to calculate the ratio of 13CO2 and 12CO2 absorption. Typical errors for the areas of the fit are about 1%. The obtained ratio is corrected for temperature dependencies and specific properties of the measured rotation-vibrational transition [18,19]. The temperature is measured with a Pt100 sensor.
This setup allows for continuous measurement of 12CO2 and 13CO2 absorption spectra during respiration with online presentation of the DOB kinetics at bedside.
2.5. Operation Planning
The volumetric data before surgery is determined by CT volumetry in a four-phase contrast enhanced examination technique (LightSpeed 64®; GE Medical Systems, Milwaukee, IL, USA). The volumetric measurement was performed using AMIRA software (Mercury Computer Systems, Chelmsford, MA, USA) that had been validated in a prior experimental study [20]. The present study does not represent a single clinical trial. The LiMAx test had been evaluated in several clinical trials at the Charité in Berlin, which had all obtained approval of the ethics review board of the Charité medical faculty before the first patient was included. All participants gave written informed consent prior to study inclusion. In addition to the clinical trials, the test was applied in clinical routine, too. All patients gave written informed consent to perform the LiMAx test. The clinical data and DOB kinetics presented in the present manuscript were derived from a database containing all LiMAx measurements performed at the Charité. The DOB kinetics were measured with the described certificated FLIP device (Humedics GmbH, Berlin, Germany). A number of clinical trails have been published [4,21,22,23,24,25,26,27,28].
3. Results
3.1. DOB Kinetics
In Figure 5, DOB kinetics of patients with differing medical conditions are displayed. The individual data points of the DOB kinetics represent the 13CO2 increase in the complete breath with respect to the baseline taken before 13C-methacetin administration. The measured average increase of 13CO2 in the exhaled breath within a time window of ~40 s is displayed by a single data point. The DOB kinetics display distinct shapes with a rise after time zero, when 13C-methacetin is administered, a maximal value ranging from 1 DOB to about 50 DOB, followed by a signal decrease. The LiMAx value evaluates from the maximum of the DOB kinetics and is presented as a color coded number in µg/kg/h next to the DOB kinetics in Figure 5. Since the signal decrease after reaching the DOB maximum is not relevant for the LiMAx value, the measurements are stopped after determination of the maximum. This procedure enables short measurement times as short as about 10 min after 13C-methacetin administration (blue filled squares, and wine triangles in Figure 5). The presented rise times are in the range of 1 min–2 min for LiMAx values above 310 µg/kg/h. LiMAx values of 311 µg/kg/h and higher were assigned to normal liver capacities [4,23,29]. Fast rise times can only be observed with a high data density. We displayed data points every ~40 s to maintain high data density and make the interpretation of the kinetics easier. In Figure 5 two pairs of DOB kinetics are plotted for patients before and after liver surgery. The blue curves represent the DOB kinetics of a patient with metastatic colorectal cancer. Before operation the LiMAx value was determined to 649 µg/kg/h with a fast rise of the kinetic and a maximum of about 48 DOB as displayed in Figure 5 (blue filled squares). After liver resection the DOB kinetic exhibits a lower maximum of 20 DOB reached at ~20 min after 13C-methacetin administration. Nevertheless, the LiMAx value of 283 µg/kg/h was close to the normal liver capacity. The black curves represent the DOB kinetics of another patient with cholangiocellular carcinoma before (solid black circles) and after liver resection (open black circles). The LiMAx value dropped upon liver resection from 409 µg/kg/h to 132 µg/kg/h, directly visible by the maximum decrease from 28 DOB to 9 DOB, respectively. The rise of the DOB kinetics after liver resection (open black circles) are slowed down about five-fold, reflecting the smaller liver capacity of the reduced liver volume. The liver resections are often the exclusive curative treatment. The liver can recover completely after operation, if the remaining metabolic liver function remains above a certain threshold [21,30]. Three additional DOB kinetics are plotted in Figure 5. The green curve reflects the DOB kinetic of a patient with liver metastases after chemotherapy. Despite the toxic chemotherapy the liver capacity of this patient is in good condition again with a LiMAx value of 597 µg/kg/h. This measurement is an example for the usefulness of the LiMAx test in chemotherapy, providing information on the stressed liver.
Moreover, the LiMAx test can be used for risk assessment, for example before heart operations (wine curve in Figure 5). The LiMAx value can indicate if the liver can afford the additional stress of the operation. Here, the LiMAx value shows a normal liver status with no additional risk for the operation. The red curve displays the DOB kinetic of a patient with cholangiocellular carcinoma, cirrhosis, and alcohol abuse. The DOB kinetic shows no visible rise, a maximum of 1 DOB, and a LiMAx value of 19 µg/kg/h. This curve clearly reflects liver failure.
3.2. Operation Planning
The DOB kinetics provide extremely useful information on the liver status, and the LiMAx value can be used to assess the liver capacity of a patient at bedside. As presented in Figure 5, the DOB and LiMAx values provide direct access to the liver status before and after operation. This capability is used to plan liver operations with a reduced mortality risk [31]. A typical procedure is sketched in the following. The 3D structure of the liver is taken by CT volumetry as shown in Figure 6. Areas with liver tumors and metastases can be identified for resection. Here, the green volume of the liver is to be resected, while the yellow part, liver segment 2 and 3, should remain. The measured LiMAx value before operation is 639 µg/kg/h with a liver volume of 2.124 liters. The yellow volume has 31% of the total. The predicted LiMAx value after surgery is approximately 31% of 639 µg/kg/h. This value of 198 µg/kg/h is below the normal liver capacity, but in a range in which the recovery of the liver is expected without complications [21,30,32,33,34,35,36]. Thus, it is possible to predict this operation is safe.
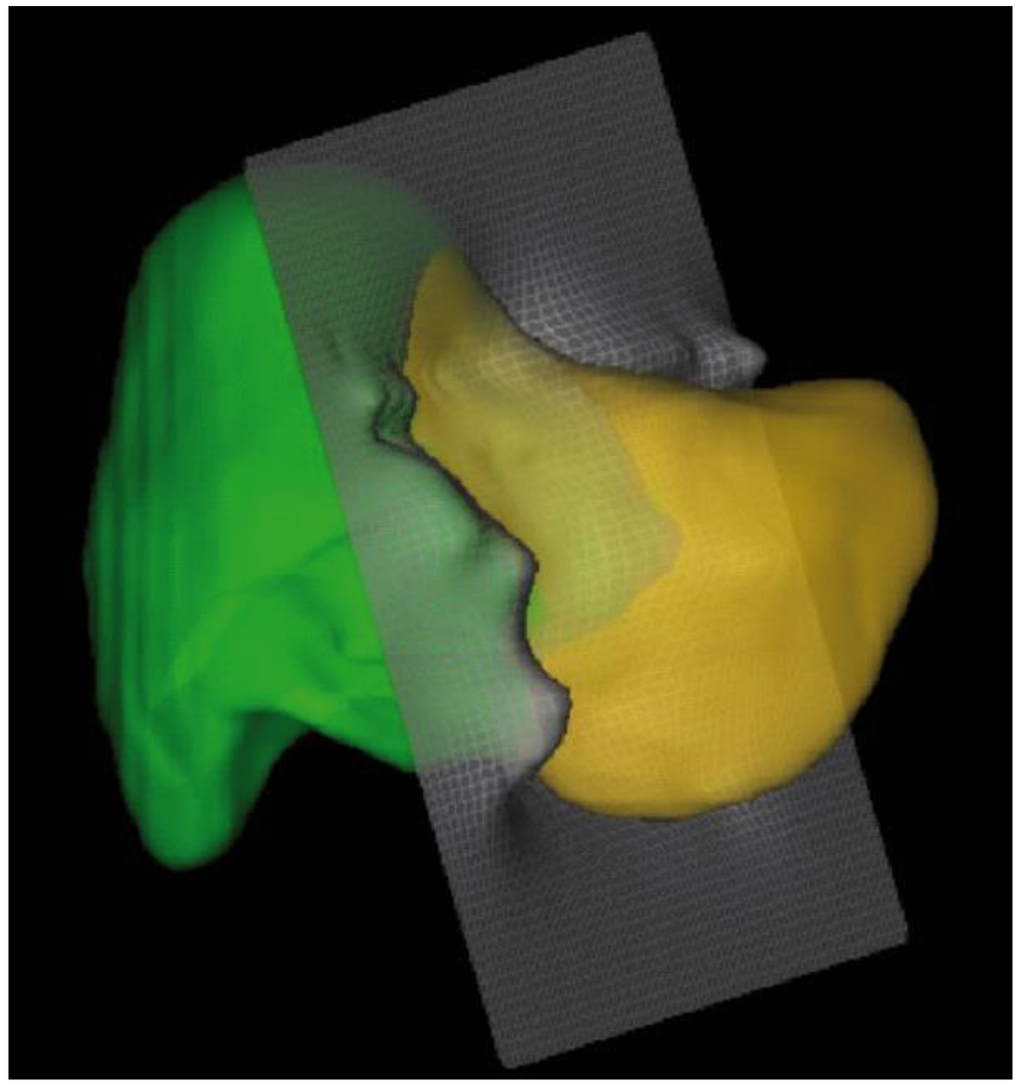
Figure 6.
3D picture of the liver before surgery measured by CT volumetry. LiMAx value before surgery was 639 µg/kg/h. Liver segment 2 and 3 (yellow) are identified to remain after surgery with a calculated remnant volume of 31%.
4. Discussion and Conclusions
High precision detection of 13CO2 and 12CO2 in exhaled breath was reported before [10,37]. Here, we present an improved setup based on time resolved infrared absorption spectroscopy to measure an increase of the 13CO2 concentration in the breath of humans [10]. A quantum cascade laser is used to continuously acquire absorption spectra of 12CO2 and 13CO2 during respiration. We stabilize the frequency position of the QCL by an automatic feedback loop. We use the complete breath of the patients and a mixing chamber to circumvent difficult breath separation procedures. Our fast detection scheme allows for averaging, and attains a high sensitivity in the clinical routine at the bedside. The very high data density follows the true increase of the DOB kinetics, that is, 13CO2 generation and release. The additionally generated and exhaled 13CO2 can be considered to come solely from 13C-methacetin metabolization in the liver cells. Thus, the fast increase of the DOB kinetics directly reflects the liver metabolization of 13C-methacetin by cytochrome P450 1A2. The precise detection of the DOB kinetics by the described FLIP device allows for accurate determination of the personalized LiMAx value. The LiMAx value is successfully used in clinical routine to reduce the mortality rate upon liver resections by more than 70% [8,9]. A variety of other application areas have been reported [26,29,38,39,40]. The combination of the LiMAx test with the QCL-based FLIP device presented here will revolutionize liver therapy and medical fields in which the liver plays a vital role.
Acknowledgments
We thank the Bundesministerium für Wirtschaft und Energie (Exist-Gründerstipendium 2008/0066-V and 2008/0066) for financial support.
Author Contributions
T.R. developed the prototype, programming, performed the fundamental experiments, and identified further challenges of the method. T.v.H. improved the programming, data fitting, and developed the electronics and data acquisition. A.H. assembled the next generation FLIP and performed calibration of the setup. J.L. performed the experiments with FLIP devices in the hospital at bedside, and contributed to the usability of the FLIP. M.S. invented the LiMAx test, worked out application areas of the LiMAx test and contributed significantly to specifications and usability of the FLIP. K.H. designed, planned, developed and optimized the FLIP in all stages. He analyzed data and optimized the analysis procedure and the complete device. K.H. wrote the paper.
Conflicts of Interest
The authors M.S. and K.H. are shareholders of Humedics GmbH. Humedics GmbH market the FLIP devices and the LiMAx test. A.H. is employed at Humedics GmbH. The authors declare that Humedics GmbH had no role in the design of the study; in the collection, analyses, or interpretation of data; in the writing of the manuscript, and in the decision to publish the results.
Abbreviations
The following abbreviations are used in this manuscript:
| DOB | Delta over baseline |
| LiMAx | Liver maximal capacity |
| QCL | Quantum cascade laser |
| MCT | Mercury Cadmium Telluride |
References
- Beauchamp, J. Inhaled today, not gone tomorrow: Pharmacokinetics and environmental exposure of volatiles in exhaled breath. J. Breath Res. 2011, 5, 037103. [Google Scholar] [CrossRef] [PubMed]
- Gisbert, J.P.; Pajares, J.M. Review article: 13C-urea breath test in the diagnosis of helicobacter pylori infection—A critical review. Aliment. Pharmacol. Ther. 2004, 20, 1001–1017. [Google Scholar] [CrossRef] [PubMed]
- Haisch, M.; Hering, P.; Fuss, W.; Fabinski, W. A sensitive isotope selective nondispersive infrared spectrometer for 13CO2 and 12CO2 concentration measurements in breath samples. Isot. Isot. Environ. Health Stud. 1994, 30, 247–251. [Google Scholar] [CrossRef]
- Stockmann, M.; Lock, J.F.; Riecke, B.; Heyne, K.; Martus, P.; Fricke, M.; Lehmann, S.; Niehues, S.M.; Schwabe, M.; Lemke, A.J.; et al. Prediction of postoperative outcome after hepatectomy with a new bedside test for maximal liver function capacity. Ann. Surg. 2009, 250, 119–125. [Google Scholar] [CrossRef] [PubMed]
- Schoeller, D.A.; Luke, A.H. Rapid 18O analysis of CO2 samples by continuous-flow isotope ratio mass spectrometry. J. Mass Spectrom. 1997, 32, 1332–1336. [Google Scholar] [CrossRef]
- Braden, B.; Haisch, M.; Duan, L.; Lembcke, B.; Caspary, W.; Hering, P. Clinically feasible stable isotope technique at a reasonable price: Analysis of 13CO2/12CO2-abundance in breath samples with a new isotope selective-nondispersive infrared spectrometer. Z. Gastroenterol. 1994, 32, 675–678. [Google Scholar] [PubMed]
- Haycock, G.B.; Schwartz, G.J.; Wisotsky, D.H. Geometric method for measuring body surface area: A height-weight formula validated in infants, children, and adults. J. Pediatr. 1978, 93, 62–66. [Google Scholar] [CrossRef]
- Stockmann, M.; Lock, J.F.; Malinowski, M.; Niehues, S.M.; Seehofer, D.; Neuhaus, P. The limax test: A new liver function test for predicting postoperative outcome in liver surgery. HPB 2010, 12, 139–146. [Google Scholar] [CrossRef] [PubMed]
- Jara, M.; Reese, T.; Malinowski, M.; Valle, E.; Seehofer, D.; Puhl, G.; Neuhaus, P.; Pratschke, J.; Stockmann, M. Reductions in post-hepatectomy liver failure and related mortality after implementation of the limax algorithm in preoperative work-up: A single centre analysis of 1170 hepatectomies of one or more segments. HPB 2015, 17, 651–658. [Google Scholar] [CrossRef] [PubMed]
- Rubin, T.; von Haimberger, T.; Helmke, A.; Heyne, K. Quantitative determination of metabolization dynamics by a real-time 13CO2 breath test. J. Breath Res. 2011, 5, 027102. [Google Scholar] [CrossRef] [PubMed]
- Rubin, T. Konzeption und Entwicklung eines Infrarot-Spektrometers zur Bestimmung der Konzentration von 13CO2 und 12CO2 im Gasfluss. Available online: http://edocs.fu-berlin.de/docs/receive/FUDOCS_document_000000024491 (accessed on 13 May 2016).
- Lourenco, C.; Turner, C. Breath analysis in disease diagnosis: Methodological considerations and applications. Metabolites 2014, 4, 465–498. [Google Scholar] [CrossRef] [PubMed]
- Rubin, T.; Heyne, K. Apparatus for Infrared Absorption Spectroscopy with Pre-Chamber for Homogenising A Test Gas. De. Patent EP 2626128 A1 20130814, 2009. [Google Scholar]
- Nelson, D.D.; McManus, B.; Urbanski, S.; Herndon, S.; Zahniser, M.S. High precision measurements of atmospheric nitrous oxide and methane using thermoelectrically cooled mid-infrared quantum cascade lasers and detectors. Spectrochim. Acta A Mol. Biomol. Spectrosc. 2004, 60, 3325–3335. [Google Scholar] [CrossRef] [PubMed]
- McManus, J.B.; Zahniser, M.S.; Nelson, D.D.; Williams, L.R.; Kolb, C.E. Infrared laser spectrometer with balanced absorption for measurement of isotopic ratios of carbon gases. Spectrochim. Acta A Mol. Biomol. Spectrosc. 2002, 58, 2465–2479. [Google Scholar] [CrossRef]
- Wysocki, G.; McCurdy, M.; So, S.; Weidmann, D.; Roller, C.; Curl, R.F.; Tittel, F.K. Pulsed quantum-cascade laser-based sensor for trace-gas detection of carbonyl sulfide. Appl. Opt. 2004, 43, 6040–6046. [Google Scholar] [CrossRef] [PubMed]
- Nelson, D.; Shorter, J.; McManus, J.; Zahniser, M. Sub-part-per-billion detection of nitric oxide in air using a thermoelectrically cooled mid-infrared quantum cascade laser spectrometer. Appl. Phys. B 2002, 75, 343–350. [Google Scholar] [CrossRef]
- Rothman, L.S.; Gordon, I.E.; Barbe, A.; Benner, D.C.; Bernath, P.F.; Birk, M.; Boudon, V.; Brown, L.R.; Campargue, A.; Champion, J.-P. The hitran 2008 molecular spectroscopic database. J. Quant. Spectrosc. Radiat. Transf. 2009, 110, 533–572. [Google Scholar] [CrossRef]
- Herzberg, G. Infrared and Raman Spectra of Polyatomic Molecules; D. Van Nostrand Company: New York, NY, USA, 1945. [Google Scholar]
- Niehues, S.M.; Unger, J.K.; Malinowski, M.; Neymeyer, J.; Hamm, B.; Stockmann, M. Liver volume measurement: Reason of the difference between in vivo ct-volumetry and intraoperative ex vivo determination and how to cope it. Eur J. Med. Res. 2010, 15, 345–350. [Google Scholar] [CrossRef] [PubMed]
- Lock, J.F.; Schwabauer, E.; Martus, P.; Videv, N.; Pratschke, J.; Malinowski, M.; Neuhaus, P.; Stockmann, M. Early diagnosis of primary nonfunction and indication for reoperation after liver transplantation. Liver Transplant. 2010, 16, 172–180. [Google Scholar] [CrossRef] [PubMed]
- Kaffarnik, M.F.; Lock, J.F.; Vetter, H.; Ahmadi, N.; Lojewski, C.; Malinowski, M.; Neuhaus, P.; Stockmann, M. Early diagnosis of sepsis-related hepatic dysfunction and its prognostic impact on survival: A prospective study with the limax test. Crit. Care 2013, 17, R259. [Google Scholar] [CrossRef] [PubMed]
- Lock, J.F.; Kotobi, A.N.; Malinowski, M.; Schulz, A.; Jara, M.; Neuhaus, P.; Stockmann, M. Predicting the prognosis in acute liver failure: Results from a retrospective pilot study using the limax test. Ann. Hepatol. 2013, 12, 556–562. [Google Scholar] [PubMed]
- Brinkhaus, G.; Lock, J.F.; Malinowski, M.; Denecke, T.; Neuhaus, P.; Hamm, B.; Gebauer, B.; Stockmann, M. Ct-guided high-dose-rate brachytherapy of liver tumours does not impair hepatic function and shows high overall safety and favourable survival rates. Ann. Surg. Oncol. 2014, 21, 4284–4292. [Google Scholar] [CrossRef] [PubMed]
- Hoppe, S.; von Loeffelholz, C.; Lock, J.F.; Doecke, S.; Sinn, B.V.; Rieger, A.; Malinowski, M.; Pfeiffer, A.F.; Neuhaus, P.; Stockmann, M. Nonalcoholic steatohepatits and liver steatosis modify partial hepatectomy recovery. J. Investig. Surg. 2015, 28, 24–31. [Google Scholar] [CrossRef] [PubMed]
- Jara, M.; Malinowski, M.; Lüttgert, K.; Schott, E.; Neuhaus, P.; Stockmann, M. Prognostic value of enzymatic liver function for the estimation of short-term survival of liver transplant candidates: A prospective study with the limax test. Transplant Int. 2015, 28, 52–58. [Google Scholar] [CrossRef] [PubMed]
- Malinowski, M.; Stary, V.; Lock, J.F.; Schulz, A.; Jara, M.; Seehofer, D.; Gebauer, B.; Denecke, T.; Geisel, D.; Neuhaus, P.; et al. Factors influencing hypertrophy of the left lateral liver lobe after portal vein embolization. Langenbecks Arch. Surg. 2015, 400, 237–246. [Google Scholar] [CrossRef] [PubMed]
- Jara, M.; Bednarsch, J.; Malinowski, M.; Pratschke, J.; Stockmann, M. Effects of oxaliplatin-based chemotherapy on liver function-an analysis of impact and functional recovery using the limax test. Langenbecks Arch. Surg. 2016, 401, 33–41. [Google Scholar] [CrossRef] [PubMed]
- Jara, M.; Bednarsch, J.; Valle, E.; Lock, J.F.; Malinowski, M.; Schulz, A.; Seehofer, D.; Jung, T.; Stockmann, M. Reliable assessment of liver function using limax. J. Surg. Res. 2015, 193, 184–189. [Google Scholar] [CrossRef] [PubMed]
- Stockmann, M.; Lock, J.F.; Malinowski, M.; Seehofer, D.; Puhl, G.; Pratschke, J.; Neuhaus, P. How to define initial poor graft function after liver transplantation?—A new functional definition by the limax test. Transpl. Int. 2010, 23, 1023–1032. [Google Scholar] [CrossRef] [PubMed]
- Kaffarnik, M.F.; Lock, J.F.; Seehofer, D.; Stockmann, M.; Neuhaus, P. Leberresektionen—Was ist perioperativ zu beachten? Viszeralmedizin 2011, 27, 65–73. [Google Scholar] [CrossRef]
- Fan, S.-T.; Lo, C.-M.; Liu, C.-L.; Yong, B.-H.; Chan, J.K.-F.; Ng, I.O.-L. Safety of donors in live donor liver transplantation using right lobe grafts. Arch. Surg. 2000, 135, 336–340. [Google Scholar] [CrossRef] [PubMed]
- Ferrero, A.; Viganò, L.; Polastri, R.; Muratore, A.; Eminefendic, H.; Regge, D.; Capussotti, L. Postoperative liver dysfunction and future remnant liver: Where is the limit? World J. Surg. 2007, 31, 1643–1651. [Google Scholar] [CrossRef] [PubMed]
- Guglielmi, A.; Ruzzenente, A.; Conci, S.; Valdegamberi, A.; Iacono, C. How much remnant is enough in liver resection? Dig. Surg. 2012, 29, 6–17. [Google Scholar] [CrossRef] [PubMed]
- Truant, S.; Oberlin, O.; Sergent, G.; Lebuffe, G.; Gambiez, L.; Ernst, O.; Pruvot, F.-R. Remnant liver volume to body weight ratio ≥0.5%: A new cut-off to estimate postoperative risks after extended resection in noncirrhotic liver. J. Am. Coll. Surg. 2007, 204, 22–33. [Google Scholar] [CrossRef] [PubMed]
- Van Den Broek, M.A.; Olde Damink, S.W.; Dejong, C.H.; Lang, H.; Malagó, M.; Jalan, R.; Saner, F.H. Liver failure after partial hepatic resection: Definition, pathophysiology, risk factors and treatment. Liver Int. 2008, 28, 767–780. [Google Scholar] [CrossRef] [PubMed]
- Kasyutich, V.L.; Martin, P.A. (CO2)-C-13/(CO2)-C-12 isotopic ratio measurements with a continuous-wave quantum cascade laser in exhaled breath. Infrared Phys. Technol. 2012, 55, 60–66. [Google Scholar] [CrossRef]
- Lock, J.F.; Malinowski, M.; Seehofer, D.; Hoppe, S.; Röhl, R.I.; Niehues, S.M.; Neuhaus, P.; Stockmann, M. Function and volume recovery after partial hepatectomy: Influence of preoperative liver function, residual liver volume, and obesity. Langenbecks Arch. Surg. 2012, 397, 1297–1304. [Google Scholar] [CrossRef] [PubMed]
- Malinowski, M.; Jara, M.; Lüttgert, K.; Orr, J.; Lock, J.F.; Schott, E.; Stockmann, M. Enzymatic liver function capacity correlates with disease severity of patients with liver cirrhosis: A study with the limax test. Dig. Dis. Sci. 2014, 59, 2983–2991. [Google Scholar] [CrossRef] [PubMed]
- Alizai, P.H.; Wendl, J.; Roeth, A.A.; Klink, C.D.; Luedde, T.; Steinhoff, I.; Neumann, U.P.; Schmeding, M.; Ulmer, F. Functional liver recovery after bariatric surgery—A prospective cohort study with the limax test. Obes. Surg. 2015, 25, 2047–2053. [Google Scholar] [CrossRef] [PubMed]


© 2016 by the authors; licensee MDPI, Basel, Switzerland. This article is an open access article distributed under the terms and conditions of the Creative Commons Attribution (CC-BY) license (http://creativecommons.org/licenses/by/4.0/).