1. Introduction
Quantum cascade lasers (QCL) provide direct generation of mid-infrared radiation for several airborne applications. Especially high-power QCL could replace diode-pumped solid state lasers coupled to optical parametrical generators/oscillators (OPG/OPO) in directed infrared countermeasure (DIRCM) systems because they show reduced complexity with much fewer parts to be assembled, exhibit smaller mass and volume, and may be less expensive in investment and installation costs.
Changing an established and qualified laser technology in airborne systems requires a significant improvement in wallplug efficiency in order to reduce the required prime power from the platform. It is expected that maximizing the wallplug efficiency also leads to increased optical output power without impacting the beam quality. At the system level, wallplug efficiency of a laser is primarily determined by the efficiency of the power supply module which converts and filters the platform input power, and by the heat removal subsystem. Moving from optically-pumped solid state/OPO laser systems to electrically-pumped QCL is one way to reduce the heat load. Another important factor is the improvement of the electro-optical efficiency, especially to bring the operating point of maximal electro-optical efficiency as close as possible to the point of maximal optical output power.
An essential element in the assessment of the electro-optical performance of lasers in different applications is modeling using a system physics approach [
1]. System physics uses conservation laws complemented with constitutive equations relating observable fluxes (currents) to driving forces (potential differences) representing physical processes. An early application of system physics is the engineering of heat engines. Central to the modeling of these engines are the energy conservation law and the related efficiencies of the conversion processes between different forms of energy. The laser, considered as a light engine, fits very well into this framework. From the point of view of a system-level assessment of QCL, modeling based on solving the Schrödinger equation, to use a density matrix formalism, employing non-equilibrium Green’s function formalism, or Monte Carlo simulations, to name a few examples [
2,
3,
4], are not very helpful because they require complex calculations and detailed knowledge of the values of quantum level parameters which are not readily available.
Recently, models describing the performance of QCL using efficiencies [
5,
6,
7,
8], an approach well known from solid state laser engineering [
9], have been proposed. They deal with QCL in the vicinity of the lasing threshold, taking into account the escape of electrons from the upper laser level and thermal backfilling of the lower laser level from the injector. In directed infrared countermeasures applications we operate the QCL at high optical power levels and, consequently, high pump currents. Stark detuning of the energy levels, the subsequent decrease in the oscillator strength of the laser transition, and the reduction of the injection efficiency from the injector into the upper laser level cannot be neglected in devices operating near the maximum current the structure can sustain.
This paper deals with the modeling of the optical output power vs. pump current of high-power mid-infrared QCL taking thermal backfilling, hot electrons, and Stark detuning into account. The purpose of the modeling is the assessment of the electro-optical performance in different modes of operation of the laser device, the formulation of consistent component requirements and specifications, and the preparation of guidelines for the design and manufacture of the QCL structures to meet the specified performance goals.
The subject matter of the paper is outlined as follows: The first two sections introduce the electro-optical energy conversion processes, the electro-optical performance model, its descriptors and observables. Then, the model is compared to experimental data. The conclusion highlights the applicability of the model to represent the performance of mid-infrared QCL on a system level.
2. Electro-Optical Energy Conversion in MIR Quantum Cascade Lasers
The quantum cascade laser is a semiconductor laser employing a unipolar (electron) current to convert electricity into optical energy. The electro-optical architecture of a QCL can be described as a cascade of gain stages which convert electrical energy into coherent optical energy (work) and heat when pumped above the laser threshold.
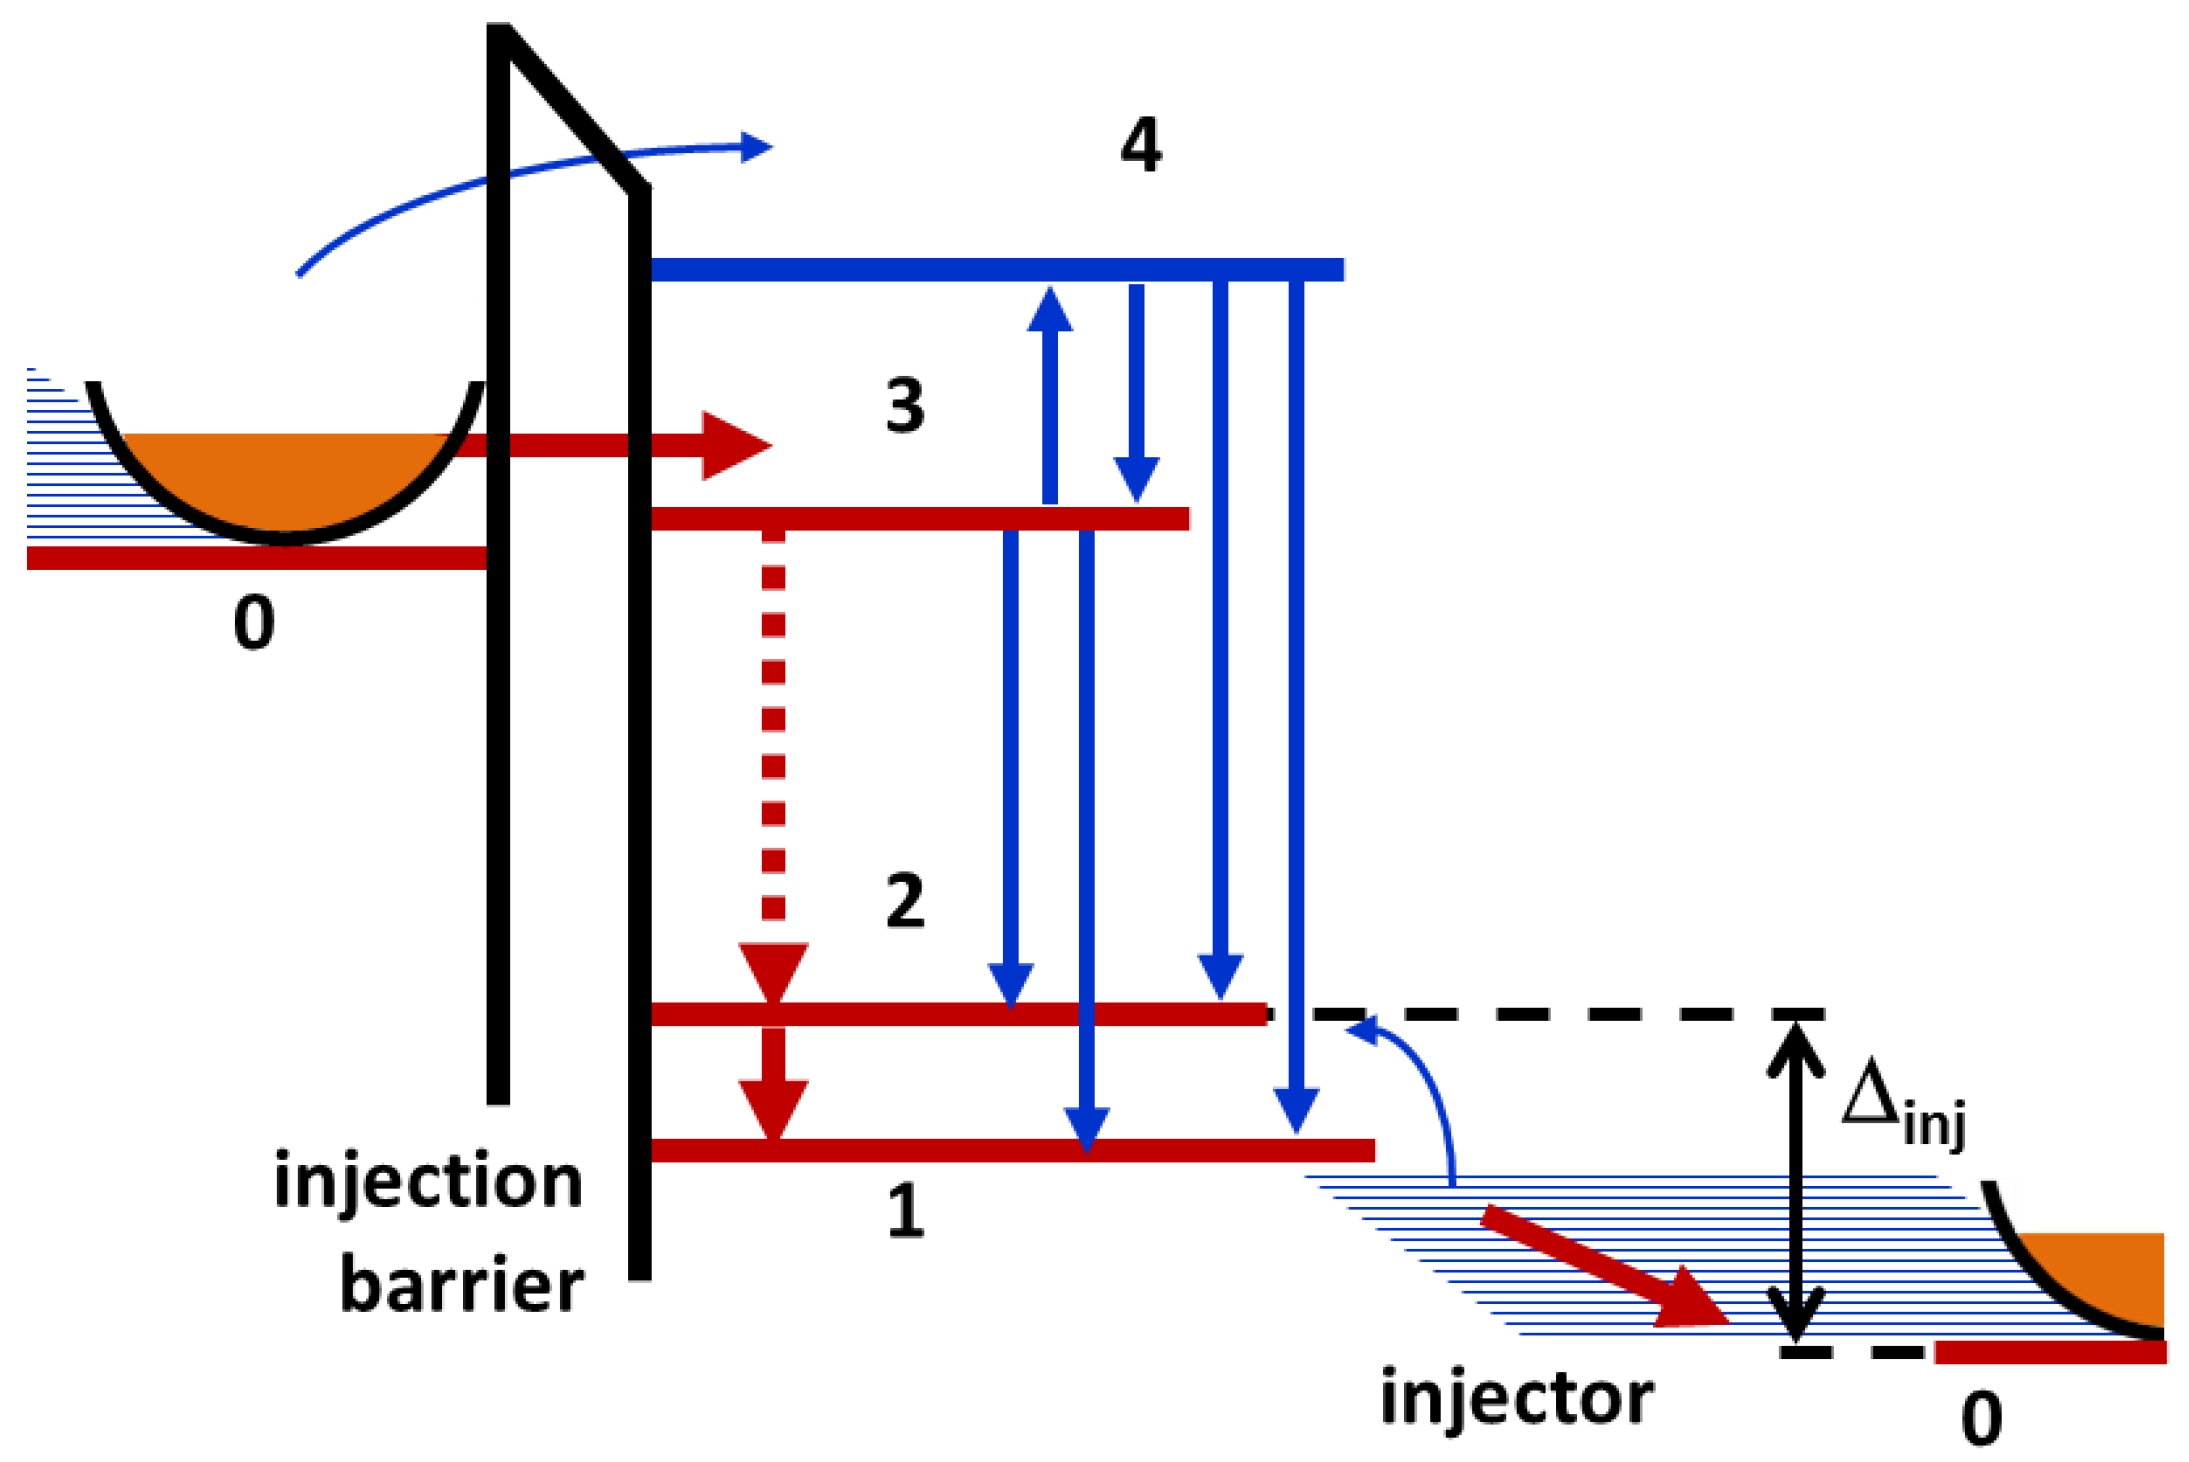
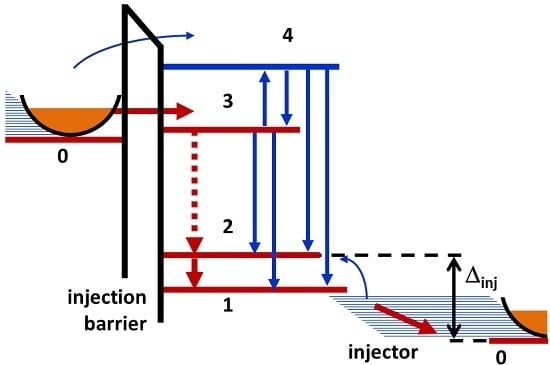
Figure 1 depicts a sketch of a simplified energy level diagram of a single stage of the quantum cascade. The electron flow leading to the electro-optical energy conversion is drawn in red. The blue arrows represent non-radiative transitions of the electrons. The cascade is embedded in a waveguide, which defines the optical modes and also serves as resonator. The physical principles underlying the conversion process are similar to the quasi three-level laser scheme well known in solid state laser physics. In this scheme, the ground state of the QCL (level 0) is the lowest state in a manifold of sublevels (comprising level 1 and the injector) which are coupled among each other and to the lower laser state (level 2). Consequently, the lower laser state is always populated with electrons and the laser behaves in a way which is intermediate between a three-level (levels 0, 2, and 3) and a four-level (levels 0, 1, 2, and 3) laser. This backfilling of electrons is controlled by the energy difference ∆
inj between the lower laser state (level 2) and the ground state (level 0). In addition, there is an excited state manifold (indicated as level 4 in
Figure 1) into which electrons from the upper laser state (level 3) can escape and bypass the laser transition.
Above the lasing threshold, the difference in electron population between the upper and the lower laser state is clamped at its threshold value. Please note, that the population inversion between the laser states is constant during operation but not the electron density in the upper laser state, as in bipolar semiconductor lasers.
The energy structure of a QCL is designed with a constant average voltage
applied across the cascade. At this so-called flat-band voltage the ground state of the injector of one gain stage is energetically-aligned (in resonance) with the upper laser level of the succeeding stage. Its value can be easily estimated from
Figure 1:
In the formula is the number of gain stages (periods) and is the angular laser frequency defined by the energy spacing between the upper and the lower laser state, is the reduced Planck constant, and is the unit electron charge .
In operation, the QCL is pumped electrically by a current
and the quantum cascade is aligned by applying a voltage
across the device. At the lasing threshold, the (internal) voltage across the cascade is equal to:
In the formula,
is the series resistance of the cladding layers and the contacts,
and
are the applied voltage and the current at the threshold. During lasing, the voltage across the cascade remains clamped at
because the current is driven by stimulated emission of [
10].
The energy conversion within the quantum cascade can be expressed as a balance equation of the form [
1]:
The pump current
generates heat (loss current
) and photons with an optical power
. The injection efficiency
is the ratio of the number of electrons injected from the injector into the upper laser state and the number of electrons introduced into the cascade. The external quantum efficiency
is the number of photons per gain stage leaving the QCL resonator divided by the number of electrons injected above threshold. The ratio
is equal to the photon energy divided by the energy loss of the electrons per gain stage:
The basic physical processes supporting the quasi-three-level laser scheme of the conversion of electrical into optical energy in MIR QCL are the following [
3]:
Pumping of the active region through voltage controlled resonant tunneling of electrons from the ground state (0) of the injector into the upper laser state (level 3) through an injection barrier;
Photon driven relaxation of electrons from the upper (level 3) to the lower (level 2) laser state;
Depletion of the lower laser state (level 2) by longitudinal optical (LO) phonon-driven relaxation of electrons into the upper state (level 1) of the injector manifold;
Thermal backfilling of electrons from the injector into the lower laser state (level 2) mediated by LO phonon reabsorption; and
Transport of electrons through the injector in terms of sequential transitions from the upper injector state (level 1) to its ground state.
The effectiveness of the energy conversion process is reduced by additional processes:
Escape of electrons from the upper laser state (level 3) into states lying energetically higher and subsequent relaxation into lower lying states essentially by-passing the laser process [
5,
6];
Stark detuning of the energy levels with respect to the flat-band design resulting in a decrease of the oscillator strength of the laser transition and in a reduction of the injection efficiency into the upper laser level due to the opening of additional non-resonant transitions to other states in the active region or into the continuum [
11]; and
Heating of the electrons above the lattice temperature [
12].
There are other relevant processes which can affect the energy conversion efficiency in mid-infrared QCL such as free-carrier absorption or interface-roughness scattering. We assume that these effects are implicitly represented in the parameters values specifying the threshold current density and the optical gain.
3. Electro-Optical Performance Model
The electro-optical performance model relates the stationary photon sheet density (photons/cm2) per gain stage to the pump current density (kA/cm2). All sheet densities are referred to the area of the resonator waveguide perpendicular to the current flow.
3.1. Population Inversion, Gain, and Photon Sheet Density in MIR QCL
The starting point for the electro-optical performance model is the population inversion
between the two laser states with electron sheet densities
and
(electrons/cm
2) per gain stage. The population inversion is written in a form known from solid state laser physics [
9]:
In solid state lasers the (dimensionless) inversion reduction factor
is related to the ratio of the emission and of the absorption cross sections of the two laser states ([
9], p. 24). In QCL,
represents the influences of the non-parabolicity of the in-plane motion of the electrons and of the second-order scattering-assisted optical transition between the laser subbands on the population inversion ([
3], p. 238).
Within the
k-th gain stage, we model the dependence of the population inversion
on the sheet density
of the pumping rate (transitions/s/cm
2) and on the photon sheet density
by considering the balance between pumping, depletion by stimulated emission, and thermal backfilling from the injector manifold as follows:
The effective transition time between the laser levels and the relaxation time (which is related to the photon saturation sheet density) depend on the electron temperature and on the lattice temperature , which are controlled by the pumping current density .
The other symbols represent the overlap factor of the waveguide mode with the active region of k-th gain stage, the population inversion threshold caused by thermal backfilling of electrons from energy states below the lower laser state, and the group velocity cg of energy transport in the optical mode.
The average gain coefficient
(1/cm) per gain stage is defined by
. In the expression,
(cm) is the emission “cross-section” of the upper laser level. The summation symbol comprises any inhomogeneous broadening of the optical transition. For simplicity, we assume a homogeneous linewidth and uniform gain stages. Thus, we can write:
The saturation value of the photon sheet density is defined by , the mean overlap factor per gain stage is , and (1/cm) is an effective loss coefficient describing the reduction of population inversion due to thermal backfilling.
Above the lasing threshold, the gain is clamped at its threshold value
and the equation can be solved for the photon sheet density:
We have introduced the small signal gain coefficient . Lasing occurs if exceeds the effective threshold value .
To proceed, we require an expression relating to the pump current density. Near the threshold, a popular assumption is , resulting in a linear dependence of the form .
For high power MIR QCL this assumption is not valid. The large electric field associated with high current densities shifts the energy levels of the cascade relative to their design values. This Stark shift leads to a decrease in oscillator strength of the optical transition (affecting
) and, more importantly, it opens up new non-resonant transitions to additional states in the active region or into the continuum. These new conductive channels reduce the efficiency of the electron injection from the injector into the upper laser level (affecting
). We model the pump process relating the gain
and the current density
under the influence of the Stark detuning by introducing a second order term as follows:
In the formula is the differential gain for small pump current densities << . The parameter sets the scale for the Stark detuning of the energy levels in the cascade. We assume that the Stark scale is an intrinsic property of the quantum structure, independent of the electron temperature .
With the model for the pump process of the active region we attain the following model equation for the photon sheet density after an elementary calculation (we tacitly assume throughout the paper that
):
The coefficients
and
are defined as follows:
and:
The -coefficient determines the lasing threshold. For high current densities > the photon emission is quenched due to the Stark detuning of the energy levels. The sum of both coefficients equals the Stark scale: . In general, and depend on the electron temperature and on the lattice temperature. Both temperatures depend on the pump current density so that the photon sheet density is only formally a quadratic function of as will be shown in the next subsection.
3.2. Dealing with Hot Electrons and Stark Detuning
The following procedure is adopted to deal with the hot electrons and Stark detuning in MIR QCL. We assume that the dependences of the coefficients
and
on the electron temperature are approximated by linear functions. In particular, we make the following substitution for
:
The meanings of
,
, and
will be explained below. The thermal model given in [
12] provides an expression for the temperature difference:
. The parameter
describes the thermal coupling of the electrons to the lattice. In MIR QCL based on the GaInAs/AlInAs/InP material system we assume a constant value of
[
12] discarding the dependence of
on the particular device structure and operating condition.
The linear approximation for the coefficient
is easily derived on the basis of the relation
and the assumption that
is independent of the electron temperature:
In the linear approximation of the coefficients and , the photon sheet density depends on the three quantities: , , and , which control the operation of the QCL.
The
loss current density
equals the threshold current of the QCL structure in the particular case defined by thermal equilibrium between the electrons and the lattice, thermal backfilling at the lattice temperature, and operation at the flat-band voltage (quasi-three-level lasing scheme).
The
Stark loss factor
is derived by setting
in Equation (11) and by introducing
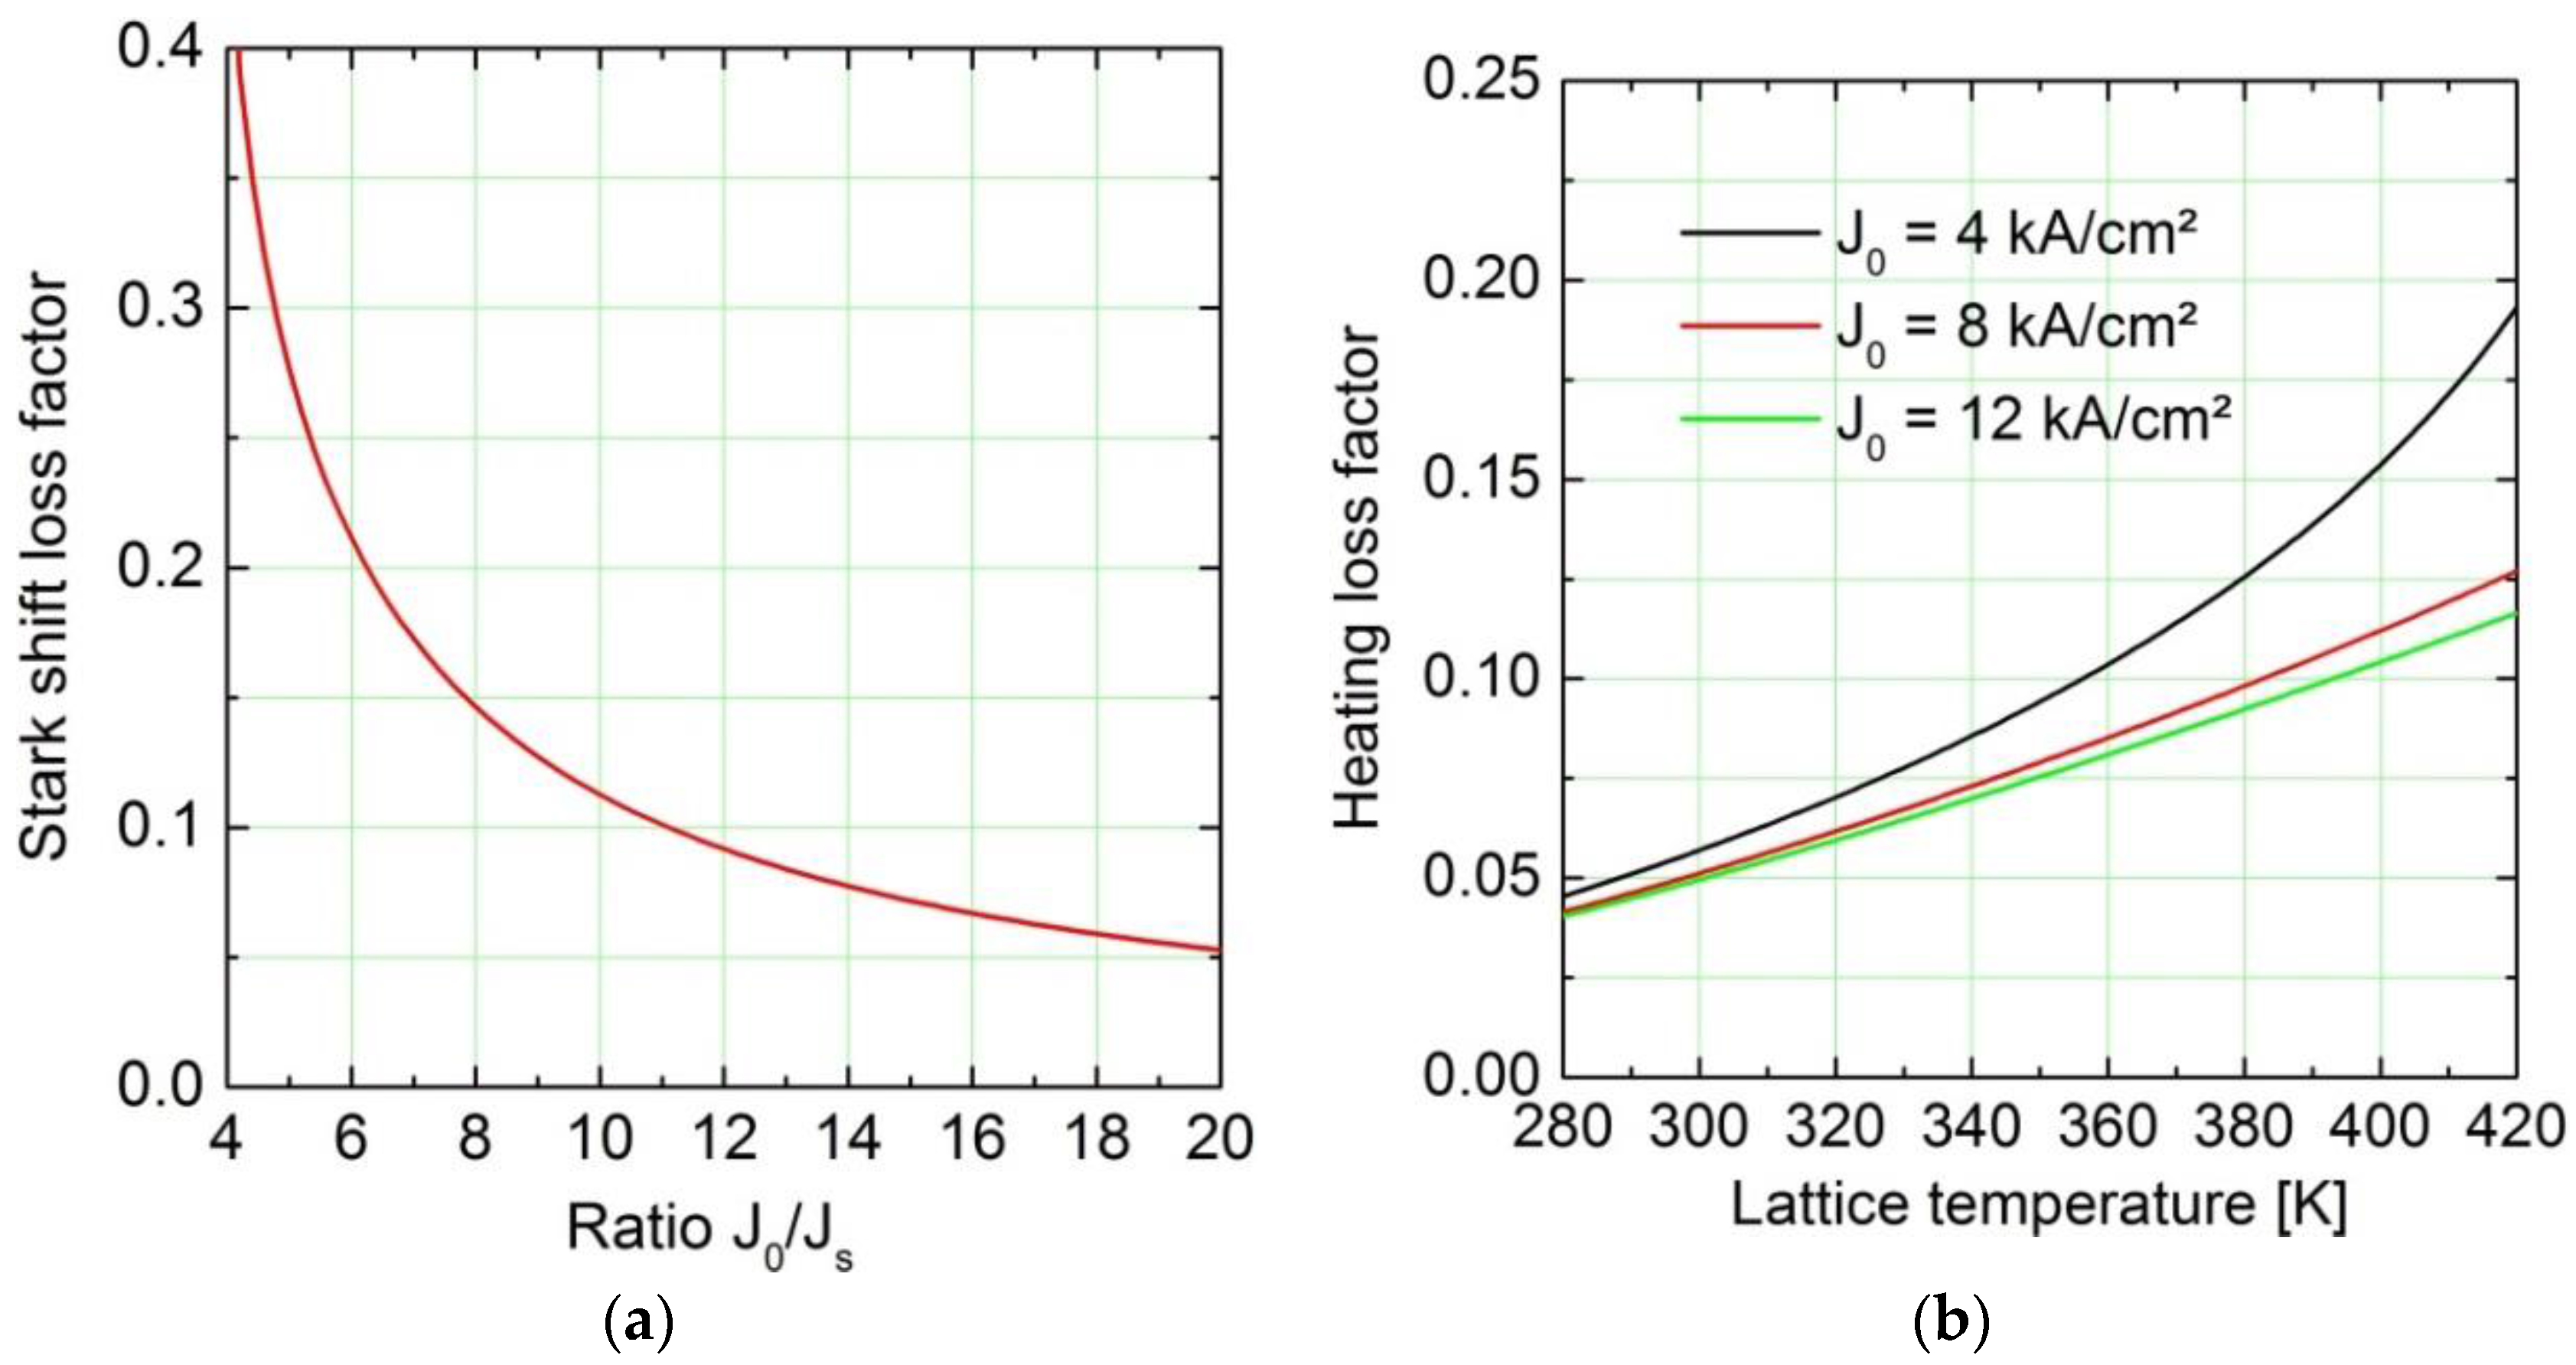
from Equation (15). This factor describes the reduction of the efficiency of electron injection from the injector into the upper laser state and the decrease in oscillator strength of the laser transition due to the Stark detuning of the energy levels. It will be shown below that the
Stark scale is equal to two times the value of the roll over current density
of the P-I curve. The dependence of
on this ratio is depicted in
Figure 2a.
The
heating loss factor
is a measure for the loss of pump energy due to the heating the electrons above the lattice temperature. In order to estimate the order of magnitude of the heating loss factor we generated a dependence on the electron temperature for the gain cross-section
and the inversion reduction factor
using the non-parabolic subbands theory of [
13]. The thermal backfilling loss coefficient
was calculated according to [
14] with the lattice temperature replaced by the electron temperature. With the help of a 4-level rate equation model [
15] including electron escape from the upper laser level along the lines of [
6,
7] we generated the coefficient
and calculated the derivative
numerically for different QCL structures. A result of these calculations is shown in panel of
Figure 2b. The
values span a range between 0 and 20% depending on the lattice temperature and on the value of the Stark current scale
.
The Stark current scale is the parameter which drives the QCL electro-optical performance. A small value of
leads to the occurrence of the Stark roll-over within the dynamic current range of the device (in a pulsed low duty cycle mode). Ideally, the value of the Stark current scale is well beyond the maximum current determined by the doping level of the device. A preliminary evaluation [
15] of measured data (from the author’s labs and from publications) using the model indicates that the ratio
assumes values between 6 and 10. Therefore, we expect
to take on values between 10% and 20% and
to be in the order of a few percent. A detailed assessment of the application of the model to QCL devices is the topic of an ongoing study and beyond the scope of this paper.
3.3. Threshold Current Density
The threshold current density for
constant lattice temperature (which happens in short pulse low duty cycle operation of the QCL) is defined by the onset of photon emission,
i.e.,:
This is an implicit equation for the calculation of
. We solve this equation using the linear approximation for
derived above. The result is:
The threshold current density of the device is larger than the loss current density because pump energy is lost to the heating of the electrons (factor ) and to the Stark shift of the energy levels (factor ). The product can be interpreted as the efficiency of the electron injection from the ground state of the injector into the upper laser level at the threshold.
Looking at the equation for the threshold current density, we see that the well-known procedure of estimating the waveguide losses by fitting a straight line to the dependence of on needs to be interpreted carefully in order to separate the contributions of device losses, thermal backfilling, hot electrons, and Stark detuning.
3.4. Quenching Current Density
At
constant lattice temperature, the laser stops the emission of photons if the pump current density exceeds the current density
defined implicitly by the equation
. In linear approximation we attain the solution:
The quenching current density depends strongly on the loss parameter and is, thus, directly related to the Stark detuning of the energy levels. If the Stark detuning is negligible, the quenching current density becomes infinite and the photon sheet density grows until the maximum current density that the cascade can support is reached. If is less than this maximum value, Stark roll-over limits the dynamic current range of the device measured by the difference .
3.5. Electro-Optical Performance Model
Writing
and
and rearranging the formula for the photon sheet density leads to the following expression for
which is valid for moderate heating loss factors
:
The heating loss parameter
reduces the photon sheet density through the efficiency factor:
In addition, the heating of the electrons leads to a limitation of the photon sheet density at high pump current values. Suppressing the Stark shift by imposing
gives the upper limit:
A second reduction factor of the photon sheet density is given by:
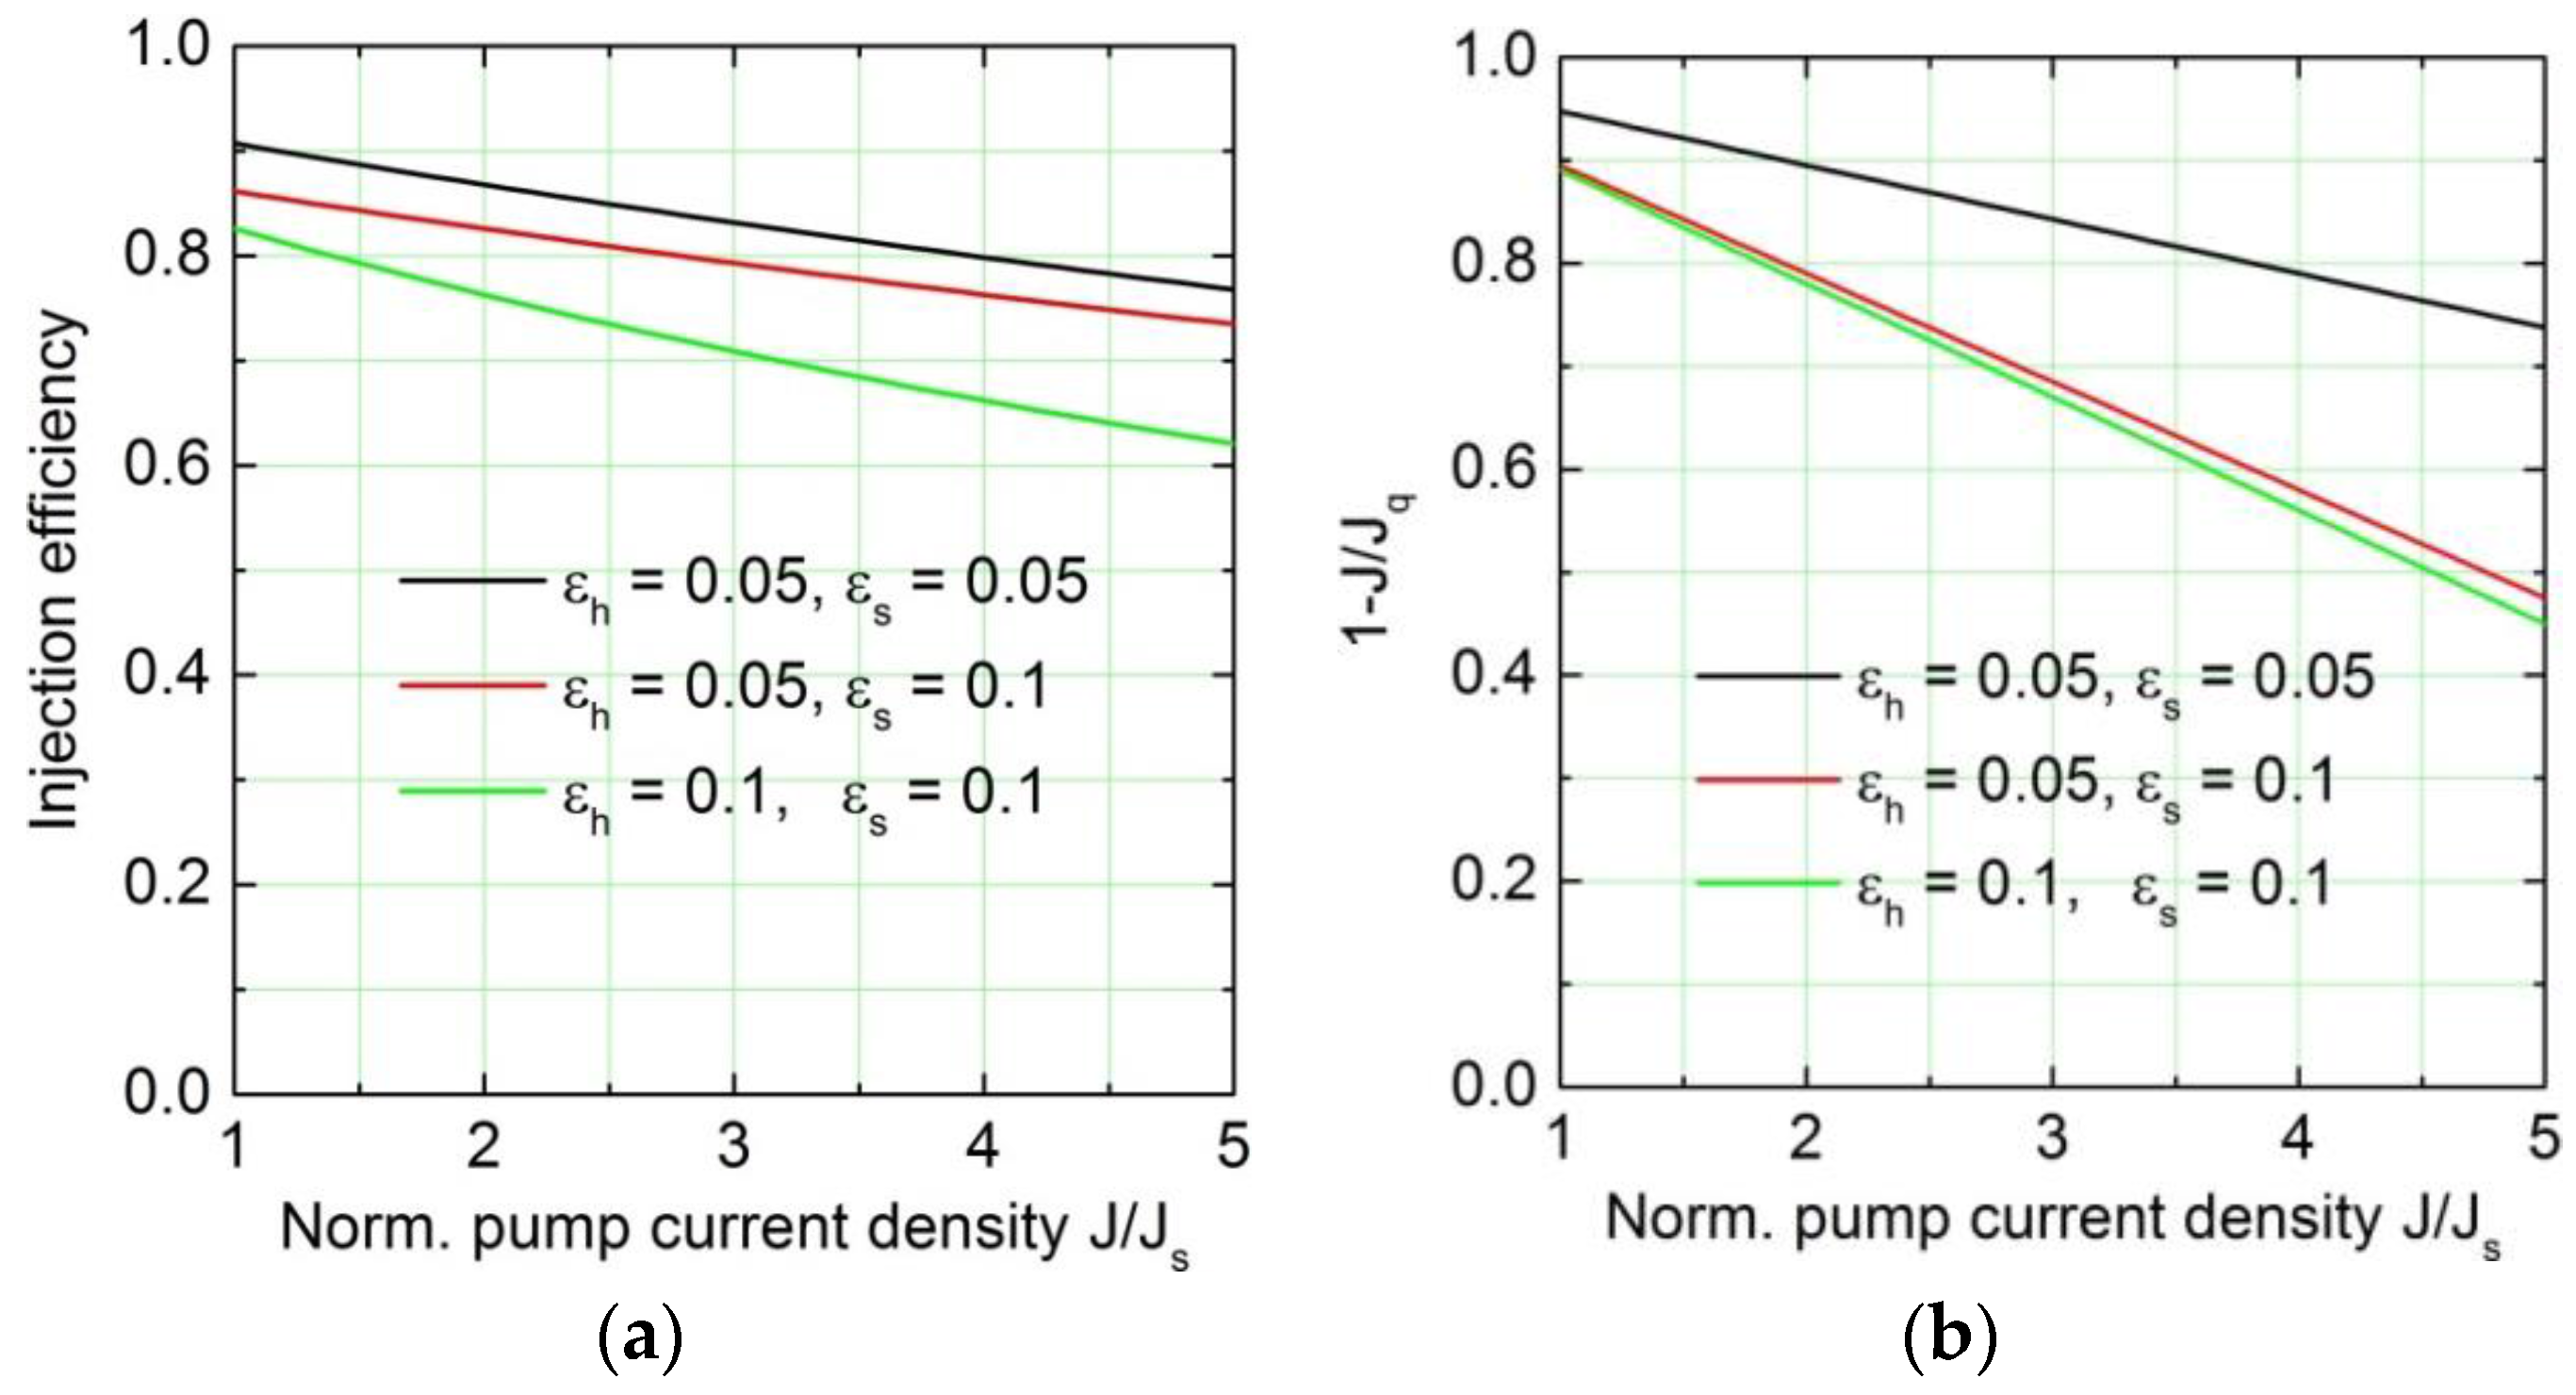
This factor represents the efficiency of the injection of electrons from the injector into the upper laser level. At threshold, is equal to .
Finally, the factor parameterizes the quenching of the photon emission due to the reduction of the dynamic current range.
The photon sheet density given in Equation (21) is a non-linear function of the current density . The slope factor is determined (among other factors) by the escape of electrons from the upper laser state due to heating (factor ) and by the Stark detuning (factor ). These factors influence the slope already near the threshold. With increasing current density the heating factor remains constant, whereas the injection efficiency is reduced. In addition, hot electrons and Stark detuning reduce the dynamic range of the pump current through the factor .
The dependences of the reduction factors
and
on the normalized current density are depicted in
Figure 3 for different values of
and
. The graphs show that for moderate values of
and
a reduction of the photon sheet density down to 50% of the value without considering heating and Stark detuning can be expected.
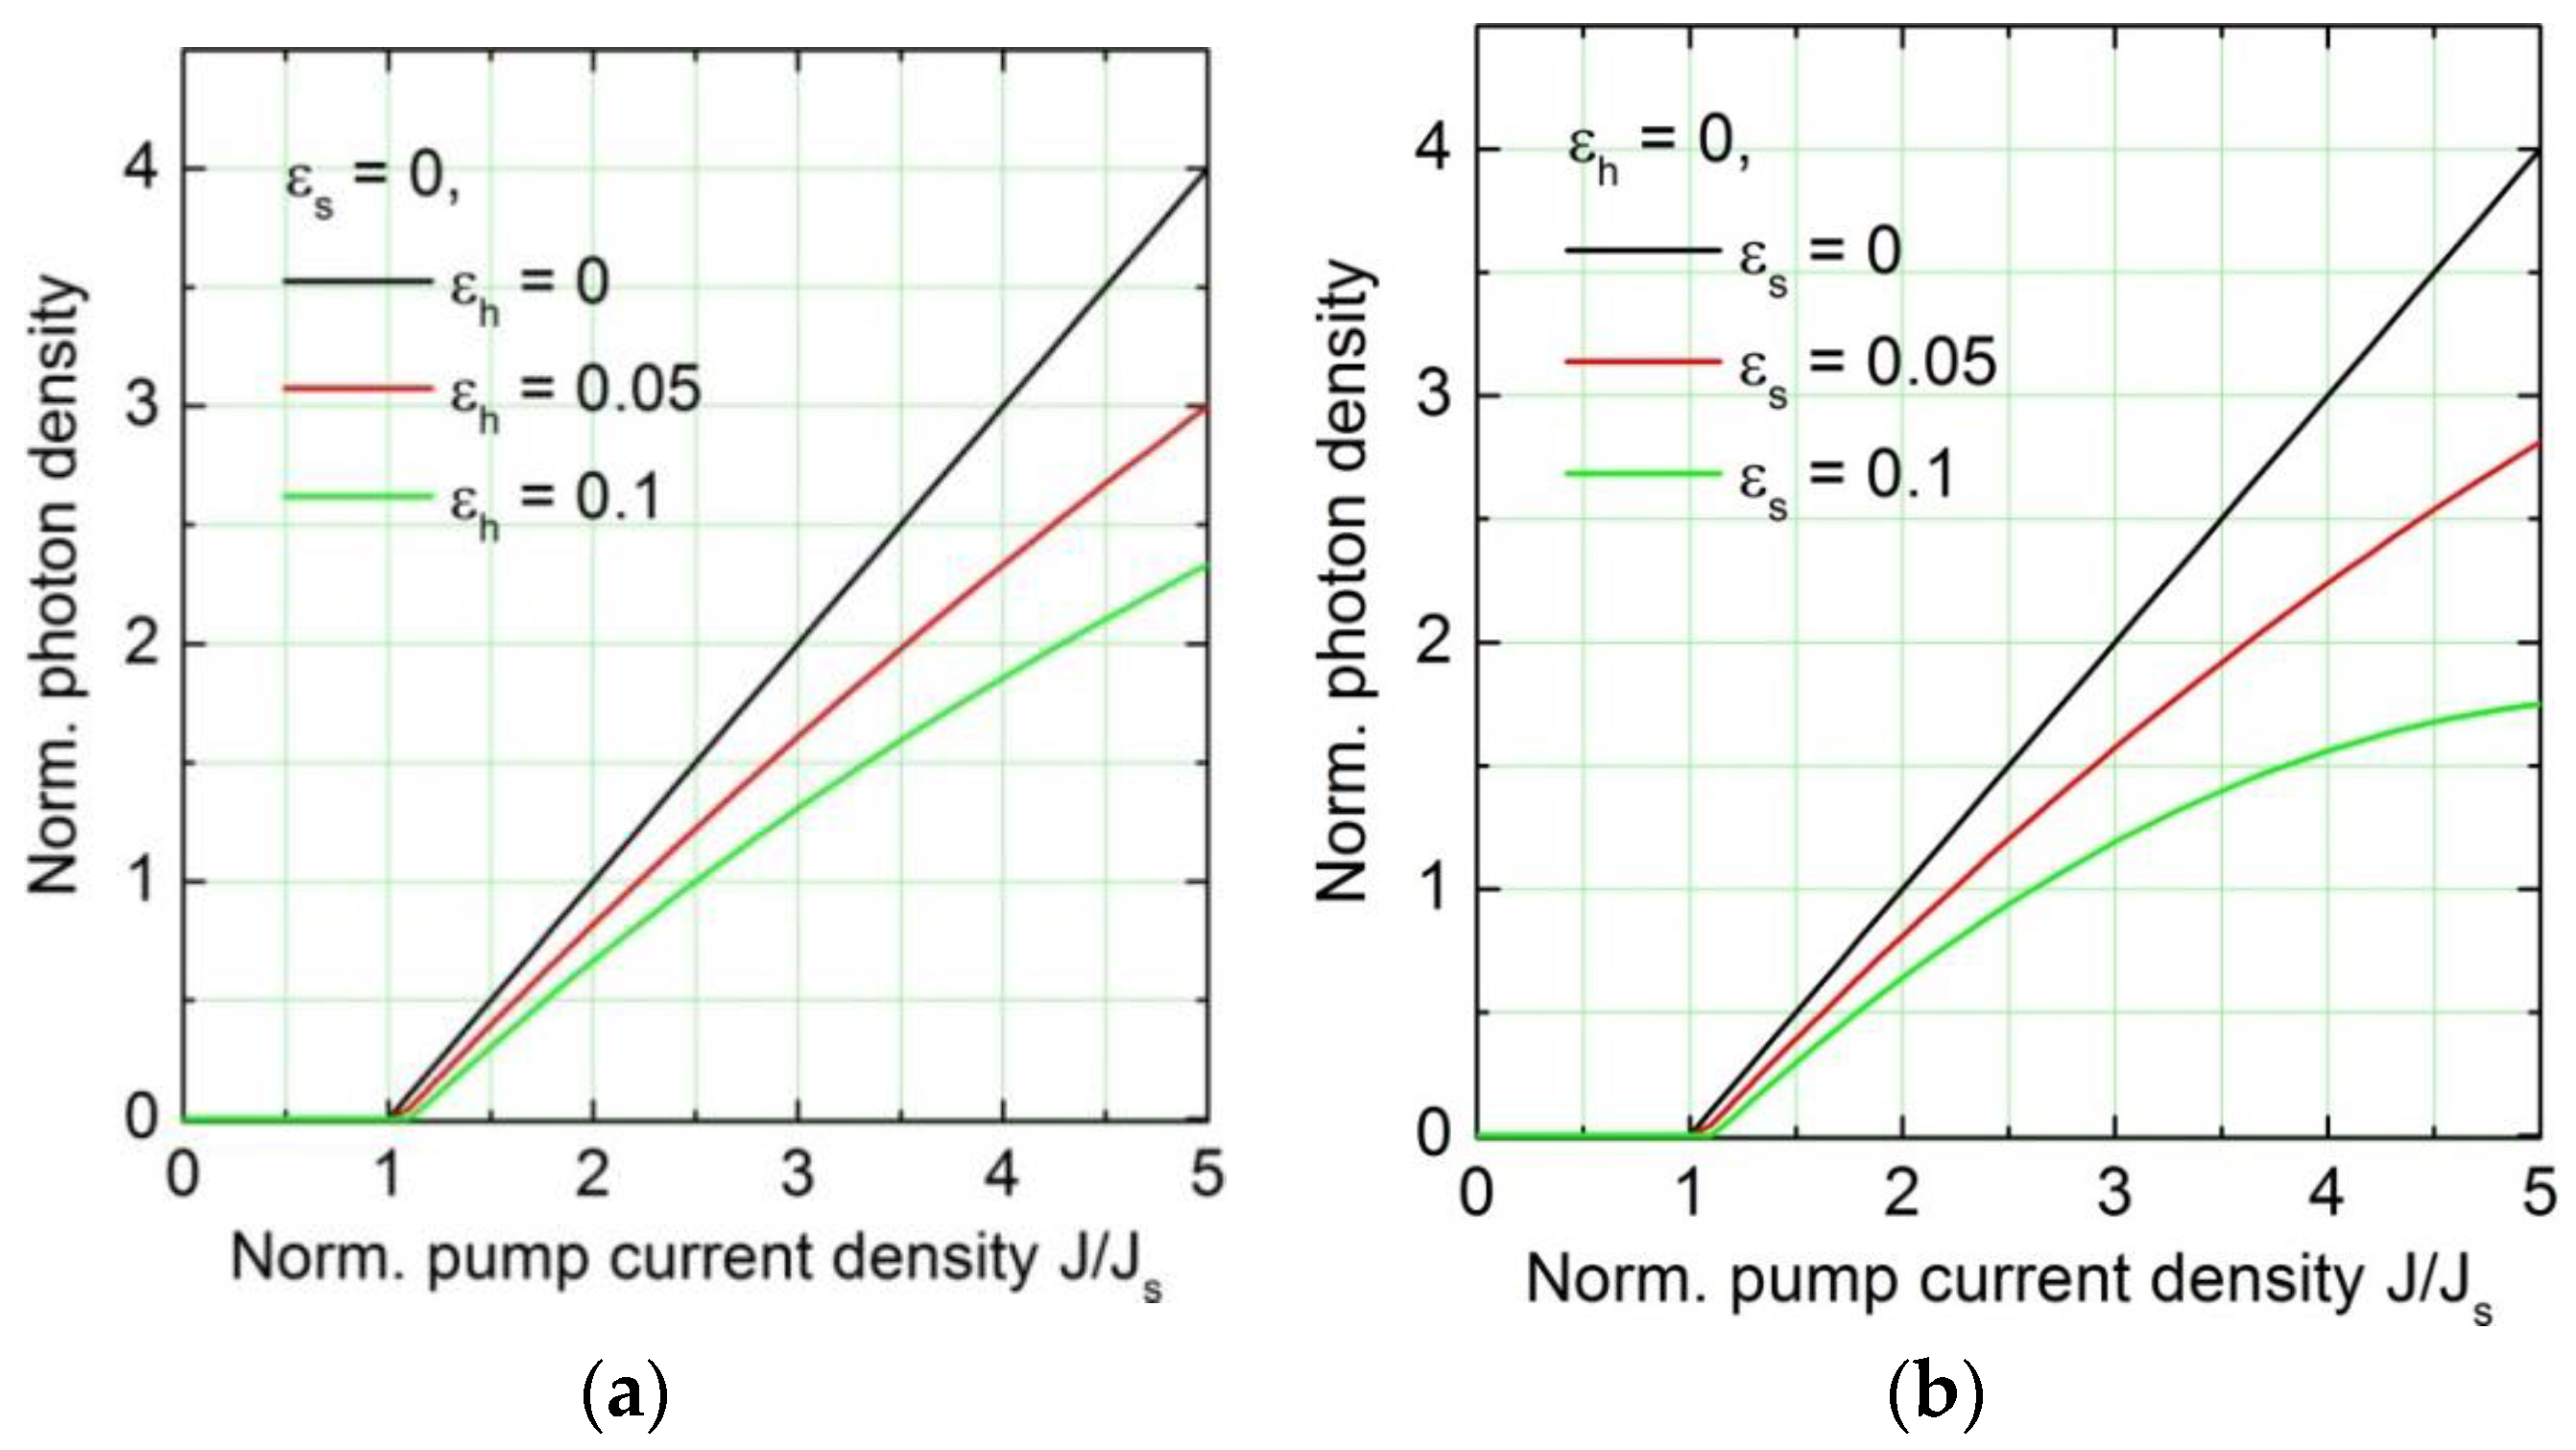
The photon sheet density exhibits a maximum and may roll over with increasing current density, depending on the value of the Stark current scale
(effective through
). Roll-over occurs at the pump current density
for which the slope
equals zero. Differentiating the function
with respect to the pump current density
for a constant lattice temperature and performing an elementary calculation gives the formula:
For small values of the heating loss the bracket on the right hand side is zero to first order. This implies that roll-over occurs approximately midway between the threshold and the quenching point: . At the same order of approximation we have which shows that the roll-over current density of the electro-optical characteristic is directly related to the Stark scale .
Figure 4 depicts the non-linear dependence of the photon sheet density
on the normalized current density
. Panel (a) shows the influence of the hot electron factor
on the roll-over of the electro-optical characteristics, panel (b) depicts the influence of the Stark detuning factor
.
In practice, both mechanisms,
i.e., heating and Stark detuning, occur simultaneously.
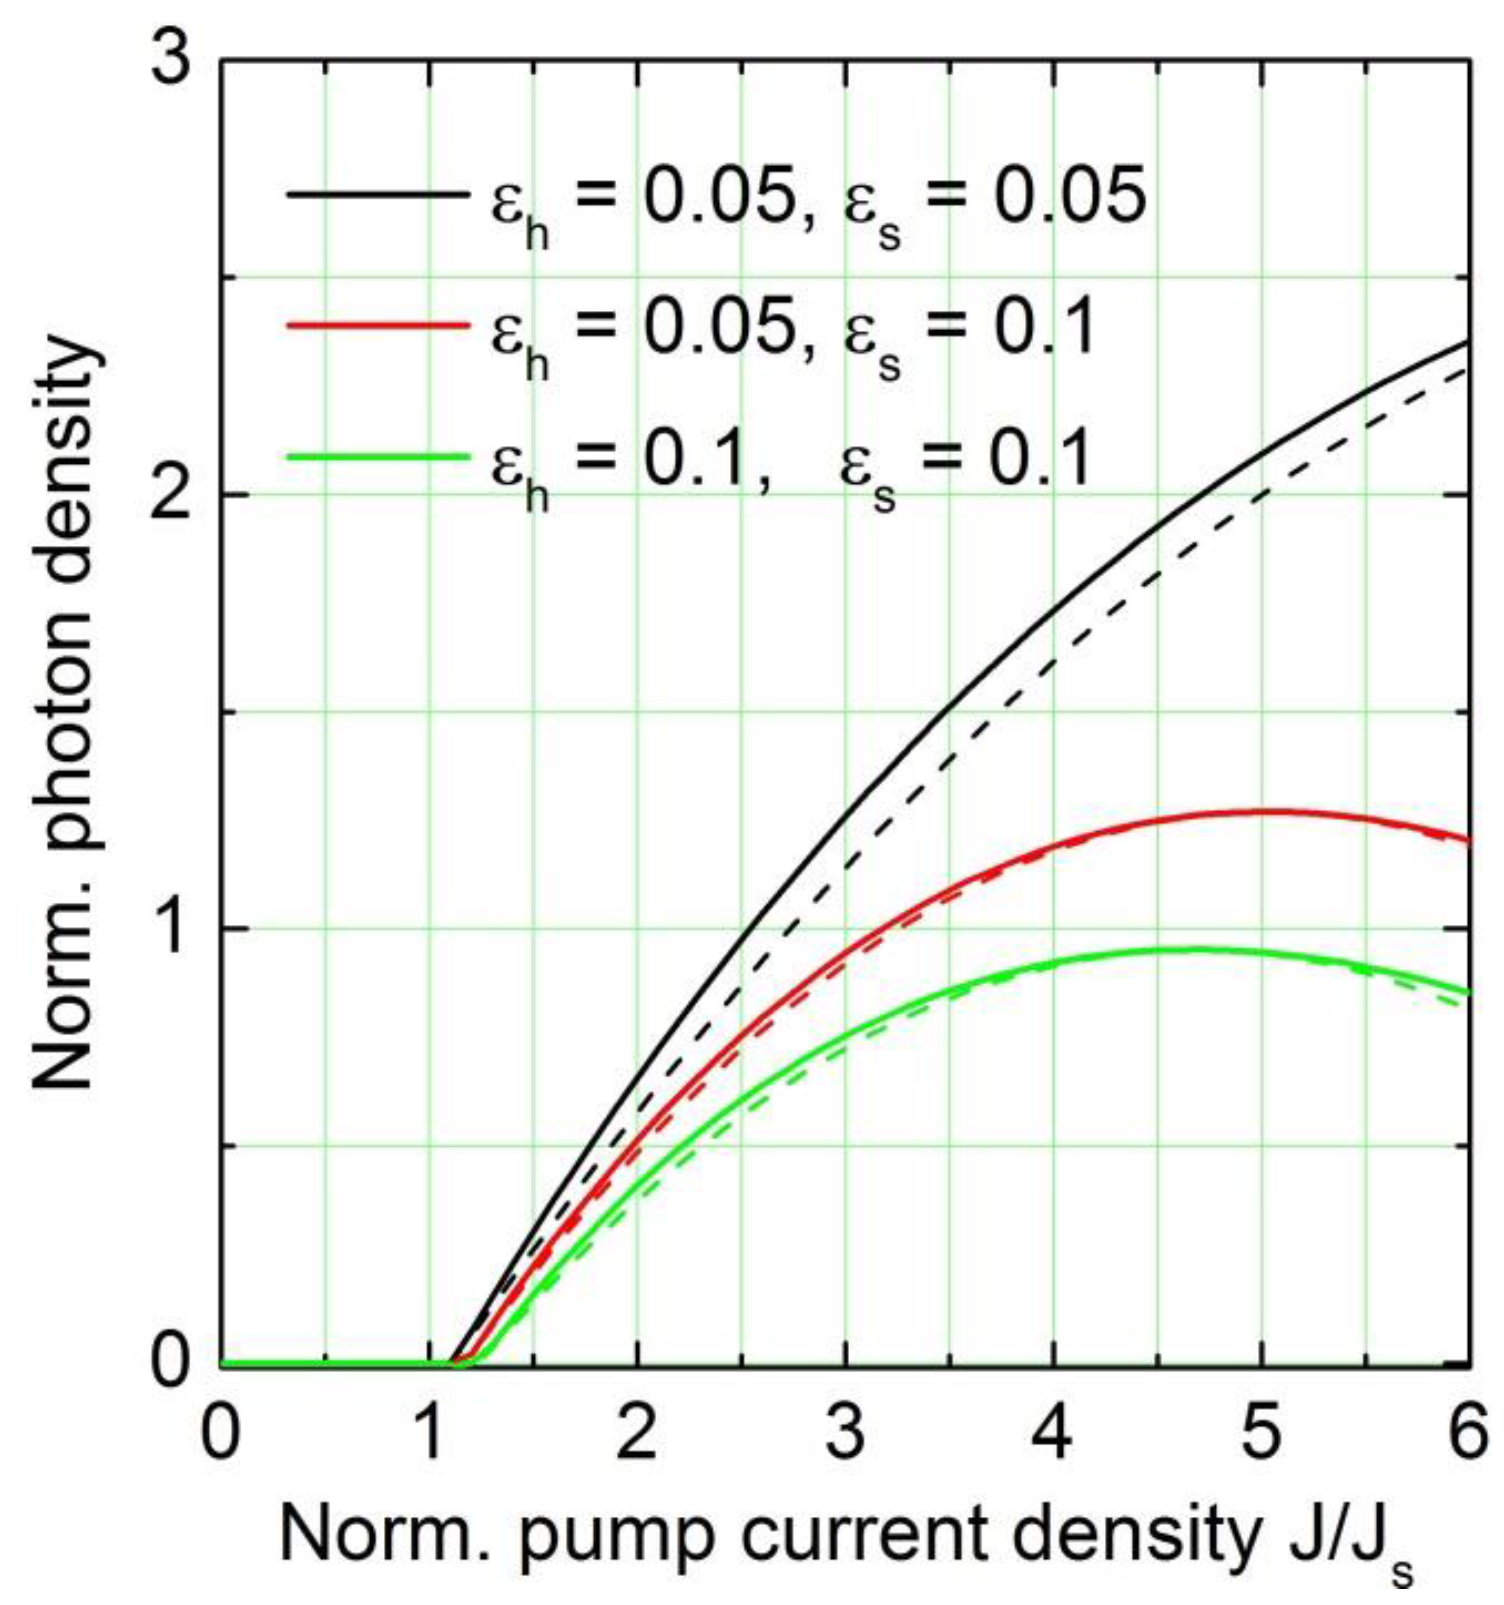
Figure 5 gives calculated electro-optical characteristics for different combinations of the loss parameters
and
. The Stark detuning factor
determines primarily the position of the roll-over current (through
) whereas the heating factor
adjusts the value of the photon sheet density at roll-over.
3.6. Parabolic Approximation of the Optical Output Power Based on Observable Quantities
The expression for the photon sheet density given above depends on parameters which represent the internal mechanisms of the electro-optical energy conversion. This description is useful to guide design decisions, for example concerning the resonator geometry or facet coatings. For system level simulations we require model parameters which are observable at the device level. To arrive at such a model we introduce in Equation (21) the value of
at the roll-over point,
, replace
by the approximate value
and assume that
is roughly equal to its roll-over value
. This procedure leads to a parabolic approximation of the dependence of the photon sheet density on the current density parameterized with the experimentally observable quantities
,
, and
(
for constant
):
A comparison of the parabolic model function with the full performance model is depicted in
Figure 5. It is evident that the parabolic approximation improves with increasing influence of the Stark roll-over for current densities between the threshold and the roll-over current density. In other words, this region is sufficiently well approximated using the parabolic model.
3.7. External Quantum Efficiency
Introducing the Equations (19), (22) and (23) into Equation (3) leads to the following expression of the conservation of energy within the quantum cascade above threshold:
The currents are given by expressions of the form where and are the length and the width of the resonator. The first and the second term of Equation (27) describe the heat generation in the cascade at the threshold and the additional heating of the electrons above the threshold.
Relating the output power
to the photon sheet density
through the mirror coupling loss
according to
, substituting the photon sheet density
, and solving for the external quantum efficiency
leads to:
with
denoting the losses due to free electron absorption and optical losses in the resonator.
The external quantum efficiency
is different from the differential slope efficiency because the injection efficiency and the reduction of the dynamic range depend on the current density. The factor
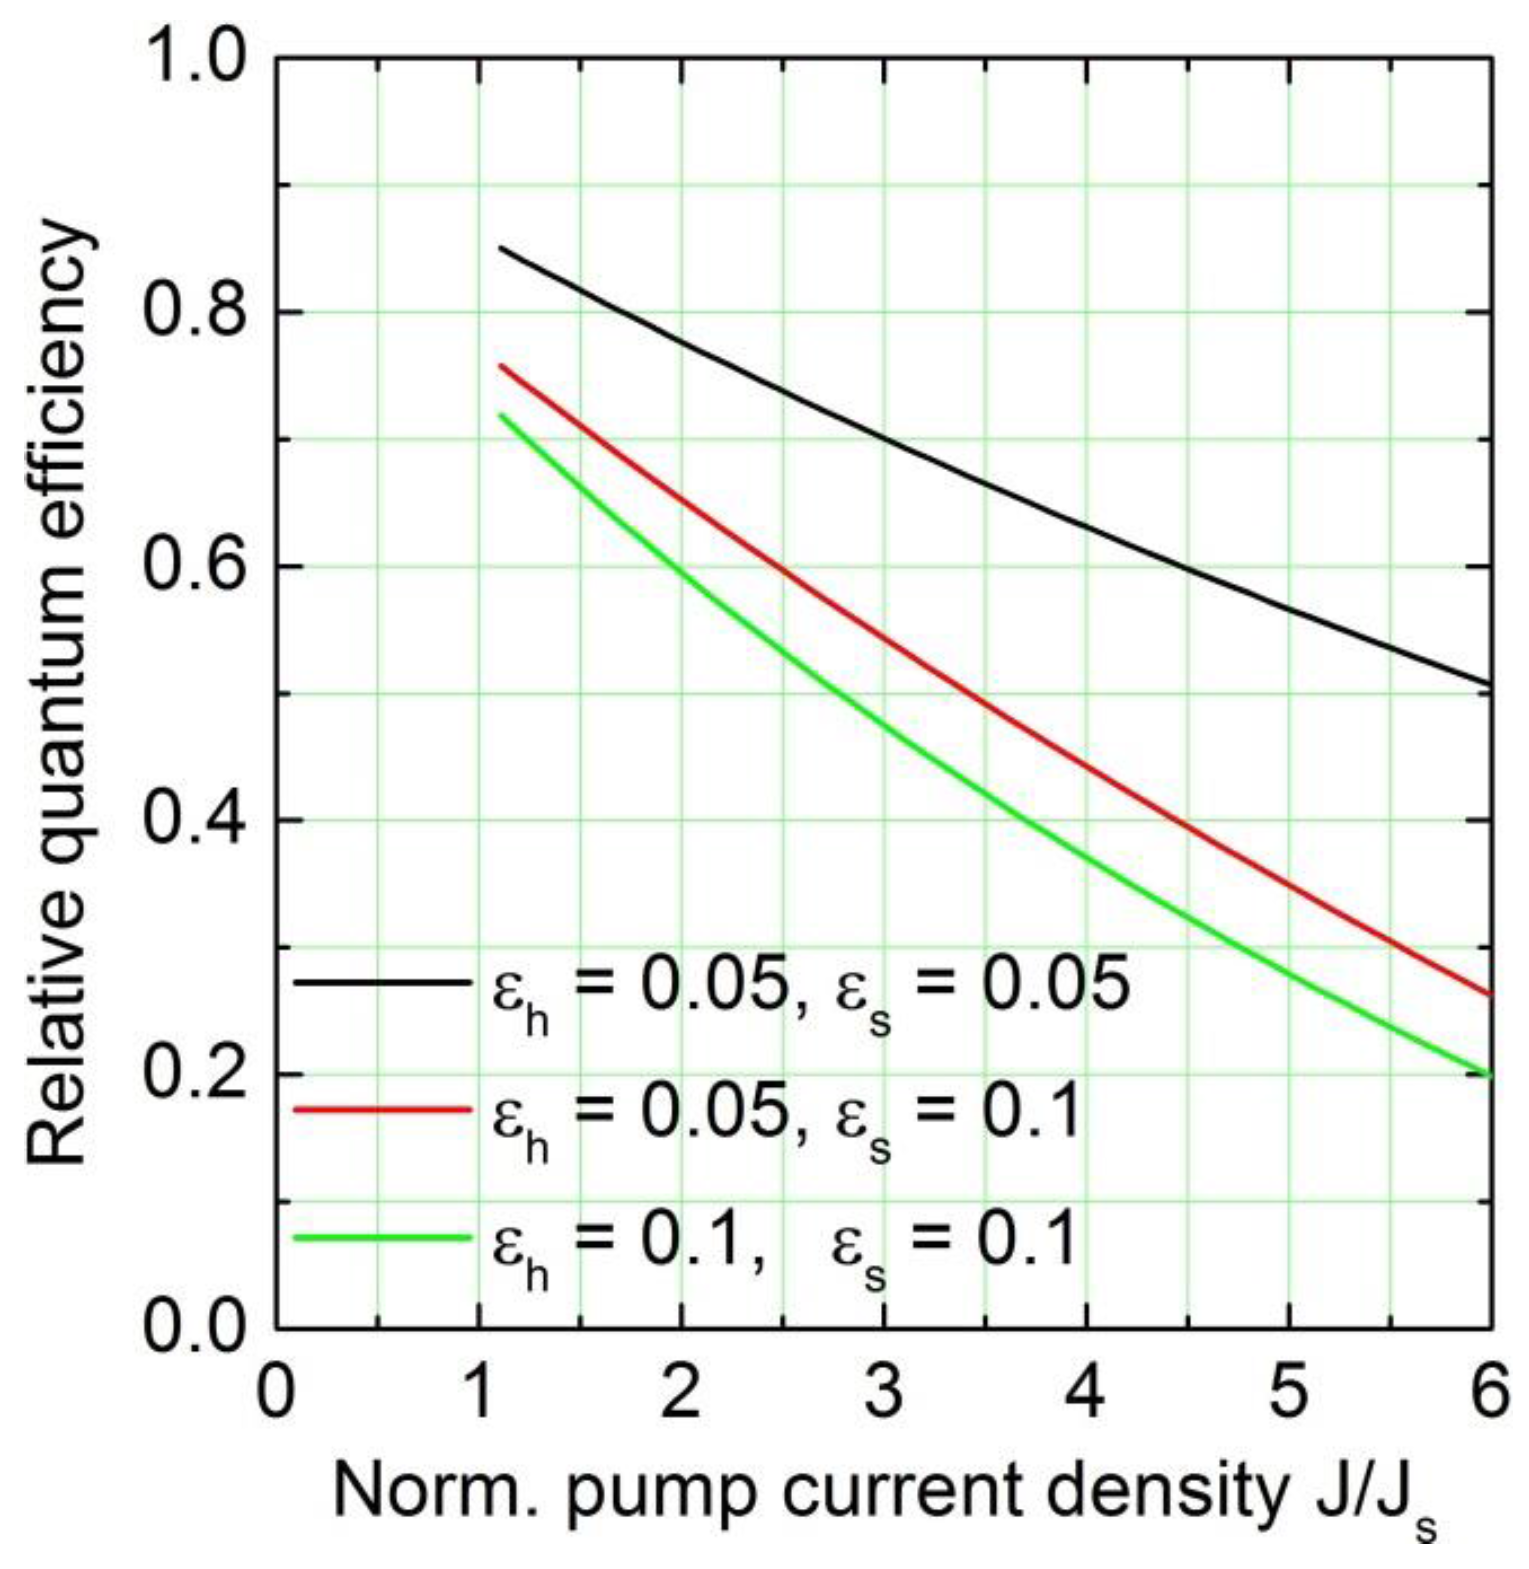
reduces the quantum efficiency relative to its value without hot electrons and Stark shift. This relative value is depicted in
Figure 6 for different combinations of the loss parameters
and
. Even for moderate loss factors of 5% the reduction in quantum efficiency due to heating and Stark detuning is considerable.
4. Experiments and Discussion
The electro-optical performance model relates the optical output power of a QCL to the pump current at a constant lattice temperature. The model can be used to characterize and to summarize the power characteristics of QCL grown and processed in a similar way for a specific application. The model parameters are established using a calibration procedure in pulsed mode operations. Once the model is set up, system simulations can be used to assess the performance of QCL in different modes of operation.
Especially useful for system-level calculations is the parabolic approximation with the directly observable parameters threshold current , Stark scale current , and output power at roll-over. The values of these parameters have to be measured in a pulsed low duty cycle mode of operation in order to avoid self-heating, and to keep the lattice temperature as close as possible to the heatsink temperature which can be controlled during the measurement. Stepping through the heatsink temperature and fitting the parabolic model at each step to the power-versus-current characteristics of the QCL under investigation gives three functions relating the model parameters to the heatsink temperature.
The usual procedure is to fit exponential functions to the temperature variation of these data: the threshold current increases as , the optical power at roll-over decreases according to , and the Stark scale decreases as over a (limited) temperature range of interest. In these empirical models it was assumed the lattice temperature equals the heat sink temperature ().
The calibration of the model parameters is completed by measuring the electro-optical characteristics of the QCL under pulse train pumping with different duty cycles. In this case the temperature of the lattice is greater than the temperature of the heat sink. Both temperatures can be related by a simple thermal model of the form
[
3] to the electrical (pulse) power
and to the duty cycle
. Using curve-fitting techniques, the effective thermal resistance
of the QCL structure may be estimated from the experimental data.
We demonstrate the application of the modeling approach for the characterization of 4.6 µm QCL devices using an experimental data set obtained from high-power MIR QCL developed at Fraunhofer IAF. The active region design of the QCL is based on a slightly-diagonal-transition [
16]. After the material growth, the wafers were processed into mesa waveguide lasers by etching double trenches to define the ridges of about 12 µm in width. After processing, the wafers were cleaved into laser bars with cavity lengths of 3.5 mm, either leaving the facets uncoated for standard low duty-cycle characterization to obtain the characteristic temperature
, or high-reflectively (HR) coated on the back facet with R ~ 0.8 to enhance the light emission of the front facet for high duty-cycle operation as well as CW operation.
The lasers were soldered onto gold-plated copper heatsinks, either simply epilayer-up for low duty-cycle characterization, or epilayer-down after HR coating of the back facet for high duty-cycle or CW operation. After wire-bonding, the mounted devices were attached to a thermoelectric cooler for electrical and optical characterization. The temperature of the thermoelectric cooler was varied between 270 K and 360 K. For low duty-cycle operation, the lasers were driven by current pulses of 100 ns width at a repetition rate of 1 kHz to avoid accumulative self-heating of the devices. The emitted light was collimated by an F/1.6 off-axis parabolic mirror and focused either into a Fourier transform spectrometer (spectral resolution 0.1 cm−1) equipped with a liquid-nitrogen cooled cadmium-mercury-telluride detector for characterization of the emission spectra, or onto a calibrated room-temperature pyro-electric detector for direct power measurement, while for high duty-cycle, the lasers were driven by current pulses of 300 ns width and repetition rates varying from 0.1 MHz to 2.5 MHz. For both high duty-cycle and CW operation, we placed a power meter directly in front of the emitting facet of the QCL chip, without any collection optics nor beam steering mirrors. The power meter has a diameter of 2 inches and the distance between the power meter and the laser front facet is about 1 cm, resulting in a collection solid angle of around 1.8π and ensuring almost 100% collection efficiency.
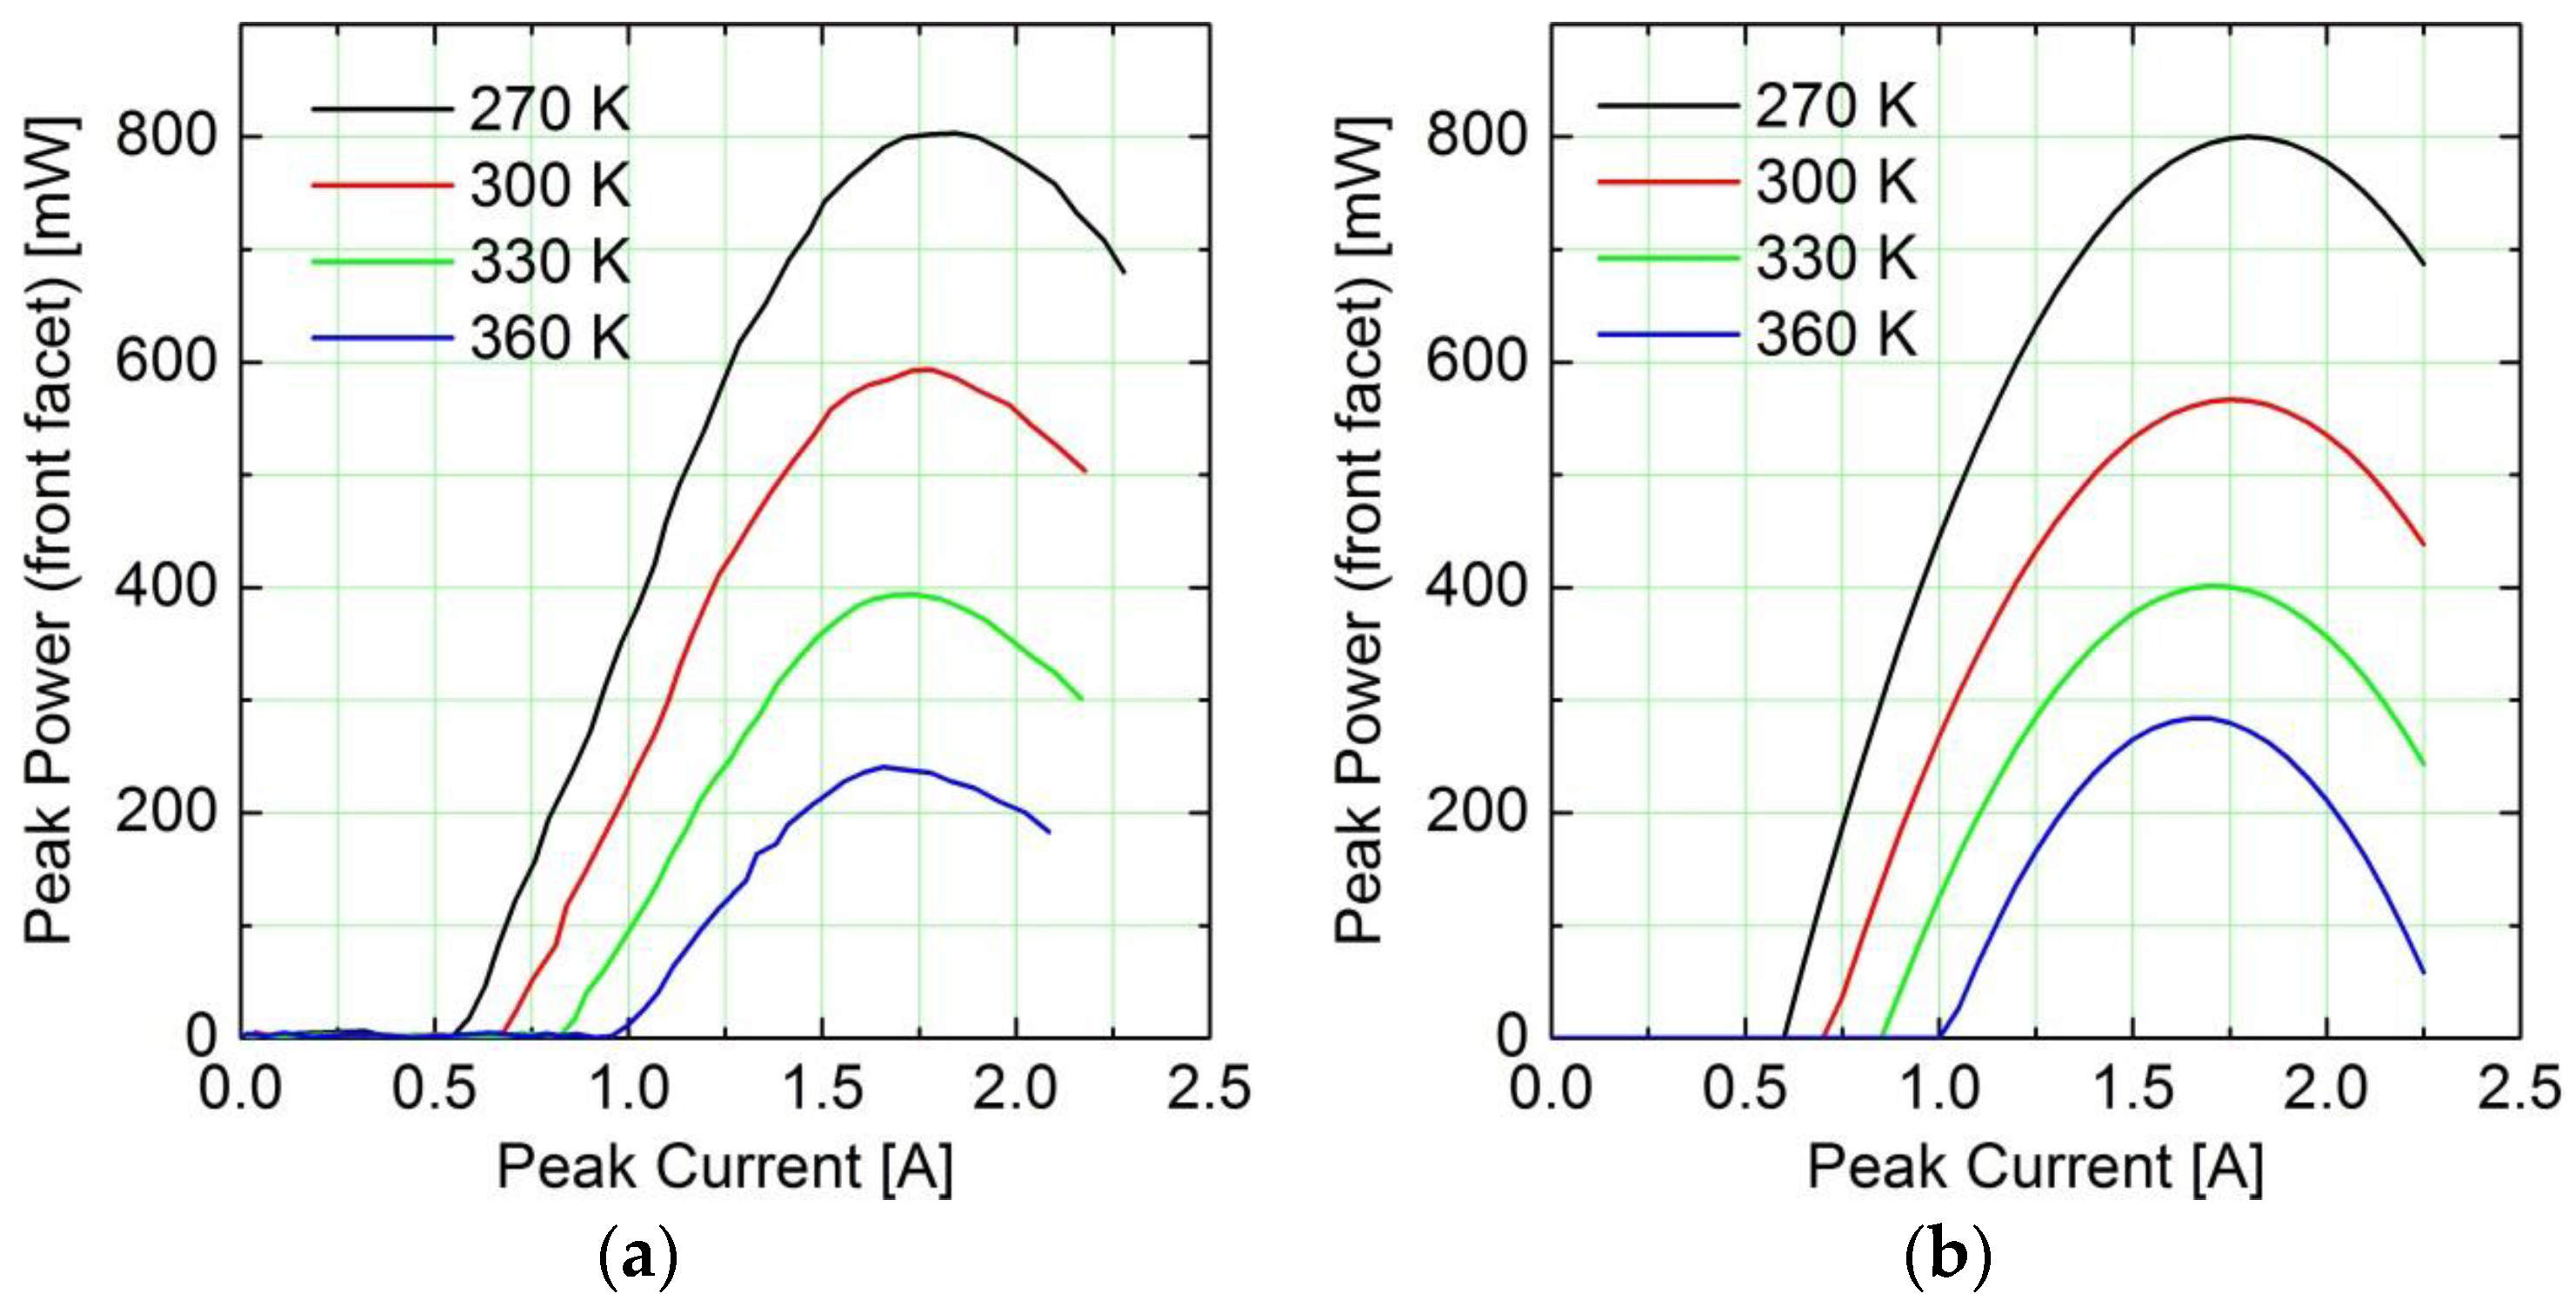
Figure 7 shows the optical power
vs. pump current (P-I) curves in pulsed low duty cycle mode for a QCL chip with the dimension of 12 µm × 3.5 mm at various heat sink temperatures. The panel (a) gives the experimental data, the panel (b) shows the parabolic model (Equation (26)) fitted to the data. The model represents the experimental data with reasonable quality for the purpose of system-level simulations.
The dependences of the threshold current, of the optical power at roll-over, and of the Stark scale on the heat sink temperature have been approximated with exponential functions. The model parameters are as follows for a reference temperature of : , ; ; ; ; .
The comparison of
Figure 7a,b reveals the limits of the parabolic model for elevated heat sink (active region) temperatures. The description is reasonable up to the roll-over point and for moderate temperature differences relative to the reference temperature (270 K in
Figure 7). Beyond these limits the full model (Equation (21)) has to be applied. The variation of the injection efficiency (which is neglected in the parabolic model) with temperature reduces the peak value of the output power and reduces the slope of the P-I curve beyond the maximum. This limitation is acceptable for system-level simulations.
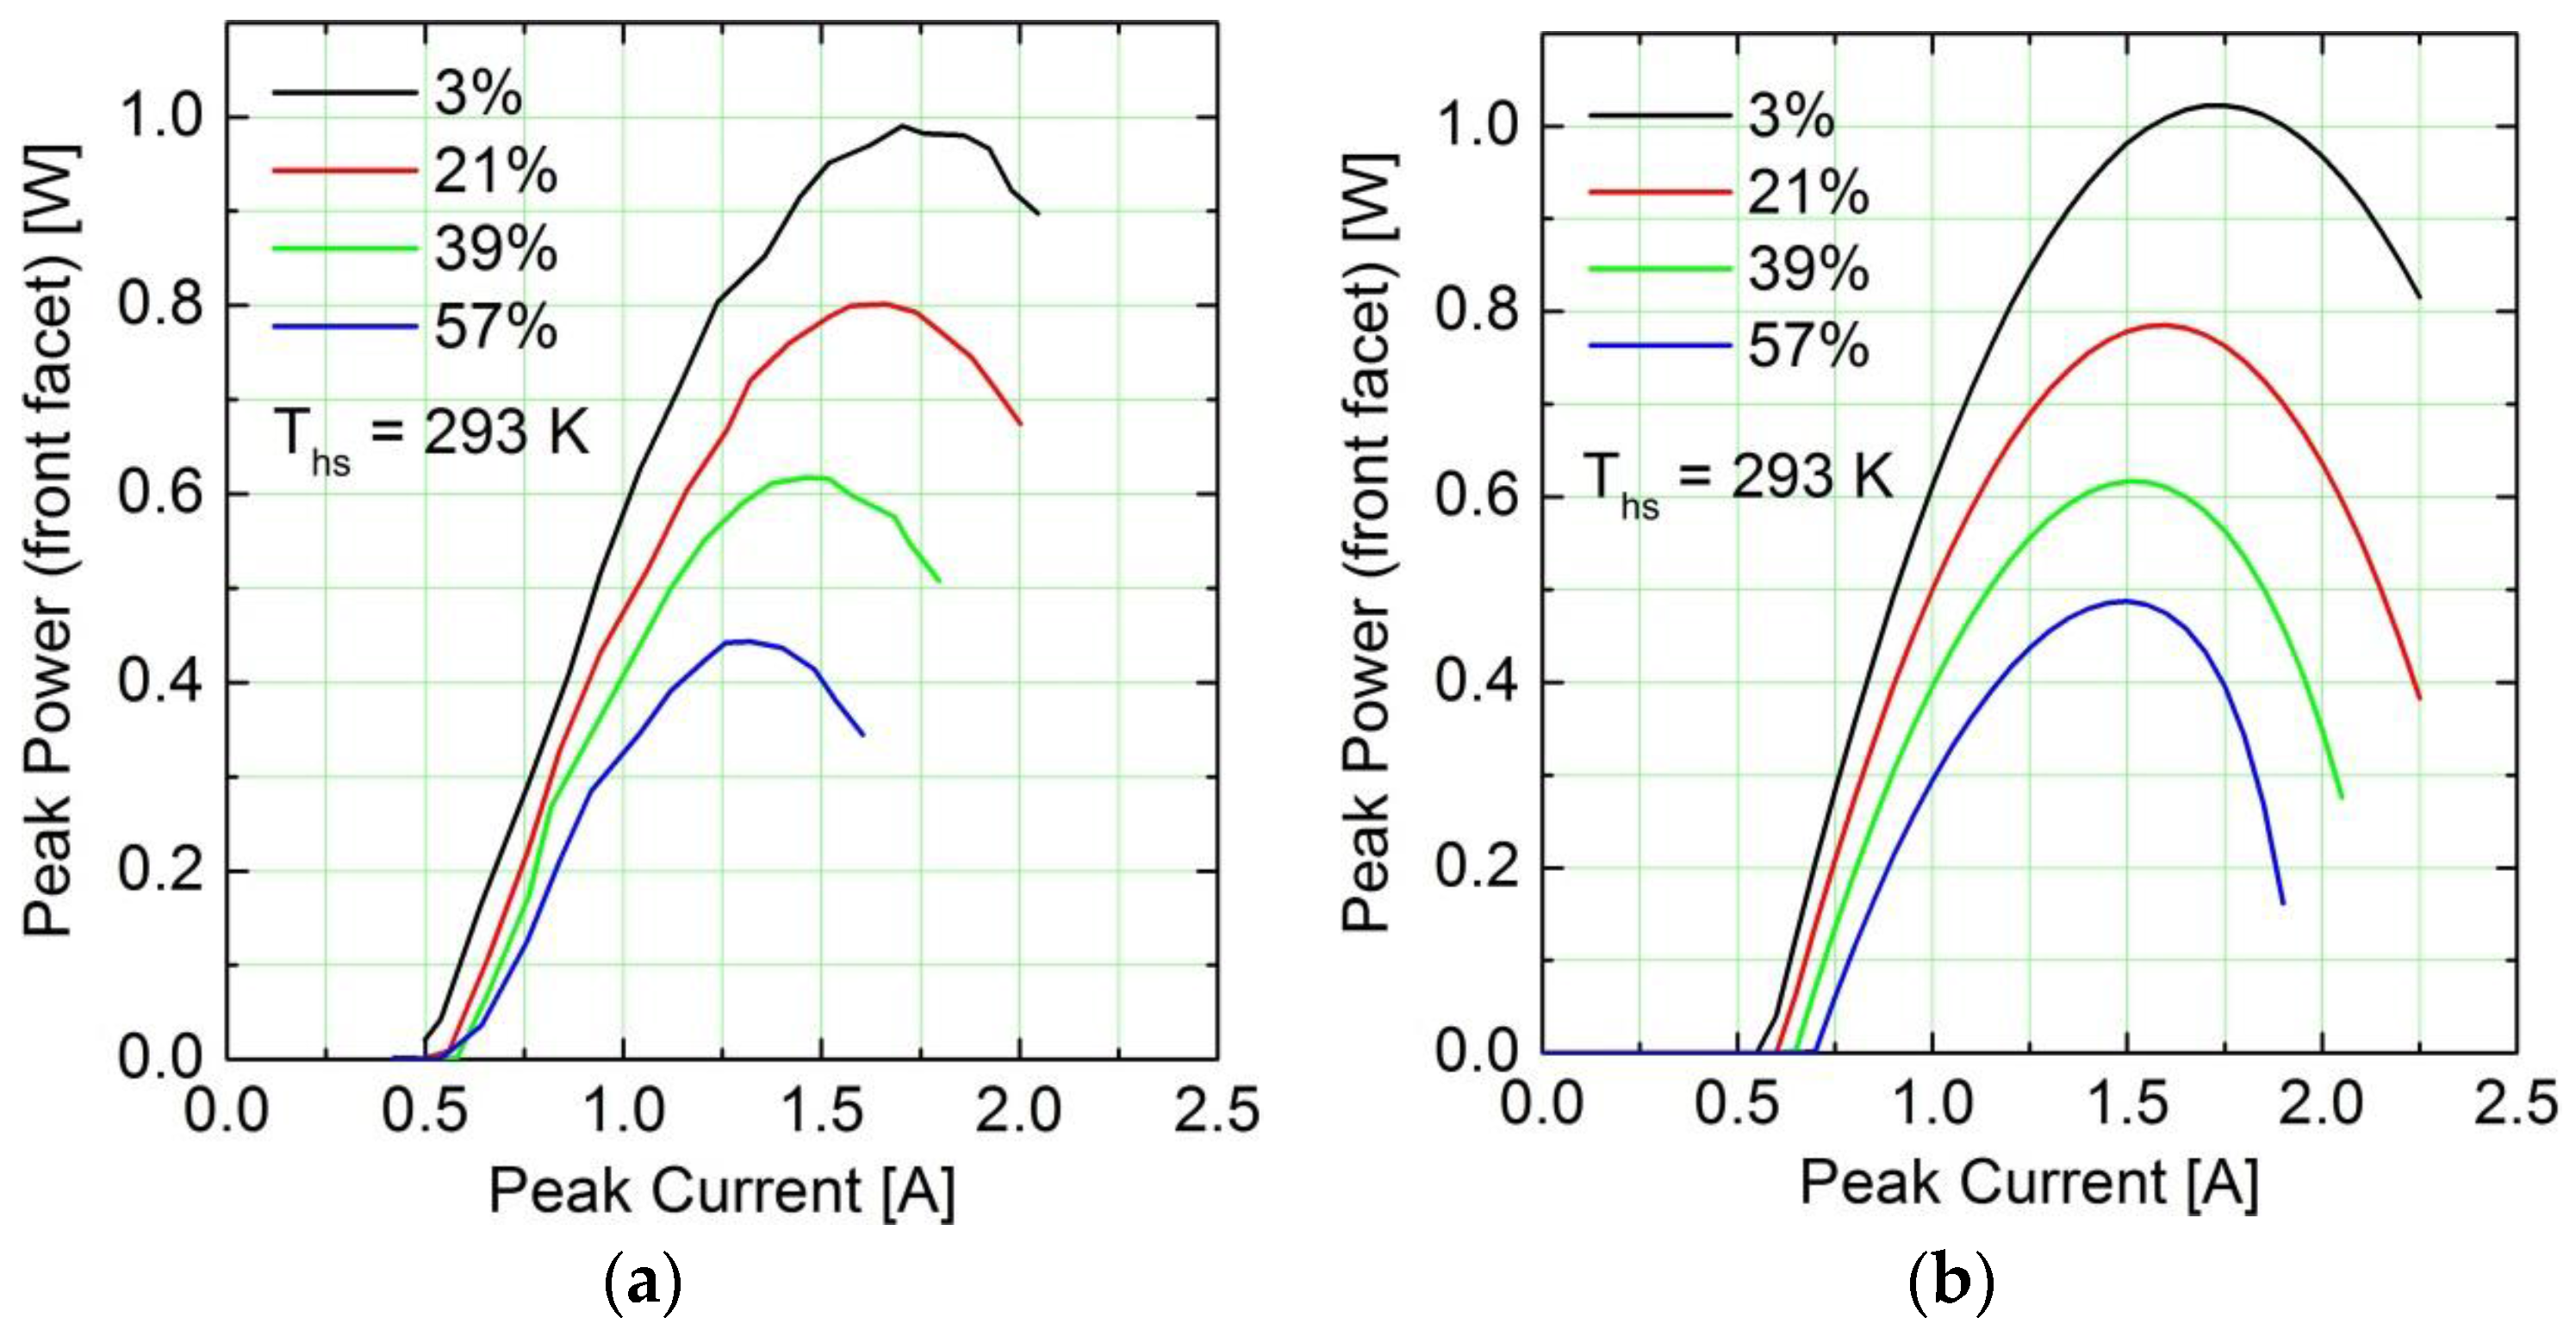
In order to determine the effective thermal resistance of the QCL structure, P-I measurements in high duty-cycle operation at a heatsink temperature of
= 293 K were performed. As mentioned before, for this experiment the back facets of the lasers are high-reflectively coated with R ~ 0.8 to enhance the light emission of the front facet, and single-ended emission optical power from only the front facet is counted. The experimental results, together with a simultaneous fit of the parabolic and the thermal models, are depicted in
Figure 8. The model parameters had to be adjusted because the threshold current and the peak power adapt themselves to the new resonator configuration. The values are as follows, for a reference temperature of
:
,
;
;
. An essential feature of the model states that the Stark scale is determined by the quantum design and, consequently, its parameters should remain same. Please note that the heat sink temperature of the measurements was 293 K.
The electrical input power
to the device above the threshold was calculated from a linear model of the form
with the parameter values
and
derived from an analysis of the experimental voltage-current characteristics. We use the same set of parameters independent of the duty cycle. From the data in
Figure 8 we estimated an effective thermal resistance of the order
.
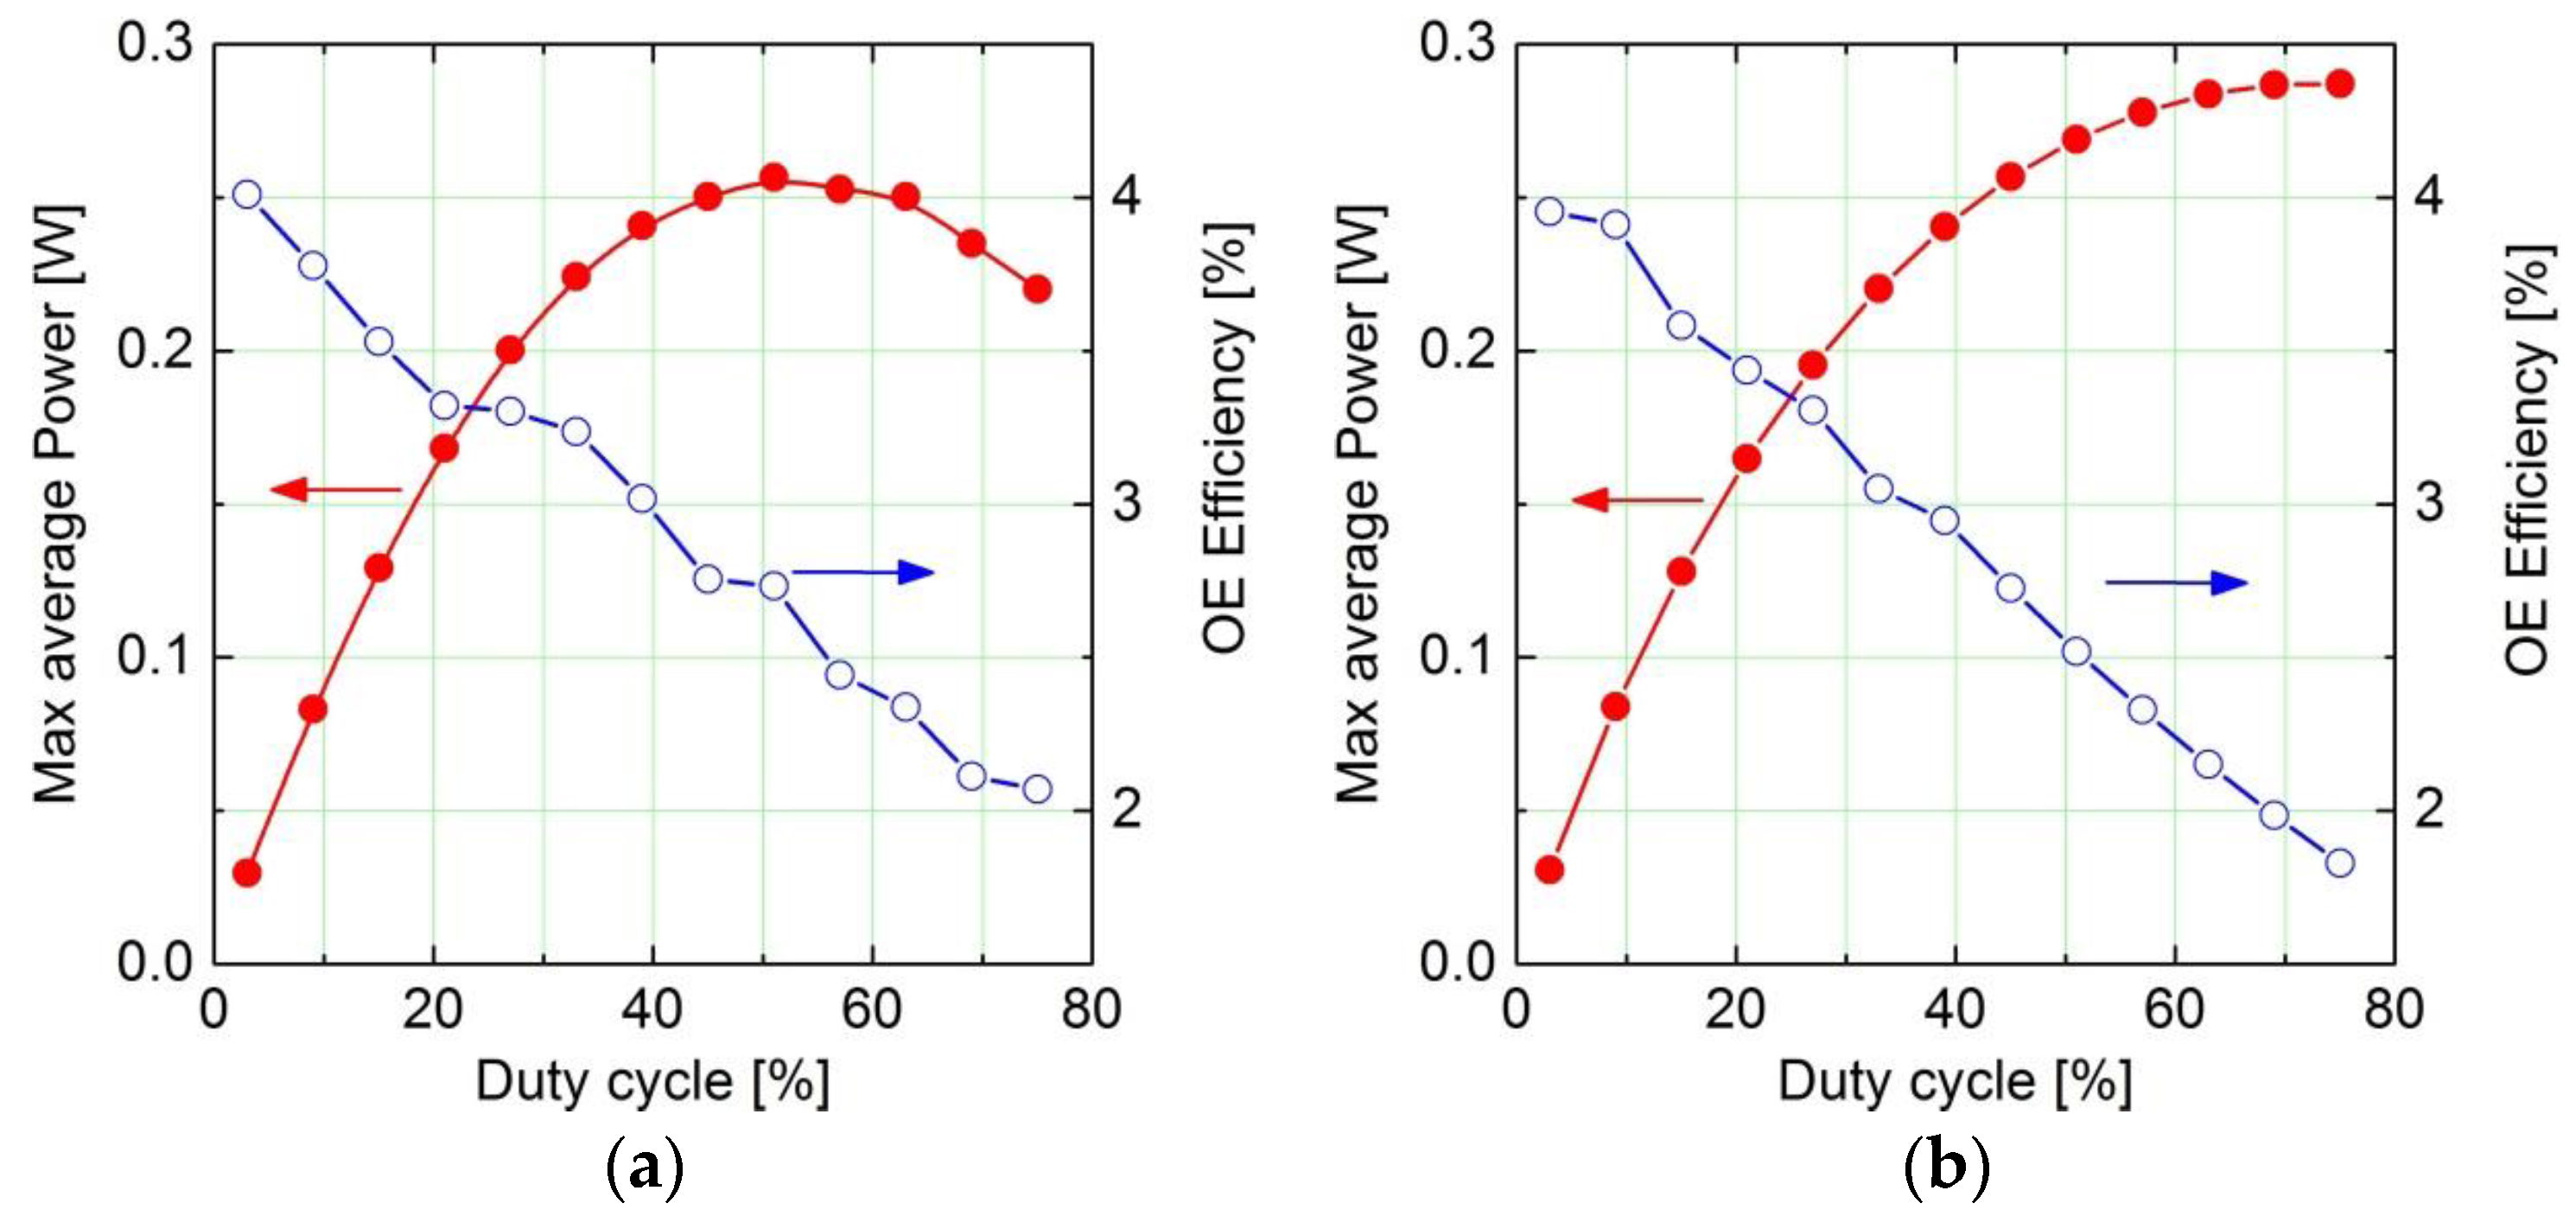
The agreement between experimental and model data is adequate for the purpose of system simulations. Looking at the model data in the light of the limitations mentioned above it is expected that the parabolic approximation is limited to duty cycles up to about 50%.
The variation of the average power as a function of the duty cycle is an electro-optical characteristic of particular interest for applications. This mode of operation allows for the variation of the output power by keeping the amplitude and the duration of the underlying laser pulses fixed.
Figure 9 compares the experimental characteristics with the calculated model values. The comparison of both data sets confirms the limits of the parabolic approximation which are observed in
Figure 7 and
Figure 8.
