Project Report

Investigation of a Dual-Wavelength Solid-State Laser Self-Mixing Vibration Measurement Method

College of Advanced Interdisciplinary Studies, National University of Defense Technology, Changsha 410073, China
*
Authors to whom correspondence should be addressed.
These authors contributed equally to this work.
Photonics 2026, 13(9), 808; https://doi.org/10.3390/photonics13090808
Submission received: 8 July 2026 / Revised: 17 August 2026 / Accepted: 19 August 2026 / Published: 24 August 2026
(This article belongs to the Special Issue Advancements in Optics and Laser Measurement)

Abstract

To address the contradiction between high resolution and structural complexity in traditional laser self-mixing measurement systems, the co-axial dual-wavelength solid-state laser self-mixing technology was proposed and studied. An LD pumped the Nd:YVO4 crystal and doubled the frequency to generate two wavelengths laser at 1064 nm and 532 nm, and a co-axial dual-wavelength laser self-mixing measurement system was constructed. A 90° phase difference between the two wavelengths was produced by adjusting the angle of incidence of the parallel glass plate. As a result, a set of orthogonal signals was built to distinguish the direction of the displacement for the target. The experiments showed that the measuring system can adapt to different vibration waveforms and that the frequency measurement upper limit can be reached at 7 kHz. The system exhibited high precision in displacement measurement, with an RMS displacement noise of 8.64 nm and a cumulative error of 33.66 nm at a peak-to-peak amplitude of 5000 nm, along with a short-term resolution better than 2 nm.

1. Introduction

In 1963, King and Steward first reported that light scattered from a moving object and re-entering the laser resonant cavity induces periodic modulation of the output power, a phenomenon now referred to as the laser self-mixing effect. Since its discovery, laser self-mixing technology has undergone rapid development and found widespread applications in fields such as precision measurement, mechanical manufacturing, biomedicine, and fiber-optic sensing, driven by its distinct advantages including non-contact operation, compact system architecture, low cost, high sensitivity, and the elimination of external mirrors [1,2,3].
Currently, the laser self-mixing effect has been observed in various laser types, such as gas lasers [4], semiconductor lasers [5,6], vertical-cavity surface-emitting lasers (VCSELs) [7], fiber lasers [8], and solid-state lasers [9]. Systems based on these lasers exhibit distinct characteristics. Among them, semiconductor lasers are often preferred due to their compact size and low cost, yet their measurement stability and accuracy require further improvement. Conversely, solid-state lasers generally offer superior stability and measurement resolution [10]. However, a significant limitation persists. Most existing systems utilizing single-frequency solid-state lasers rely on the conventional self-mixing interference principle. This necessitates incorporating phase modulation via electro-optic crystals or frequency modulation via acousto-optic crystals within the optical path to determine displacement direction and demodulate target motion information. Furthermore, to suppress noise and improve sensitivity, techniques such as multiplexing and differential methods [11,12] are commonly adopted. These approaches inevitably increase system complexity, presenting obstacles to miniaturization and integration. Additionally, the introduction of extra optical components can potentially compromise the system’s inherent measurement accuracy and stability.
To address the contradiction between high resolution and structural complexity inherent in conventional self-mixing measurement systems, this paper proposes a dual-wavelength solid-state laser self-mixing technique. The proposed method eliminates the need for electro-optic crystal modulation to determine the reversal point. Instead, it utilizes dual-wavelength self-mixing signals to construct a set of orthogonal signals for identifying the direction of the target’s displacement.

2. Basic Principle of Self-Mixing Vibration Measurement Using Dual-Wavelength Solid-State Lasers

2.1. Dual-Wavelength Solid-State Laser

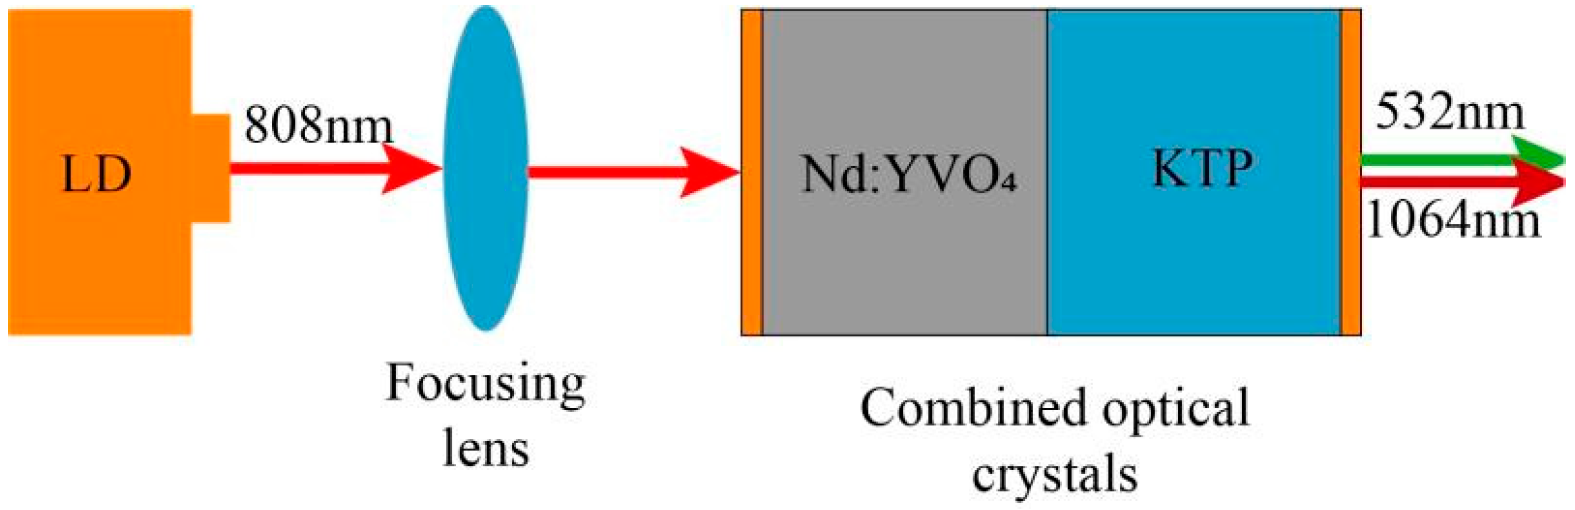
A self-developed dual-wavelength solid-state laser is employed, whose internal optical structure is depicted in Figure 1. It features a compact end-pumped geometry that consists of a semiconductor laser (LD), a focusing lens, and a composite optical crystal. The composite optical crystal is formed by bonding an Nd:YVO4 crystal, which serves as the laser gain medium, with a KTP crystal, which acts as the nonlinear frequency conversion element. To form a monolithic integrated resonant cavity, the two end faces of the crystal are coated: the incident end is coated with an 808 nm anti-reflective film and a 1064 nm high-reflective film, while the exit end is coated with a partial reflective film for both 1064 nm and 532 nm. The laser with an emission wavelength of 808 nm, focused by the lens, pumps the gain crystal Nd:YVO4, generating laser light at 1064 nm. This light is partially converted to 532 nm by the frequency-doubling crystal KTP. Therefore, the laser emitted from the resonant cavity includes two wavelengths: 1064 nm and 532 nm.
In many typical applications, a narrow-band filter is placed at the output end of the solid-state laser to obtain pure 532 nm laser light. However, in single-wavelength self-mixing systems, electro-optic or acousto-optic crystals are indispensable for identifying the displacement direction and reconstructing the displacement. This requirement inevitably complicates the optical path configuration, which is unfavorable for system integration and stability.
By fine-tuning the coating parameters at the output end of a conventional solid-state laser, a common-path output containing both 1064 nm and 532 nm wavelengths can be obtained without requiring an additional narrow-band filter. Subsequently, the displacement direction can be determined from the phase lead-lag relationship between the two wavelengths. Based on this principle, a novel dual-wavelength solid-state laser self-mixing system can be constructed.

2.2. Dual-Wavelength Laser Self-Mixing Effect

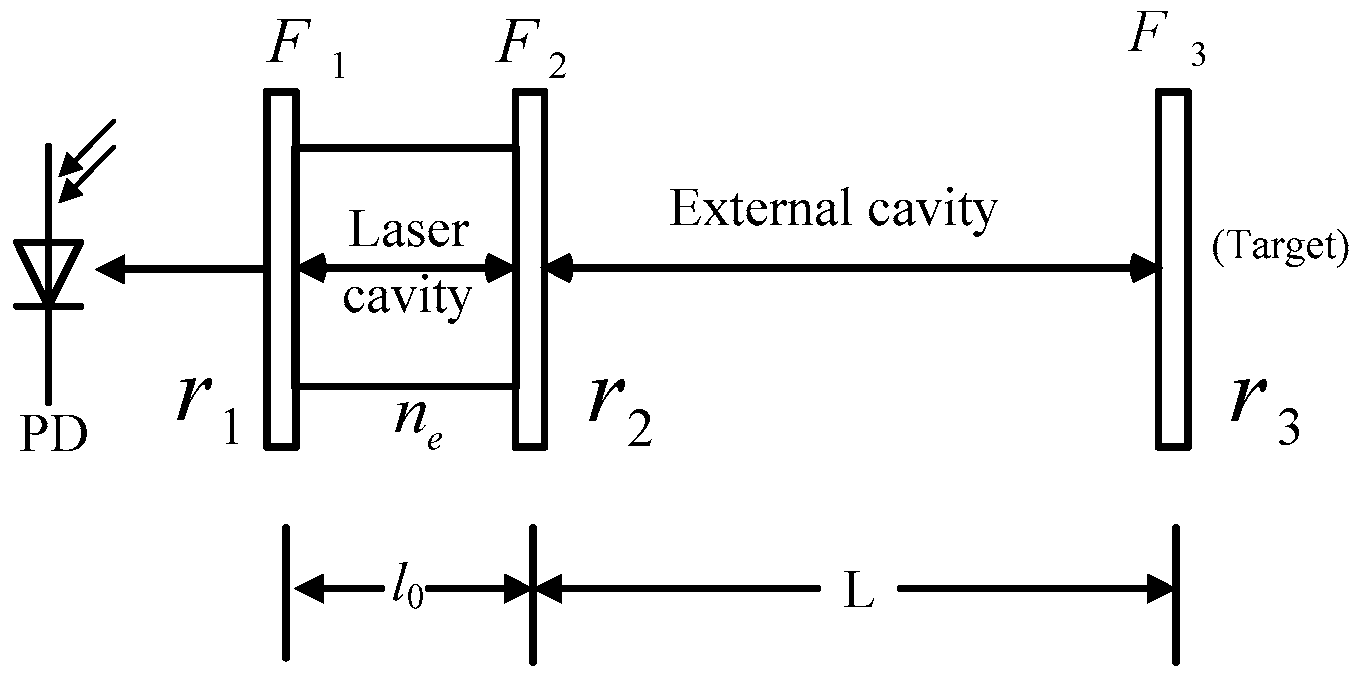
The generation of the 1064 nm laser originates from the interaction between the pump source and the gain medium, and its self-mixing interference conforms to the classical three-mirror Fabry–Perot (F-P) cavity model, as illustrated in Figure 2. In this equivalent model, the entire laser self-mixing interference system is segmented into an internal cavity and an external cavity. The internal cavity constitutes the laser resonator itself, bounded by its two reflective end faces, F 1 and F 2 . The external cavity is formed between the main output end face F 2 of the resonator and an external reflective target F 3 . The amplitude reflection coefficients of the three cavity facets— F 1 , F 2 , and F 3 —are denoted as r 1 , r 2 , and r 3 , respectively. The lengths of the internal and external cavities are represented by l 0 and L , respectively, while n e signifies the complex refractive index within the laser cavity. Based on this three-mirror F-P cavity model [13], we can obtain the following:
ω 0 τ L = ω F τ L + C sin [ ω F τ L + tan 1 α ]
P F = P 0 [ 1 + m cos ( ω F τ L ) ]
ω 0 (where ω 0 = 2 π ν 0 ) is the angular frequency of the light wave in the absence of optical feedback, and ω F (where ω F = 2 π ν F ) is the angular frequency when optical feedback is present. P 0 is the initial output power of the laser without optical feedback, while P F is the output power under optical feedback conditions. m = K b 2 l 0 P 0 is the modulation coefficient, which reflects the fringe contrast of the self-mixing interference effect, where K denotes the proportionality coefficient between the laser output power and the threshold gain, and b represents the coupling coefficient. α is the linewidth enhancement factor of the laser, and C is the optical feedback level coefficient indicating the strength of the optical feedback intensity. In this work, the system consistently operates under the weak feedback regime, i.e., 0 < C < 1 .
Neither the L-K rate equation model nor the three-mirror F-P cavity model is directly applicable to describing the self-mixing effect for the 532 nm laser, since the 532 nm laser is generated as a second-harmonic field via intracavity frequency doubling of the 1064 nm fundamental wave and does not interact directly with the gain medium. To address this, the self-mixing modulation mechanism under intracavity frequency-doubling conditions is analyzed herein using the rotating vector superposition method.
The cavity field of the second-harmonic laser in the self-mixing resonant cavity is denoted as E = E e i ω t , where is the amplitude of the output from the resonant cavity’s output coupler. This output beam propagates to the surface of the external target, where it undergoes reflection or scattering. The resulting feedback light then re-enters the resonant cavity, propagates back and forth within the internal cavity, and finally returns to the surface of the output coupler. This completes the feedback optical field, denoted as E f . According to the rotating vector superposition method, the relationship between the feedback field and the original cavity field can be derived. E f is given by the following:
E f = a E e i ( 2 k L + 2 k n l 0 )
a is the amplitude of the feedback light after its round-trip propagation relative to the amplitude of the light emitted from the resonant cavity. In self-mixing measurements, the feedback light intensity is typically required to be maintained at a low level, i.e., a 1 .
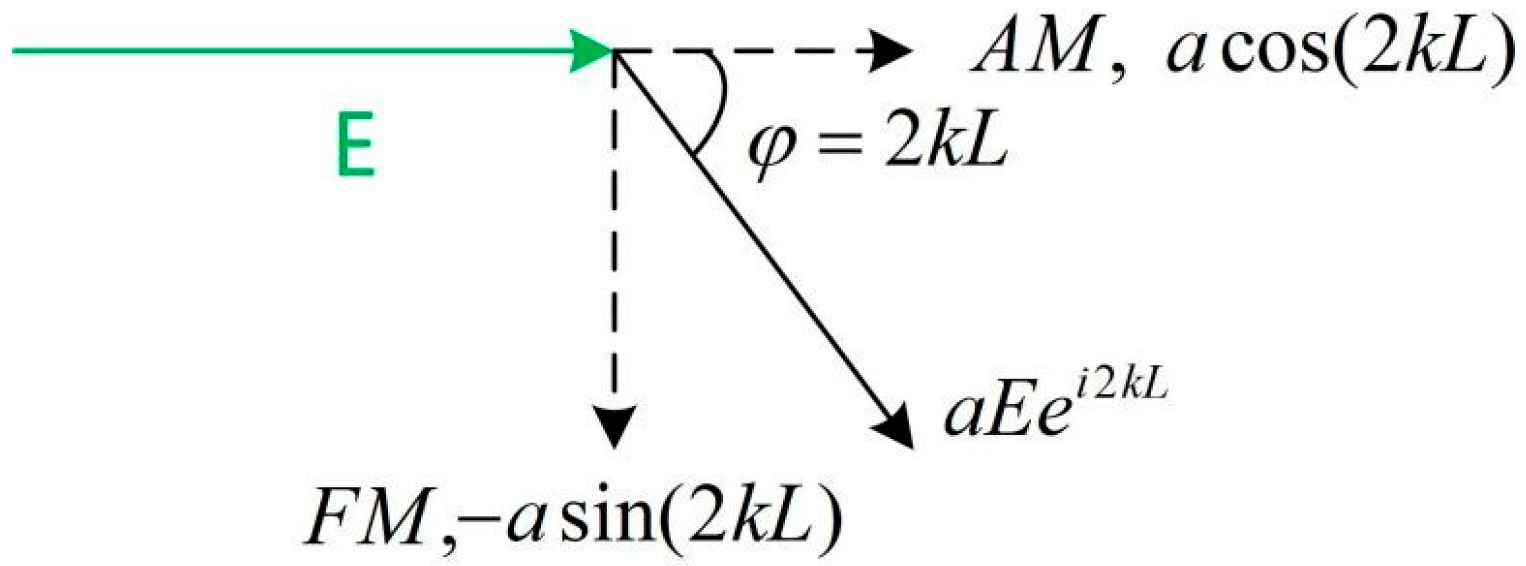
According to the rotating vector superposition theory, both the amplitude and frequency of the original optical field E will be modulated by the phase change of the feedback optical field E f relative to E , as illustrated in Figure 3. In self-mixing measurements, the length L of the external cavity changes, while the length of the internal resonant cavity remains constant. That is, the phase term 2 k L serves as the perturbation variable, whereas the phase term 2 k n l 0 remains invariant in the feedback optical field E f . Only the additional phase shift introduced by the round-trip propagation of light in the external cavity modulates the amplitude and frequency of the original optical field E .
Therefore, the disturbance introduced by the feedback optical field E f to the original optical field E is denoted as a E e i 2 k L , where θ is the phase shift induced by the external cavity round-trip propagation. According to the principle of rotating vector superposition, the resultant perturbation in the amplitude of a E e i 2 k L is a cos ( 2 k L ) , while the perturbation in its phase angle is a sin ( 2 k L ) .
By combining the amplitude and phase modulation increments introduced by the feedback optical field E f onto the original cavity field E with the established expression for the amplitude of the frequency-doubled cavity field E 2 in the absence of optical feedback, the comprehensive expressions describing the amplitude and phase variations of the total cavity field under optical feedback conditions can be derived. The resulting governing equations are given by the following:
d E d t = E 2 - E t R + a E c o s ( 2 k L ) t L
d ψ d t = ω 0 a sin ( 2 k L ) t L
t R represents the time required for light to travel back and forth through the resonant cavity once, and t L represents the time required for the feedback light to complete one round trip within the external cavity.
Under steady-state conditions, d E / d t = 0 , from Equation (4), we can obtain the following:
E = E 2 1 a ( t R / t L ) cos ( 2 k L )
Since a < < 1 , Equation (6) can be written as follows:
E = E 2 [ 1 + a ( t R / t L ) cos ( 2 k L ) ]
From Equation (7), the modulation effect of the feedback light on the optical power can be obtained as follows:
P F = P 0 [ 1 + 2 a ( t R / t L ) cos ( 2 k L ) ]
P 0 is the initial output power at 532 nm without optical feedback, which depends primarily on the intracavity 1064 nm power and the frequency-doubling efficiency. Notably, a higher doubling efficiency leads to a stronger 532 nm self-mixing signal amplitude. P F is the output power at 532 nm under optical feedback conditions.
Here, a < < 1 , and the second-order small quantity is neglected after the squaring operation. The modulation coefficient is defined as follows:
m = 2 a τ R τ L
Substituting Equation (9) into Equation (8) yields the following:
P F = P 0 [ 1 + m cos ( 2 k L ) ]
Equation (10) represents the self-mixing intensity modulation formula, which indicates that after the feedback light returns to the interior of the resonant cavity, it carries phase information related to the external cavity length L , thereby modulating the output power of the laser.
Meanwhile, the frequency of the laser is also modulated by the feedback light that carries this phase information, as can be derived from Equation (5).
ω F t L = ω 0 t L a sin ( 2 k L )
The above equation is the self-mixing frequency modulation equation.
Expressing the phase delay values in Equations (10) and (11) in terms of angular frequency yields the following:
2 k L = 2 ω F L / c = ω F t L
The modulation model of feedback light on laser power and frequency can be obtained by substituting Equation (12) into Equations (10) and (11):
ω 0 t L = ω F t L + C sin ( ω F t L )
P F = P 0 [ 1 + m cos ( ω F t L ) ]
A comparison of Equations (13) and (14) with Equations (1) and (2) reveals that the mathematical forms of the self-mixing models for the 532 nm and 1064 nm lasers are identical. The key distinction lies solely in the physical interpretation of their respective modulation coefficients. Equations (2) and (9) indicate that the two modulation coefficients differ in their physical interpretations. However, they both characterize the feedback-induced variation in output intensity—one via the coupling coefficient b, and the other via the time constant t L . In the 1064 nm laser’s self-mixing model, the feedback light directly interacts with and perturbs the gain medium within the cavity. Conversely, in the 532 nm laser’s model, the feedback light does not interact with the gain medium. Instead, for the frequency-doubled laser, the self-mixing effect can be interpreted as a perturbation of the original intracavity second-harmonic field by the returning feedback light.

2.3. Dual-Wavelength Solid-State Laser Self-Mixing Vibration Measurement System

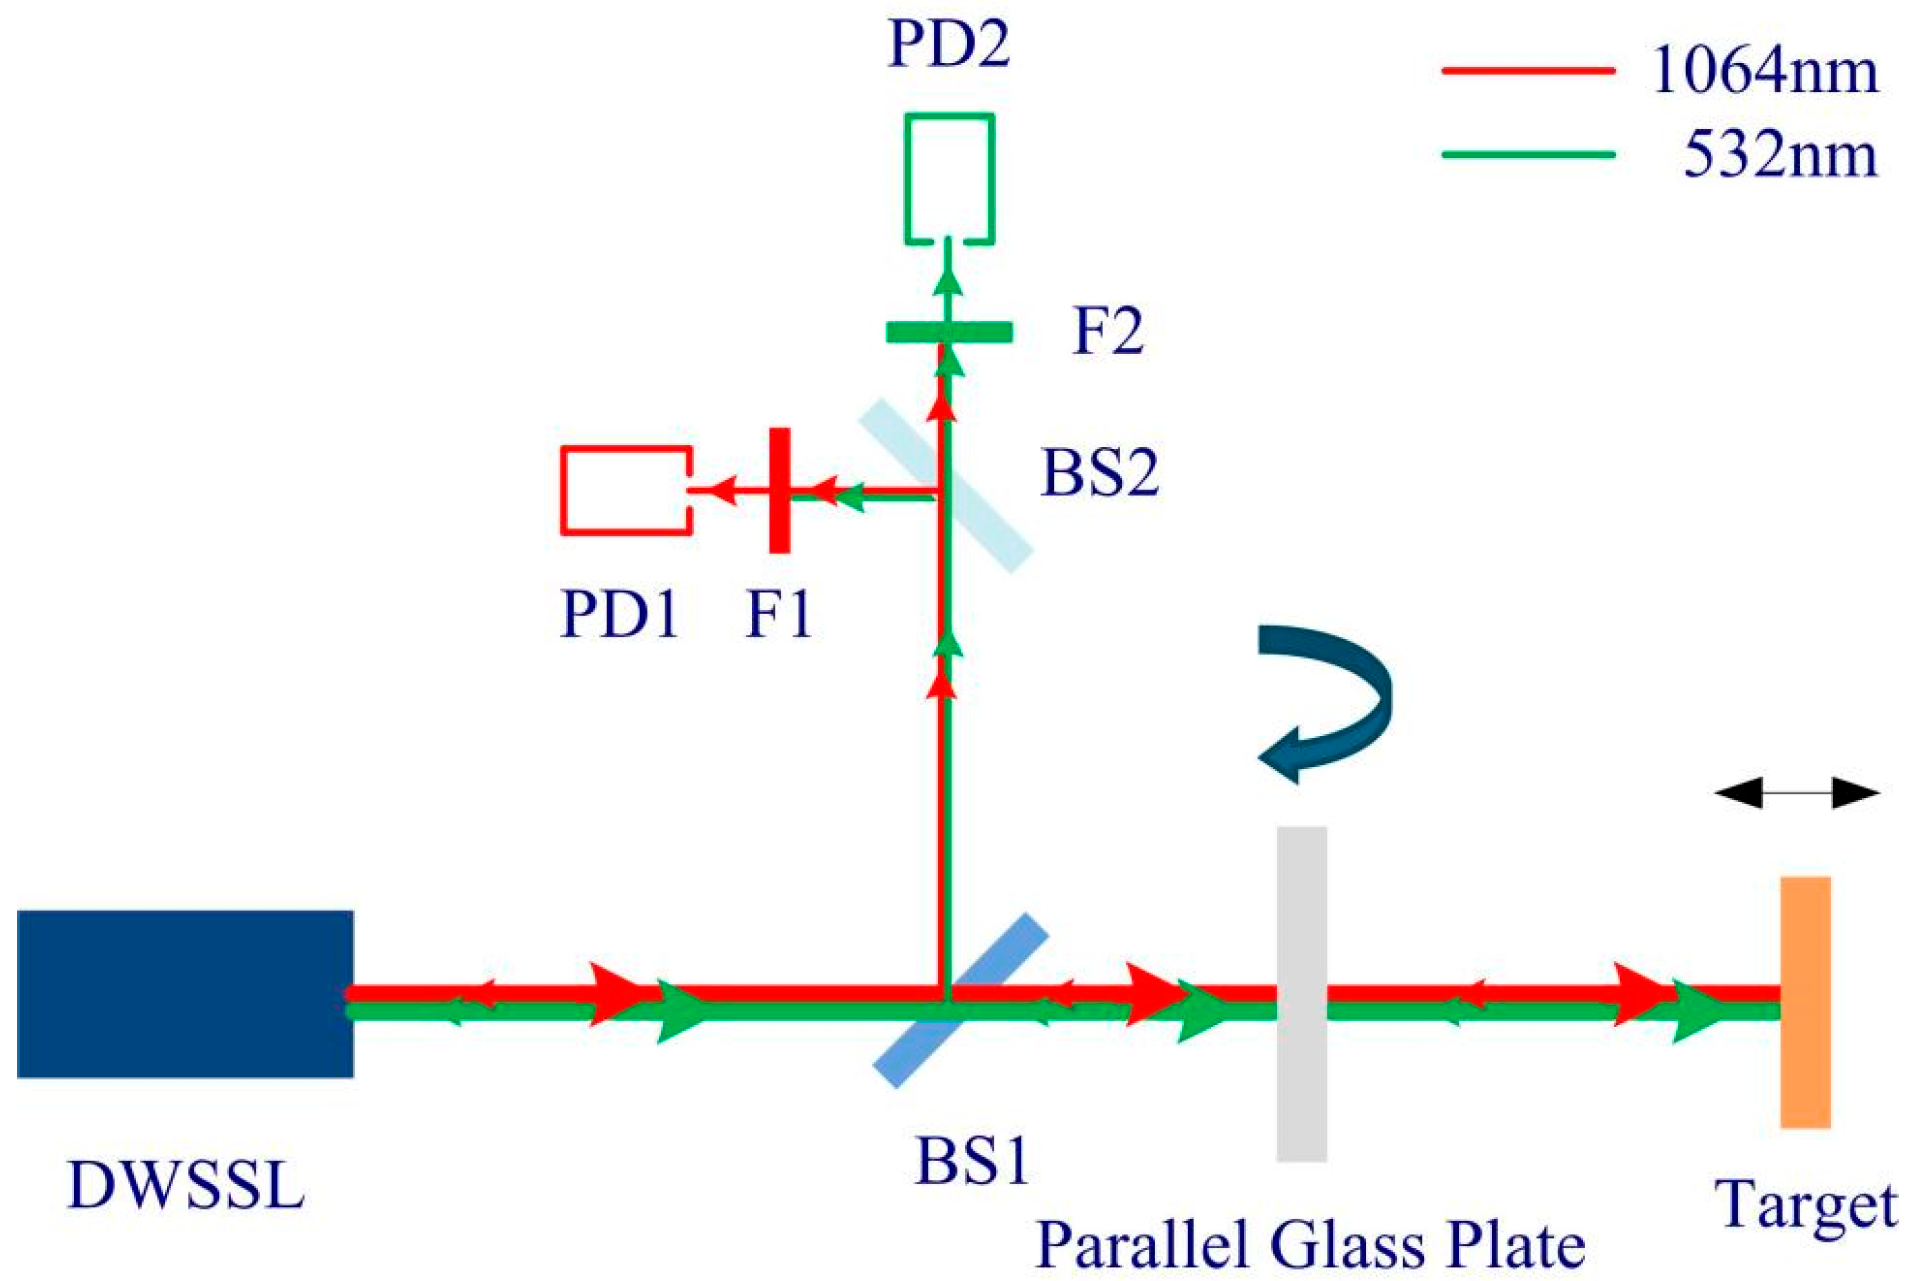
The optical configuration of the dual-wavelength solid-state laser self-mixing vibration measurement system (SVMS) is illustrated in Figure 4. The laser outputs a common-path beam containing both 532 nm and 1064 nm wavelengths. This beam is divided by a broadband beam splitter (BS1) into transmitted and reflected portions at a ratio of 9:1. The transmitted light passes through a parallel glass plate and then irradiates the target. The light scattered back along the original path re-enters the laser cavity via the glass plate and BS1, inducing the self-mixing effect. The light reflected by BS1 is further split by another broadband beam splitter (BS2) at a 1:1 ratio. The two resulting beams pass through narrow-band filters centered at 532 nm and 1064 nm, respectively, before being incident onto their corresponding detectors for photoelectric conversion.
The optical powers on Detector 1 and Detector 2 are given by the following:
P F 1 = P 01 { 1 + m 1 cos [ 2 k 1 ( L d + n 1 d + Δ L 1 ) ] }
P F 2 = P 02 { 1 + m 2 cos [ 2 k 2 ( L d + n 2 d + Δ L 2 ) ] }
Here, P 01 and P 02 are the initial optical powers of the 1064 nm and 532 nm laser outputs without optical feedback, respectively; P F 1 and P F 2 are the optical powers of the 1064 nm and 532 nm laser outputs with optical feedback, respectively; m 1 and m 2 are the modulation coefficients of the self-mixing systems for the 1064 nm and 532 nm lasers, respectively; k 1 and k 2 are the wave vectors of the 1064 nm and 532 nm lasers, respectively. Δ L 1 and Δ L 2 denote the optical path changes for the 1064 nm and 532 nm wavelengths, respectively, when the glass plate is rotated by an angle θ about its center. Their expressions are as follows:
Δ L 1 = d n 1 2 sin 2 θ n 1 d + d d cos θ
Δ L 2 = d n 2 2 sin 2 θ n 2 d + d d cos θ
Meanwhile, under the weak feedback condition, we have the following:
2 k 1 k 2
After applying high-pass filtering and normalization to the raw signals output from the detectors, and substituting Equation (19), Equations (15) and (16) can be simplified as follows:
P F 1 = cos [ 2 k 1 ( L d + n 1 d + Δ L 1 ) ]
P F 2 = cos [ 4 k 1 ( L d + n 2 d + Δ L 2 ) ]
After applying square processing to P F 1 , we obtain the following:
P F 1 = cos 2 [ 2 k 1 ( L d + n 1 d + Δ L 1 ) ] = 1 + cos [ 4 k 1 ( L d + n 1 d + Δ L 1 ) ] 2
After applying high-pass filtering and normalization to P F 1 again, we obtain the following:
P F 1 = cos [ 4 k 1 ( L d + n 1 d + Δ L 1 ) ]
Substituting Equation (17) into Equation (23) and Equation (18) into Equation (21), respectively, we obtain the following:
P 1 = cos [ 4 k 1 ( L + d n 1 2 sin 2 θ d cos θ ) ]
P 2 = cos [ 4 k 1 ( L + d n 2 2 sin 2 θ d cos θ ) ]
From Equations (24) and (25), the phase difference between the processed self-mixing signals corresponding to the 1064 nm and 532 nm wavelengths can be obtained:
Φ = 4 k 1 d ( n 2 2 sin 2 θ n 1 2 sin 2 θ )
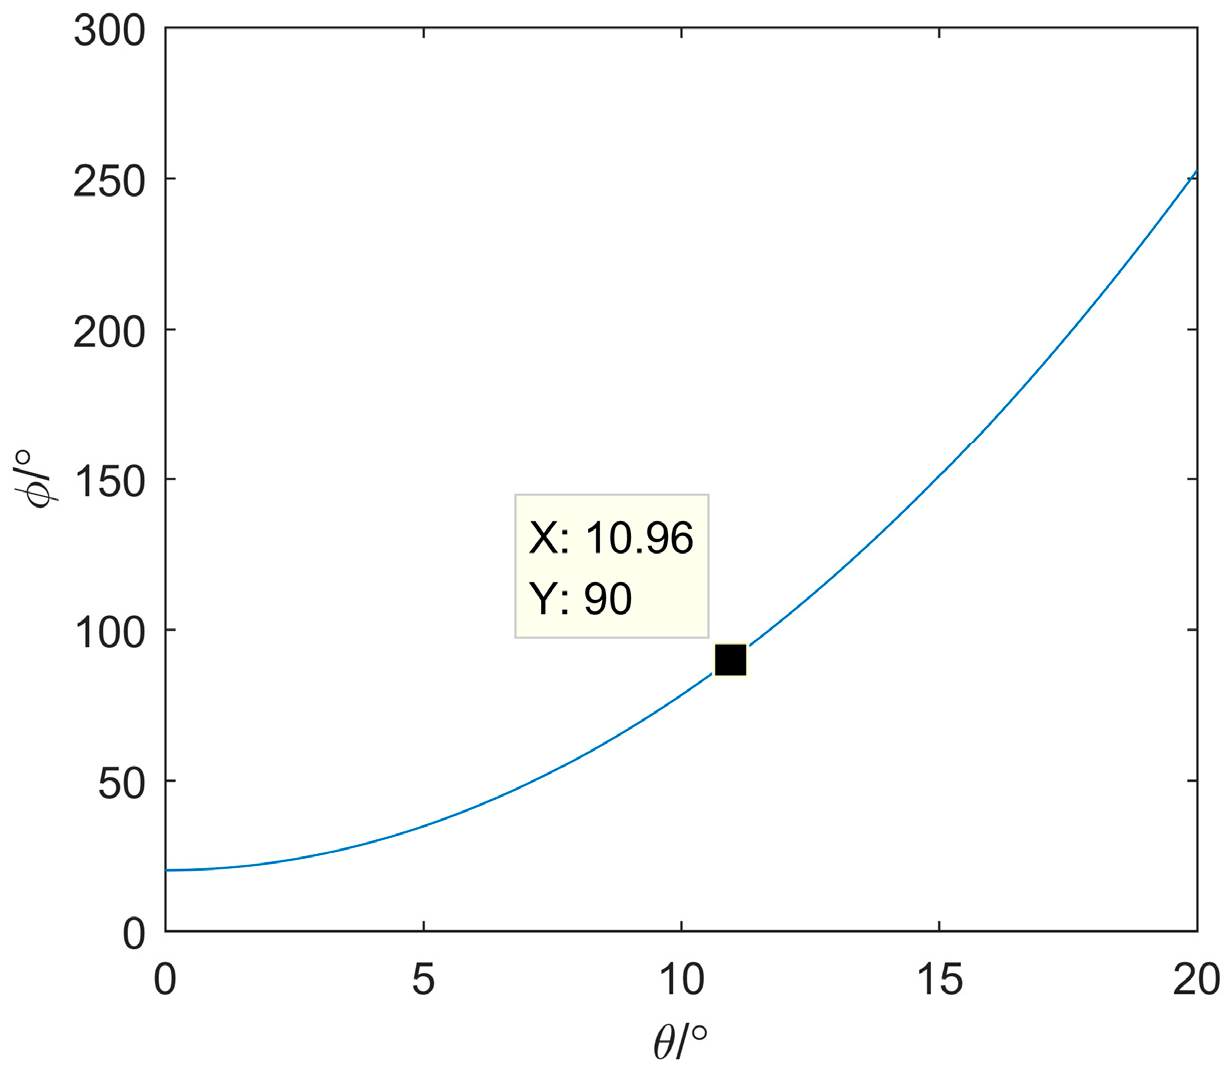
From Equation (26), the phase difference between the two signals is closely related to the incident angle θ of the laser beam. Their relationship is illustrated in Figure 5. In the actual system, the incident angle θ can be adjusted by rotating the glass plate to set the phase difference between the two signals to π 2 (discarding integer multiples of 2 π ). Under this condition, Equation (25) can be simplified to the following:
P 2 = sin [ 4 k 1 ( L + d n 1 2 sin 2 θ d cos θ ) ]
When L = L + d n 1 2 sin 2 θ d cos θ , Equations (24) and (27) can be simplified as follows:
P 1 = cos ( 4 k 1 L )
P 2 = sin ( 4 k 1 L )
Therefore, according to Equations (28) and (29), the phase corresponding to the optical length of the external cavity can be obtained as follows:
φ ( t ) = 4 k 1 L = arctan ( P 2 P 1 )
Furthermore, the phase induced by the displacement of the target to be measured is given by the following:
φ ( t ) = 2 π λ 2 2 L ( t )
By combining Equations (30) and (31), we obtain the following:
L ( t ) = λ 2 φ ( t ) 4 π = λ 2 4 π arctan ( P 2 P 1 )
Considering the characteristics of the arctangent function, φ ( t ) is constrained within the interval ( π 2 , π 2 ) . When the displacement of the target to be measured is relatively large, the phase induced by the displacement exceeds one period, and phase unwrapping is required. Let the following be established:
φ ( t ) = P U ( φ ( t ) )
Here, P U represents the phase unwrapping function. Then, Equation (20) can be modified as follows:
L ( t ) = λ 2 φ ( t ) 4 π
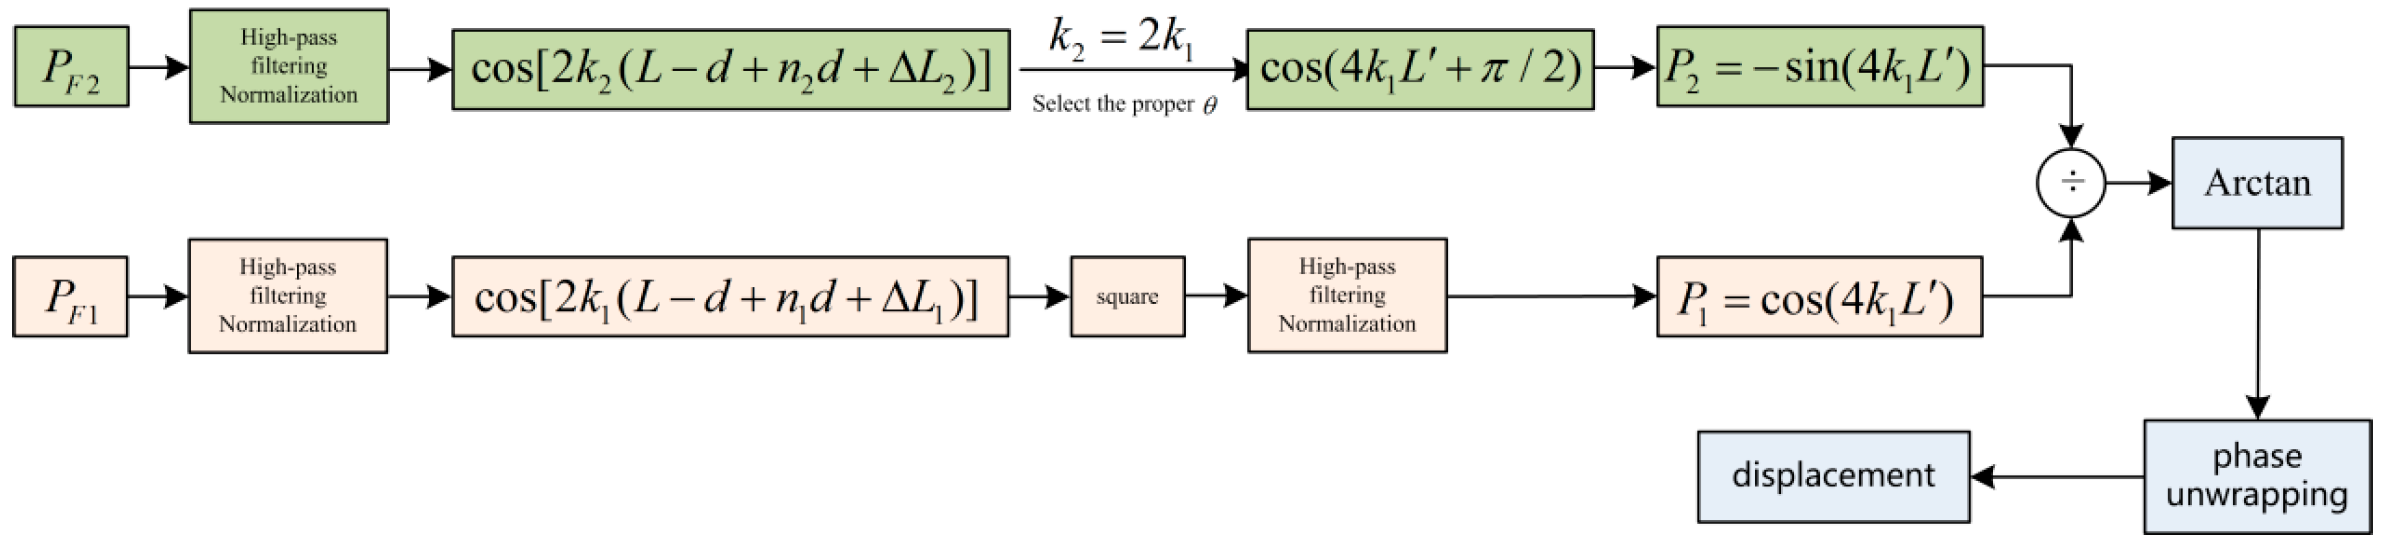
From Equation (34), the displacement information of the target can be obtained. This constitutes the principal formula of the dual-wavelength solid-state laser SVMS. The specific signal processing flow of the system is shown in Figure 6.

3. Experimental Results and Analysis

3.1. Experimental System Setup

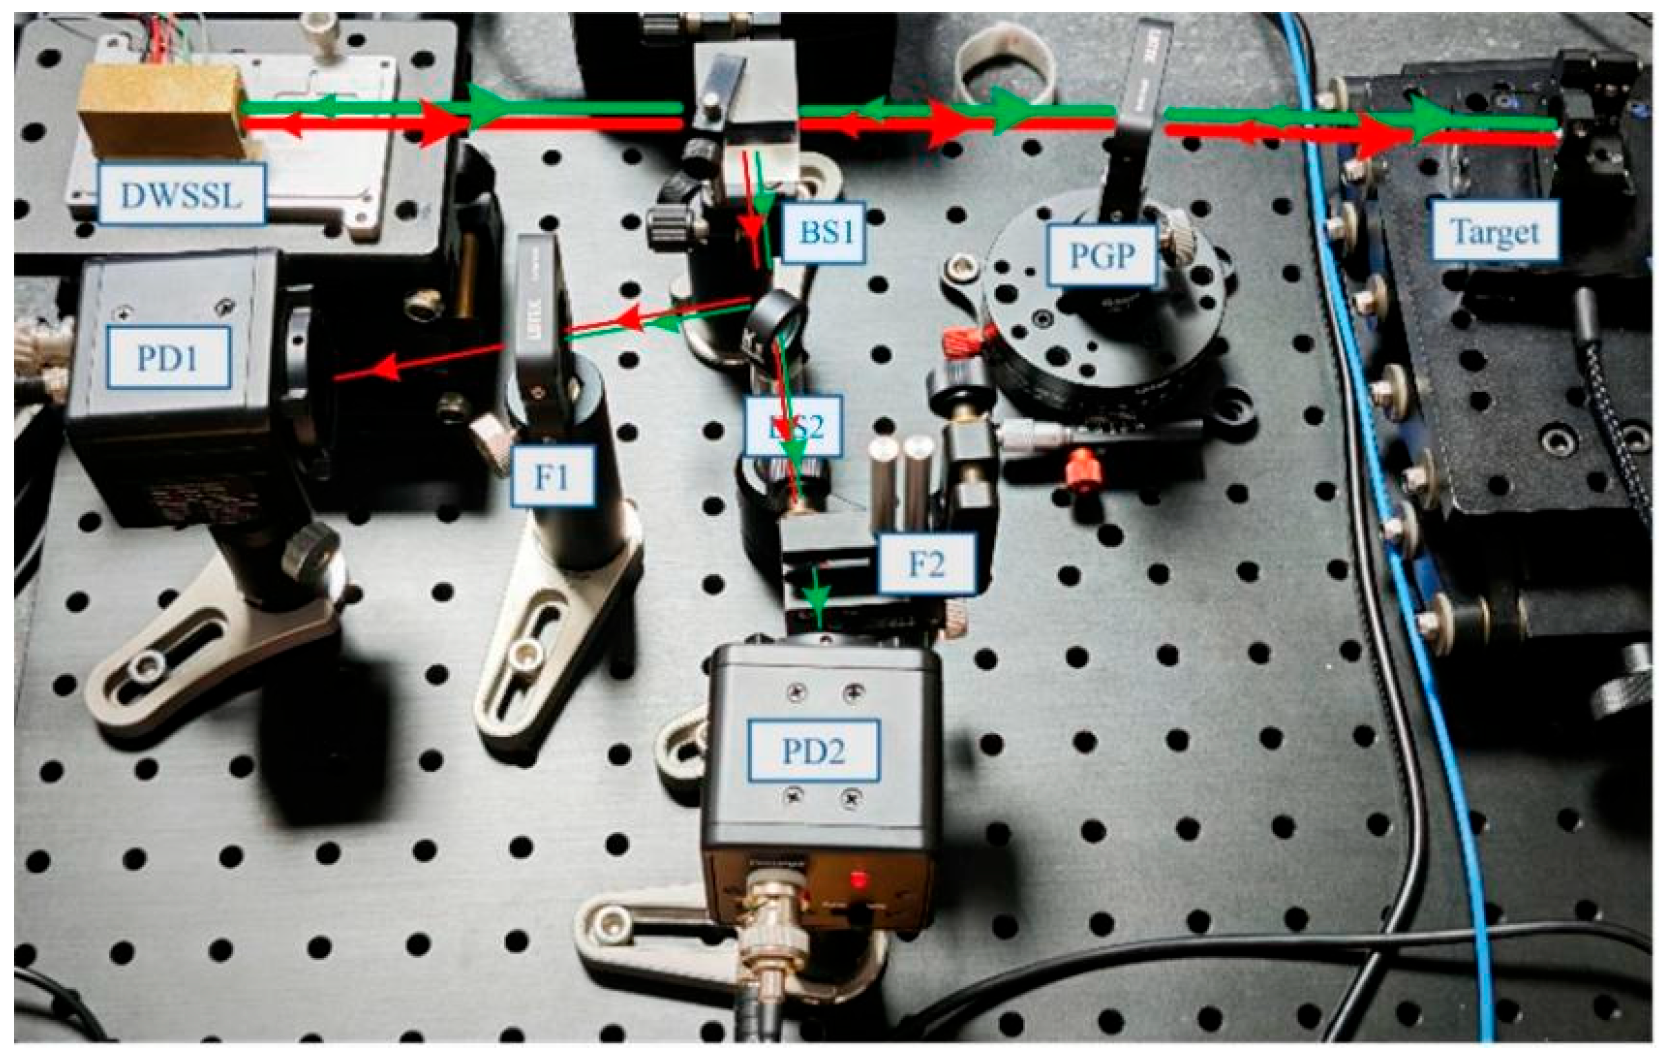
A dual-wavelength solid-state laser self-mixing vibration measurement experimental system was constructed according to the optical configuration shown in Figure 4, with a photograph of the actual setup presented in Figure 7.
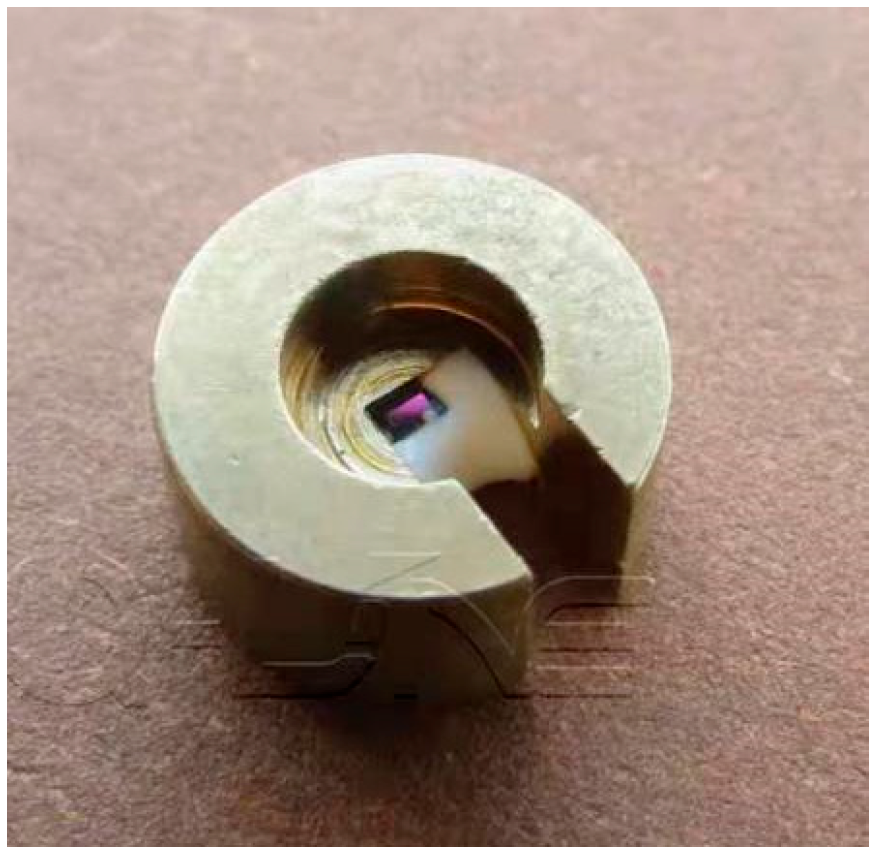
In this system, the light source is a self-developed dual-wavelength solid-state laser emitting at 1064 nm (5.20 mW) and 532 nm (0.34 mW). The reported optical powers refer to the respective optical powers before splitting. The two core devices in the dual-wavelength solid-state laser are the laser diode (LD) and the composite optical crystal. Table 1 lists the key performance parameters of the LD. The composite optical crystal consists of an Nd:YVO4 gain crystal and a KTP frequency-doubling crystal, with external dimensions of 0.8 mm × 0.8 mm × 2.5 mm. The input end face of the crystal is coated with a dielectric film that provides high transmittance at 808 nm (T > 98%), while simultaneously offering high reflectivity at both 1064 nm and 532 nm (R > 99.8%). The output end face is coated with a dielectric film that provides high reflectivity at 1064 nm (R ≈ 92%) and high transmittance at 532 nm (R ≈ 95%). The SHG conversion coefficient can reach up to 30%. A photograph of the actual crystal is shown in Figure 8.
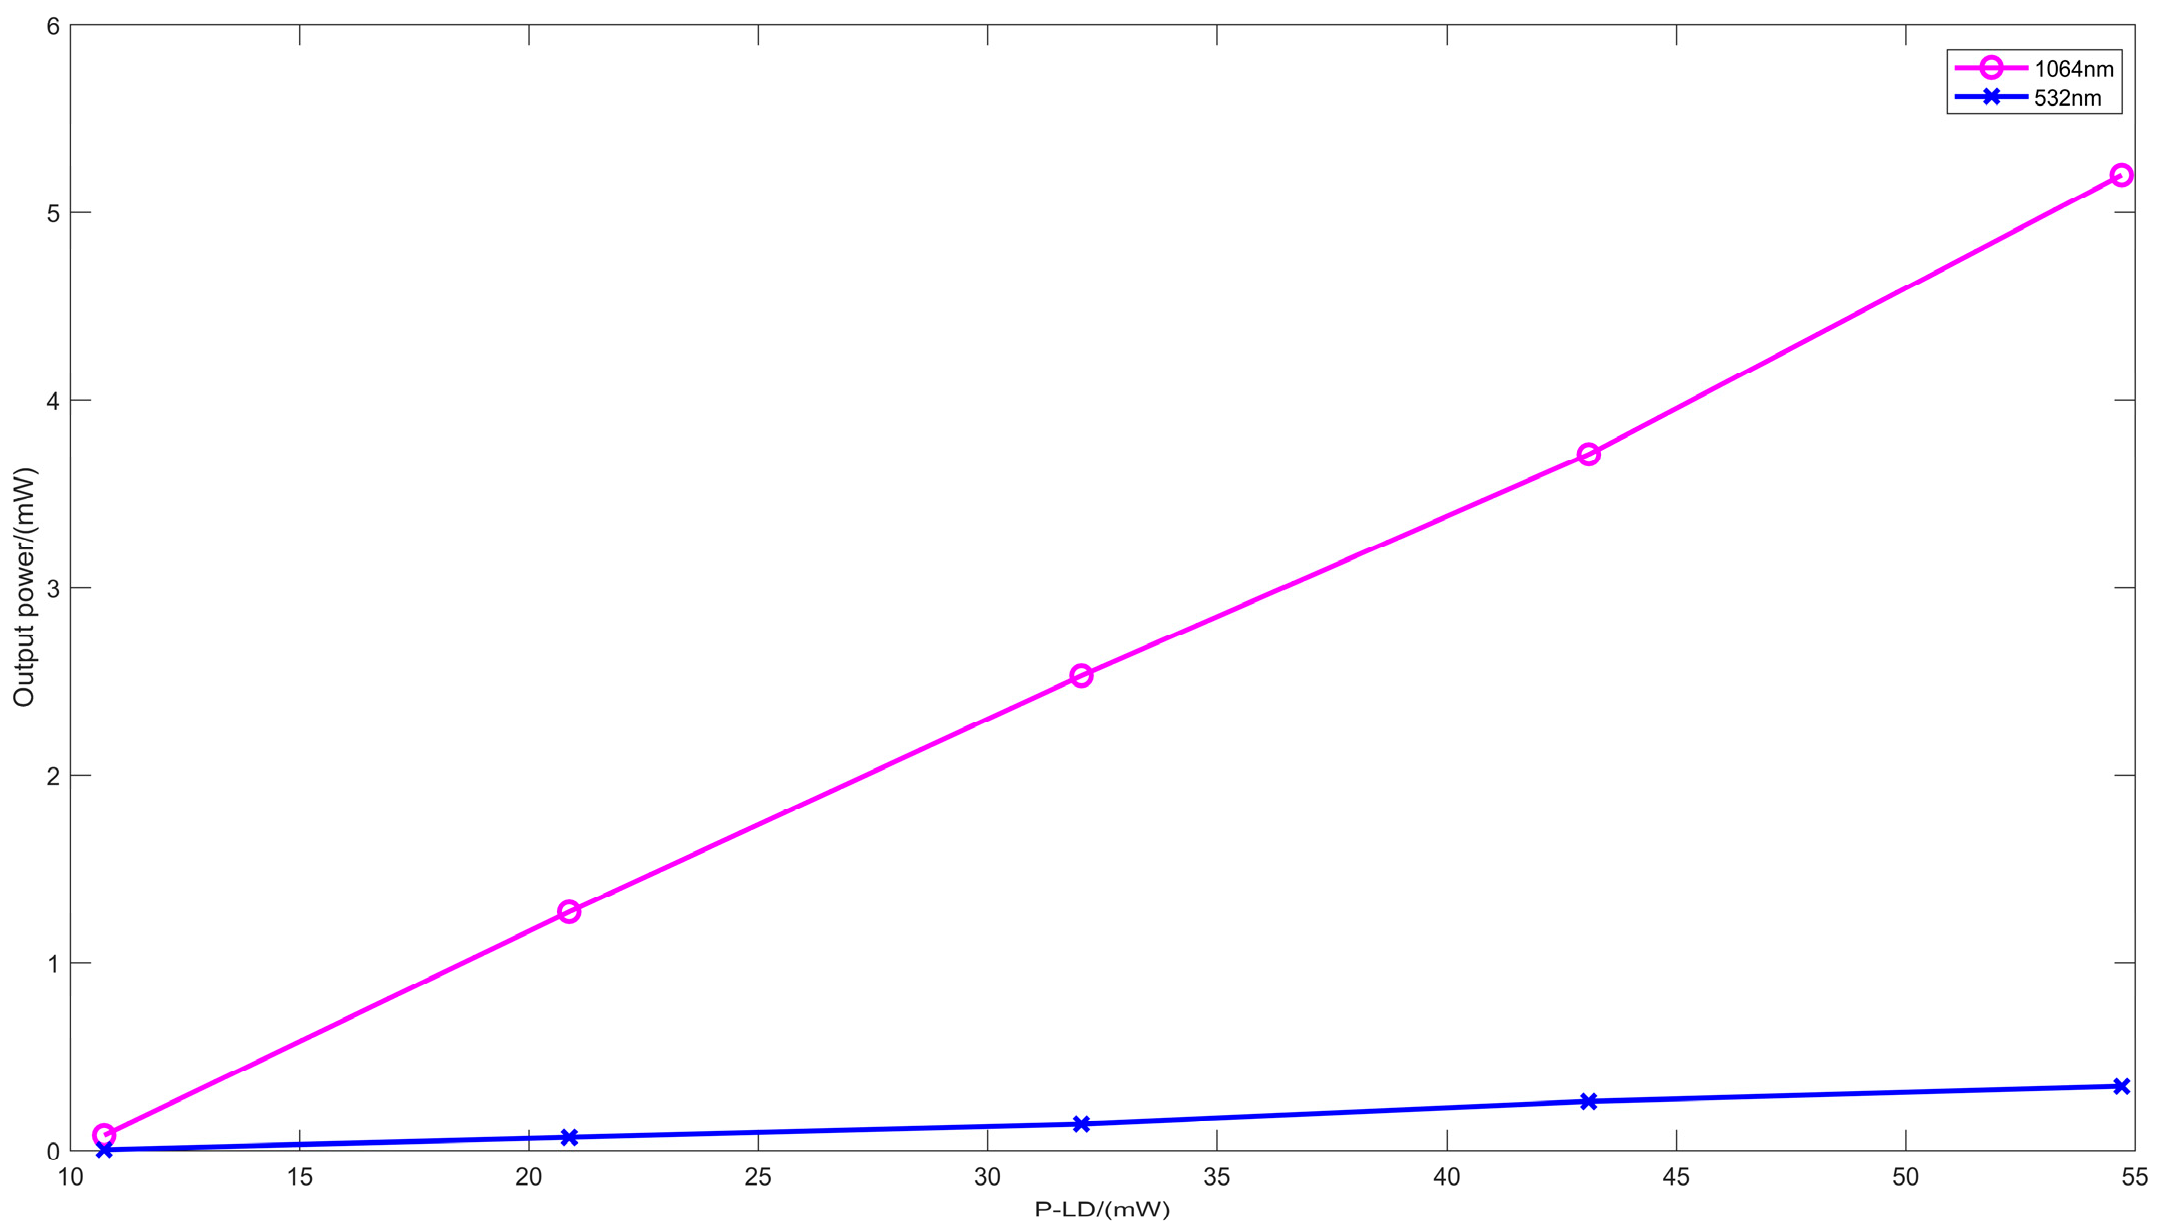
To ensure that both output wavelengths of the laser operate in single-longitudinal-mode, the laser can only be operated at low temperature and low driving current under the current laser configuration. At an operating temperature of 16 °C and without the external feedback mirror F3, the output powers of the two wavelengths as a function of the pump power, with the driving current increasing from 0.16 A to 0.20 A, are shown in Figure 9.
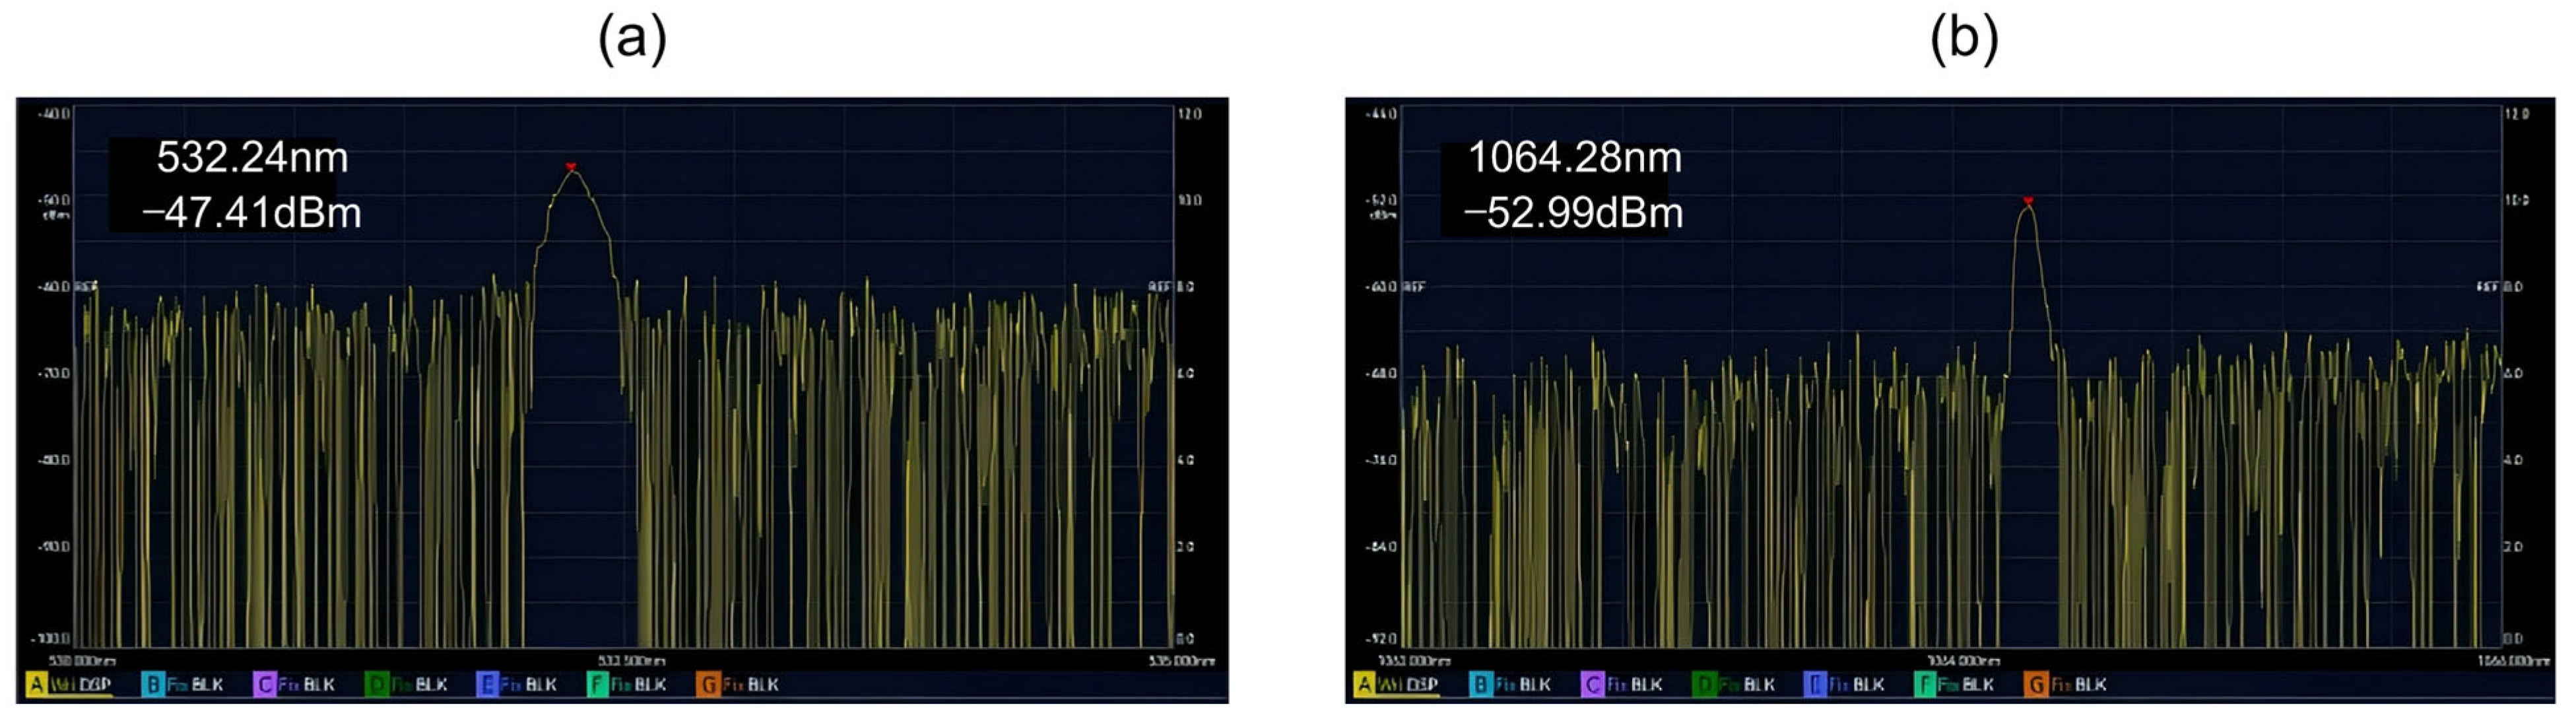
Both laser beams of the two wavelengths operate in a single-longitudinal-mode regime (Figure 10). The two beam splitters have transmission-to-reflection ratios of 9:1 and 1:1, respectively. The vibration measurement target is a mirror (R ≈ 93% at both 1064 nm and 532 nm) placed on a piezoelectric translation stage, with a distance of approximately 0.3 m from the laser. The piezoelectric translation stage features a closed-loop displacement resolution of 1 nm, a motion range of ±15 μm, and a load capacity of 8 kg. The main measurement performance of the system was evaluated against the displacement set by the piezoelectric translation stage as a reference.
Two photodetectors employed were silicon avalanche photodiode modules (Model PD-SAF-400A005, Lubon Optoelectronics, Changsha, China) with a wavelength response range of 400–1100 nm, a photosensitive surface diameter of 0.2 mm, a noise equivalent power of 0.64 p W / H z , and a bandwidth of 385 MHz. A 3-mm-thick parallel glass plate (Model OW11 window, Lubon Optoelectronics, Changsha, China) was used to adjust the phase difference between the two wavelengths’ self-mixing signals. The photodetected electrical signals were acquired by a data acquisition card with a maximum sampling rate of 40 MHz and a noise standard deviation of 0.3 mV. The sampling frequency in the experiment was set at 1 MHz.
In Ref. [14], the relationship curve between displacement and phase difference in a dual-wavelength solid-state laser self-mixing vibrometer system is presented, and the permissible range of phase difference variation for different displacement measurement accuracies is discussed. Taking a displacement measurement error of less than 2 nm as an example, the allowable phase difference range is given as (86.2°, 94.3°). According to Equation (26), the corresponding allowable range of phase differences is 2.9986–3.0016 mm.

3.2. Experimental Results and Discussion

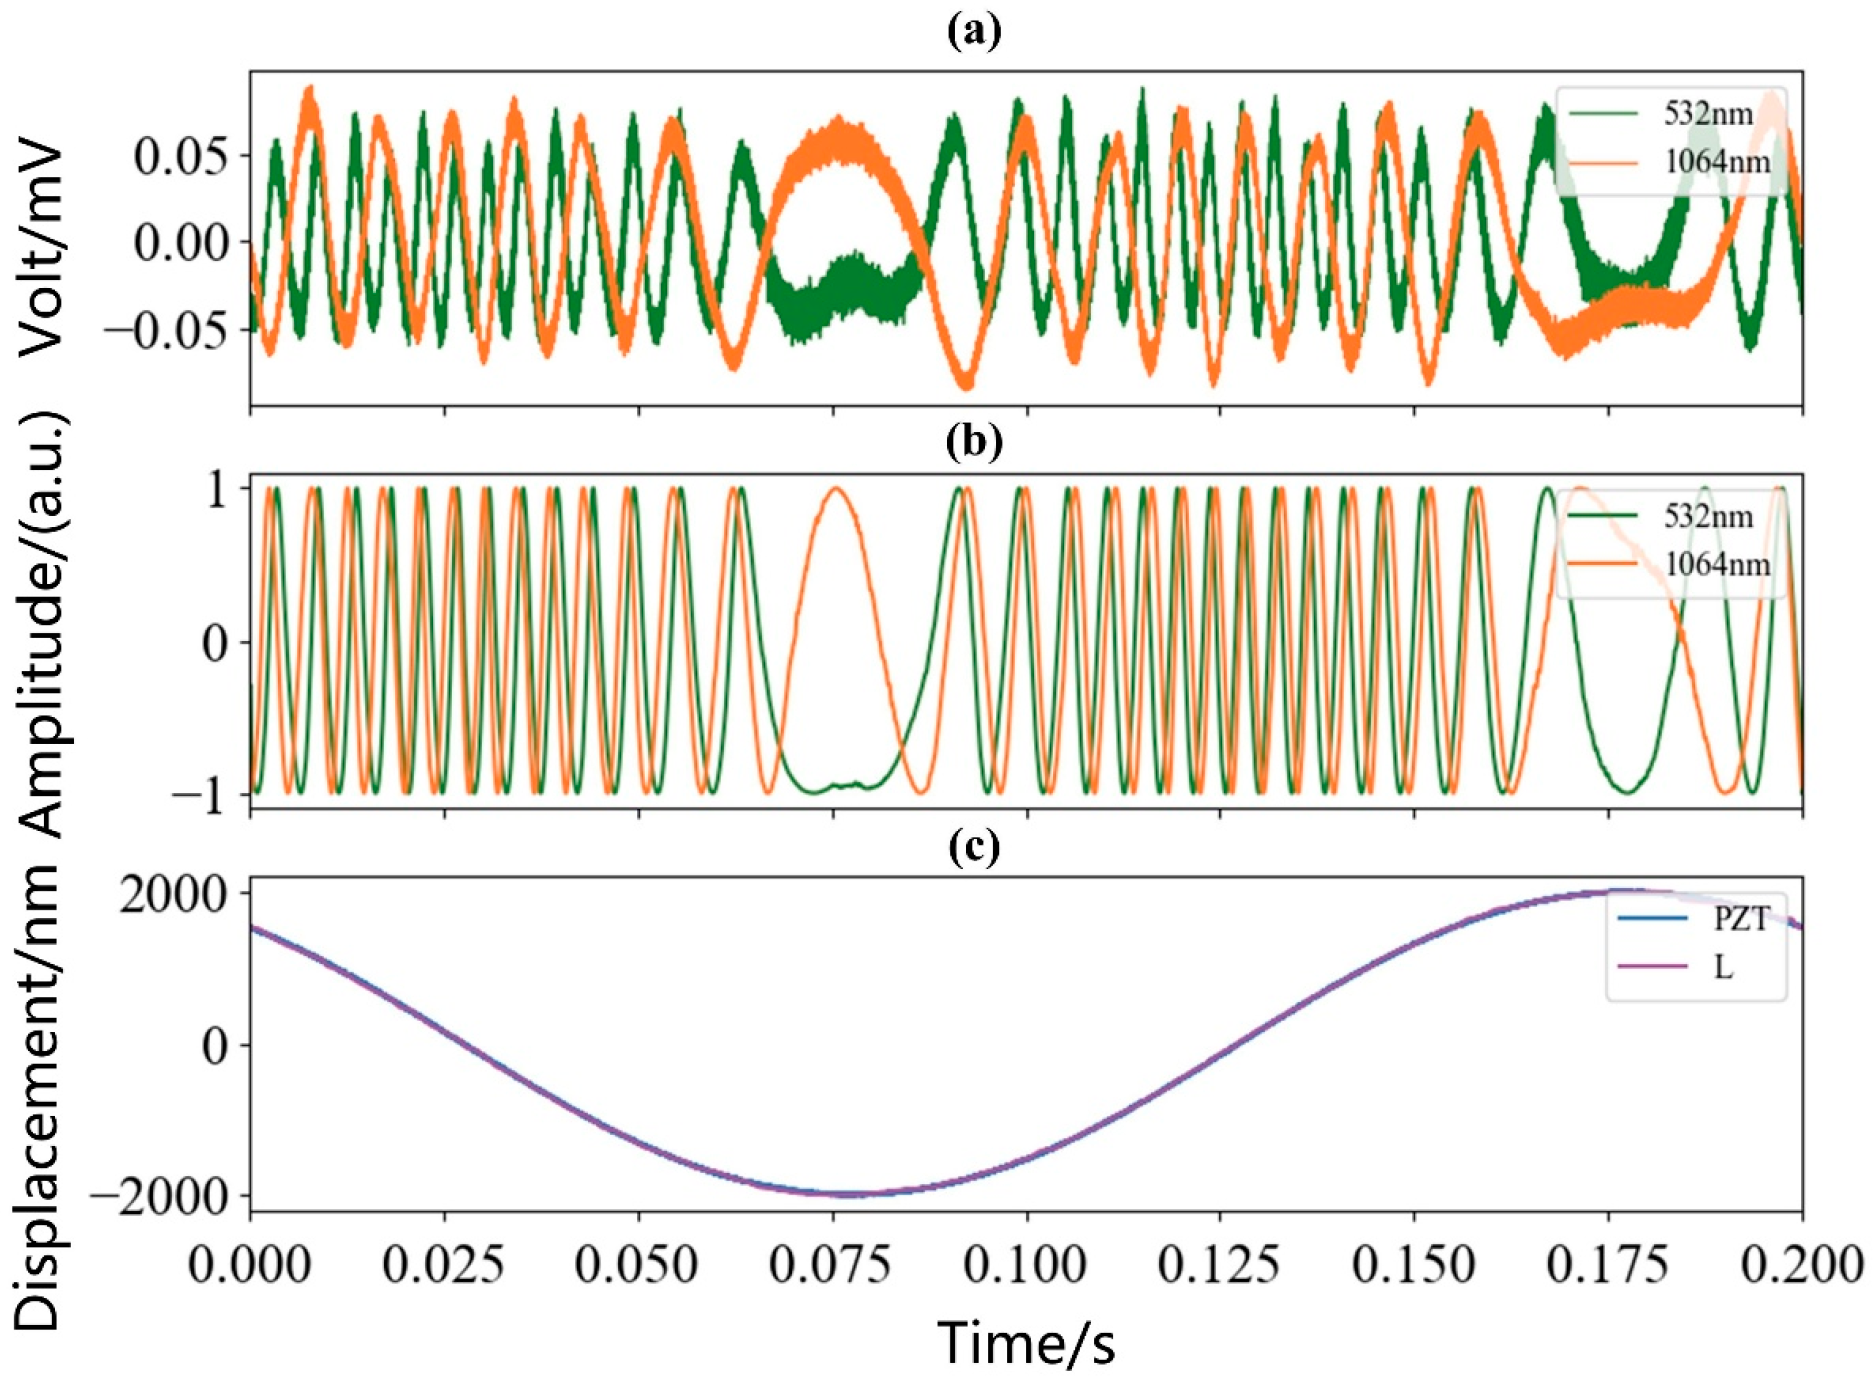
A piezoelectric translation stage equipped with a reflector was employed as the vibrating target under test. The piezoelectric stage was set to perform a sinusoidal motion with a frequency of 5 Hz and a peak-to-peak amplitude of 4000 nm. The measurement results from the system are shown in Figure 11. Specifically, (a) displays the raw voltage signals output by the two photodetectors; (b) shows the signals after processing—where the 1064 nm channel underwent squaring, filtering, and normalization, while the 532 nm channel underwent filtering and normalization; (c) presents the set displacement curve of the piezoelectric stage alongside the displacement curve measured by the system.
From Figure 11a, self-mixing signals are observed for both wavelengths. The frequency of the 532 nm self-mixing signal is twice that of the 1064 nm signal, which agrees with the theoretical analysis of self-mixing interference. The optical feedback level coefficient C in this case is estimated to be about 0.3. As is readily seen in Figure 11b, after processing, the two self-mixing signals exhibit a 90° phase difference, forming a set of quadrature signals. This enables determination of the displacement direction based on the phase lead-lag relationship, thereby laying the groundwork for subsequent vibration measurements. Figure 11c shows that the displacement curve measured by the system agrees with the preset displacement curve of the piezoelectric stage. For an optical feedback factor C > 1 in the moderate feedback regime, the system becomes unstable, and the signal waveform changes markedly—from a smooth sinusoid to a sawtooth waveform, with discontinuous power jumps appearing at the peaks or valleys. Traditional fringe-counting methods, which depend on sinusoidal waveforms, tend to lose phase information at these jumps and thus introduce significant errors. By contrast, this work adopts a frequency-domain phase unwrapping technique that can accommodate waveform distortion and reliably retrieve vibration or displacement information.
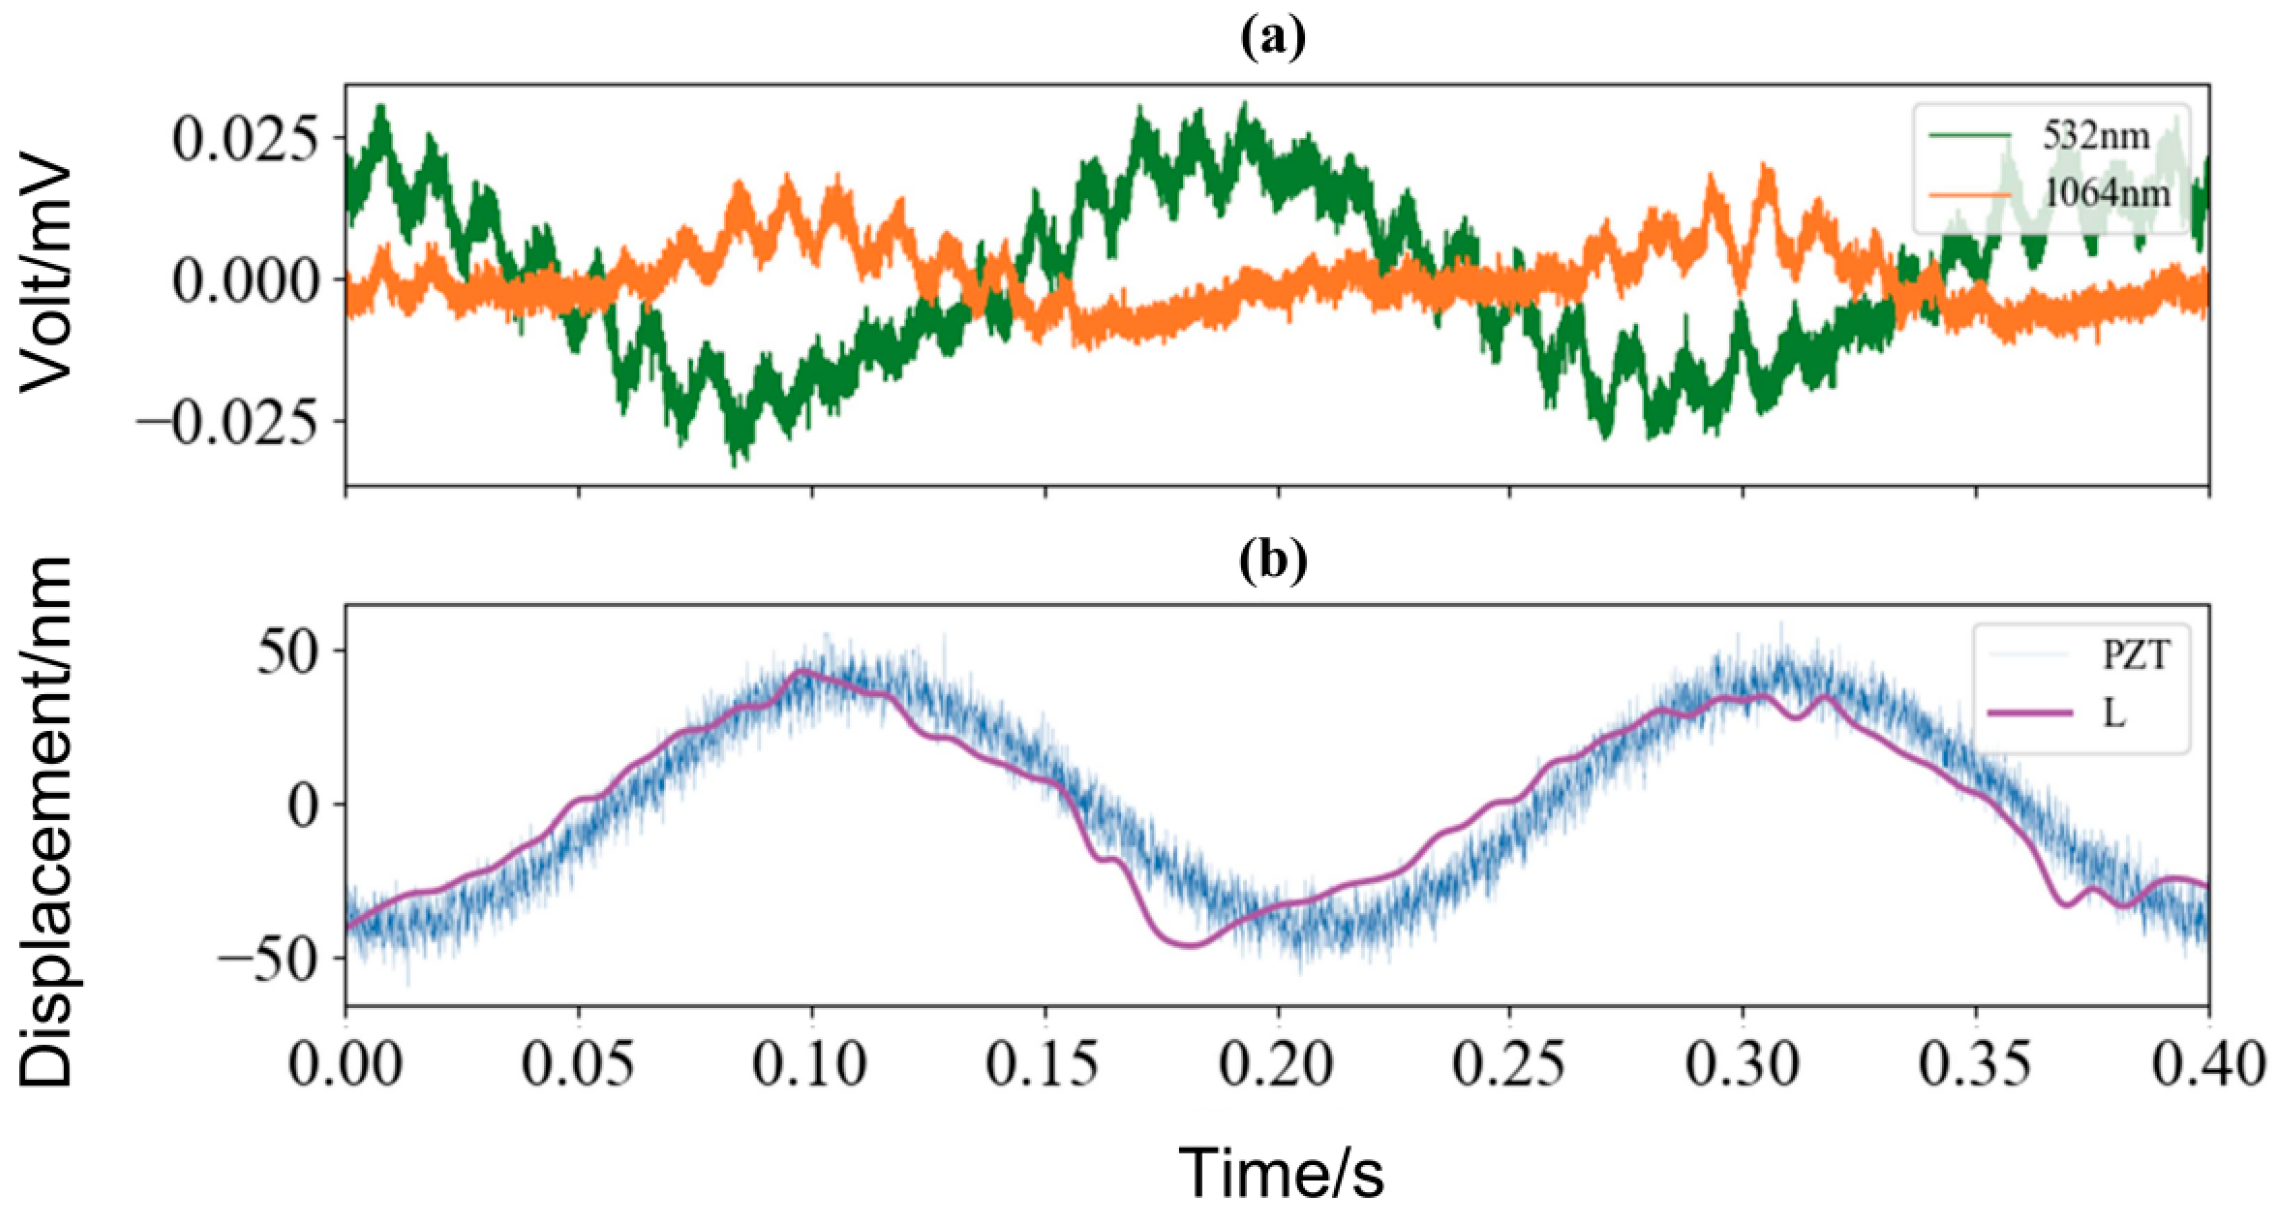
To verify the adaptability of the system under weak diffuse reflection conditions, experiments were conducted using a plastic sheet as the measurement target. The piezoelectric translation stage was driven to perform sinusoidal motion with a frequency of 5 Hz and a peak-to-peak amplitude of 50 nm, and the measurement results of the system are shown in Figure 12. As can be seen from Figure 12, on the one hand, the amplitudes of the original self-mixing signals at both wavelengths decreased significantly; on the other hand, although the reconstructed displacement largely agreed with the set values, partial distortion already occurred. This is attributed to the weaker feedback light, which led to a marked degradation of the signal-to-noise ratio and consequently increased errors in signal processing.
Additionally, intensity fluctuations of the intracavity 1064 nm laser necessarily give rise to synchronous power fluctuations in the 532 nm second-harmonic output. Nevertheless, the magnitude of these fluctuations is comparatively minor and remains largely indiscernible when superimposed on the 532 nm self-mixing signal, attributable to the relatively low intracavity fundamental power and the consequent low frequency-doubling efficiency of the KTP crystal in our system.
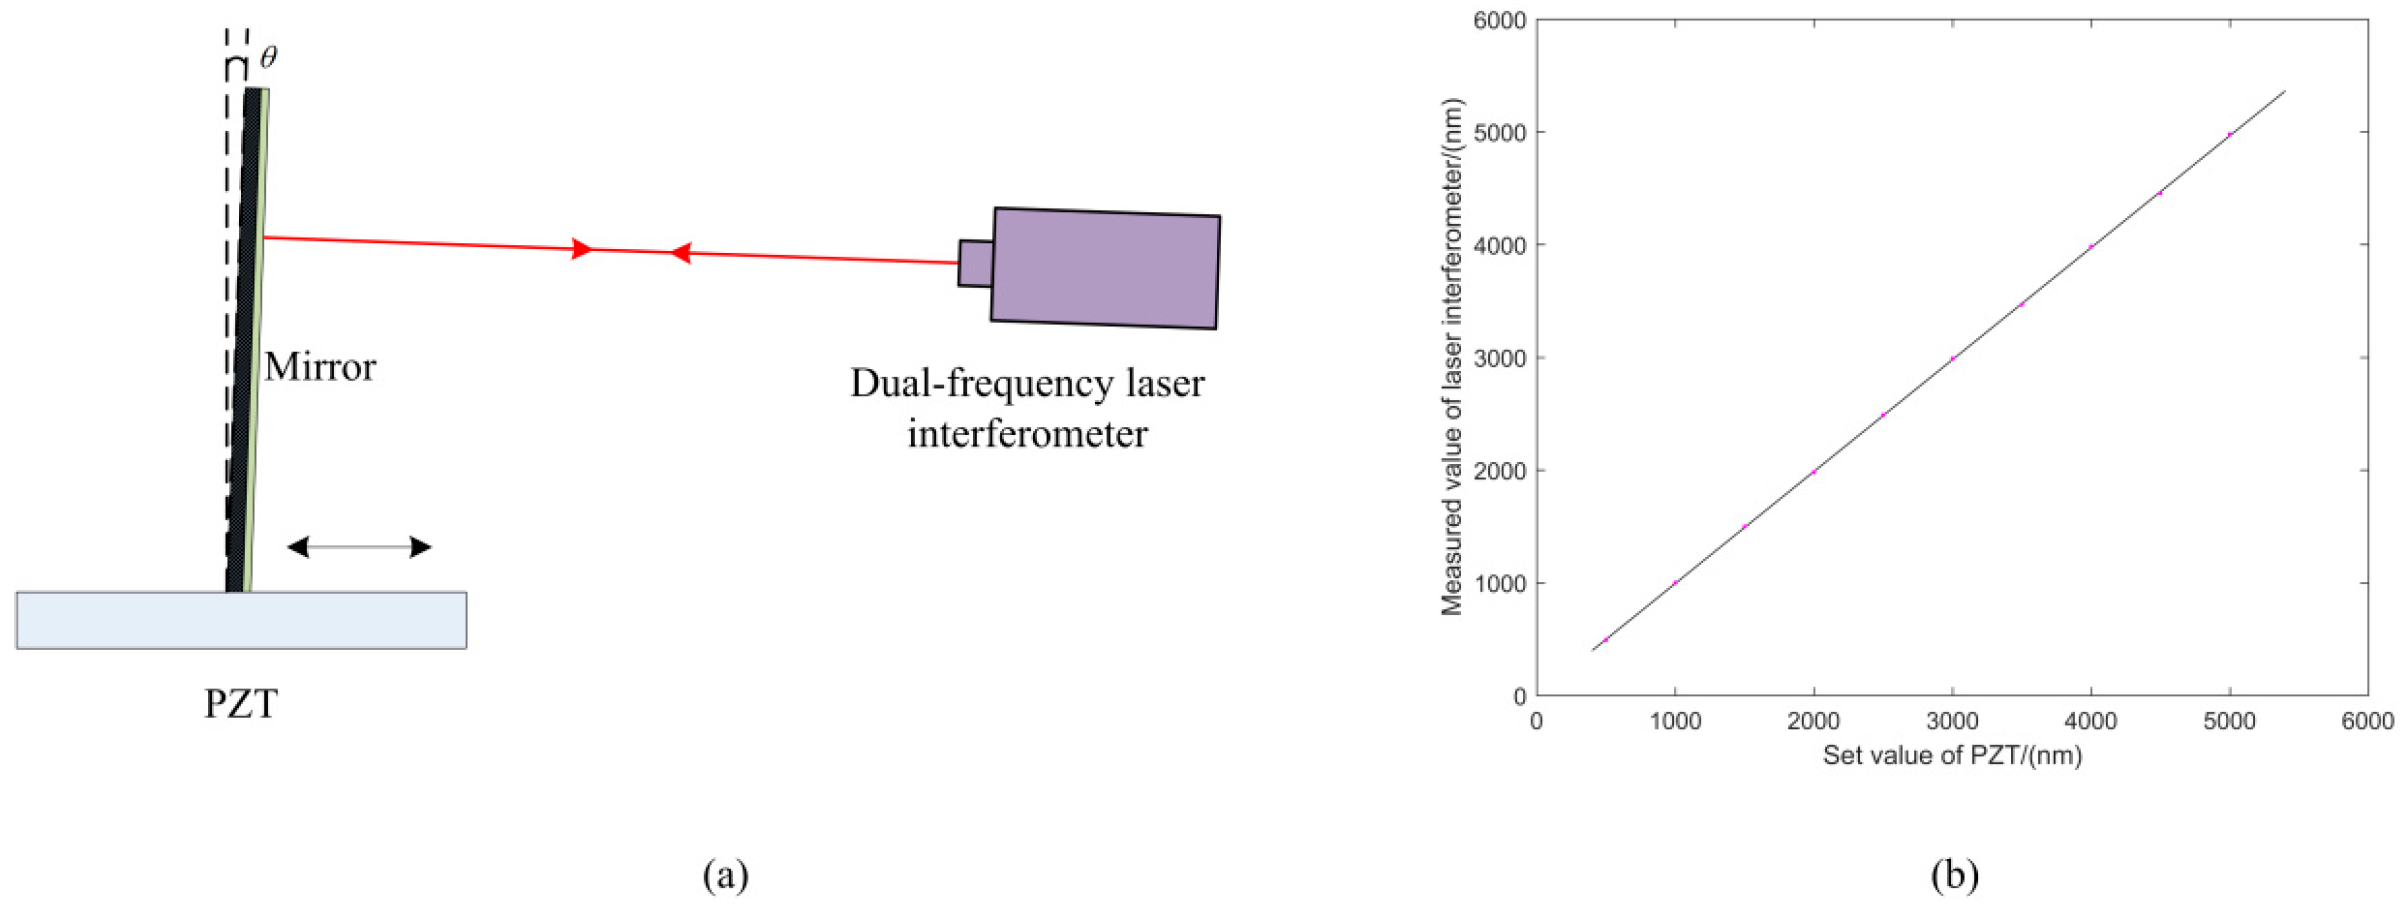
Considering the systematic deviation of the piezoelectric translation stage, a high-precision laser interferometer was employed for parallelism calibration. The configuration of the calibration experiment is illustrated in Figure 13a. The calibration instrument was a dual-frequency laser interferometer (Model SJ6000, Chotest Technology Inc, Shenzhen, China) with a linear measurement accuracy of ±0.5 ppm and a resolution of 1 nm. The displacement of the piezoelectric translation stage was set to increase from 500 nm to 5000 nm in increments of 500 nm per measurement point, and the corresponding displacement values were synchronously measured using the dual-frequency laser interferometer, with the results shown in Figure 13b. Based on the calibration data, a linear fit yielded a slope of 0.993, which was subsequently used to calibrate the data acquired from the piezoelectric translation stage in the following experiments.
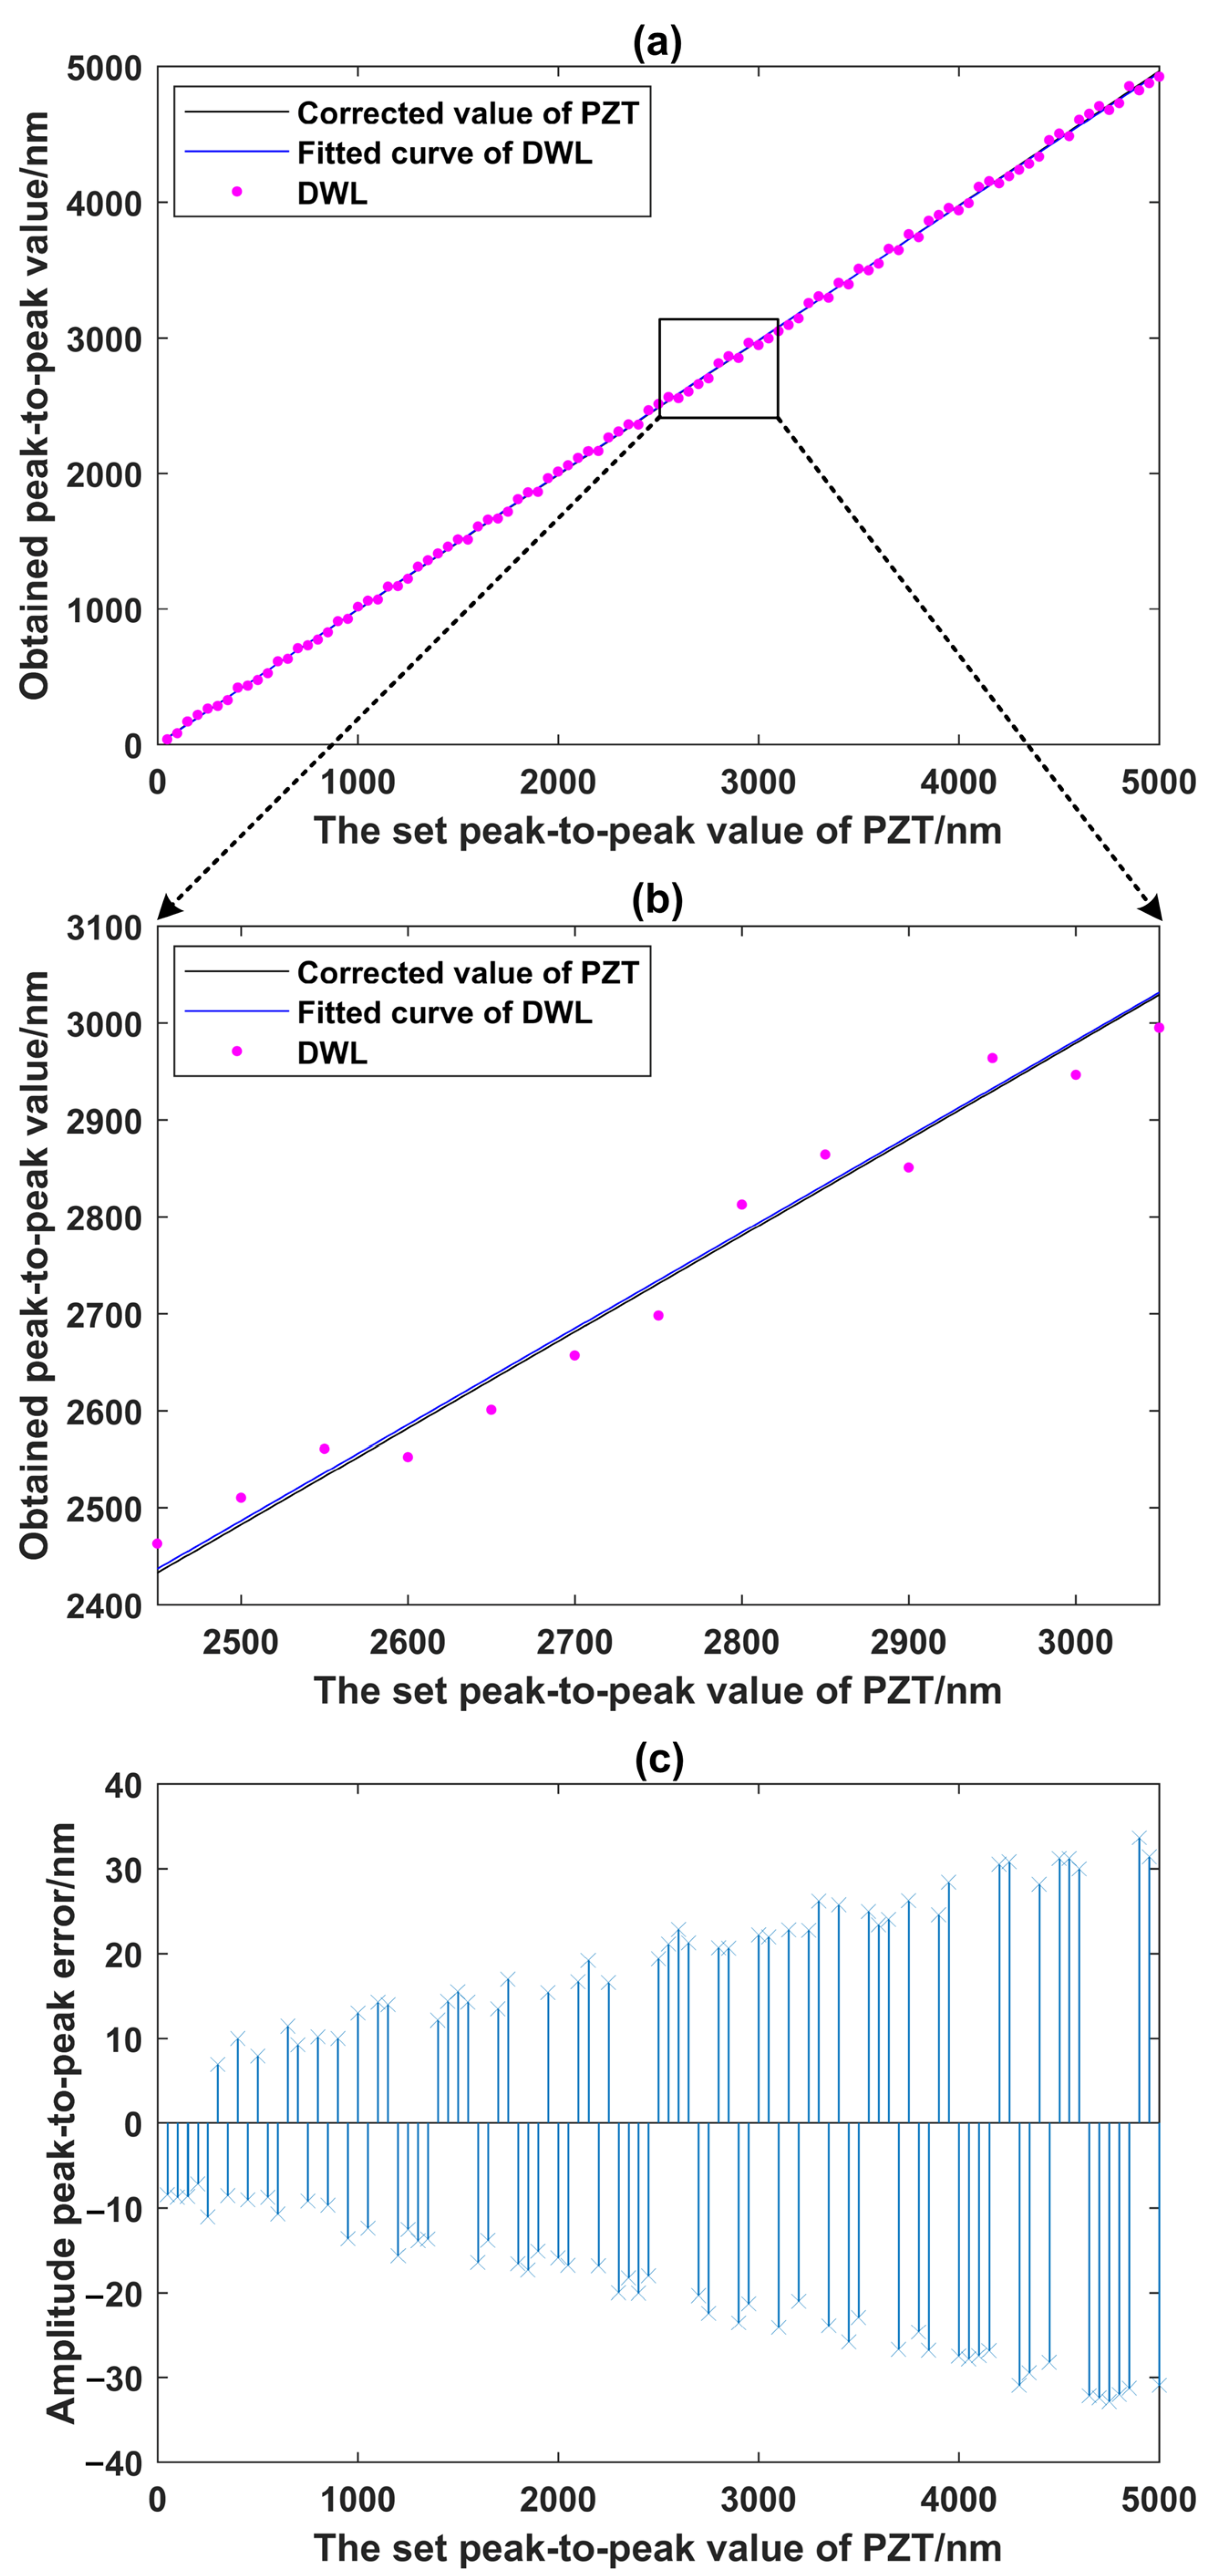
To further evaluate the system performance, the piezoelectric translation stage was configured to perform sinusoidal motion at a frequency of 5 Hz, with the peak-to-peak amplitude varying from 50 nm to 5000 nm at intervals of 50 nm. The measurement results are presented in Figure 14. Specifically, (a) displays the obtained peak-to-peak values of three approaches; (b) is a close-up view of (a); (c) presents the amplitude peak-to-peak error of the system. As can be observed from Figure 14, the peak-to-peak values measured by the system are in good agreement with those of the calibrated piezoelectric translation stage, and the fitted curve closely approaches the true values. Based on the measured data, the linear fitting R2 between measured and preset values is calculated to be 0.9996, and the average measurement error of the system is 3.93 nm in the scanning experiment. The system exhibits an RMS displacement noise of 8.64 nm. At a peak-to-peak amplitude of 5000 nm, the cumulative measurement error of the system is 33.66 nm.
Based on the analysis, the system errors can be categorized into four main sources: (1) errors due to laser source power drift, which induces fluctuations in the self-mixing signals and consequently undermines displacement reconstruction accuracy; (2) errors arising from non-ideal characteristics of optical and electronic components, including off-target wavelength leakage through the dichroic beam splitter and filters that introduces background noise, as well as dark current noise, thermal noise, and data acquisition electronic noise that degrade the signal-to-noise ratio of the weak self-mixing interference signals; (3) nonlinear errors from the calibration process, attributed to the inherent nonlinearity, creep, and hysteresis of the piezoelectric transducer, which lead to a nonlinear relationship between drive voltage and actual displacement, thereby introducing errors in both vibration excitation and system calibration; and (4) phase drift due to environmental interference, where external perturbations, such as temperature fluctuations and mechanical vibrations, induce random additional phase differences that hinder the extraction of true vibration signals. The proportions of each error factor are shown in Table 2.
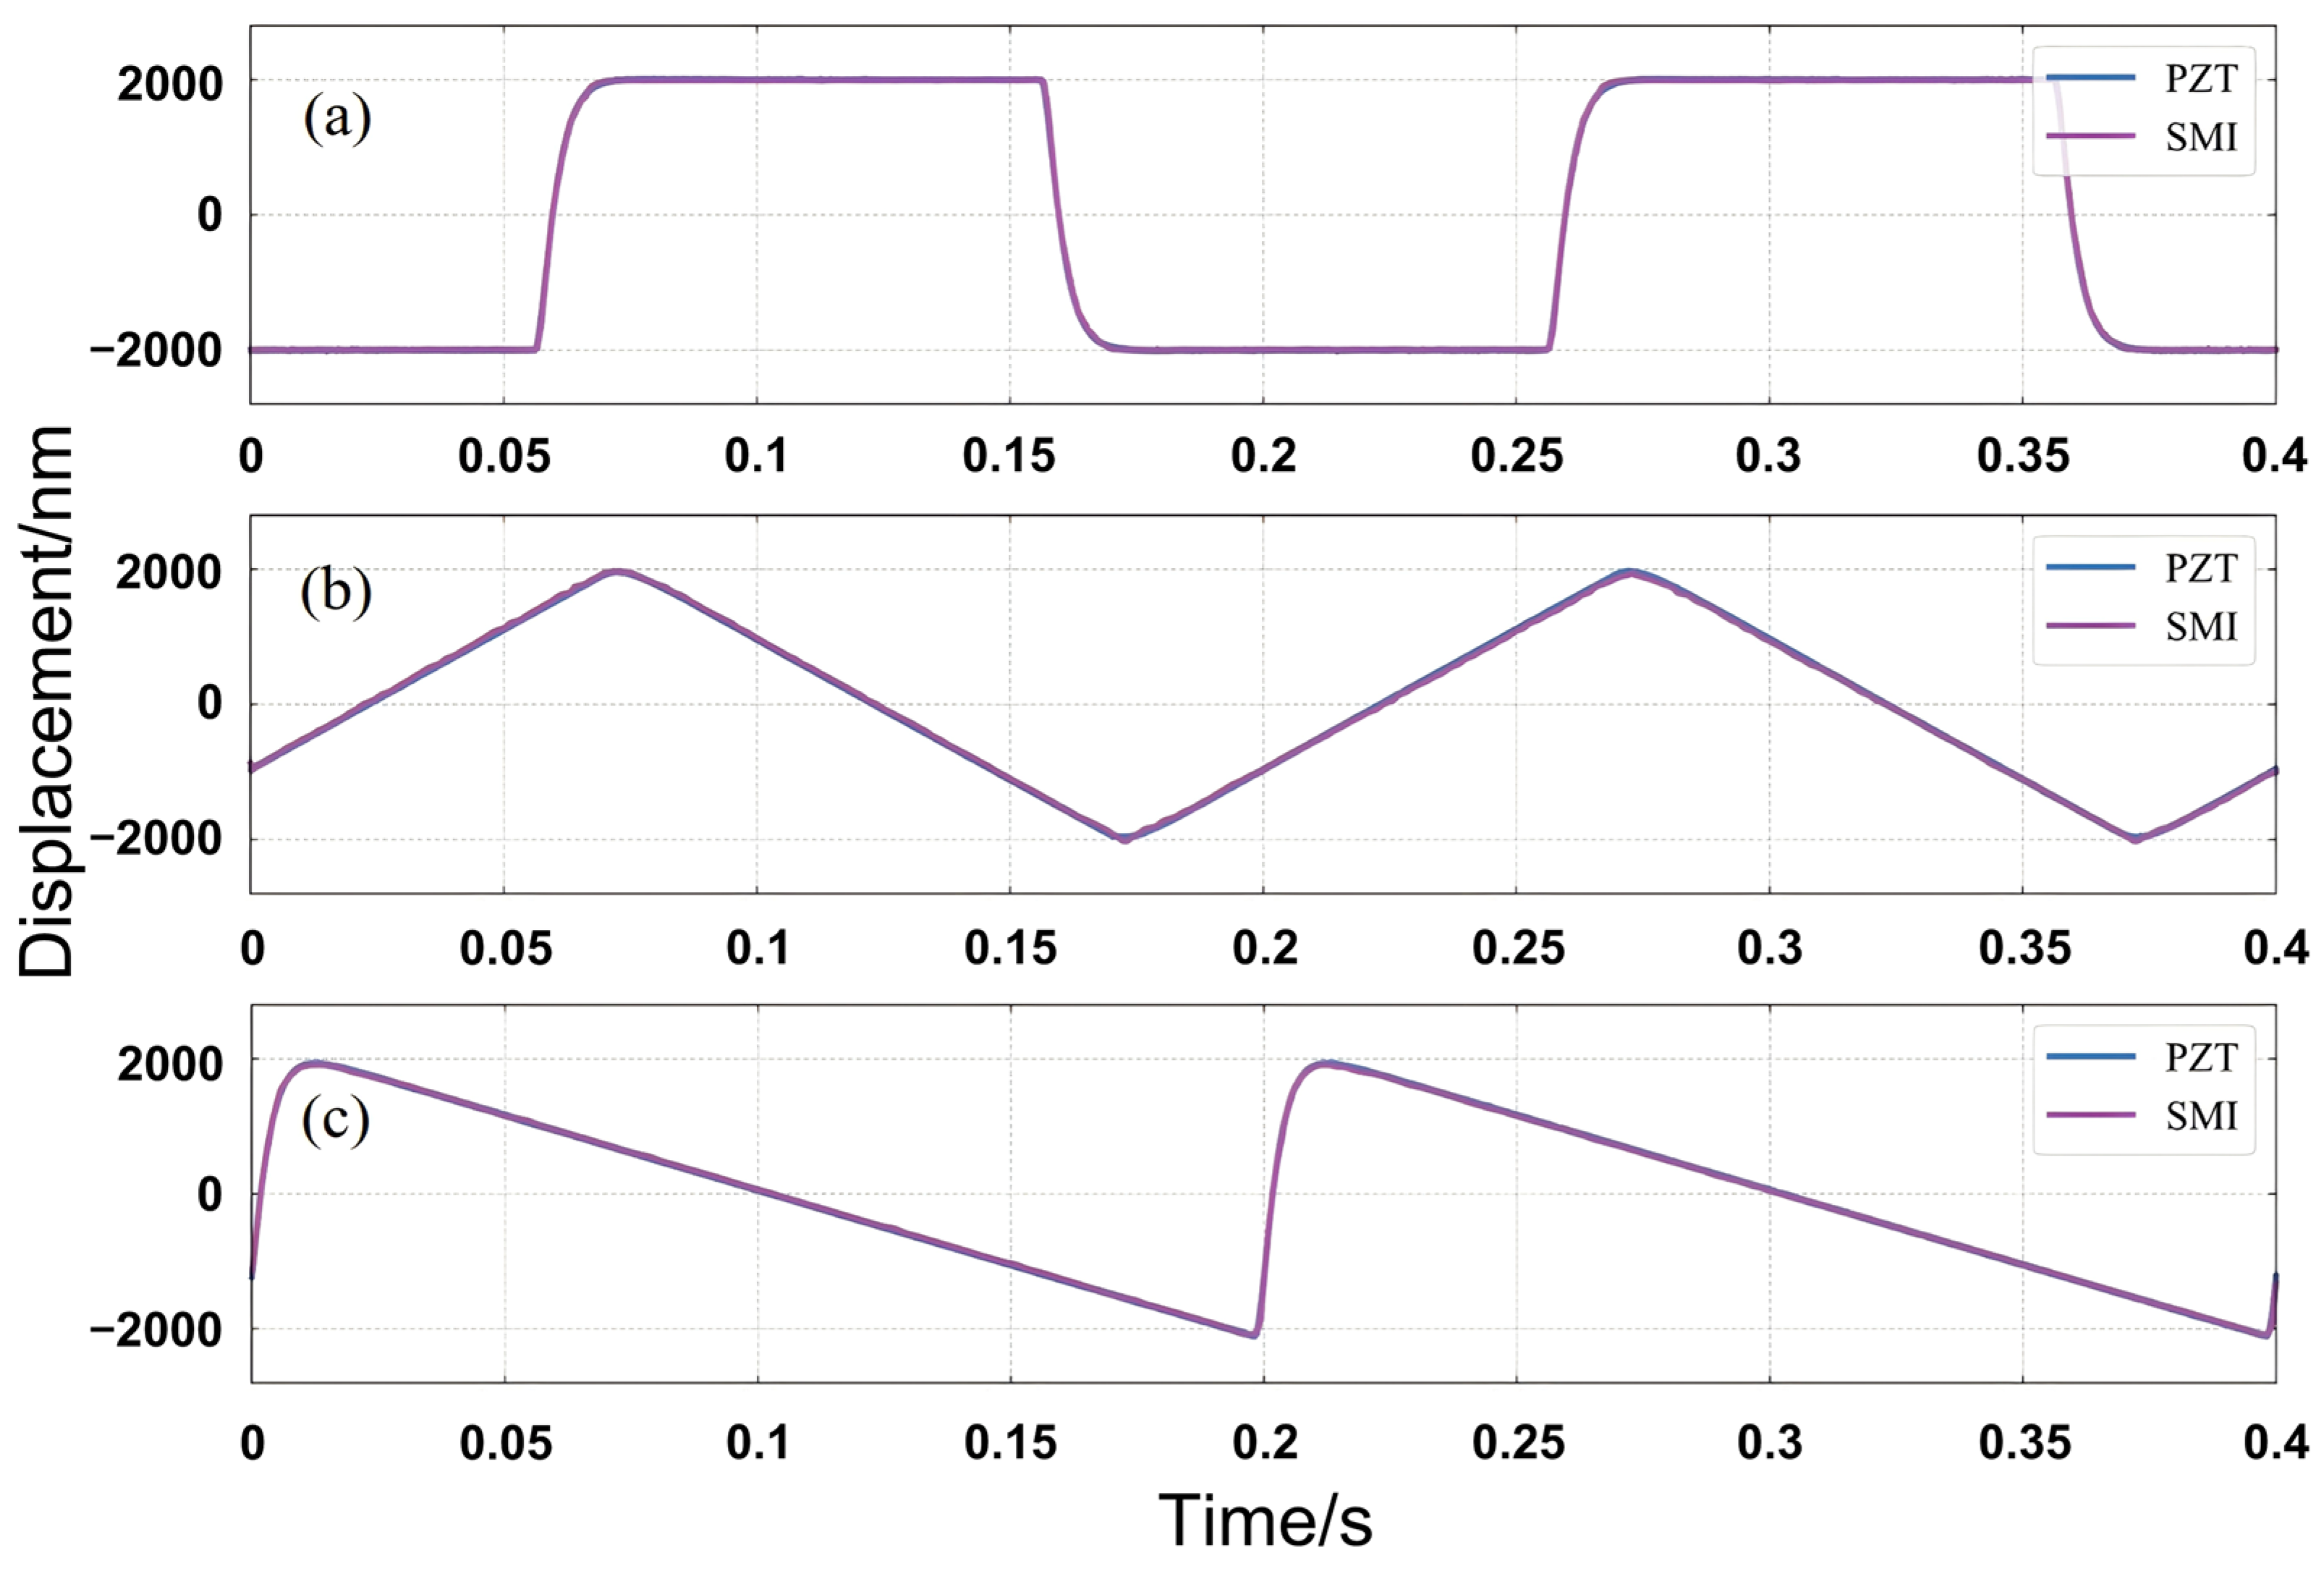
To assess the system’s capability in handling various vibration waveforms, the piezoelectric translation stage was commanded to execute square-wave, triangular-wave, and sawtooth-wave oscillations at 5 Hz with a peak-to-peak amplitude of 2000 nm, with the corresponding measurement results presented in Figure 15. It can be readily observed that the displacement curves reconstructed by the system are in good agreement with the preset displacement profiles of the piezoelectric stage for all three waveform types. Taking the preset displacements as the reference, the average errors are determined to be 7.2 nm, 4.9 nm, and 6.4 nm, respectively. These findings indicate that the system does not impose any waveform-specific constraints and is applicable to vibration measurements of arbitrary waveforms.
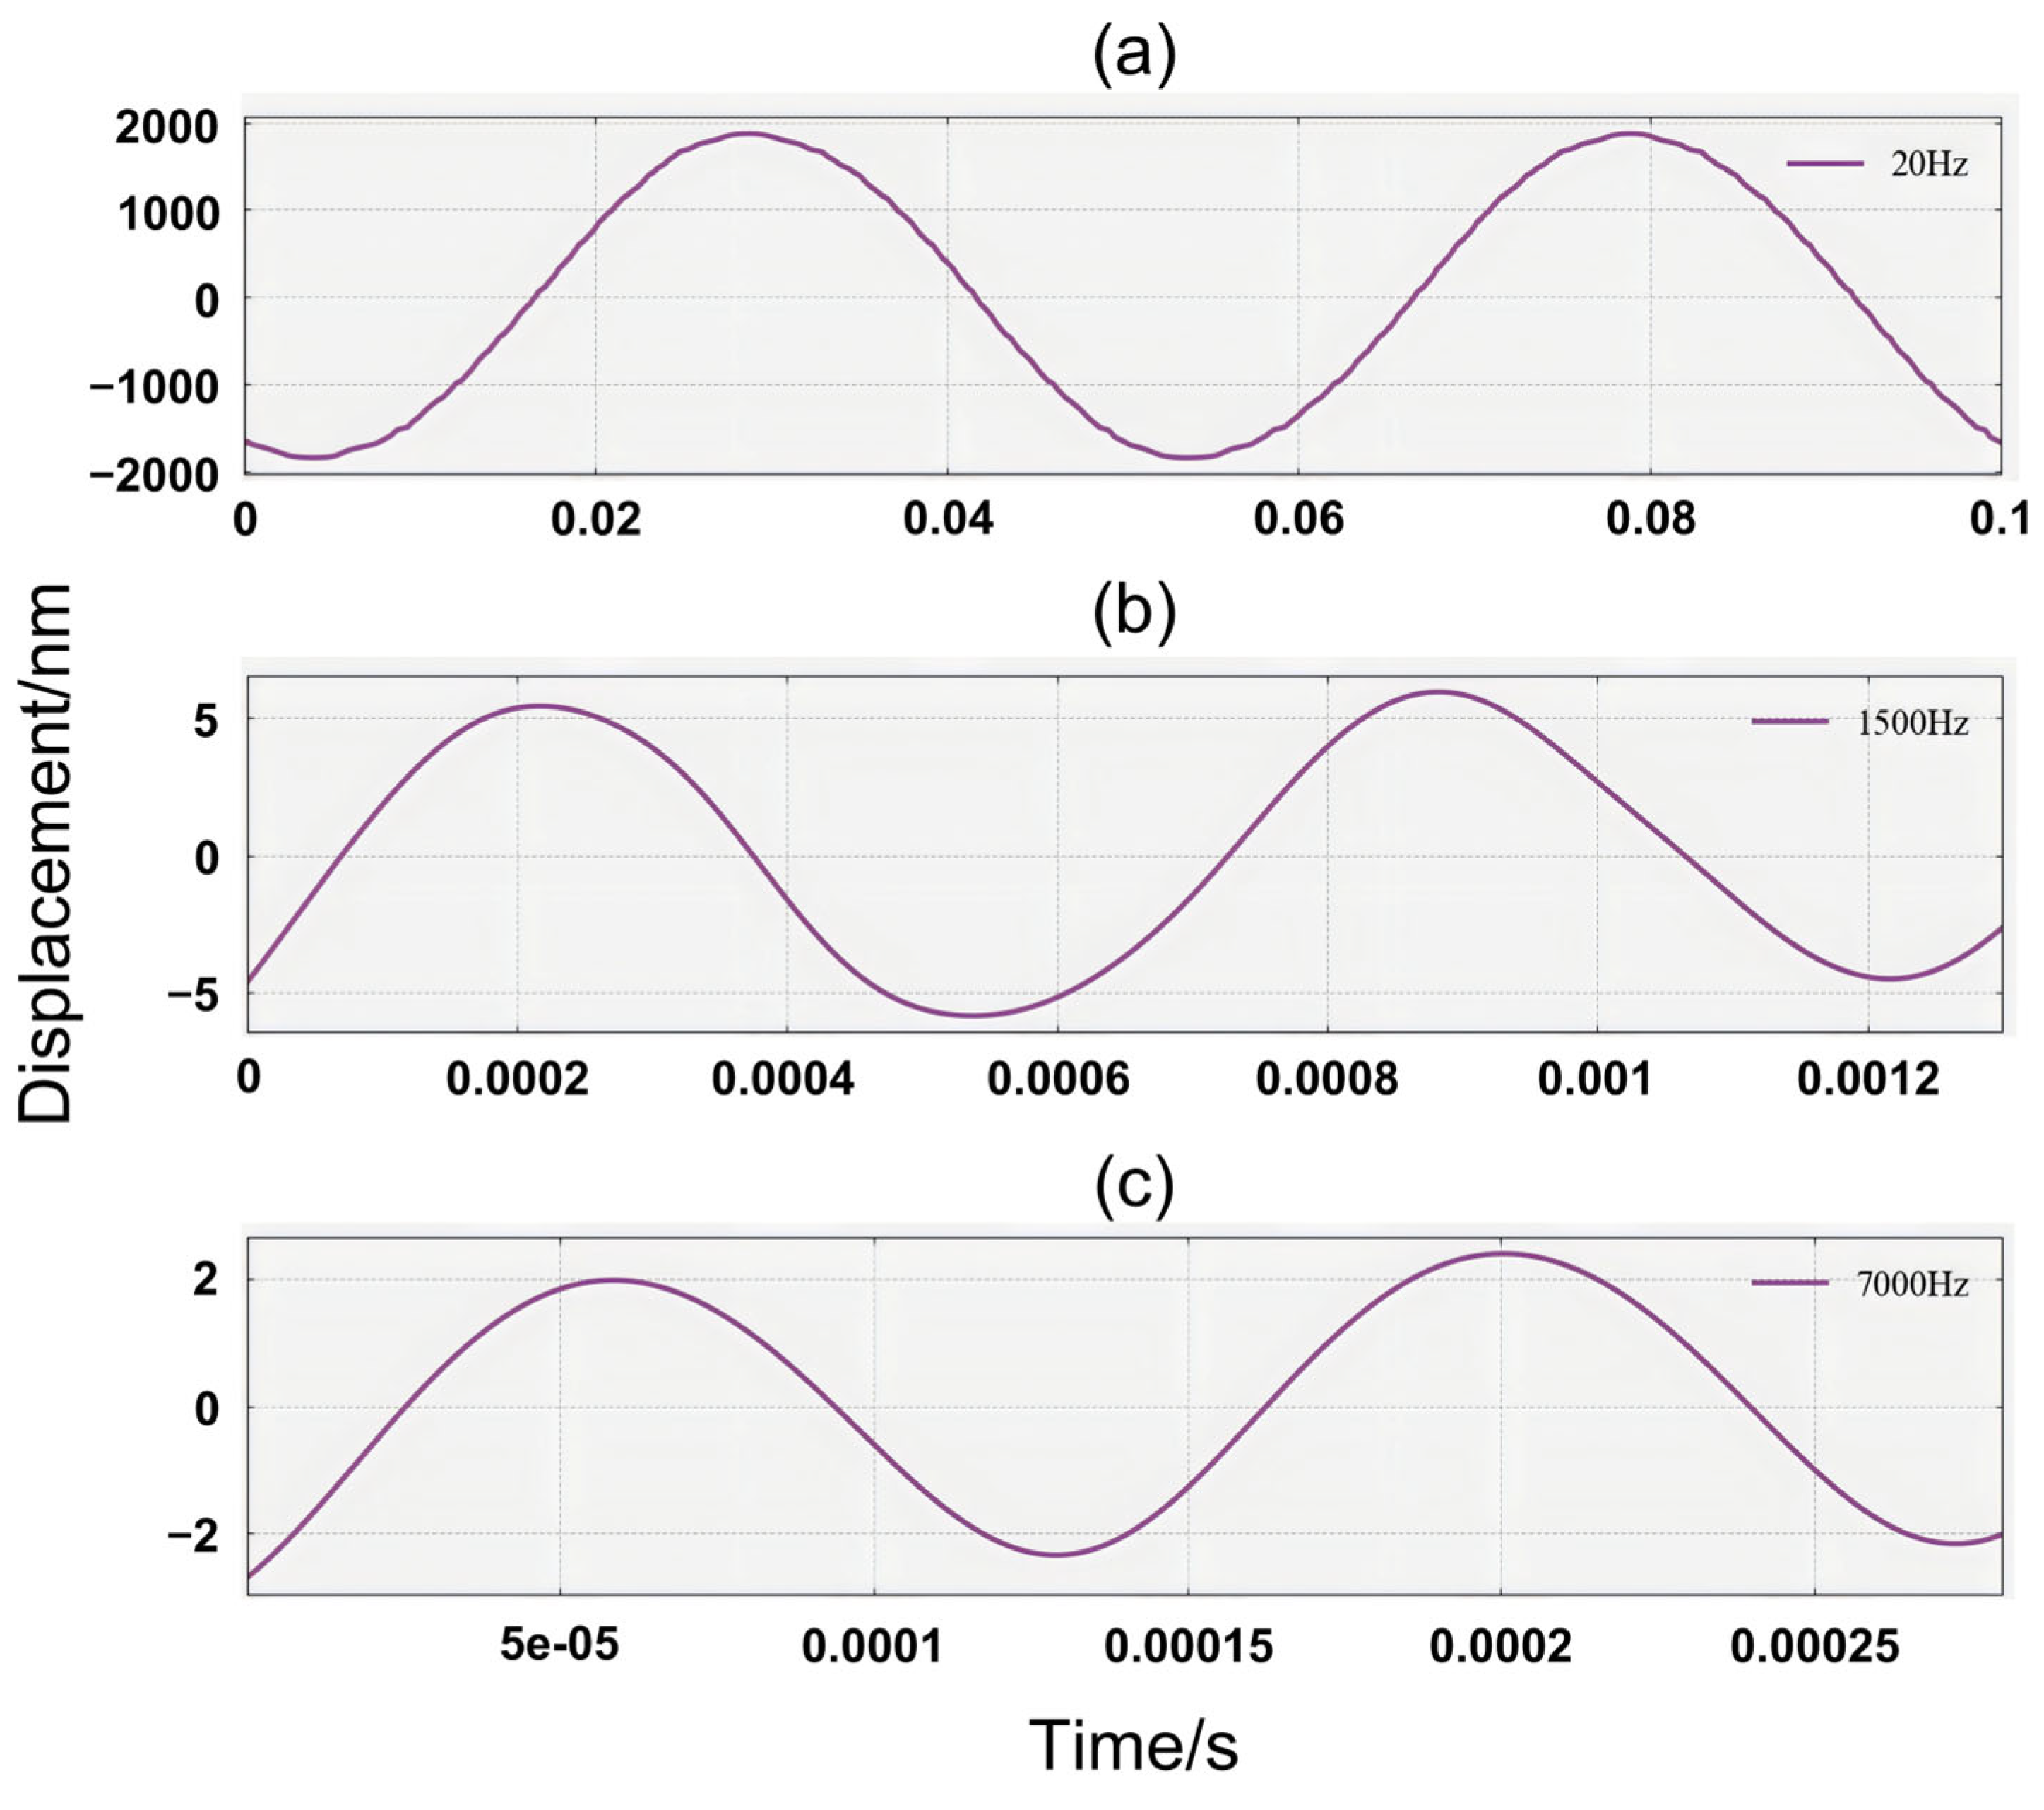
To verify the adaptability of the measurement system to vibrations at different frequencies, a loudspeaker (Yiting Audio Technology, Dongguan, China) was used as the measurement target. The loudspeaker was driven by a sinusoidal signal with a fixed amplitude, and the measured results are shown in Figure 16 for driving frequencies of 20 Hz (a), 1.5 kHz (b), and 7 kHz (c).
It can be readily seen that the system possesses favorable frequency adaptability. Based on the acquired signal waveform data, the periods were determined to be 49.9 ms, 663.6 us, and 114.3 us, yielding measured frequencies of 20.04 Hz, 1.507 kHz, and 7.002 kHz, respectively. It should be noted that the 7 kHz upper frequency limit in our experiments was chosen based on the target application of acoustic eavesdropping and speech restoration; it did not represent the actual bandwidth of the system.
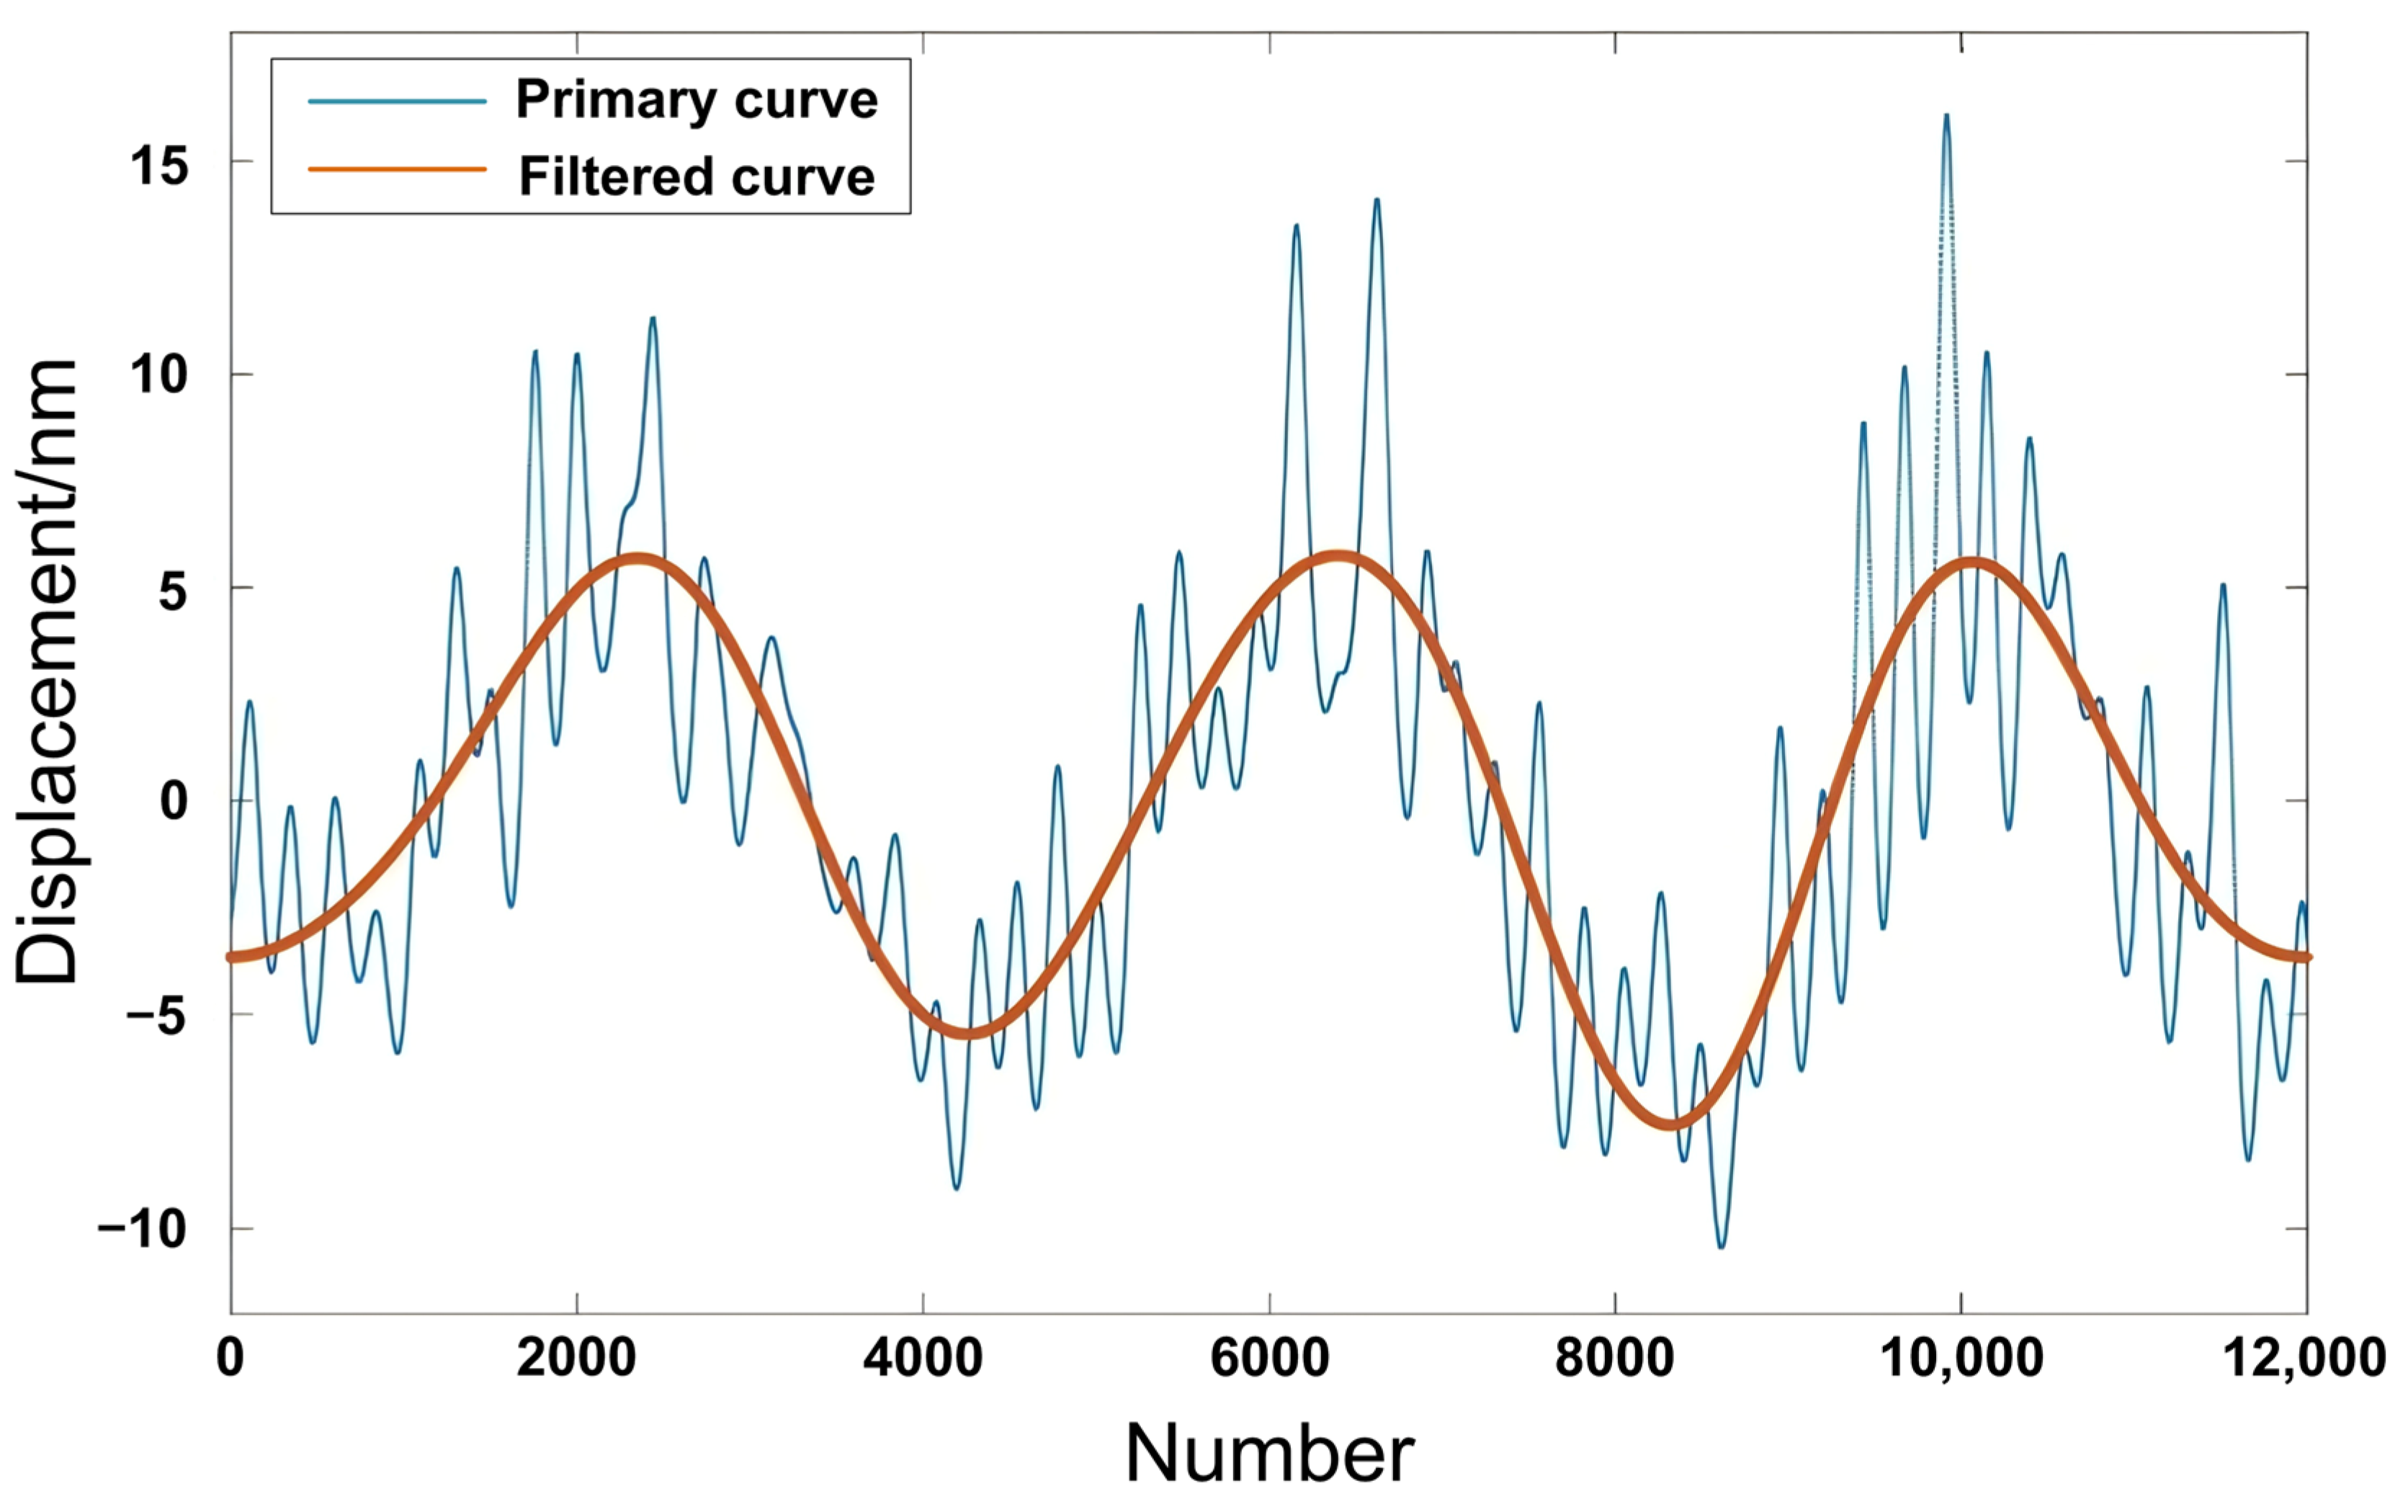
In addition, to evaluate the displacement reconstruction resolution of the system, the PZT was driven to perform a 5 Hz sinusoidal vibration with a peak-to-peak amplitude of 10 nm. The reconstructed vibration results are shown in Figure 17, which presents both the raw and filtered displacement reconstruction curves. It is evident that the system is capable of reconstructing a well-defined sinusoidal vibration with a peak-to-peak amplitude of 10 nm, with fluctuations within ±2 nm. This demonstrates that the minimum resolvable displacement of the system is below 10 nm, and the short-term resolution is better than 2 nm.

4. Conclusions

This paper presents the design of a dual-wavelength solid-state laser SVMS characterized by compactness, integrability, high sensitivity, and robust stability. By leveraging a common-path dual-wavelength self-mixing configuration, the system enables displacement direction discrimination through a pair of quadrature signals derived from the two wavelengths, eliminating the need for electro-optic crystal modulation and thereby overcoming the trade-off between high resolution and structural complexity typical of traditional self-mixing systems (just as in [11,12]). The system supports vibration measurements up to 7 kHz, with an RMS displacement noise of 8.64 nm and a cumulative error of 33.66 nm at a peak-to-peak amplitude of 5000 nm, along with a short-term resolution better than 2 nm. These findings confirm the viability of the system for precision vibration metrology. Future work will focus on three main objectives: (i) optimization of the self-developed dual-wavelength solid-state laser, including the selection of appropriate current and temperature setpoints to equalize the output powers of the two wavelengths and to adjust their signal-to-noise ratios for enhanced environmental adaptability; (ii) development of a high-power, single-mode, dual-wavelength solid-state laser and its associated self-mixing system to extend the measurement capability to non-cooperative targets, such as diffuse reflecting surfaces; and (iii) adoption of a three-channel dual-differential optical configuration to suppress noise drift and improve the long-term thermal stability of the system.

Author Contributions

Conceptualization, J.Z. and X.N.; methodology, J.Z.; software, J.Z.; validation, J.Z., Y.F. and B.L.; formal analysis, J.Z.; investigation, X.N. and Q.W.; resources, Y.F. and Q.W.; data curation, J.Z.; writing—original draft preparation, J.Z.; writing—review and editing, X.N.; visualization, Y.F.; supervision, B.L.; project administration, J.Z.; funding acquisition, J.Z. All authors have read and agreed to the published version of the manuscript.

Funding

This research received no external funding.

Data Availability Statement

Data is contained within the article.

Conflicts of Interest

The authors declare no conflict of interest.

References

  1. King, P.G.R.; Steward, G.J. Metrology with an Optical Maser. New Sci. 1963, 24, 180–182. [Google Scholar] [CrossRef] [Scilit]
  2. Gabbrielli, T.; Zhang, C.; Cappelli, F.; Galli, I.; Ottomaniello, A.; Faist, J.; Tredicucci, A.; Pitanti, A.; De Natale, P.; Borri, S.; et al. Bridging Mid- and Near-Infrared by Combining Optomechanics and Self-Mixing. ACS Photonics 2026, 13, 1200–1206. [Google Scholar] [CrossRef] [Scilit] [PubMed]
  3. Gabbrielli, T.; Pelini, J.; Zhang, C.; Cappelli, F.; de Cumis, M.S.; Russo, S.D.; Canino, M.C.; Roncaglia, A.; De Natale, P.; Borri, S. Self-mixing-based photoacoustic sensor. Sens. Actuators Rep. 2026, 12, 100487. [Google Scholar] [CrossRef] [Scilit]
  4. Fei, L.; Zhang, S.; Li, Y.; Zhu, J. Polarization control in a He-Ne laser using birefringence feedback. Opt. Express 2005, 13, 3117–3122. [Google Scholar] [CrossRef] [Scilit] [PubMed]
  5. Rakić, A.D.; Taimre, T.; Bertling, K.; Lim, Y.L.; Dean, P.; Indjin, D.; Ikonić, Z.; Harrison, P.; Valavanis, A.; Khanna, S.P.; et al. Swept-frequency feedback interferometry using terahertz frequency QCLs: A method for imaging and materials analysis. Opt. Express 2013, 21, 22194. [Google Scholar] [CrossRef] [Scilit] [PubMed]
  6. Fan, Y.; Kou, K.; Liang, T.; Jiao, M. Influence mechanism in dual-channel displacement measurement via linearly tuned laser self-mixing interference. J. Optoelectron. Laser 2025, 36, 965–972. [Google Scholar]
  7. Giuliani, G.; Norgia, M.; Donati, S.; Bosch, T. Laser diode self-mixing technique for sensing applications. J. Opt. A Pure Appl. Opt. 2002, 4, 283–294. [Google Scholar] [CrossRef] [Scilit]
  8. Zhao, Y.; Zhu, D.; Tu, Y.; Pi, L.; Li, H.; Xu, L.; Hu, Z.; Shen, Y.; Yu, B.; Lu, L. Coherent laser detection of the femtowatt-level frequency-shifted optical feedback based on a DFB fiber laser. Opt. Lett. 2021, 46, 1229–1232. [Google Scholar] [CrossRef] [Scilit] [PubMed]
  9. Nerin, P.; Puget, P.; Besesty, P.; Chartier, G. Self-mixing using a dual-polarisation Nd:YAG microchip laser. Electron. Lett. 1997, 33, 491–492. [Google Scholar]
  10. Zhang, S.; Tan, Y. Third-generation Laser Interferometer—Breakthrough in Solid-state Microchip Laser Self-Mixing Measurement Technology. Metrol. Meas. Technol. 2018, 38, 43–59. [Google Scholar]
  11. Wang, Y.; Wang, H.; Feng, Y.; Zhou, J.; Nie, X. Laser Self-Mixing Interference Signal Processing Method Based on Hilbert Transform. Acta Opt. Sin. 2024, 44, 1912003. [Google Scholar]
  12. Feng, Y.; Wang, Y.; Zhou, J.; Nie, X.; Sun, S.; Li, J.; Zhang, B. Micro-vibration measurement using self-mixing interferometry with an intracavity frequency-doubling solid-state laser. Opt. Laser Technol. 2026, 198, 114644. [Google Scholar] [CrossRef] [Scilit]
  13. Groot, P.D.; Gallatin, G.M.; Macomber, S.H. Ranging and velocimetry signal generation in a backscatter-modulated laser diode. Appl. Opt. 1988, 27, 4475–4480. [Google Scholar] [CrossRef] [Scilit] [PubMed]
  14. Feng, Y. Research on Self-Mixing Vibration Measurement Technology of Dual Wavelength Solid State Laser; National University of Defense Technology: Changsha, China, 2026. [Google Scholar]
Figure 1. Optical structure schematic diagram of LD-pumped dual-wavelength solid-state laser.
Photonics 13 00808 g001
Figure 2. Three-mirror Fabry–Perot cavity model of laser self-mixing interference effect.
Photonics 13 00808 g002
Figure 3. Superposition of the rotating vector of the feedback light.
Photonics 13 00808 g003
Figure 4. Optical path structure of the dual-wavelength solid-state laser SVMS.
Photonics 13 00808 g004
Figure 5. The relationship between the phase differences of the two signals and the incident angle.
Photonics 13 00808 g005
Figure 6. Schematic diagram of signal processing.
Photonics 13 00808 g006
Figure 7. Dual-wavelength solid-state laser SVMS.
Photonics 13 00808 g007
Figure 8. The composite optical crystal.
Photonics 13 00808 g008
Figure 9. The relationship between output power and input power.
Photonics 13 00808 g009
Figure 10. Double−wavelength longitudinal mode spectrogram: (a) 532 nm; (b) 1064 nm.
Photonics 13 00808 g010
Figure 11. Results when the amplitude is 4000 nm: (a) the original voltage signals of two photodetectors; (b) the processed signals; (c) the set and measured displacement curves.
Photonics 13 00808 g011
Figure 12. Results of the plastic sheet when the amplitude is 50 nm: (a) the original voltage signals of two photodetectors; (b) the set and measured displacement curves.
Photonics 13 00808 g012
Figure 13. Calibration experiment of PZT. (a) Calibration device. (b) Calibration result.
Photonics 13 00808 g013
Figure 14. Results of the amplitude scanning experiment: (a) the obtained peak−to−peak value of three approaches; (b) a close−up view of (a); (c) the amplitude peak−to−peak error of the system.
Photonics 13 00808 g014
Figure 15. Results for (a) square, (b) triangular, and (c) sawtooth waveforms.
Photonics 13 00808 g015
Figure 16. Results for different vibration frequencies: (a) 20 Hz; (b) 1.5 kHz; (c) 7 kHz.
Photonics 13 00808 g016
Figure 17. Result at 5 Hz (10 nm peak-to-peak).
Photonics 13 00808 g017
Table 1. Performance parameters of the pumping laser diode.
ParameterValuesUnit
Central wavelength 808nm
Threshold current70mA
Working current500mA
Operating voltage1.85V
Maximum output power500mW
Table 2. The proportion of each error.
FactorProportion (%)
Laser power fluctuations<10
Detector noise≈30
Electronic acquisition≈15
Optical leakage≈15
Nonlinear of the calibration<10
Environmental disturbances≈20
Disclaimer/Publisher’s Note: The statements, opinions and data contained in all publications are solely those of the individual author(s) and contributor(s) and not of MDPI and/or the editor(s). MDPI and/or the editor(s) disclaim responsibility for any injury to people or property resulting from any ideas, methods, instructions or products referred to in the content.