Article

Enhanced Emission Properties of Dysprosium Ions Doped Lead Borophosphate Zinc Barium Glasses for White Light Luminescent Applications


1
Department of Physics, Ramachandra College of Engineering, Eluru 534007, Andhra Pradesh, India
2
Department of Mathematics, Ramachandra College of Engineering, Eluru 534007, Andhra Pradesh, India
3
Department of Chemistry, Kakaraparti Bhavanarayana College, Vijayawada 520001, Andhra Pradesh, India
4
Department of Physics, Dhanekula Institute of Engineering & Technology, Vijayawada 521139, Andhra Pradesh, India
5
Department of Physics, DVR & Dr HS MIC College of Technology, Kanchikacherla 521180, Andhra Pradesh, India
6
Department of Mechanical Engineering, Yeungnam University, Gyeongsan-si 38541, Republic of Korea
*
Authors to whom correspondence should be addressed.
Photonics 2026, 13(3), 237; https://doi.org/10.3390/photonics13030237

Submission received: 29 January 2026 / Revised: 21 February 2026 / Accepted: 27 February 2026 / Published: 28 February 2026
(This article belongs to the Section Optoelectronics and Optical Materials)

Abstract

Lead borophosphate zinc barium glass systems doped with different concentrations of Dy2O3 (0.5–2.0 mol%) were fabricated using the traditional melt-quenching method. The non-crystalline nature of the synthesized glass samples was verified through X-ray diffraction (XRD) analysis, which exhibited the characteristic absence of sharp diffraction peaks. Morphological, structural, and vibrational properties were analyzed using scanning electron microscopy (SEM) and Fourier infrared transmission (FTIR) spectroscopy. Optical absorption, emission, and decay lifetime observations were recorded to evaluate the luminescence behavior of Dy3+ ions. Judd–Ofelt parameters (Ω2, Ω4, and Ω6) were evaluated from the optical absorption spectra of all the prepared glass samples. The emission spectra revealed three dominant transitions in the visible region corresponding to the 4F9/26H15/2 (blue ~ 484 nm), 4F9/26H13/2 (yellow ~ 574 nm), and 4F9/26H11/2 (~663 nm) transitions. Radiative characteristics, including radiative transition probability (AR), radiative lifetime (τR), and branching ratio (βR), were calculated from the emission spectra. Among the investigated compositions, the host glass embedded with 1.0 mol% Dy2O3 demonstrated the maximum emission intensity was observed along with superior quantum efficiency (η = 91.68%). The chromaticity coordinates for this composition (x = 0.33, y = 0.41) are positioned close to the white-light region in the CIE 1931 chromaticity diagram. These findings suggest that incorporating 1.0 mol% of Dy2O3 yields the highest luminescence efficiency, making the present glass system a promising candidate for white-light-emitting and photonic device applications.

1. Introduction

Glasses incorporating dysprosium oxide (Dy2O3) are commonly utilized as white-light-emitting materials due to their distinctive emission transitions, which are well recognized. Especially, these glasses exhibit blue and yellow emission transitions, viz., 4F9/26H15/2 (electronic dipole) and 4F9/26H13/2 (magnetic dipole). The emission intensity ratio (Y/B) is different for different materials and significantly influences white-light generation. Moreover, Dy3+ ions exhibit emission bands at about 3.02 μm (6H13/26H15/2) and 1.34 μm (6H11/26H13/2) for optical fiber amplifier applications [1,2,3,4,5,6].
Dysprosium (Dy3+)-doped glasses have garnered significant attention due to their versatile luminescent properties arising from characteristic 4F9/26H15/2 (blue, ~480 nm) and 4F9/26H13/2 (yellow, ~570 nm) transitions, enabling white-light emission when these bands are balanced appropriately. This makes Dy3+-activated materials promising for solid-state lighting and display technologies. However, their utility spans beyond this, into fields like optical amplifiers, sensors, and radiation shielding, depending on the glass host and co-dopants used [7].
Compared to other rare earth ions such as Er3+, Nd3+, and Yb3+, which are predominantly used in optical amplifiers and telecommunication devices, and Eu3+ and Tb3+ ions, which exhibit red and green emissions suitable for display technologies, Dy3+ ions doped glasses are relatively less explored in commercial applications. However, Dy3+ ions offer distinctive advantages through their simultaneous emission (blue) 4F9/26H15/2 and (yellow) 4F9/26H13/2, respectively, enabling near-white-light generation from a single activator. Furthermore, Dy3+-activated glass possesses superior chemical stability, lower fabrication cost, and easier processability compared to conventional YAG: Ce phosphors. The strong sensitivity of Dy3+ emissions to local field symmetry and temperature also makes these materials promising candidates for optical thermometry and pressure sensing applications.
For these reasons, the current Dy3+ ions doped glass system is not merely an extension of known applications but an attempt to converge multiple functionalities of white-light generation, shielding, and optical sensing into a single platform. While other rare-earth systems may outperform Dy3+ ions in specialized roles, this ion offers a unique combination of optical characteristics and structural adaptability, especially in low-phonon glass hosts like PBPZBa. This broader perspective situates the study in the context of multifunctional rare-earth-doped materials, and the manuscript can benefit from including such a review to justify the material choice.
The luminescent behavior of rare earth Dy3+ ions doped lead borophosphate zinc barium glasses in the UV, visible, and NIR spectral regions. These glass materials are particularly applicable for applications in the white-light-emitting diodes, optical amplifiers, fiber optics, radiation shielding, and optical sensing. The presence of P2O5 and B2O3 promotes the formation of linkages B-O-P between PO4 and BO4 structural units. Such linkages contribute to a more interconnected glass network [8,9]. Incorporating lead oxide (Pb3O4) enhances the physical attributes like density and refractive index, and improves resistance to devitrification, as well as moisture degradation. Incorporating BaO and ZnO is essential for optimizing luminescence performance, structural robustness, and strong resistance to thermal degradation, which makes them promising candidates for advanced optical, photonic, and radiation shielding applications as mentioned [10,11].
In recent years, significant efforts have been devoted to understanding the incorporation mechanism and photoluminescence behavior of Dy3+ ions in various amorphous glass matrices, particularly borophosphate, borosilicate, tellurite, and lead-phosphate systems. Previous studies have demonstrated that the local structural environment, site symmetry, and covalency around Dy3+ ions strongly influence the intensity ratio of the 4F9/26H15/2 (blue) and 4F9/26H13/2 (yellow) transitions, which governs white-light generation. Judd–Ofelt analysis has been widely employed to evaluate the radiative properties and to correlate Ω2 values with structural asymmetry in rare-earth-doped glasses. Furthermore, concentration quenching, cross-relaxation, and energy migration processes have been identified as key factors limiting emission efficiency at higher dopant levels. In multicomponent glass systems, network formers such as B2O3 and P2O5 and modifiers like PbO, ZnO, and BaO play a crucial role in tailoring the phonon energy, non-bridging oxygen content, and local crystal field strength, thereby directly affecting Dy3+ luminescence performance. Therefore, a systematic investigation of Dy3+ incorporation in Pb–B–P–Zn–Ba-based amorphous matrices is essential for optimizing white-light emission and enhancing photonic device applicability.
The present study investigates the impact of varying Dy3+ ion concentrations (0.5, 1.0, 1.5, and 2.0 mol%) in PbO-B2O3-P2O5-ZnO-BaO glasses on white-light luminescence. Among these, Dy10 glass exhibits the maximum luminescence intensity compared to other concentrations of Dy3+-doped glasses. This enhanced luminescence is attributed to lower non-radiative losses in the glass matrix. To better understand, the structural morphological investigations were carried out through X-ray diffraction, SEM, and FTIR studies.

2. Experimental

The detailed glass sample composition in the present study is as follows:
PBPZBaDy5: 10PbO-20B2O3-49.5 P2O5-10ZnO-10BaO-0.5 Dy2O3;
PBPZBaDy10: 10PbO-20B2O3-49.0 P2O5-10ZnO-10BaO-1.0 Dy2O3;
PBPZBaDy15: 10PbO-20B2O3- 48.5 P2O5-10ZnO-10BaO-1.5 Dy2O3;
PBPZBaDy20: 10PbO-20B2O3-48.0 P2O5-10ZnO-10BaO-2.0 Dy2O3.
High-purity chemical reagents, including PbO, H3BO3, P2O5, ZnO, BaCO3, and Dy2O3, were weighed with precision and uniformly blended with an agate mortar. The uniform powder mixture was melted in a silica crucible at 1350 °C for one hour using a PID-controlled furnace. After obtaining a homogeneous melt, the liquid was poured into a preheated brass mold and subjected to annealing at 450 °C to relieve residual internal stresses within the prepared samples. Synthesized glass samples exhibited an amorphous nature, which was verified through XRD analysis carried out using a Rigaku D/Max ULTIMA III diffractometer (Rigaku Corporation, Tokyo, Japan) utilizing CuKα radiation. The prepared glass samples were optically polished to dimensions of approximately 1.0 × 0.2 cm2, and their densities were measured using Archimedes’ principle with o-xylene employed as the liquid medium. Refractive index values were calculated using an Abbe refractometer with mono-bromonaphthalene as the contact medium, utilizing a sodium light source (589.3 nm wavelength). Optical absorption spectra of the fabricated samples were recorded at room temperature over the wavelength range 200–1800 nm using a UV-Vis-NIR spectrophotometer (JASCO Corporation, Tokyo, Japan). Emission spectra for all the glasses were obtained at room temperature using a (Lumina) Thermo Scientific luminescence spectrophotometer (Thermo Fisher Scientific, Waltham, MA, USA) operating within a wavelength range of 200 to 900 nm. The lifetime decay measurements are performed following methodologies outlined in previous studies [12,13].
In the present glass compositions, Dy2O3 was incorporated by partially substituting P2O5 while maintaining the total molar percentage at 100 mol%. P2O5 acts as a primary glass former in the borophosphate network; therefore, its gradual reduction compensates for the introduction of Dy3+ ions without significantly disturbing the overall glass-forming ability. The substitution strategy ensures compositional consistency across all samples and enables a systematic investigation of the influence of Dy3+ concentration on structural and luminescence properties. The incorporation of Dy3+ ions in place of P2O5 is expected to modify the local network connectivity by generating non-bridging oxygens (NBOs) and altering the P–O–P and B–O–P linkages, which in turn affects the optical and radiative characteristics of the prepared glasses.

3. Results and Discussion

Physical properties of the prepared glass samples with different Dy3+ ion concentrations were evaluated using established formulas [14,15], measured molecular weight (M), density ( ρ ), refractive index (nd), and the experimentally determined parameters. The related physical properties were summarized in Table 1.
The density of each glass sample was determined based on Archimedes principle using o-xylene as the immersing liquid, following the relationship [13,16]:
ρ ( gm / cm 3 )   =   W a W a W b × ρ b
the weight of the glass sample in air is denoted by Wa, while Wb represents the weight of the glass sample when submerged in o-xylene. The density of o-xylene is given as ρb = 0.86 g/cm3. The molar volume (Vm) of the glass samples was determined using the following formula:
V m   =   MT / ρ
Here ρ represents the density of the samples, and MT denotes the total molecular weight of the multi-component of the glass system, determined using the following relation:
MT = XPbO + XB2O3 + XP2O5 + XZnO + XBaO
where X is molar fraction of the chemical component.
The refractive index (nd) of the samples was determined directly using an Abbe refractometer.
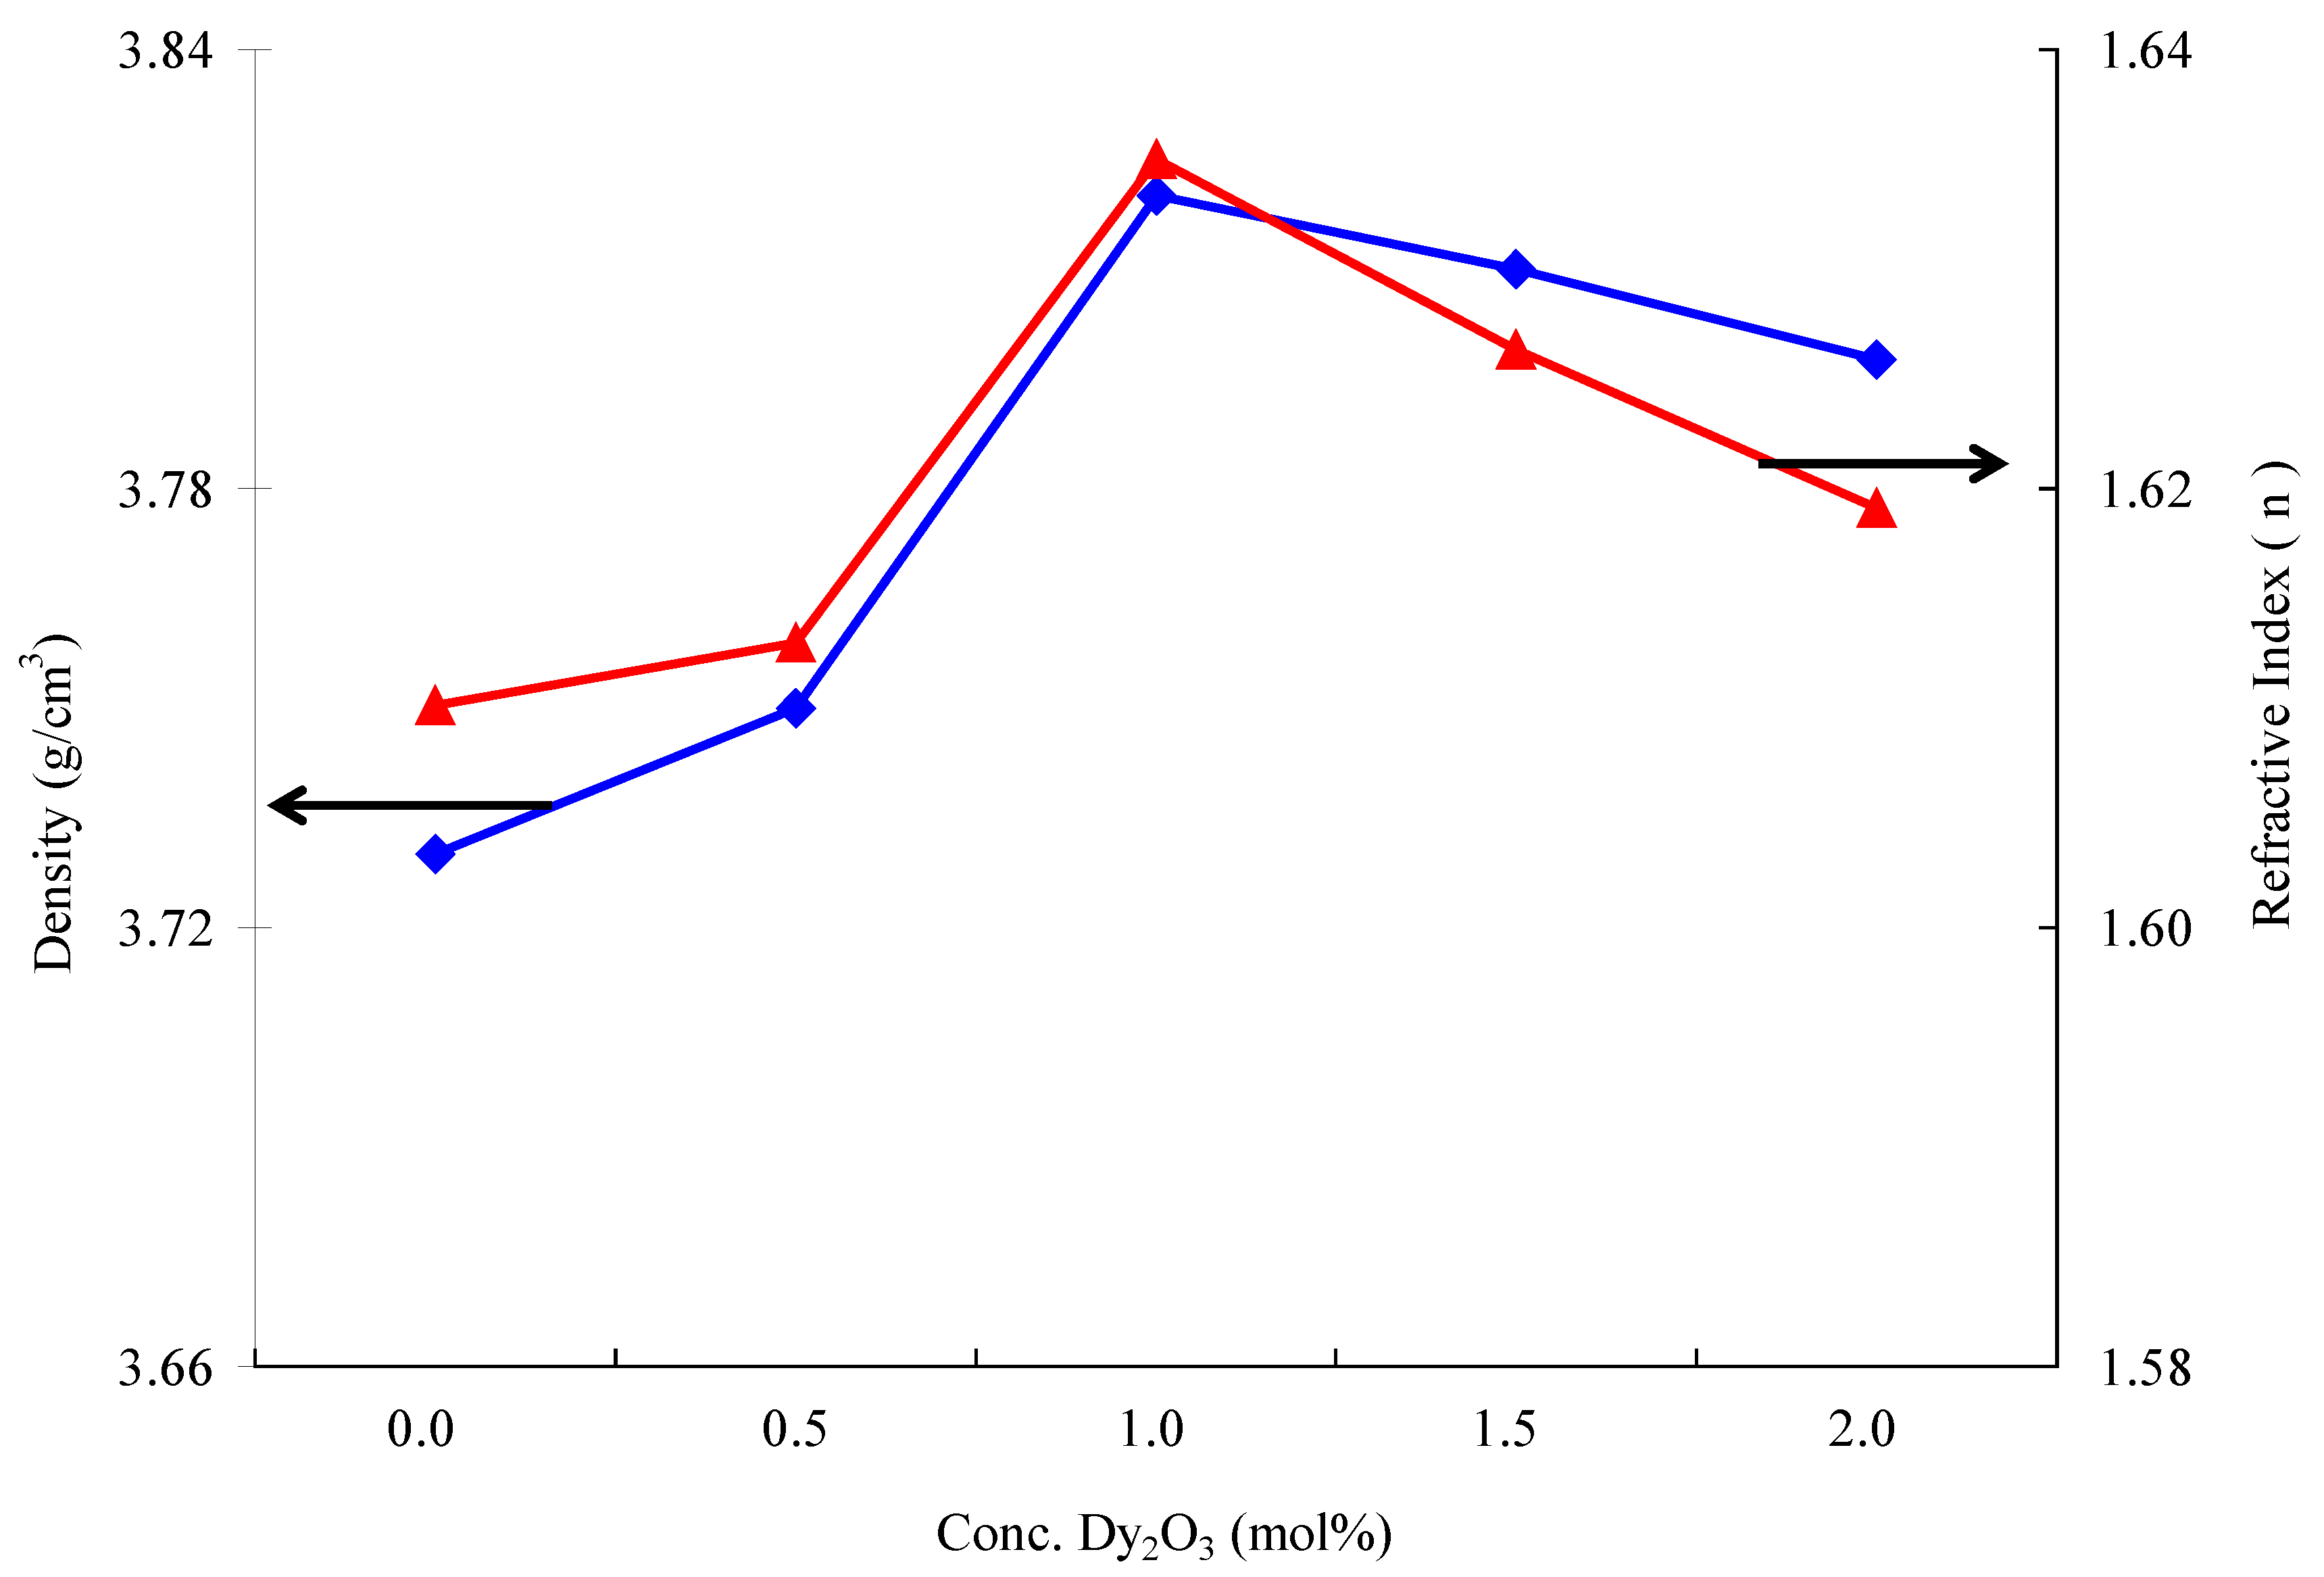
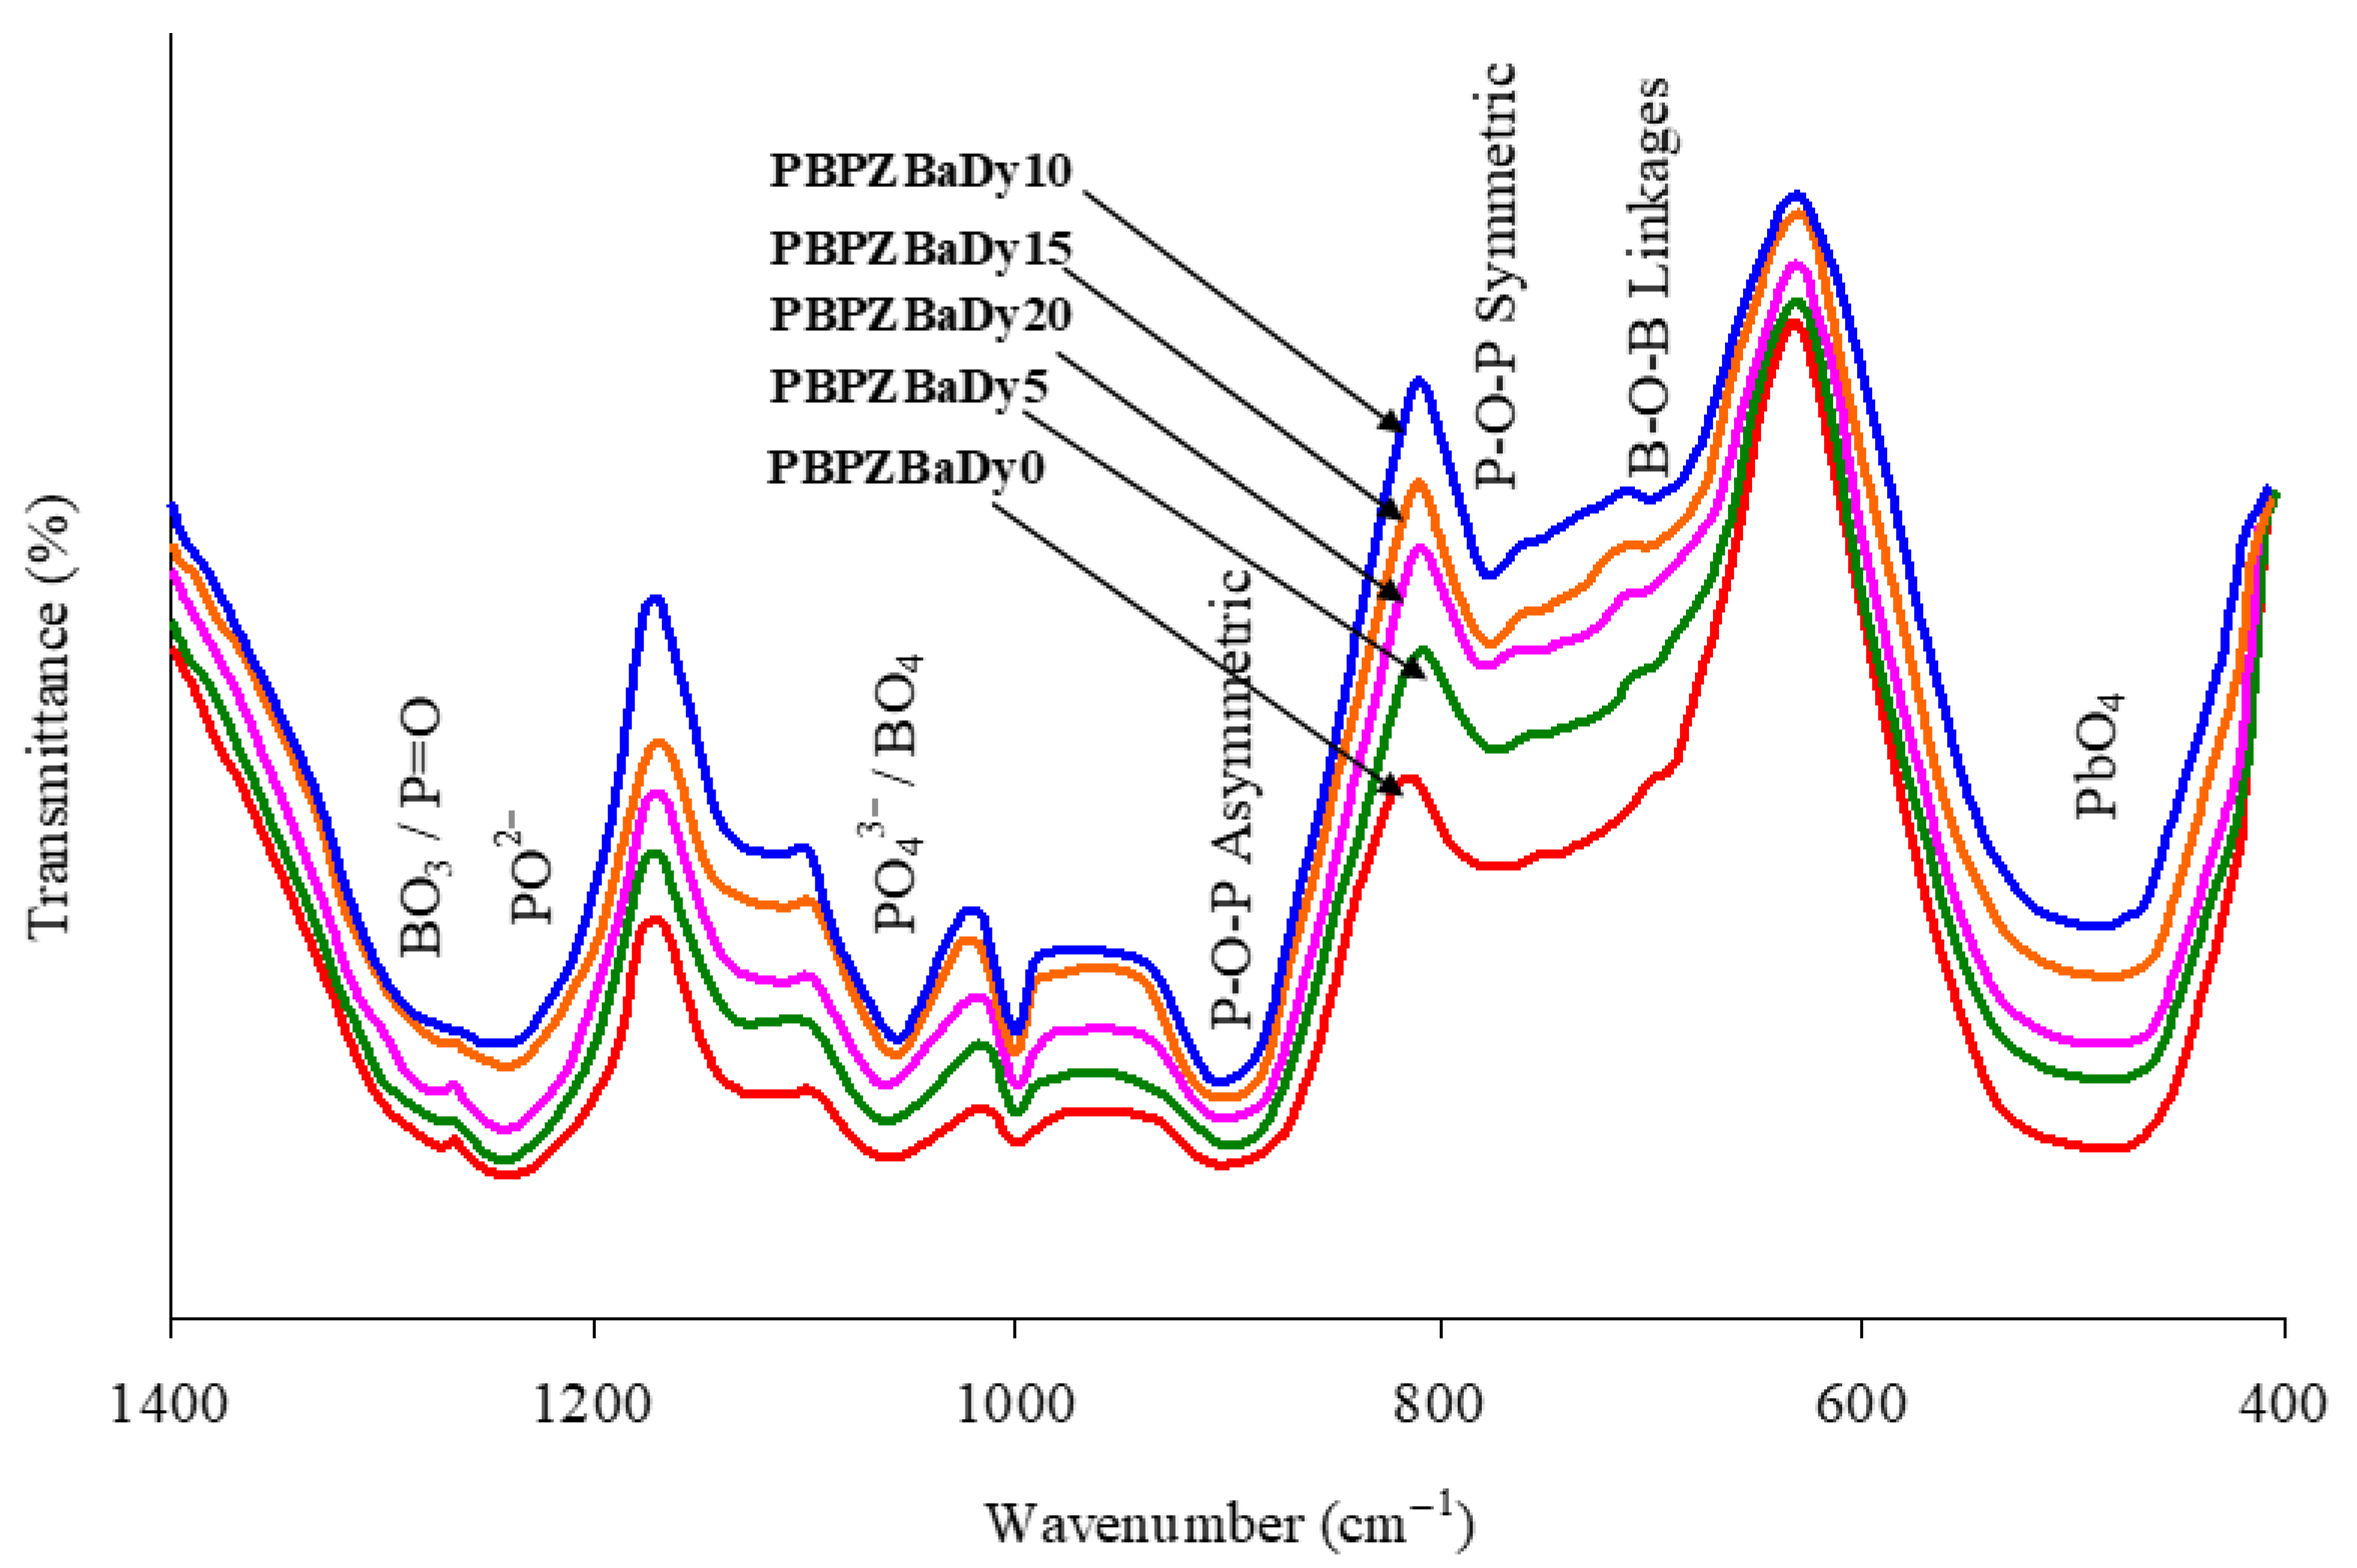
Figure 1 illustrates variation in density ( ρ ) and refractive index (nd) as a function of Dy3+ ion concentration. The results indicate that increasing Dy3+ from 0.5 to 1.0 mol% enhances both density and refractive index. At lower Dy2O3 concentrations (0.5–1.0 mol%), the high field strength and relatively large atomic mass of Dy3+ enhance Dy–O bond strength and improve local structural compactness without significantly disrupting the glass network. The FTIR spectra support this interpretation. For the 1.0 mol% sample, the bands corresponding to asymmetric P–O–P and B–O–P linkages (around ~1080–910 cm−1) show relative strengthening, indicating improved cross-linking between BO4 and PO4 units and reduced structural disorder. This enhanced network connectivity and compact packing explain the observed increase in density (3.75 → 3.82 g/cm3) and refractive index (1.613 → 1.635).
However, beyond 1.0 mol% Dy2O3, excessive incorporation of Dy3+ leads to the formation of additional non-bridging oxygens (NBOs) and partial disruption of P–O–P/B–O–P linkages, as indicated by the relative enhancement of bands associated with PO2 and BO3 units in the FTIR spectra. Furthermore, possible Dy3+-Dy3+ clustering at higher concentrations reduces network connectivity and structural compactness. This increased depolymerization explains the slight decrease in density and refractive index for 1.5 and 2.0 mol% samples. Thus, the non-linear trend reflects an initial network strengthening effect followed by depolymerization and ion clustering at higher Dy3+ content.
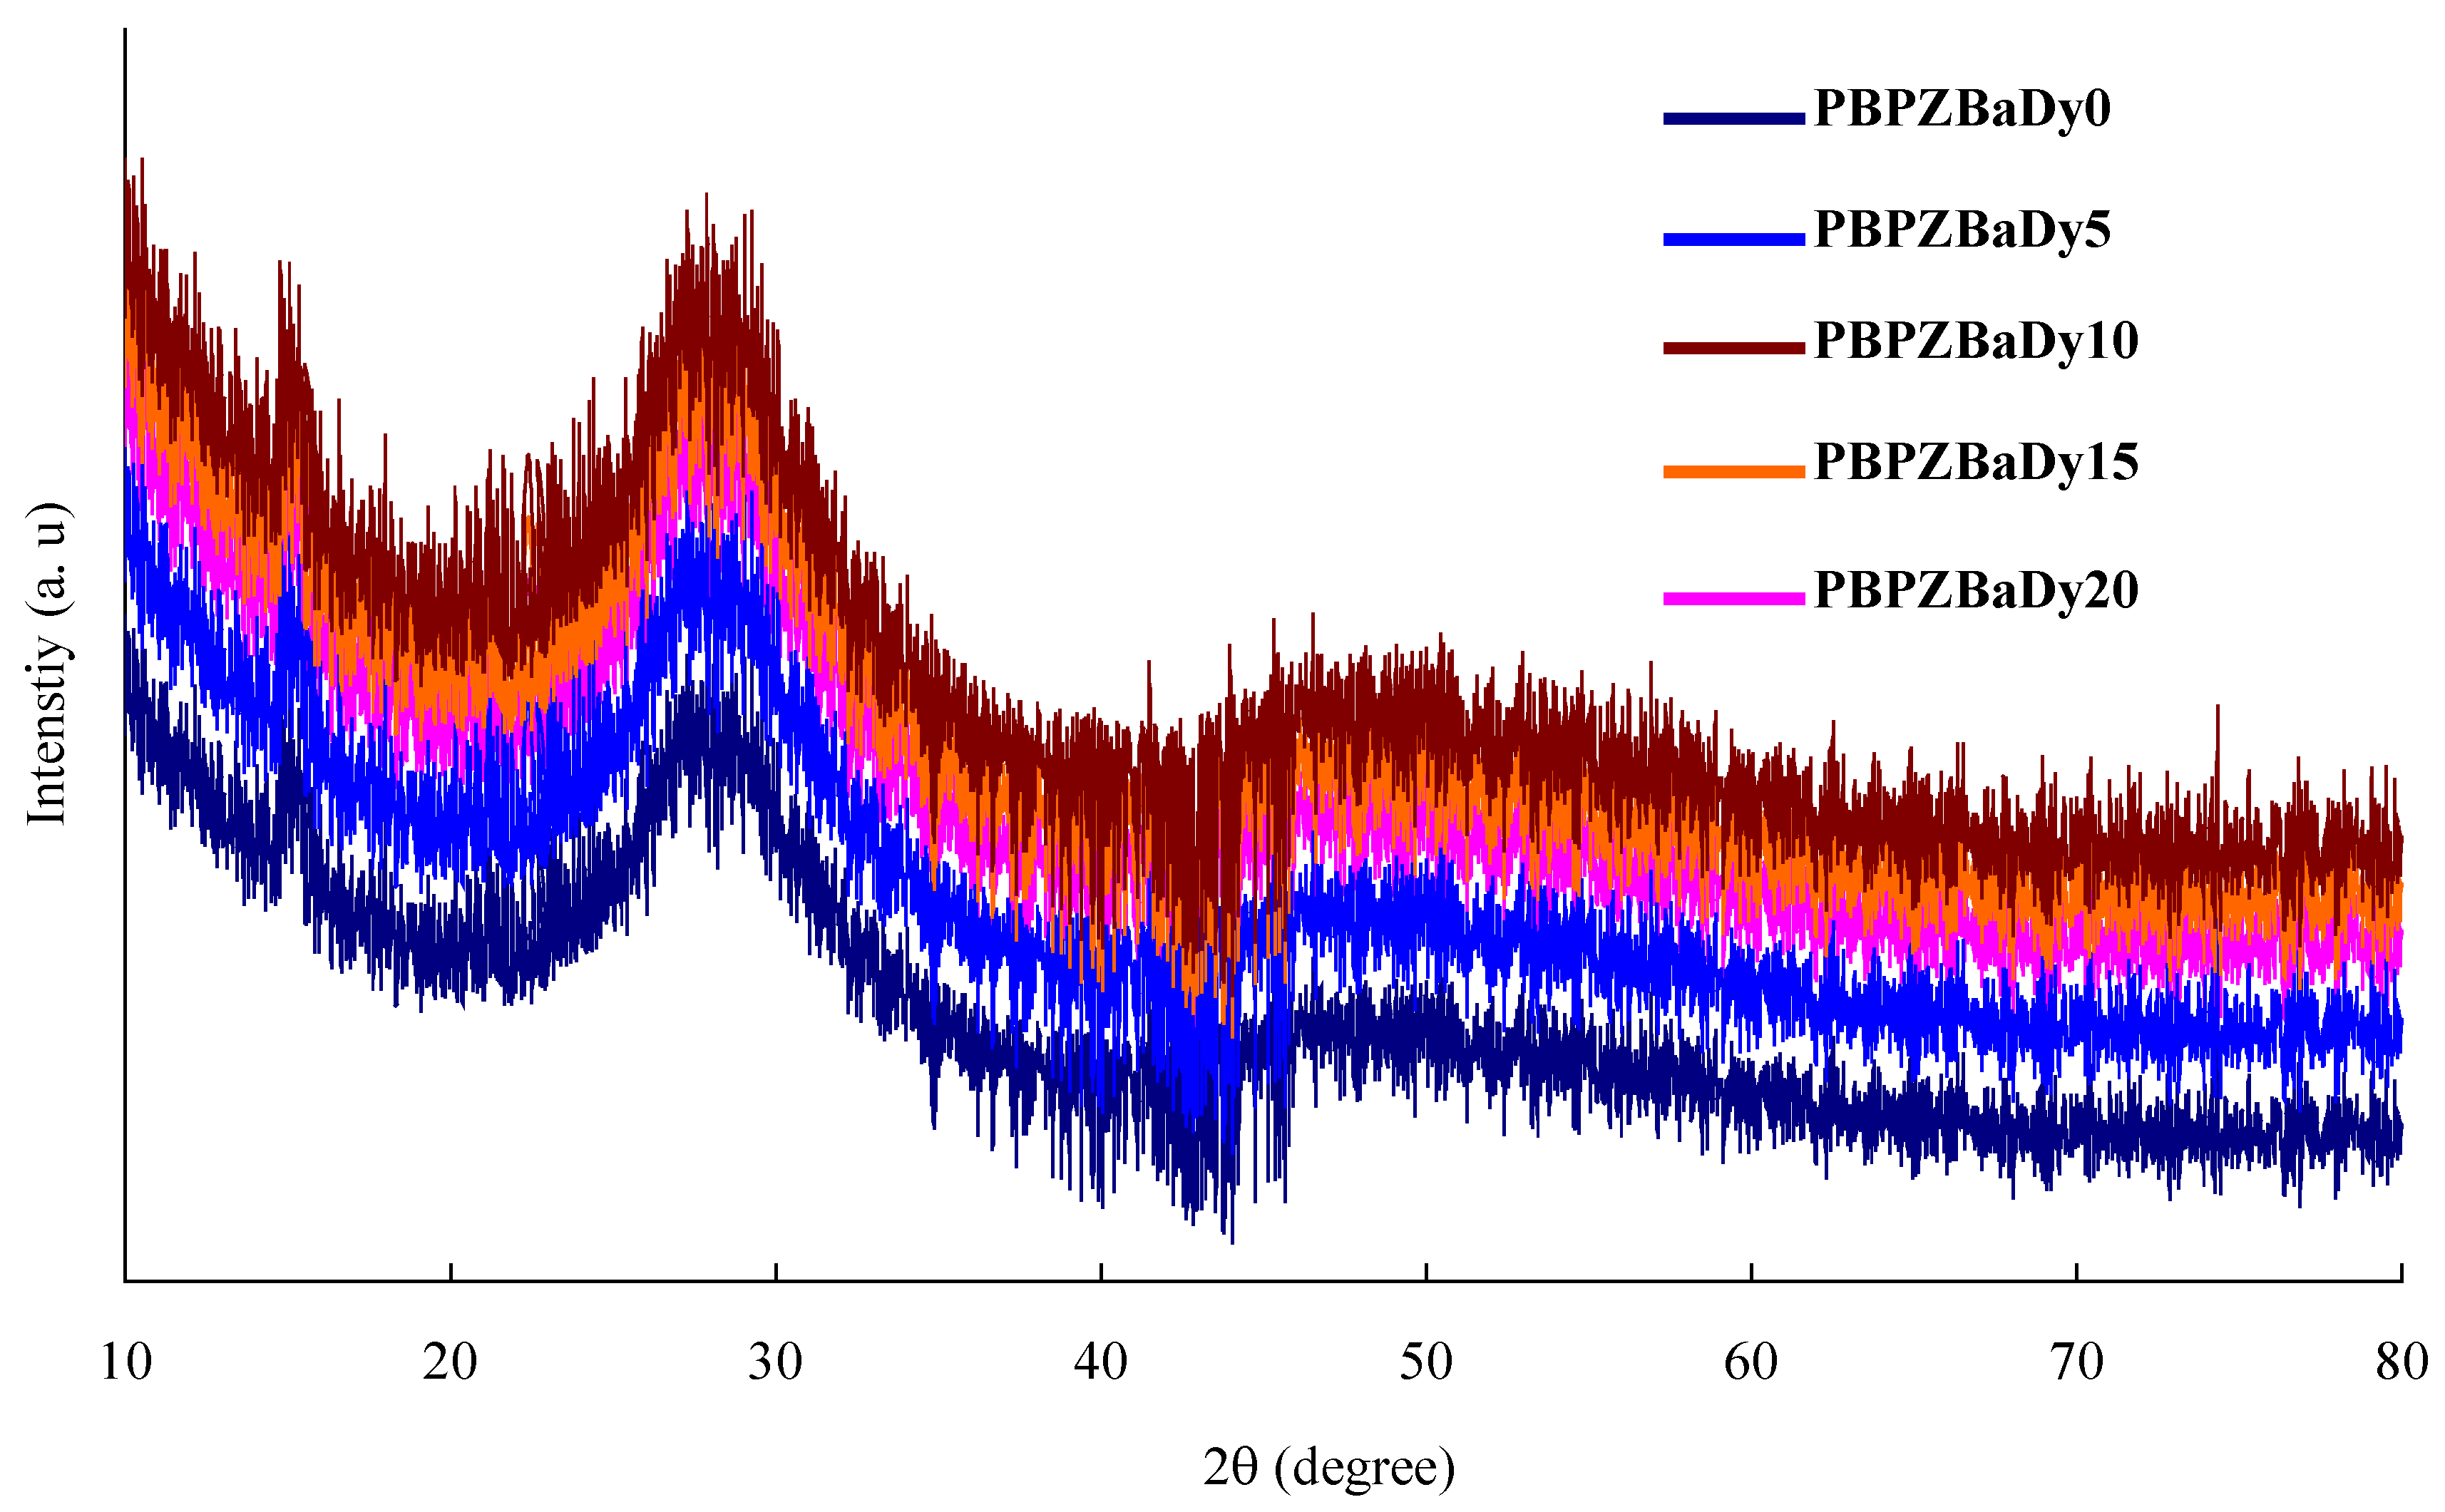
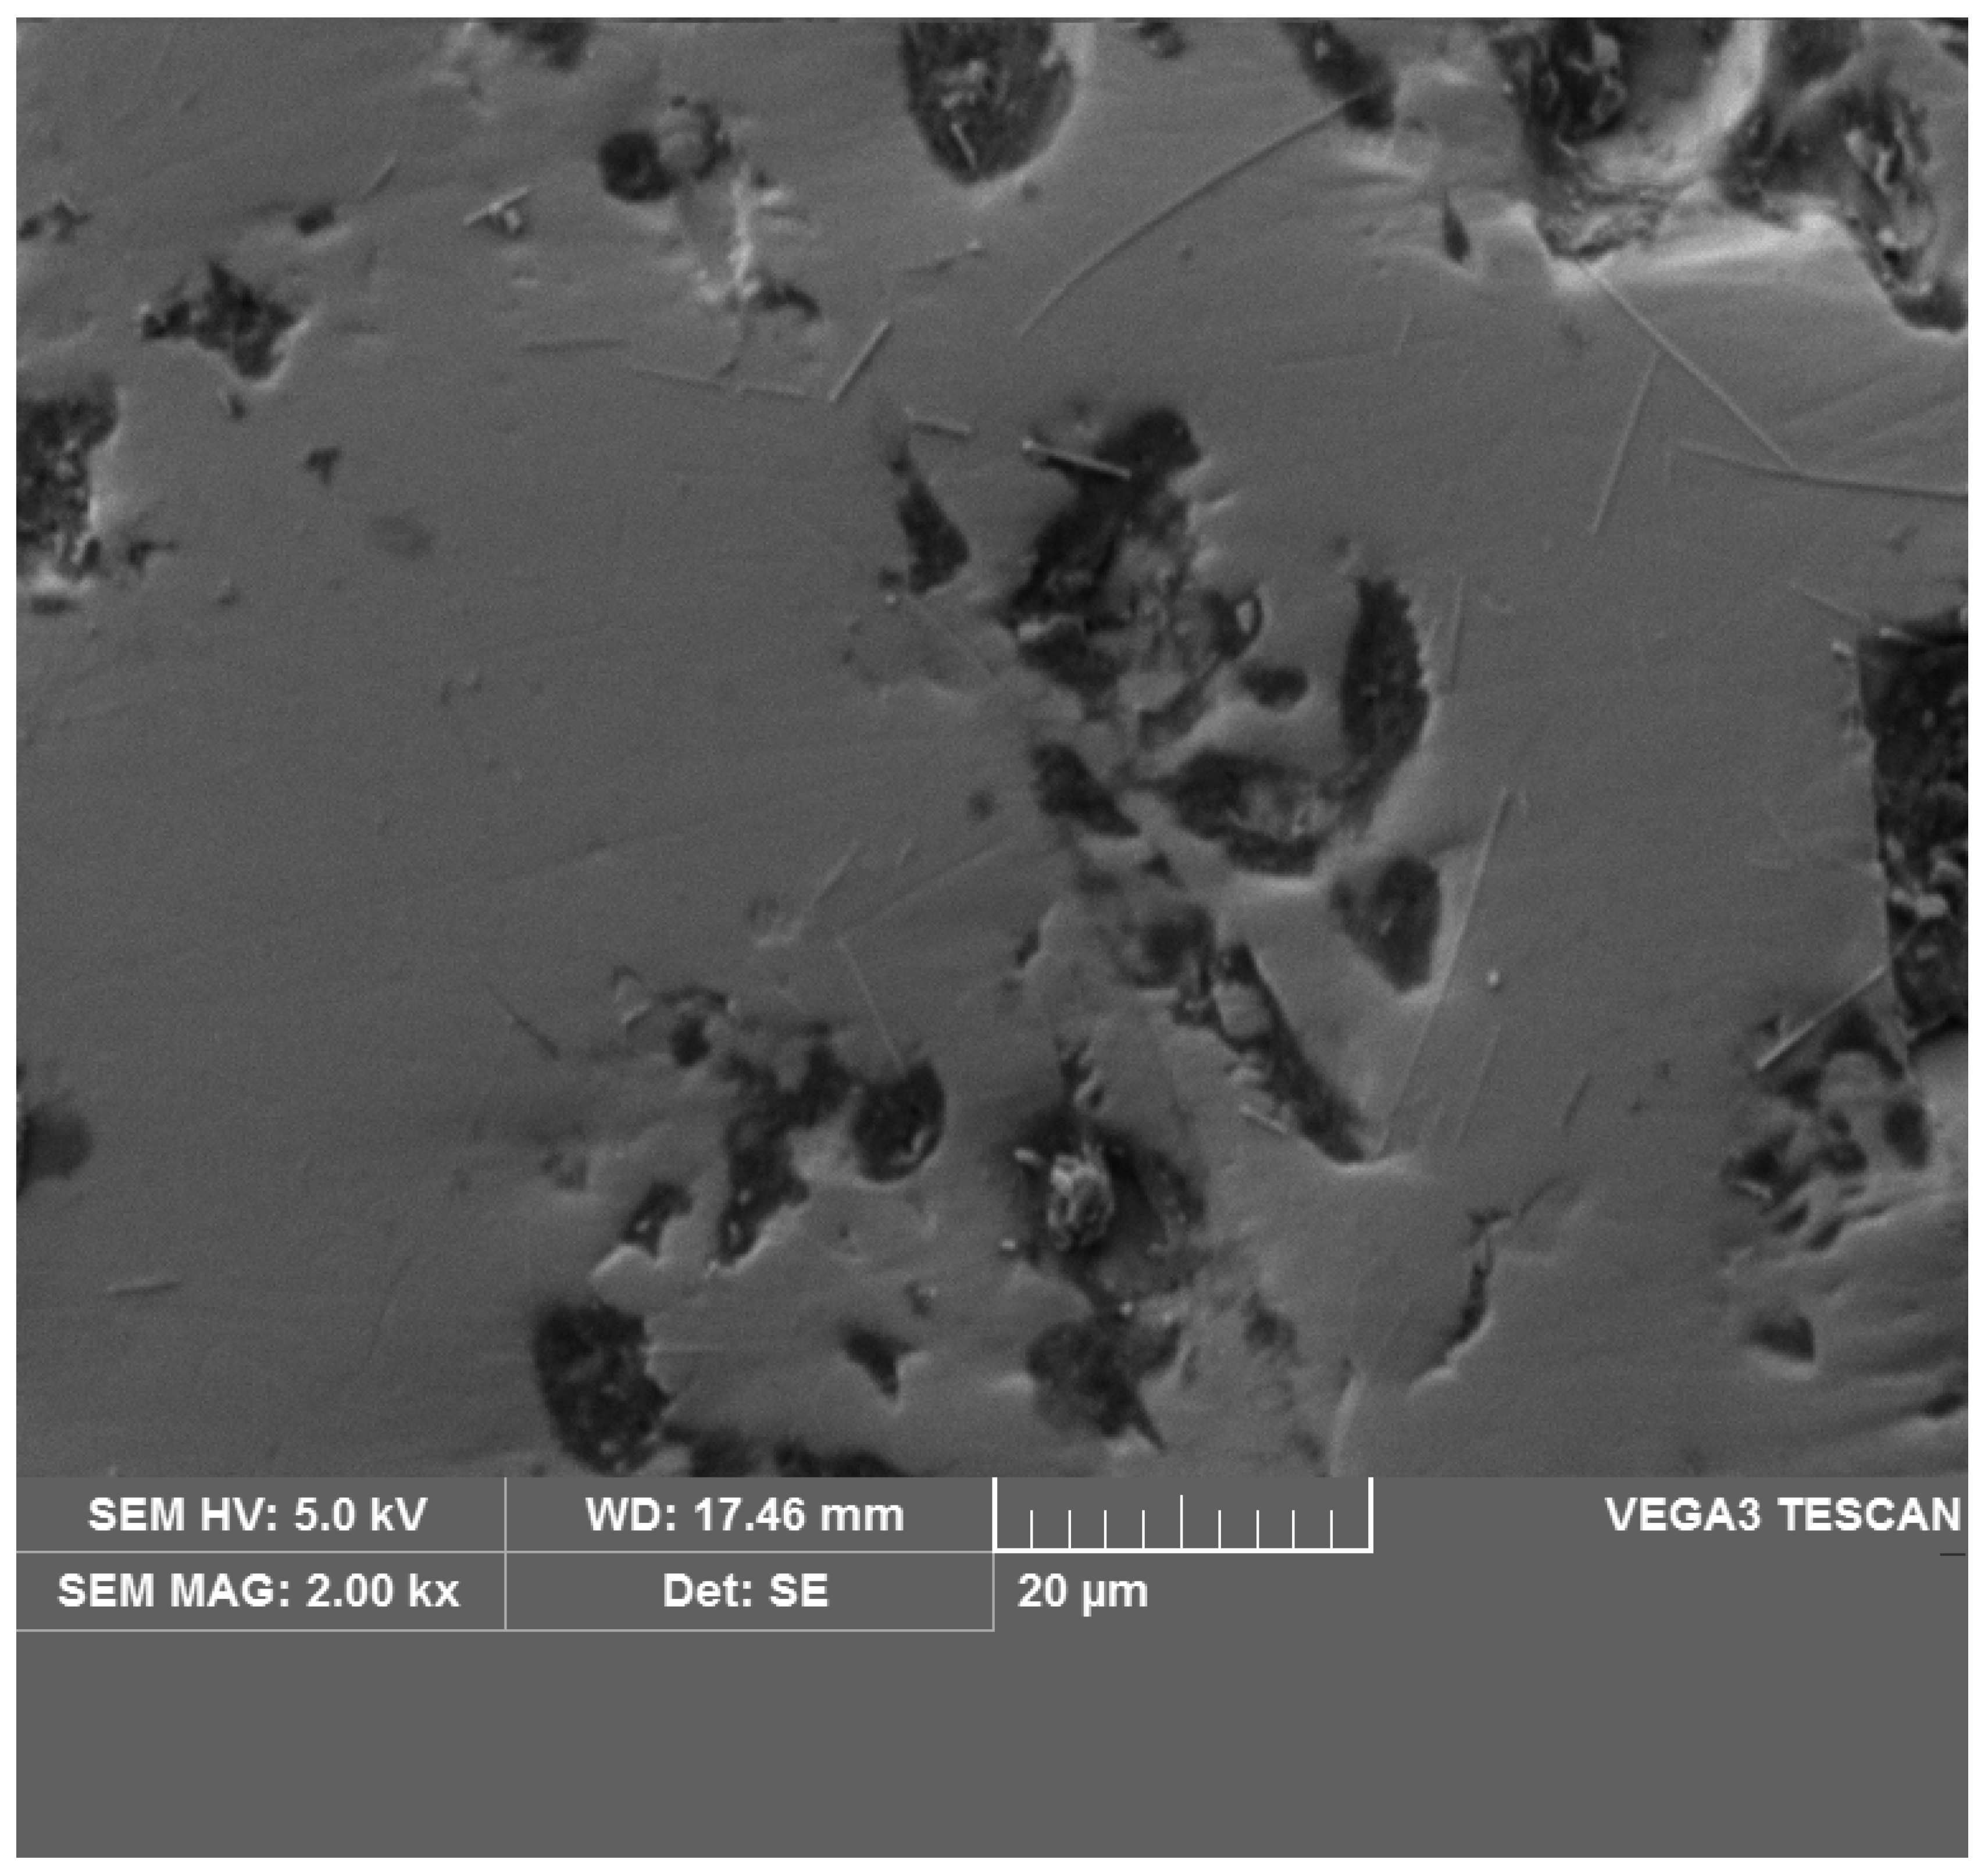
Figure 2 presents the X-ray diffractogram pattern for all the glass samples, confirming their amorphous structure within the glasses. Figure 3 shows the SEM image of PBPZBaDy10 glass, revealing microscale surface features. These grain formations likely originated during the melting and annealing stages.
Figure 4 shows the FTIR spectra of PBPZBaDy10 glass, which exhibits distinct vibrational bands corresponding to different structural units present in the borophosphate glass network. The bands observed at ~1280 cm−1 and 1240 cm−1 are associated with trigonal BO3 and P=O bonds of PO2 stretching vibrations, respectively. These high-frequency bands arise from strong B-O and P=O bonds present in the network. The peak around 1080 cm−1 corresponds to the symmetric stretching vibrations of tetrahedral BO4 and PO43− units. Another band near 910 cm−1 is assigned to asymmetric stretching vibrations of bridging P–O–P linkages, confirming the formation of a connected phosphate network. Additional bands at 780 cm−1 and 690 cm−1 indicate symmetric P–O–P and B–O–B band vibrations, which further support the presence of a mixed borophosphate structural framework. The low-frequency band around 500 cm−1 is attributed to Pb-O and Zn-O vibrations, indicating the participation of PbO4 and ZnO4 structural units acting as network modifiers. All the assigned bands are tabulated in Table 2. Notably, the asymmetric vibration bands of the highest intensity and slightly broadened in 1.0 mol% of Dy3+-doped glasses suggest increased network disruption [17,18,19,20,21].
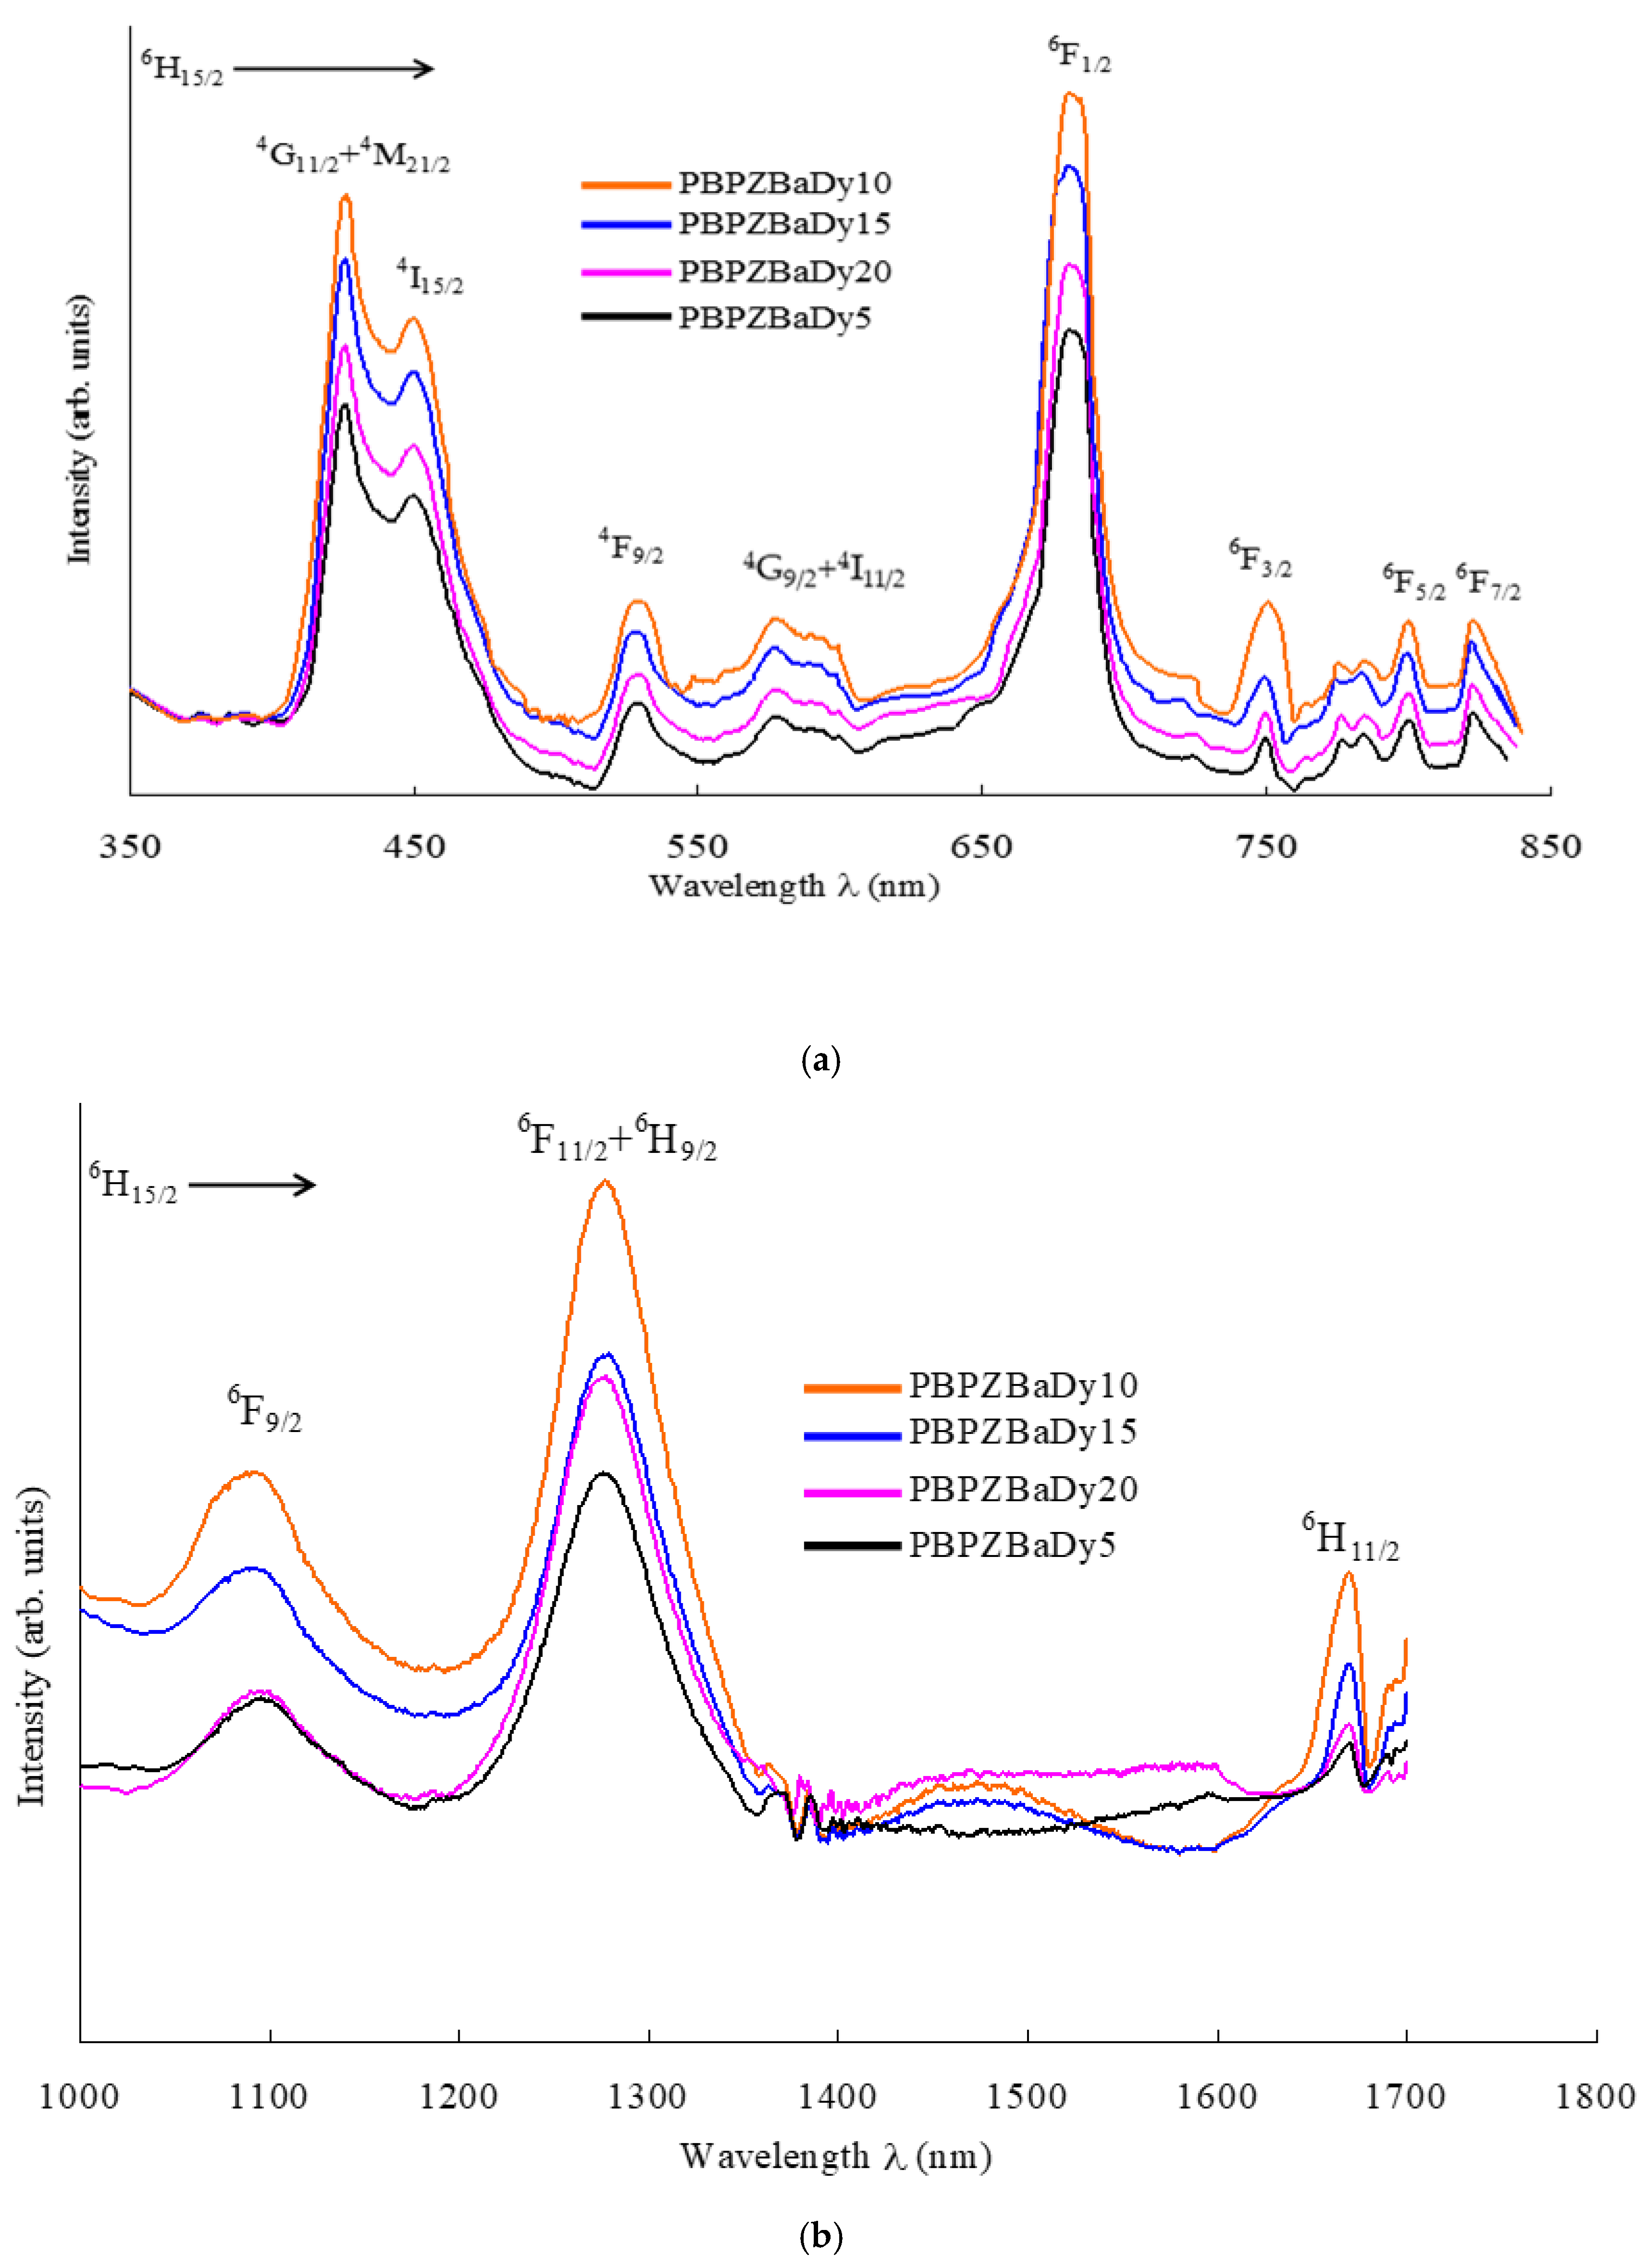
Figure 5a,b presents the absorption spectra of the labeled glass samples measured over a 200–2000 nm range. The spectra have exhibited the bands in the UV-vis-NIR region corresponding to 4f electron transitions of Dy3+ ions: 6H15/2 → 4G11/2 + 4M21/2, 4I15/2, 4F9/2, 4G9/2 + 4I11/2, 6F1/2, 3/2, 5/2, 7/2 (UV-vis region), and 6F9/2, 6F11/2+6H9/2, and 6H11/2 (NIR region). Among these, the transitions 6H15/2 → 4G11/2 + 4M21/2,6F1/2 (vis), and 6F11/2 NIR region exhibit greater intensity than other transitions.
In the visible–NIR region, several weaker Dy3+ absorption features accompany the dominant bands. A shoulder between 570 and 600 nm is assigned to the 6H15/24G9/2 transition, with possible contribution from nearby 4I11/2. In the 760–795 nm range, the spectral structure results from overlapping 6H15/26F3/2 (≈760–780 nm) and 6H15/26F5/2 (≈790–800 nm) transitions, whose Stark components are partially resolved in the glass host. Additional weak bands observed between 1400 and 1600 nm are attributed to higher Stark levels within the 6F9/26H7/2 group, and their evolution with Dy3+ content reflects changes in the local crystal field rather than any sample-mixing artifact.
The slight variation in the absorption profile observed at different Dy3+ concentrations is attributed to concentration-induced modifications in the local field environment and Stark splitting effects within the glass network. These systematic spectral changes correlate well with the trends observed in density, refractive index, Judd–Ofelt parameters, and lifetime measurements, confirming that the variations arise from structural effects rather than any sample misidentification.
The decrease in peak intensities of absorption spectra, with increasing Dy3+ ion content more than 1.0 mol% in PbO-B2O3-P2O5-ZnO-BaO glasses, can be attributed to concentration quenching effects. At lower Dy3+ concentrations (1.0 mol%), the ions are uniformly distributed within the glass network, enabling effective optical absorption, whereas higher concentrations (1.5 and 2.0 mol%) promote stronger Dy3+–Dy3+ interactions that facilitate non-radiative energy transfer through cross-relaxation and energy migration processes, leading to reduced absorption intensity and total optical conversion efficiency.
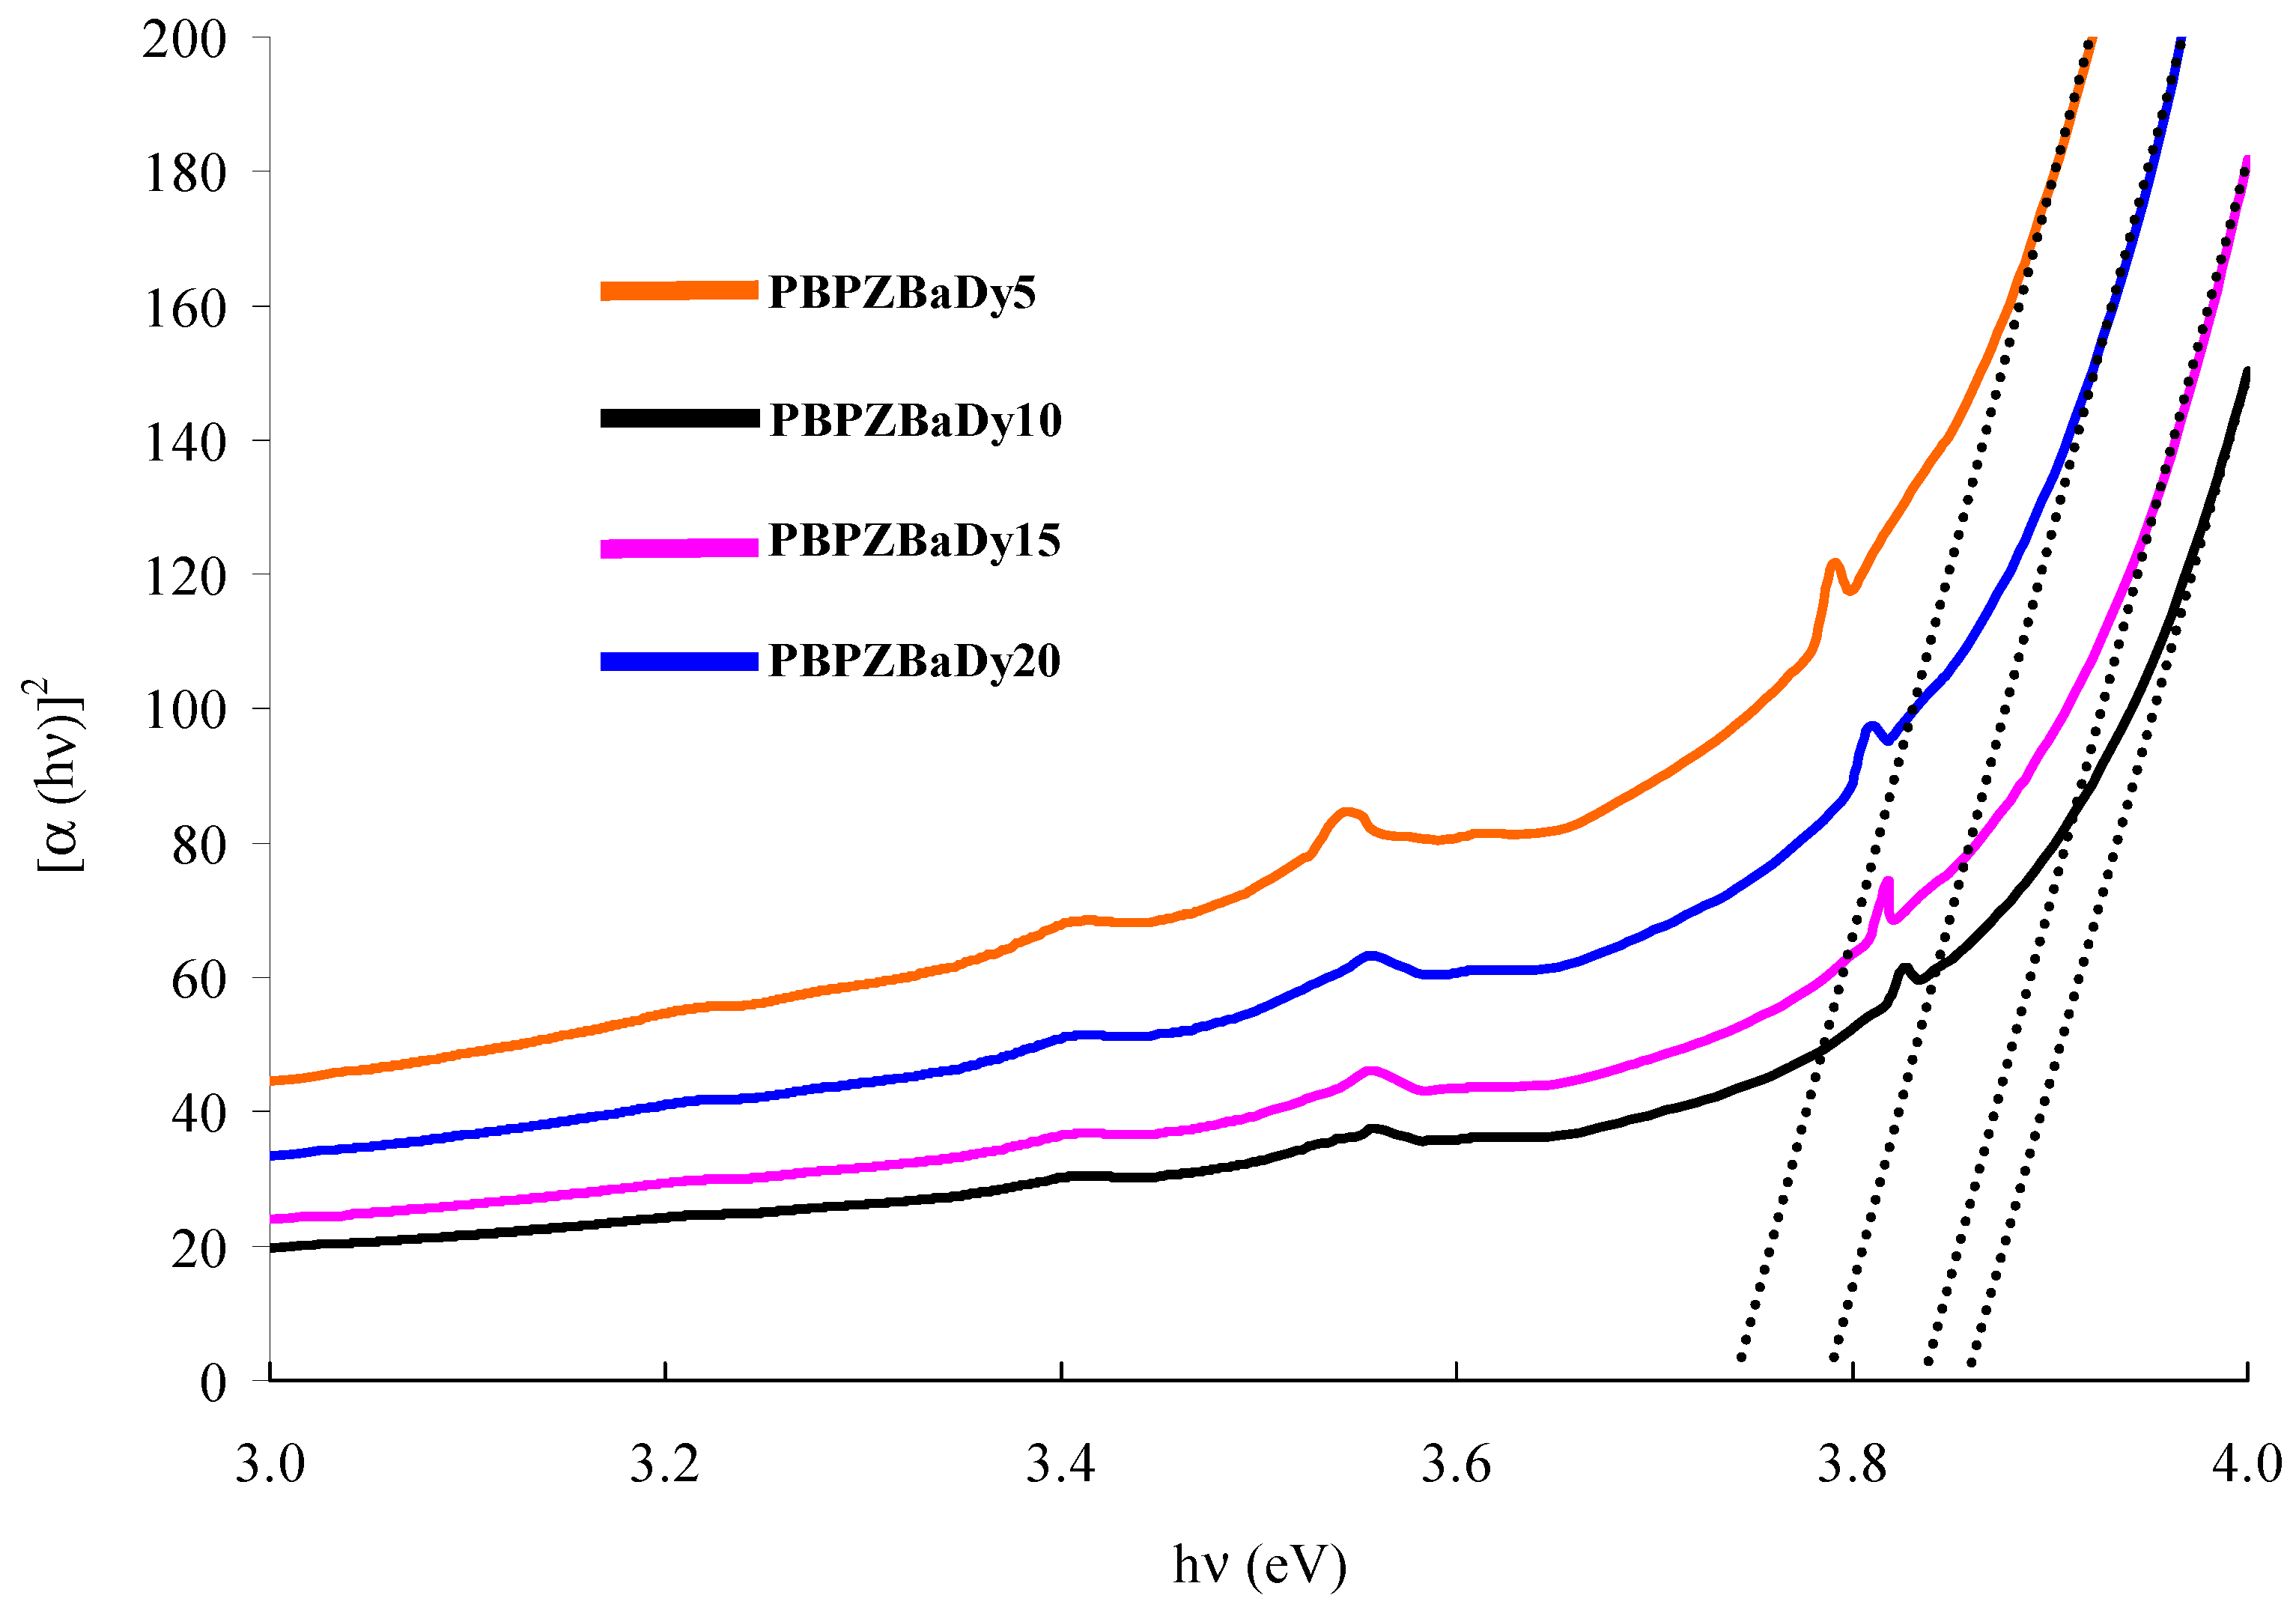
The optical energy gap (E0) is a key parameter for understanding the electronic structure and optical response of glass materials. In this study, E0 values for Dy3+-doped samples were determined from the UV–Visible absorption spectra using Tauc’s method (Figure 6). The extracted band gap primarily corresponds to the fundamental absorption edge of the host glass matrix arising from charge-transfer transitions between oxygen ions and network-forming cations. The Dy3+, 4f–4f transitions appear as weak and sharp bands superimposed on the broad absorption edge and, owing to their localized and parity-forbidden character, do not affect the linear region used for band gap extrapolation. Hence, the evaluated E0 values mainly reflect changes in the glass network structure rather than direct contributions from Dy3+ electronic transitions. With Dy3+ incorporation up to 1.0 mol%, a slight decrease in E0 is observed, which is attributed to the generation of additional non-bridging oxygens and increased structural disorder. The variation in E0 values indicates compositional modification of the glass network and confirms the suitability of the material for photonic and luminescent device applications [22,23].
The absorption coefficient α is correlated with the optical band gap energy (Eo), which can be expressed using the following relation:
α (hν) ∝ B (hν − Eopt)1/2
Here, B corresponds to the band tailing parameter, while represents the photonic energy. The value of E0 was observed for 1.0 mol% of Dy3+-doped glass composition (Table 1), suggesting an increased level of structural disorder within the glass network.
The experimental oscillator strengths (OS) (fexp) corresponding to various absorption transitions of Dy3+ ions in PBPZBa glasses were evaluated from the absorption spectra using the standard equation [23].
f e x p = 4.319 × 1 0 9 ε ( ν ) d ν
The parameters involved in Equation (2) are defined in earlier reports [24,25,26,27,28].
The calculated electric dipole oscillator strengths (fcal) for Dy3+ ions were obtained using Judd–Ofelt theory, as described in Equation (6), following the formulations reported in Refs. [24,25,26,27,28]. A close agreement between fexp and fcal values was observed, as evidenced by the root mean square deviation presented in Table 3.
f cal = 8 π 2 m c v χ 3 h ( 2 J + 1 ) λ = 2,4 , 6 Ω λ f N γ , S ,   L J U λ f N γ , S , L J 2
Using Equation (6), the J-O parameters (Ω2, Ω6, and Ω4) were determined for all the Dy3+-doped glass samples. The evaluated parameters follow the trend Ω2 > Ω6 > Ω4 (Table 3), which is consistent with earlier reports [29,30,31]. Among the studied samples, the glass PBPZBaDy10 exhibited the lowest Ω2 value, suggesting reduced asymmetry and lower covalency around Dy3+ ions. Notably, the Ω2 value decreases progressively with Dy3+ ion concentration increased up to 1.0 mol%, beyond which an increase is observed for higher dopant levels (1.5 and 2.0 mol%).
This behavior indicates an initial reduction in the covalent character of the Dy-O bonds, followed by increased structural distortion at higher concentrations. The increase in Dy3+ content likely perturbs the glass network by enlarging the spacing between P–O–P and B–O–P linkages. Accordingly, the Dy–O bond lengths increase, leading to a weakened local crystal field around Dy3+ ions. This structural modification helps suppress phonon-assisted losses and cross-relaxation processes, thereby improving the optical performance of the glass system.
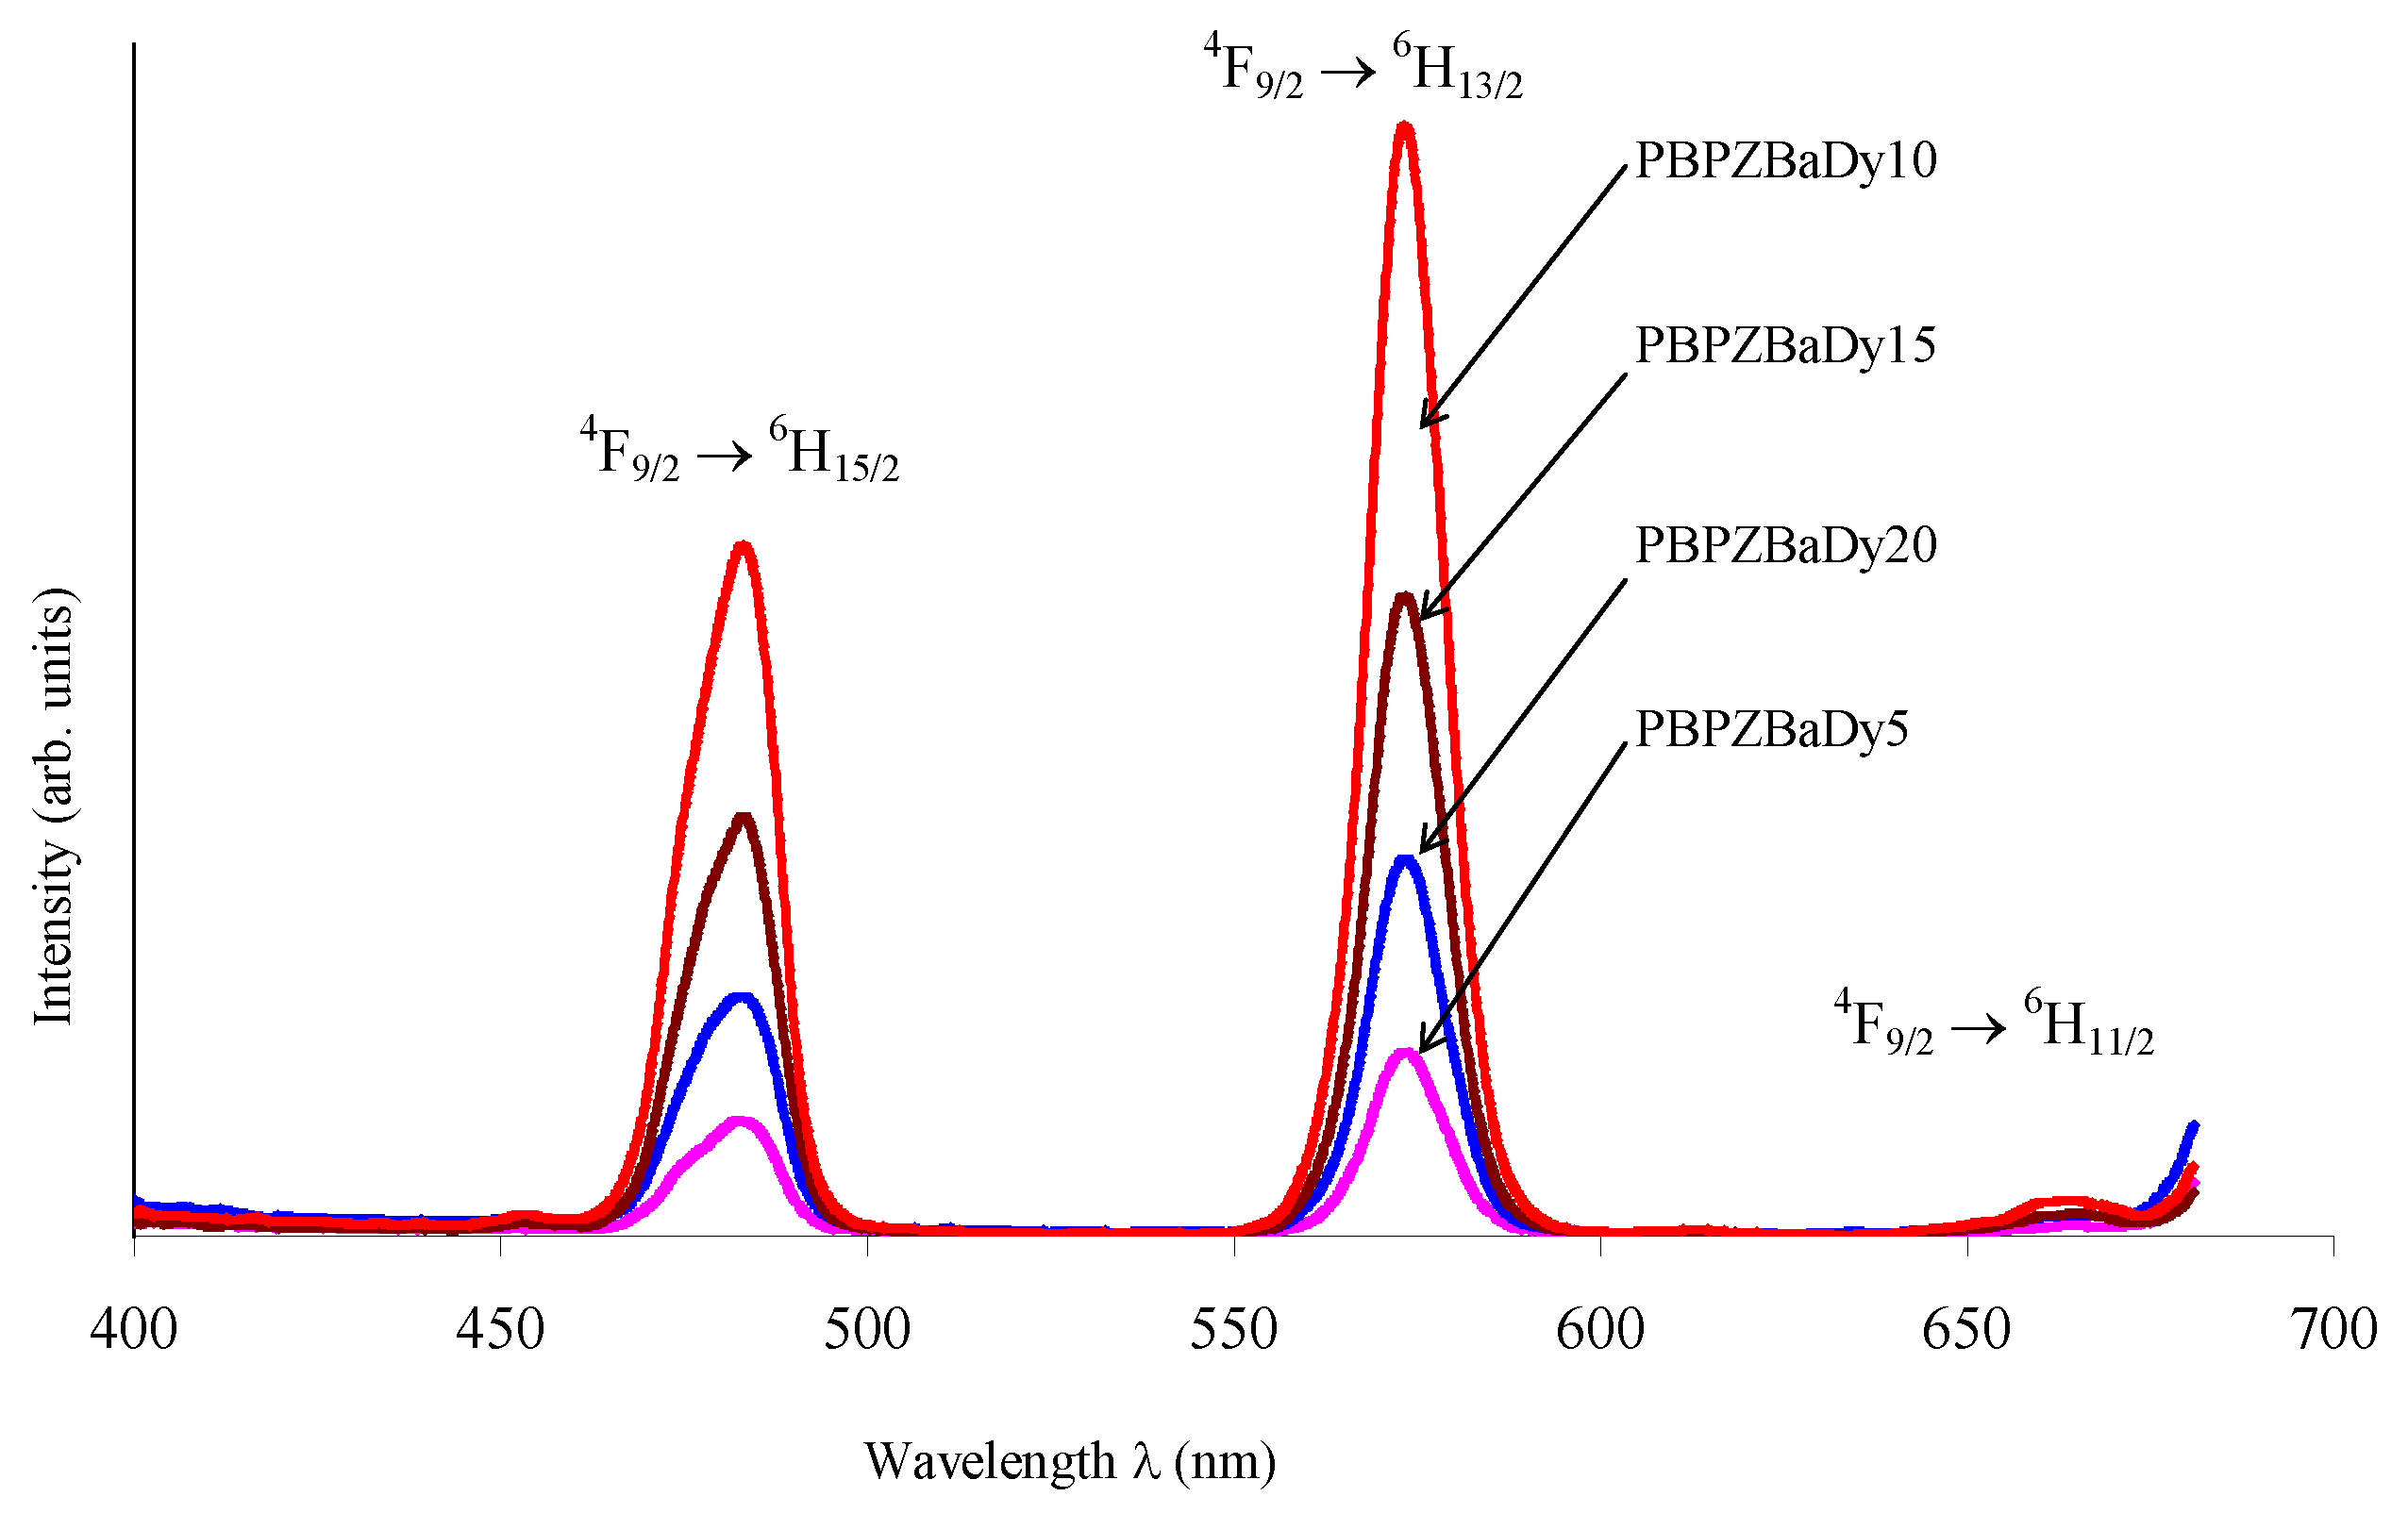
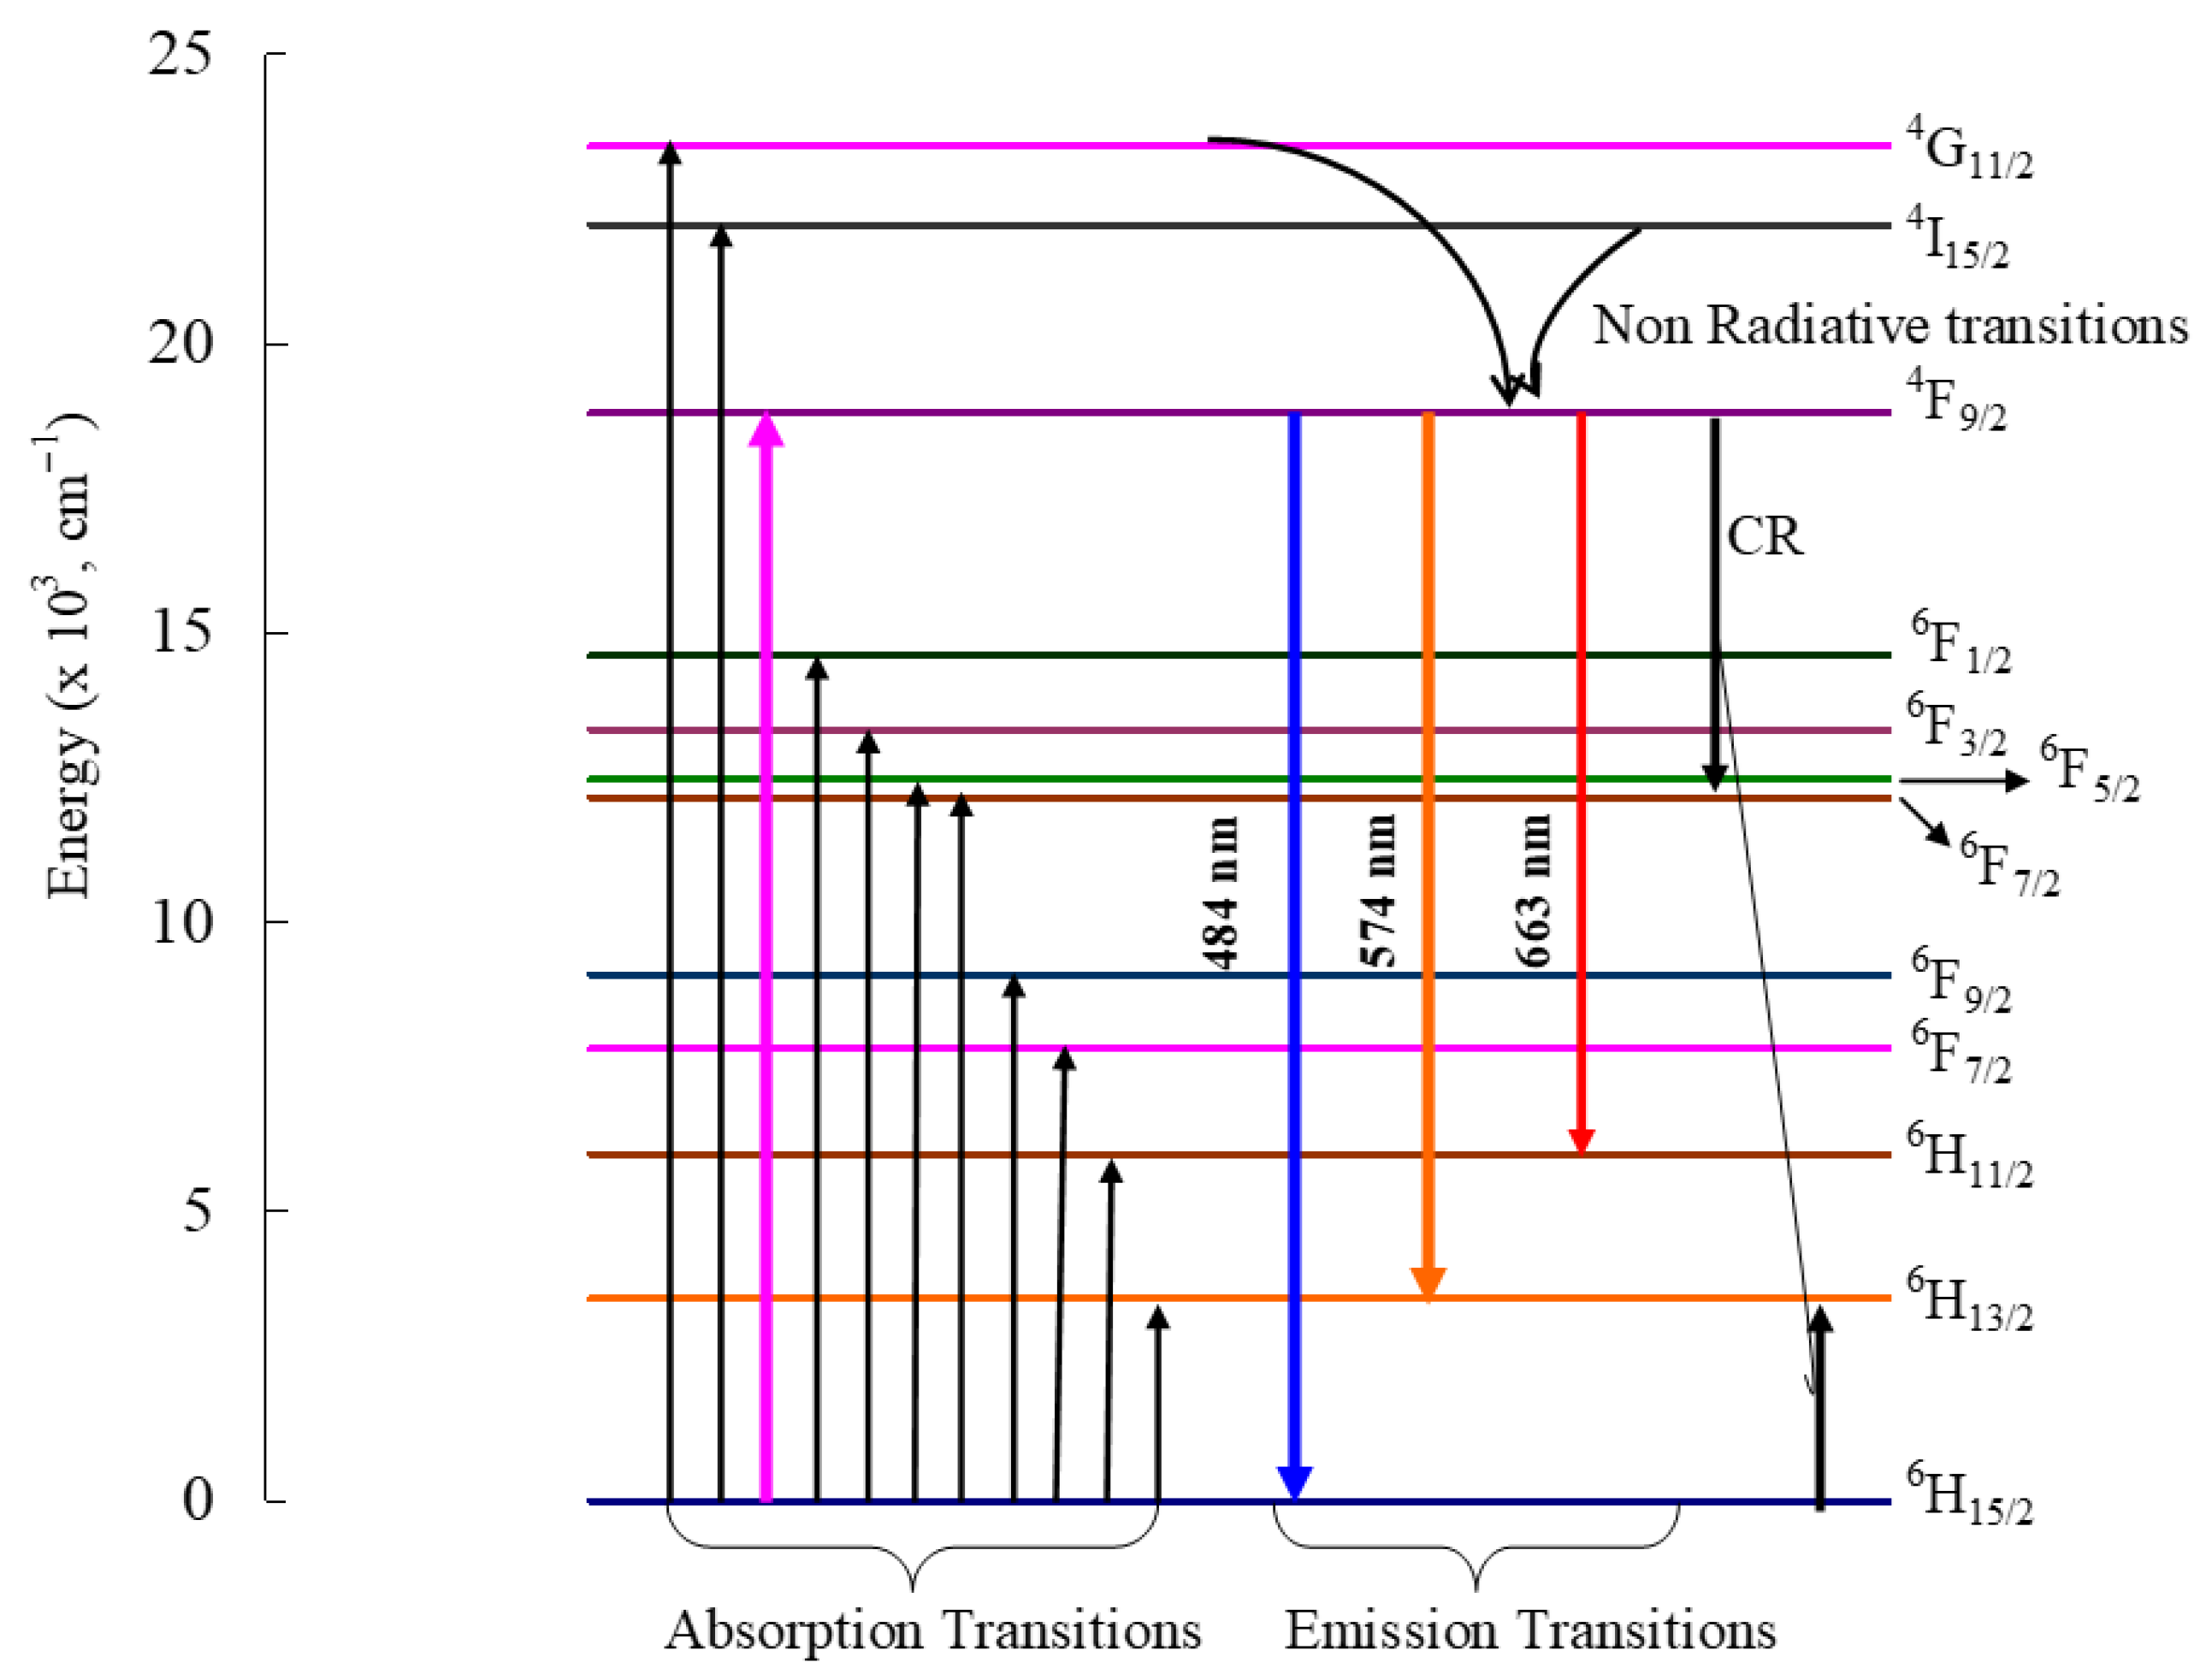
Figure 7 indicated emission spectra (λexc = 348 nm) for all the glass samples have their origin from excited level 4F9/2 and exhibited the emission bands from 4F9/2 to 6H15/2 (blue ~ 484 nm), 6H13/2 (yellow ~ 574 nm), and 6H11/2 (red ~ 663 nm) correspondingly. Out of these, yellow emission (~574 nm) is usually most intense, leading to a white-light emission when balanced with blue emission. The emission intensity Y/B ratio values (for 0.5 mol% = 1.187, for 1.0 mol% = 1.185, for 1.5 mol% = 1.184, and for 2.0 mol% = 1.188) depend on factors such as Dy3+ content of the glass composition. The transition 4F9/26H13/2 (ΔL = 2, ΔJ = 2) is observed to be hypersensitive. As the content of Dy2O3 increases, a significant enhancement in the intensity of the band (4F9/26H13/2) is observed. However, beyond 1.0 mol%, the emission quenching occurs. Figure 8 illustrates the energy level diagram depicting different absorption and emission transitions associated with Dy3+ ions in the PBPZBaDy10 glass sample.
The emission transition probabilities associated with electric dipole transitions were evaluated using the relation:
A J J = 64 π 4 e 2 v 3 3 h   ( 2 J + 1 ) n   ( n 2 + 2 ) 2 9 λ = 2,4 , 6 Ω λ f N γ , S ,   L J U λ f N γ , S , L J 2
The detailed explanation of the above equation can be found in the referenced literature [7,25,28].
From the emission spectra, radiative parameters including the spontaneous emission probability (A), total radiative transition probability (AT), radiative lifetime (τ), and fluorescence branching ratio (β) corresponding to the transitions originating from the 4F9/2 excited state of Dy3+ ions were evaluated using conventional Equations (8)–(10) and were presented in Table 4 for PBPZBaDy10 glass.
τ = 1 J A J J
β J J = A J J J A J J
σ λ = λ 4 A J J 8 π c n 2 Δ λ e f f
The details of the above equations (Equations (8)–(10)) were explained in Refs [28,29,30].
We have observed the radiative parameters for PBPZBaDy10 glass tabulated in Table 5, attributing the highest radiative values. This enhancement is attributed to the optimal distribution of Dy3+ ions at a doping concentration of 1.0 mol%, which promotes radiative transitions by effectively suppressing non-radiative losses. However, at higher Dy3+ contents (1.5 to 2.0 mol%), increased ion-ion interactions, cross-relaxation mechanisms, and energy transfer between adjacent Dy3+ ions result in concentration quenching effects. These processes diminish the radiative efficiency, leading to reduced fluorescence lifetimes and lower branching ratio values. Consequently, Dy3+ mixed 1.0 mol% is identified as optimal for achieving efficient luminescence with superior radiative properties in the present glass system.
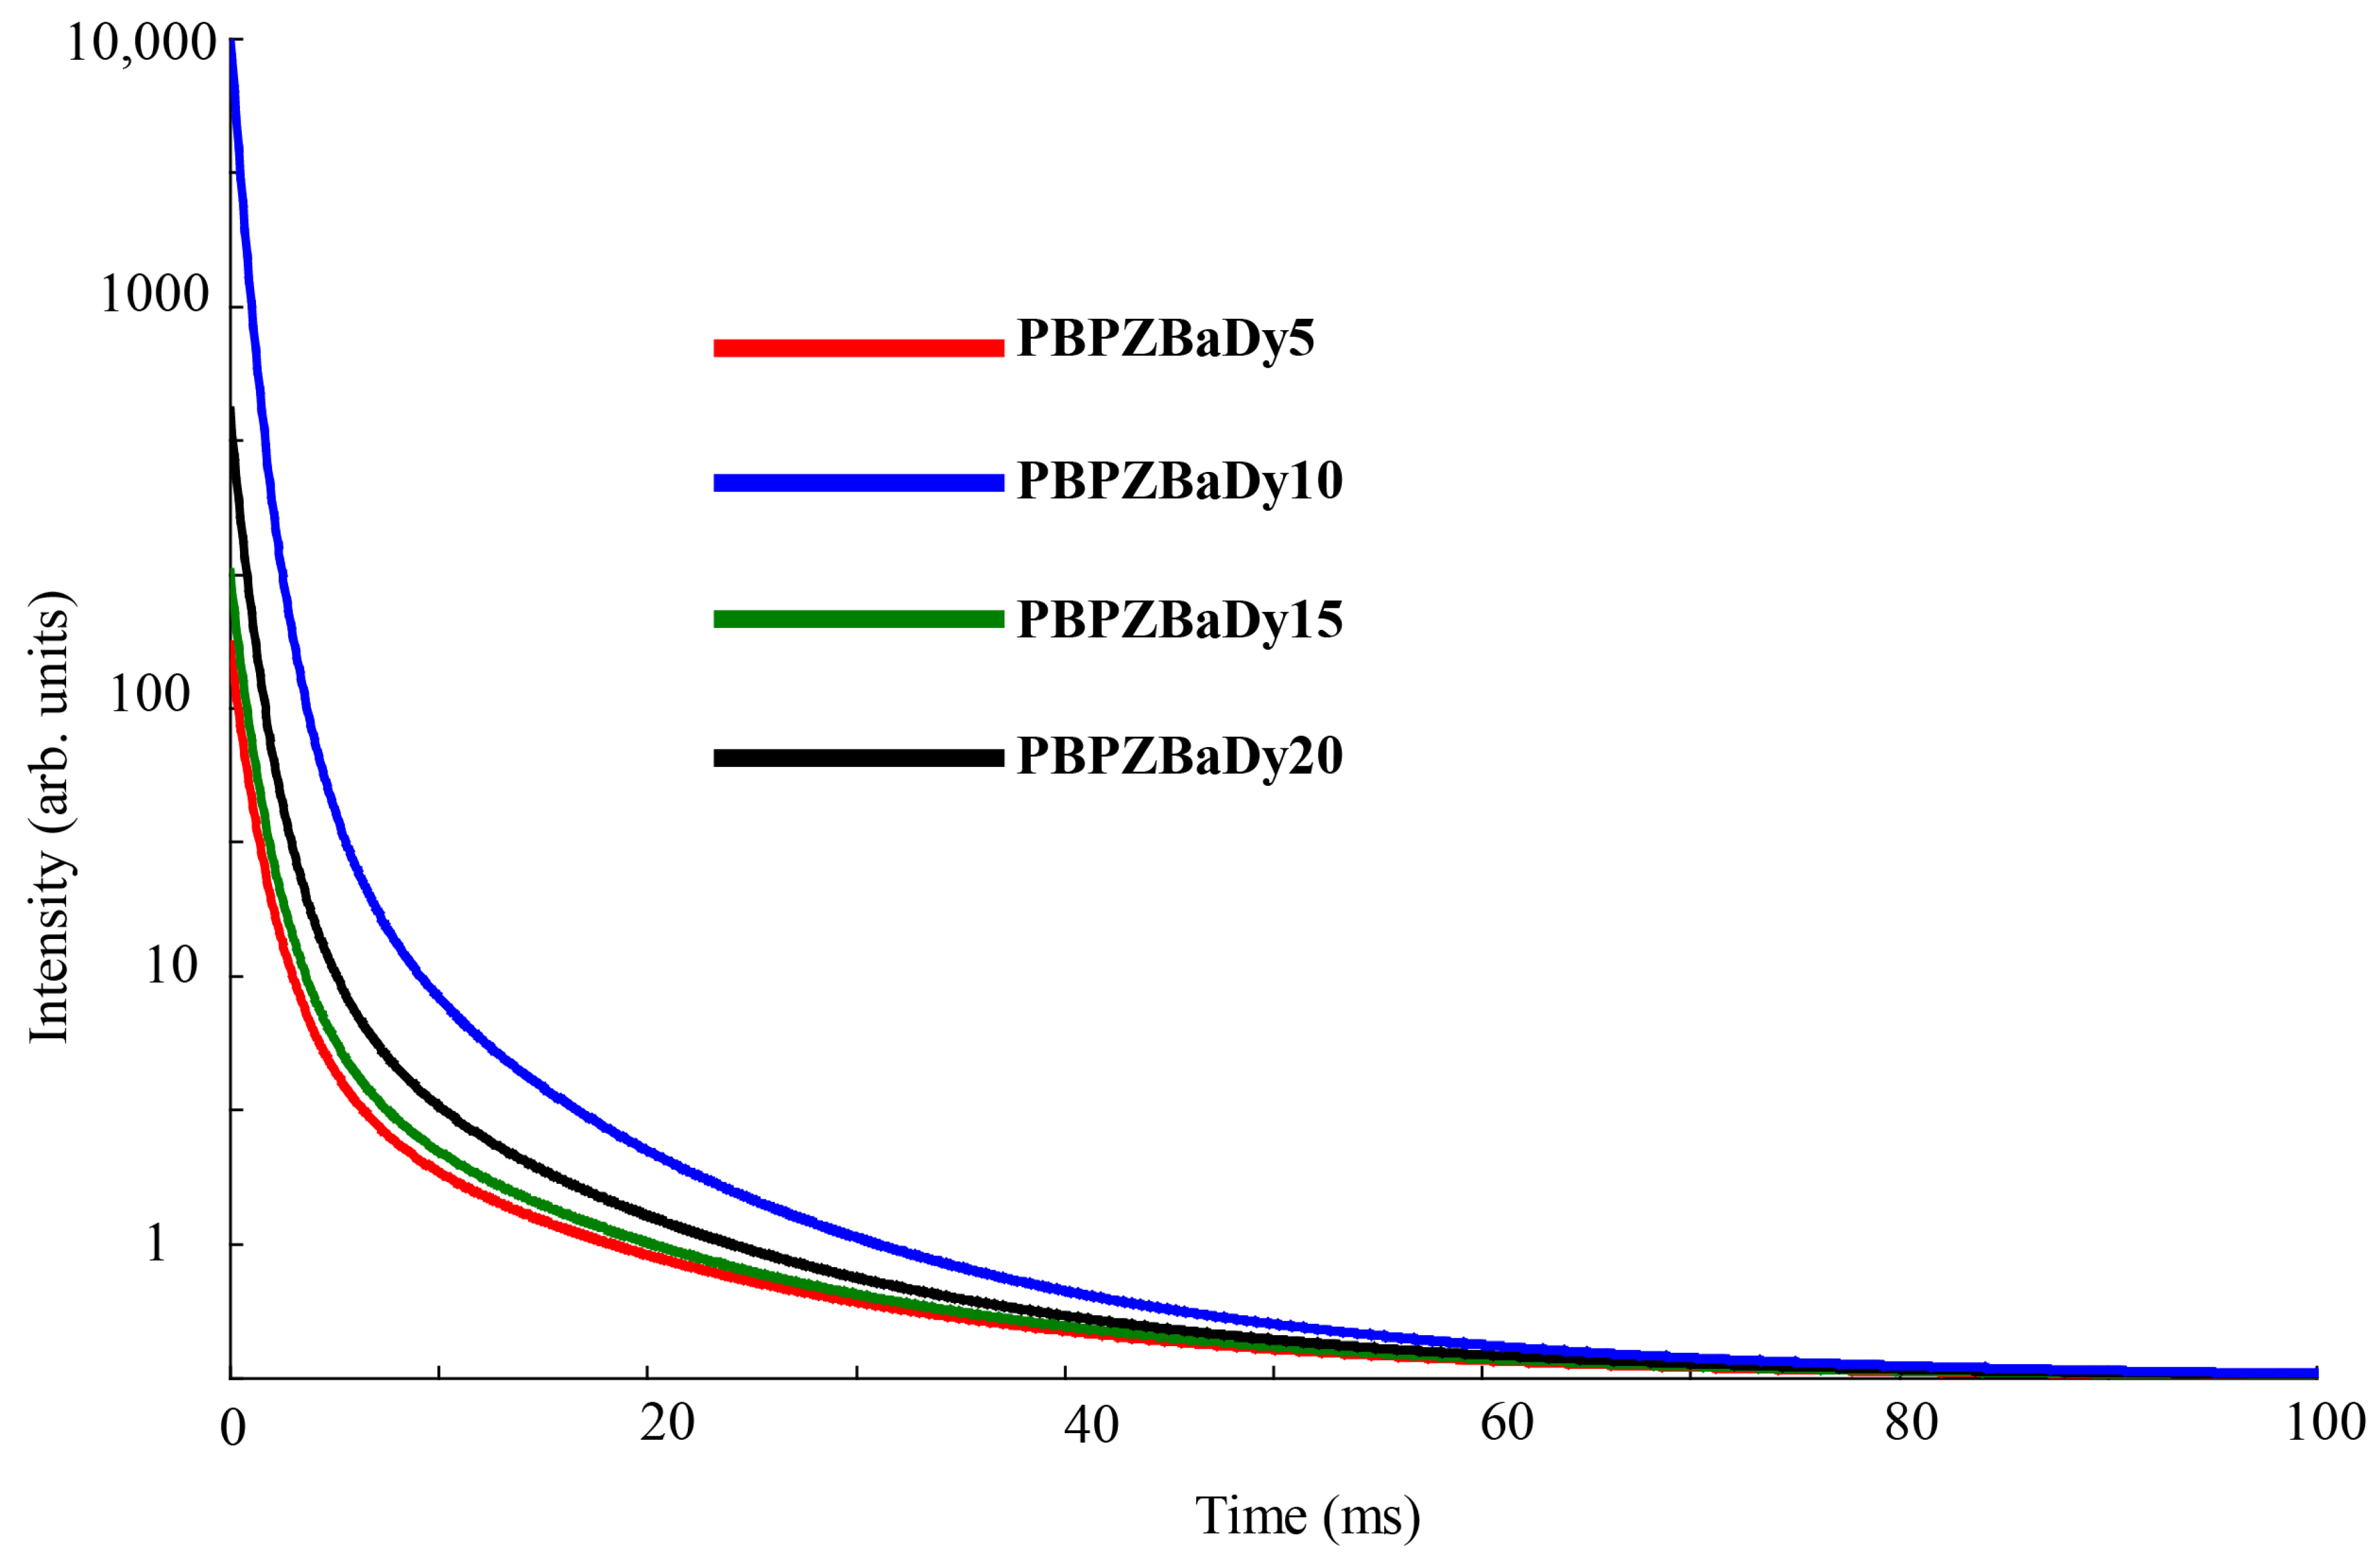
Figure 9 shows the decay profile of PBPZBaDy10 glass from the 4F9/2 level; corresponding lifetime values are listed in Table 6. A comparatively longer radiative lifetime is observed in the glass doped with 1.0 mol%, suggesting a more covalent bonding environment around the Dy3+ ions, along with higher vibrational frequencies. The glass PBPZBaDy10 exhibits the highest quantum efficiency (η = 91.68), which enhances the yellow–blue (Y/B) luminescence, bringing it closer to the white-light region compared to other glasses.
The obtained quantum efficiency is comparable to or slightly higher than many previously reported Dy3+-doped phosphate, borate, and tellurite glasses, where efficiencies typically fall in the range of ~75–90%, depending on host matrix and dopant concentration. This confirms that the present PbO–B2O3–P2O5–ZnO–BaO glass system provides an efficient radiative environment for Dy3+ ion emission.
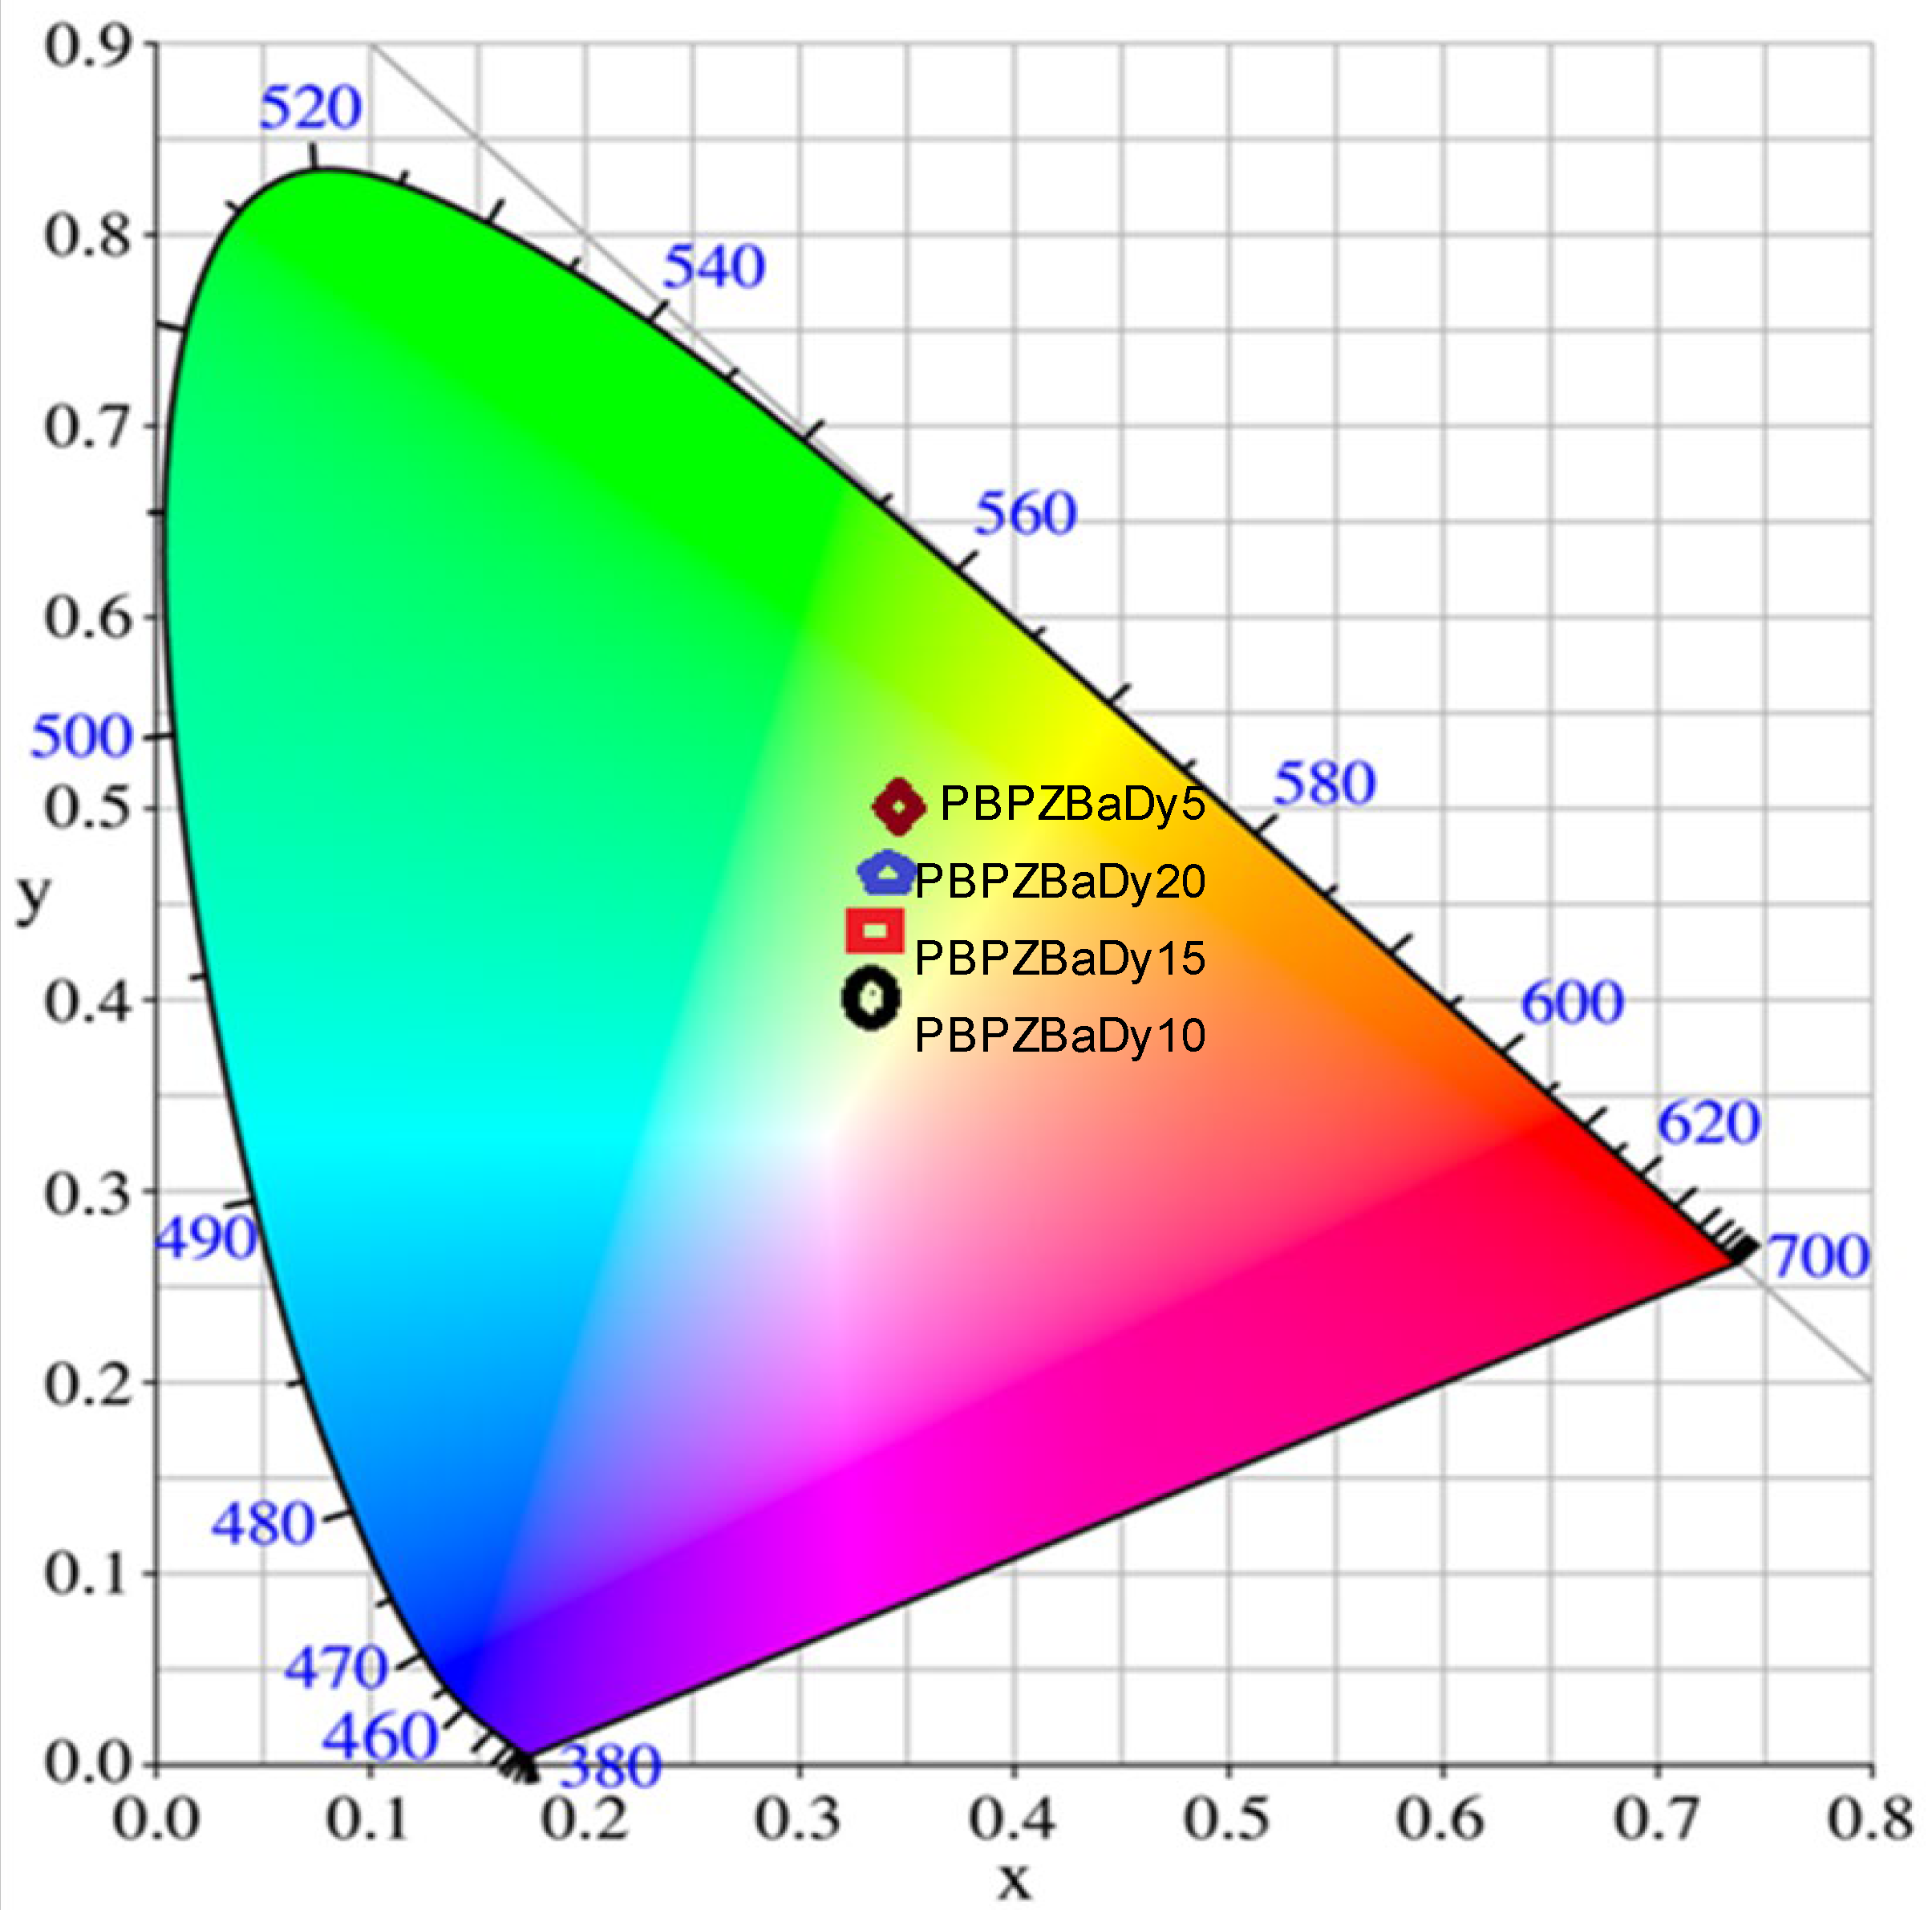
Figure 10 shows that chromaticity coordinates (x = 0.33, y = 0.41) lie in proximity to the white-light region of the CIE 1931 chromaticity diagram. As the Dy3+ ion concentration increases beyond 1.0 mol%, a gradual shift in the emission color toward the yellowish region is observed. Therefore, the 1.0 mol% Dy3+ composition provides an optimal balance between blue and yellow emissions, resulting in high quantum efficiency and chromaticity coordinates close to the ideal white-light region, comparable to other similar Dy3+-doped glass systems reported in the literature [7,29,30,31].

4. Conclusions

The present investigation demonstrates that Dy3+ ions doped PbO-B2O3-P2O5-ZnO-BaO glasses exhibited the remarkable luminescent behavior, with the sample containing 1.0 mol% Dy2O3 (PBPZBaDy10) showing superior optical performance. This composition achieved the highest luminescence intensity, radiative transition probabilities, and quantum efficiency (η = 91.68%). The emission spectra revealed two strong bands corresponding to the 4F9/26H15/2 (blue) and 4F9/26H13/2 (yellow) transitions, whose balanced intensities produced near-white light with chromaticity coordinates (x = 0.33, y = 0.41) in the CIE 1931 color space. Judd–Ofelt analysis exhibited the parameter trend Ω2 > Ω6 > Ω4, indicating an asymmetric and moderately covalent environment around Dy3+ ions. Concentration quenching beyond 1.0 mol% was primarily due to Dy3+–Dy3+ cross-relaxation and non-radiative energy transfer processes. The novelty of this work lies in developing a multicomponent Pb–B–P–Zn–Ba glass matrix that simultaneously provides high optical transparency, chemical stability, and efficient single-ion white-light emission without co-dopants. These findings establish the glass PBPZBaDy10 as a promising material for next-generation white-light-emitting diodes (WLEDs), optical sensors, and photonic device applications.

Author Contributions

V.R.K.: Conceptualization, Investigation, Data curation, Writing original draft; S.V.B.S.: Methodology; K.K.K.: Data curation; B.V.M.: Formal analysis; K.S.: Investigation; L.M.: Editing; M.N.: Investigation; V.S.: Formal analysis; L.V.: Methodology, Data curation, Writing original draft, Editing; J.L.: Supervision. All authors have read and agreed to the published version of the manuscript.

Funding

This research received no external funding.

Data Availability Statement

The data presented in this study are available on request from the corresponding author. The data are not publicly available due to laboratory data management policies and the large size of the raw experimental datasets.

Conflicts of Interest

The authors declare no conflict of interest.

References

  1. Chandrappa, V.; Basavapoornima, C.; Venkatramu, V.; Depuru, S.R.; Kaewkhao, J.; Pecharapa, W.; Jayasankar, C.K. A critical review and future prospects of Dy3+-doped glasses for white light emission applications. Optik 2022, 266, 169583. [Google Scholar] [CrossRef]
  2. Li, Y.; Xu, S.; Chen, J.; Zhang, X.; Liu, H.; Chi, Y.; Sun, X.; Mahadevan, C.K. Structural and luminescence properties of Dy3+activated niobiosilicate glass with high thermal stability for W-LED application. Ceram. Int. 2024, 50, 14571–14580. [Google Scholar] [CrossRef]
  3. ReddiBabu, M.; Rao, N.M.; Babu, A.M.; Jaidass, N.; Moorthy, C.K.; Moorthy, L.R. Effect of Dy3+ions concentration on optical properties of lead borosilicate glasses for white light emission. Optik 2016, 127, 3121–3126. [Google Scholar] [CrossRef]
  4. Maheshwari, K.; Rao, A.S. Photoluminescence downshifting studies of thermally stable Dy3+ions doped phosphate glasses for photonic device applications. Opt. Mater. 2022, 129, 112518. [Google Scholar] [CrossRef]
  5. Indhrapriyadarshini, A.; Naseer, K.A.; KomalPoojha, M.K.; Marimuthu, K.; Sayyed, M.I.; Alqahtani, M.S. Significance of multicomponent modifiers incited Dy3+ions doped boro-phosphate glasses for radiation shielding applications. Optik 2024, 304, 171755. [Google Scholar] [CrossRef]
  6. Poria, K.; Lohan, R.; Bhatia, S.; Kumar, A.; Singh, R.; Deopa, N.; Punia, R.; Shahi, J.S.; Rao, A.S. Lumino-structural properties of Dy3+activated Na3Ba2LaNb10O30phosphors with enhanced internal quantum yield for w-LEDs. RSC Adv. 2023, 13, 11557–11568. [Google Scholar] [CrossRef] [PubMed]
  7. Khondara, S.; Yasaka, P.; Boonin, K.; Intachai, N.; Kim, H.J.; Kaewkhao, J. White light emission from Dy3+ion doped boro-tellurite glass potential for optical and thermoluminescence material applications. Radiat. Phy. Chem. 2025, 237, 113007. [Google Scholar] [CrossRef]
  8. Krishnamacharyulu, N.; Mohini, G.J.; Baskaran, G.S.; Kumar, V.R.; Veeraiah, N. Effect of ZrO2 on the bioactive properties of B2O3–SiO2–P2O5–Na2O–CaO glasssystem. J. Non-Cryst. Solids 2016, 452, 23–29. [Google Scholar] [CrossRef]
  9. Kumari, C.V.; Sobhanachalam, P.; Jayasankar, C.K.; Veeraiah, N.; Kumar, V.R. Bioactive properties of CuO doped CaF2-CaO-B2O3-P2O5-MO (M = Ba, Sr, Zn, Mg) glasses. Ceram. Int. 2017, 43, 4335–4343. [Google Scholar] [CrossRef]
  10. Satyanarayana, T.; Kityk, I.V.; Brik, M.G.; Kumar, V.R.; Veeraiah, N. Fluorescence features of Tm3+ ions in PbO–Sb2O3–B2O3 glass ceramics. Phys. B 2010, 405, 1872–1880. [Google Scholar] [CrossRef]
  11. Gandhi, Y.; Rajanikanth, P.; SundaraRao, M.; Kumar, V.R.; Veeraiah, N.; Piasecki, M. Effect of tin ions on enhancing the intensity of narrow luminescence line at311 nm of Gd3+ ions in Li2O–PbO–P2O5 glass system. Opt. Mater. 2016, 57, 39–44. [Google Scholar] [CrossRef]
  12. Kumar, V.R.; Giridhar, G.; Jayasankar, C.K.; Veeraiah, N. The energy transfer efficiency from Yb3+ to Nd3+ in SrO–Pb3O4–ZnO–P2O5 glasssystem-Influence of lead ions. J. Lumin. 2017, 187, 281–289. [Google Scholar] [CrossRef]
  13. Rama Chandra Rao, M.V.; Hariprasad, D.; Jyothi, B.; Kumar, D.P.; Naresh, P.; Lakshmi, G.V.; Nagarjuna, M.; Kumar, V.R.; Gandhi, Y.; Veeraiah, N. Luminescence properties of Ho3+ ions in Pb3O4-B2O3-P2O5-ZnO-AIIIx (AIIIx = Al2O3, Ga2O3, and In2O3) glasses. Optik 2025, 328, 172315. [Google Scholar] [CrossRef]
  14. Gandhi, Y.; Kityk, I.V.; Brik, M.G.; Rao, P.R.; Veeraiah, N. Role of tungsten coordination and valence states in ZnF2-WO3-TeO2 glasses on the emissionfeatures of Nd3+, Sm3+ and Eu3+ ions in the visible and IR spectral ranges. J. Alloys Compd. 2010, 508, 278–291. [Google Scholar] [CrossRef]
  15. Kumar, V.R.; Giridhar, G.; Veeraiah, N. Influence of modifier oxide on emission features of Dy3+ ion in Pb3O4-ZnO-P2O5 glasses. Opt. Mater. 2016, 60, 594–600. [Google Scholar] [CrossRef]
  16. Rao, K.J. Structural Chemistry of Glasses. J. Am. Chem. Soc. 2003, 125, 7479–7480. [Google Scholar] [CrossRef]
  17. Sudhakar, K.S.V.; Reddy, M.S.; SrinivasaRao, L.; Veeraiah, N. Influence of modifier oxide on spectroscopic and thermoluminescence characteristics of Sm3+ ion in antimony borate glass system. J. Lumin. 2008, 128, 1791–1798. [Google Scholar] [CrossRef]
  18. Karunakaran, R.T.; Marimuthu, K.; Babu, S.S.; Arumugam, S. Dysprosium doped alkali fluoroborate glasses-Thermal, structural and optical investigations. J. Lumin. 2010, 130, 1067–1072. [Google Scholar] [CrossRef]
  19. Kalpana, T.; Brik, M.G.; Sudarsan, V.; Naresh, P.; Kumar, V.R.; Kityk, I.V.; Veeraiah, N. Influence of Al3+ ions on luminescence efficiency of Eu3+ ions in barium boro-phosphate glasses. J. Non-Cryst. Solids 2015, 419, 75–81. [Google Scholar] [CrossRef]
  20. Ali, A.A. Optical properties of Sm3+-doped CaF2 bismuth borate glasses. J. Lumin. 2009, 129, 1314. [Google Scholar] [CrossRef]
  21. Schubert, E.F. Light Emitting Diodes, 2nd ed.; Cambridge University Press: Cambridge, UK, 2006. [Google Scholar]
  22. Luo, M.; Chen, B.; Li, X.; Zhang, J.; Xu, S.; Zhang, X.; Cao, Y.; Sun, J.; Zhang, Y.; Wang, X.; et al. Fluorescence decay route of optical transition calculation for trivalent rare earth ions and its application for Er3+-doped NaYF4 phosphor. Phys. Chem. Chem. Phys. 2020, 22, 25177–25183. [Google Scholar] [CrossRef]
  23. Ram, G.C.; Narendrudu, T.; Suresh, S.; Kumar, A.S.; Rao, M.S.; Kumar, V.R.; Rao, D.K. Investigation of luminescence and laser transition of Dy3+ ion in P2O5-PbO-Bi2O3-R2O3 (R ¼ Al, Ga, In) glasses. Opt. Mater. 2017, 66, 189–196. [Google Scholar] [CrossRef]
  24. Kumar, V.R.; Giridhar, G.; Veeraiah, N. Concentration dependence of luminescence efficiency of Dy3+ ions in strontium zinc phosphate glasses mixed with Pb3O4. Luminescence 2017, 32, 71–77. [Google Scholar] [CrossRef]
  25. Judd, B.R. Optical absorption intensities of rare-earth ions. Phys. Rev. 1962, 127, 750–761. [Google Scholar] [CrossRef]
  26. Ofelt, G.S. Intensities of crystal spectra of rare-earth ions. J. Chem. Phys. 1962, 37, 511–520. [Google Scholar] [CrossRef]
  27. Linganna, K.; Rao, C.S.; Jayasankar, C.K. Optical properties and generation of white light in Dy3+ doped lead phosphate glasses. J. Quant. Spectrosc. Radiat. Transf. 2013, 118, 40–48. [Google Scholar] [CrossRef]
  28. Venkataiah, G.; Jayasankar, C.K. Dy3+-doped tellurite-based tungsten-zirconium glasses: Spectroscopic study. J. Mol. Struct. 2015, 1084, 182–189. [Google Scholar] [CrossRef]
  29. Yen, W.M.; Shionoya, S. Phosphor Handbook; CRC Press: New York, NY, USA, 1999. [Google Scholar]
  30. Billmeyer, F.W.; Saltzman, M., Jr. Principles of Colour Technology; Wiley: New York, NY, USA, 1981. [Google Scholar]
  31. Reddy, M.C.S.; Rao, B.A.; Brik, M.G.; Reddy, A.P.; Rao, P.R.; Jayasankar, C.K.; Veeraiah, N. Emission characteristics of Dy3+ ions in lead antimony borate glasses. Appl. Phy. B–Lasers Optics 2012, 108, 455–461. [Google Scholar] [CrossRef]
Figure 1. Variation in density (g/cm3) and refractive index (nd) of Dy3+ ions doped PbO-B2O3-P2O5-ZnO-BaO glasses.
Photonics 13 00237 g001
Figure 2. XRD patterns for Dy3+ ions doped PbO-B2O3-P2O5-ZnO-BaO glasses.
Photonics 13 00237 g002
Figure 3. SEM photograph of PBPZBaDy10 glass.
Photonics 13 00237 g003
Figure 4. FT-IR spectra for Dy3+ ions doped PbO-B2O3-P2O5-ZnO-BaO glasses.
Photonics 13 00237 g004
Figure 5. (a,b) Optical absorption spectra of Dy3+ ions doped PbO-B2O3-P2O5-ZnO-BaO glasses in the visible and NIR regions.
Photonics 13 00237 g005
Figure 6. Tauc plots of Dy3+ ions doped PbO-B2O3-P2O5-ZnO-BaO glasses.
Photonics 13 00237 g006
Figure 7. Emission spectra of Dy3+ ions doped PbO-B2O3-P2O5-ZnO-BaO glasses in the visible region.
Photonics 13 00237 g007
Figure 8. Energy level diagram representing different absorption and emission transitions of PBPZBaDy10 glass.
Photonics 13 00237 g008
Figure 9. Fluorescence decay curves for PbO-B2O3-P2O5-ZnO-BaO glass.
Photonics 13 00237 g009
Figure 10. CIE plot represents color coordinate corresponding white emission of Dy3+ ions doped PbO-B2O3-P2O5-ZnO-BaO glasses.
Photonics 13 00237 g010
Table 1. Physical parameters of Dy3+ ions doped PbO-B2O3-P2O5-ZnO-BaO glasses.
Glass Sample Avg.
Mo. Wt. M
Density d
(g/cm3)
Dy3+ Ion Conc. Ni (1019/cm3) Inter Ionic
Distance of Dy3+
Ions Ri (nm)
Refractive
Index, nd
Optical Band Gap (Eo)
PBPZBaDy5248.373.754.552.801.6133.78
PBPZBaDy10248.823.829.152.211.6353.73
PBPZBaDy15249.273.811.381.931.6193.85
PBPZBaDy20249.713.801.851.751.6263.88
Table 2. Characteristic FTIR vibrational bands and their assignments for structural units in borophosphate glass systems.
Observed Region (cm−1)Assignment
~1280–1240BO3/P=O and PO2− Stretching
~1080BO4 and PO43− symmetric stretching
~910Asymmetric P–O–P vibrations
~780Symmetric P–O–P stretching
~690B–O–B linkages
~500PbO4/ZnO4 structural units
Table 3. The absorption band energies and the oscillator strengths (f ×10−6) for the transitions of Dy3+ ions in PbO-B2O3-P2O5-ZnO-BaO glasses.
GlassPBPZBaDy5PBPZBaDy10PBPZBaDy15PBPZBaDy20
Transition
6H15/2
Barycenter
(cm−1)
fexp
(×10−6)
fcal
(×10−6)
Barycenter
(cm−1)
fexp
(×10−6)
fcal
(×10−6)
Barycenter
(cm−1)
fexp
(×10−6)
fcal
(×10−6)
Barycenter
(cm−1)
fexp
(×10−6)
fcal
(×10−6)
6H11/259880.0510.05659890.0690.05459900.0520.05159900.0530.051
6F11/278120.2320.21678150.2810.24678170.2410.25778200.2510.257
6F9/290950.1640.11890990.1630.15191020.1610.16791000.1710.171
6F7/212,1650.2360.23012,1730.2360.24212,1770.2230.23912,1800.2330.237
6F5/212,4840.3870.36112,4750.4670.46812,4790.3540.36112,4810.3440.361
6F3/213,3330.1860.18113,3240.2620.21213,3290.1850.19113,3300.1860.193
6F1/214,6190.6330.63714,6300.7320.72414,6370.6410.64414,6400.6430.644
4F9/218,7960.1490.13518,8110.1610.16918,8250.1510.15018,8280.1420.153
4I15/222,0500.4190.43722,0750.5490.54622,0750.4240.43722,0790.4140.427
4G11/223,4190.3050.27123,4460.3660.39123,4630.3100.32823,4650.3170.321
δrms (×10−6) ±0.31 ±0.46 ±0.33 ±0.30
Table 4. J-O parameters (Ωλ × 10−20, cm−2) of Dy3+ ions doped in Pb3O4-B2O3-P2O5-ZnO-BaO glasses.
Glass SamplePBPZBaDy10
Transition 4F9/2Bary-center (cm−1)A (s−1)β (%)σPE (×10−22, cm2)
6H15/220,65522912.120.913
6H13/217,422154781.892.642
6H11/215,1401135.980.655
AT = 1889 s−1τrad = 0.529 ms
Table 5. Various radiative properties of transitions of 1.0 mol% Dy3+ ions in PbO-B2O3-P2O5-ZnO-BaO glass.
Glass SampleΩ2Ω4Ω6Trend
PBPZBaDy59.132.743.05Ω2 > Ω6 > Ω4
PBPZBaDy104.620.972.15Ω2 > Ω6 > Ω4
PBPZBaDY155.601.443.11Ω2 > Ω6 > Ω4
PBPZBaDy206.352.763.74Ω2 > Ω6 > Ω4
PbPKANDy10 [29]11.742.642.86Ω2 > Ω6 > Ω4
TWZDy10 [30]6.9100.9901.010Ω2 > Ω6 > Ω4
BLND [31]11.993.923.94Ω2 > Ω6 > Ω4
Table 6. The experimental (τexp, μs) and calculated (τR, μs) life times and quantum efficiency (η, %) of Dy3+ ions doped in PbO-B2O3-P2O5-ZnO-BaO glasses.
Glass SampleMeasured (τexpμs)Calculated (τR,μs)Quantum Efficiency
(η%)
PBPZBaDy536143782.61
PBPZBaDy1048552991.68
PBPZBaDy1543849688.30
PBPZBaDy2038244186.66
Disclaimer/Publisher’s Note: The statements, opinions and data contained in all publications are solely those of the individual author(s) and contributor(s) and not of MDPI and/or the editor(s). MDPI and/or the editor(s) disclaim responsibility for any injury to people or property resulting from any ideas, methods, instructions or products referred to in the content.