Article

Dielectric-Dependent Wavelength Compression via Hybrid Plasmonic Modes in Nano-Hole Arrays

Department of System Semiconductor Engineering, Cheongju University, Cheongju 28503, Republic of Korea
*
Author to whom correspondence should be addressed.
Photonics 2026, 13(3), 235; https://doi.org/10.3390/photonics13030235
Submission received: 8 February 2026 / Revised: 22 February 2026 / Accepted: 26 February 2026 / Published: 28 February 2026
(This article belongs to the Section Optoelectronics and Optical Materials)

Abstract

Dielectric-engineered plasmonic nano-hole arrays (NHAs) offer an effective approach for precisely controlling subwavelength light confinement. Here, we investigate wavelength compression in aluminum NHAs filled with three different dielectric materials such as Al2O3, MoO3, and TiO2 under illumination by a 1.5 µm lightwave. The hole radius varies from 300 nm to 500 nm to analyze the combined effects of geometry and dielectric environment on the plasmonic response. The NHAs filled with Al2O3 exhibit a pronounced and monotonic increase of the compressed wavelength with decreasing hole radius, indicating strong geometric tunability of the dominant plasmonic mode. Meanwhile, the structures filled with MoO3 or TiO2 show weak wavelength variations over the same radius range. Spatially resolved analysis at these nano-holes reveals nearly position-independent wavelength squeezing for Al2O3, whereas noticeable spatial variations appear for MoO3 and TiO2 at hole radii of 450 nm and 400 nm, respectively. The observed wavelength compression is attributed to hybrid plasmonic modes originating from the interplay between in-hole-like compressed cavity modes and localized surface plasmon polaritons. Our findings demonstrate how dielectric composition tunes wavelength compression in plasmonic NHAs, offering practical guidelines for designing the near-infrared plasmonic devices.

1. Introduction

Extraordinary optical transmission through periodic subwavelength arrays has been a main subject of plasmonics research since its first experimental observation in metallic films [1]. This enhanced transmission stems from the excitation of surface plasmon polaritons (SPPs). Their constructive interference mediated by the periodic aperture arrays enables a wide range of applications across the visible and infrared spectral range [2,3,4,5,6,7].
Subsequent research has shown that the optical response of nano-hole arrays (NHAs) arises from a complex interplay of various plasmonic resonances, dictated by the structures’ geometry, material properties, and ambient dielectric conditions. Primarily, SPPs at the metal–dielectric interfaces are efficiently excited through reciprocal lattice momentum matching, leading to dispersive features such as Wood and Rayleigh anomalies [8,9,10]. The structural boundaries of each nano-hole—specifically its rims and sharp vertices—serve as the main sites for localized surface plasmon resonance (LSPR) excitation. These resonances effectively trap electromagnetic energy into intense ‘hotspots’ at the nanoscale. When the aperture’s symmetry is intentionally broken, these localized modes interfere with the background, manifesting as the distinct Fano-like profiles observed in the transmission data [11,12]. The physical depth of the metallic film introduces another layer of complexity, allowing nano-holes to behave as subwavelength cavities or waveguides. Unlike purely surface-bound effects, these internal resonances are dictated by an interplay between the aperture’s shape and the film’s vertical scale. Thus, these cavity modes do not exist in isolation; they merge with SPPs to form complex hybridized plasmonic states [10,13,14,15].
Plasmonic nano-slits and NHAs have been widely utilized as platforms for subwavelength light manipulation for photonic applications. Due to their strong field confinement within nanoscale gaps, plasmonic nano-slits enable the precise control of resonance wavelength and phase, making them suitable for tunable optical filters and active nanophotonic modulators [16,17,18]. The intense localized electromagnetic fields generated in nano-slit structures also enhance molecular vibrational signatures, which has led to their extensive use in surface-enhanced infrared absorption (SEIRA) spectroscopy for chemical and biological sensing [19,20]. In parallel, plasmonic NHAs offer advantages such as collinear illumination geometry and high sensitivity to refractive index changes, enabling compact label-free sensing platforms and on-chip biosensors [21,22]. Metallic nano-holes further serve as zero-mode waveguides, where extreme optical confinement reduces the effective detection volume, allowing single-molecule fluorescence measurements at high analyte concentrations [23,24,25]. In addition, the wavelength-selective transmission properties of NHAs have been harnessed for plasmonic color-filters and spectral control elements in imaging and display technologies [26,27,28].
Light propagation inside one-dimensional subwavelength metallic slits is dominated by a single plasmonic mode, referred to as the in-slit SPP [29]. Unlike conventional SPPs supported by planar metal–dielectric interfaces, this mode exhibits a significantly reduced effective wavelength. The associated wavelength squeezing effect is related to the strong electromagnetic coupling between the two opposing metal–dielectric interfaces forming the slit. The in-slit SPP reveals the Fabry–Pérot-like transmission oscillations and establishes a relation between plasmonic confinement and wavelength compression in one-dimensional subwavelength geometries [13,14,29]. Despite the progress achieved in understanding nano-slits, it remains unclear whether a comparable wavelength squeezing effect occurs in two-dimensional NHAs compared to the in-slit SPPs. Unlike nano-slits, nano-holes confine electromagnetic fields in both transverse directions. Previous studies [30,31] analyzed the dispersion relation of subwavelength cylindrical holes using plasmonic metal models and reported that propagating modes, characterized by a non-zero real part of the propagation constant (β), can exist near the surface plasmon frequency for subwavelength holes. In addition, the characteristic features of the dispersion diagram of cylindrical nanoholes were shown to be reflected in the transmission spectra, including resonance peaks, enhanced transmission bands, and attenuation regions. A subsequent study [32] further analyzed the Bloch-wave band structure of periodic hole arrays to clarify the origin of resonance conditions and transmission maxima, highlighting the role of collective lattice effects in shaping the optical response. Although the dielectric material filling the nano-holes directly modifies the metal–dielectric interface coupling, its influence on wavelength squeezing in plasmonic cavity modes has not yet been systematically explored.
In this regard, we investigate dielectric-dependent wavelength compression in plasmonic cavity modes supported by aluminum (Al) NHAs and discuss its differences from the in-slit SPP mode developed for nano-slits. By embedding Al2O3, MoO3, and TiO2 as dielectric materials within the nano-holes, we analyze how the effective wavelength of the dominant cavity modes evolves with changes in dielectric permittivity. Full-wave electromagnetic simulations reveal that the NHAs exhibit a pronounced dielectric-dependent wavelength compression effect, arising from enhanced coupling between the opposing metal–dielectric interfaces surrounding the cavity. In addition, as the hole size decreases, the compressed wavelength increases, showing a trend opposite to that observed in metal nano-slits. These results are explained through an analysis of the electric (E)-field intensity distribution formed in both the vertical and horizontal cross section of the NHAs, which elucidates the interaction between the compressed cavity mode confined within the nano-holes and the LSPR.

2. Methods

2.1. 3D FDTD Simulation

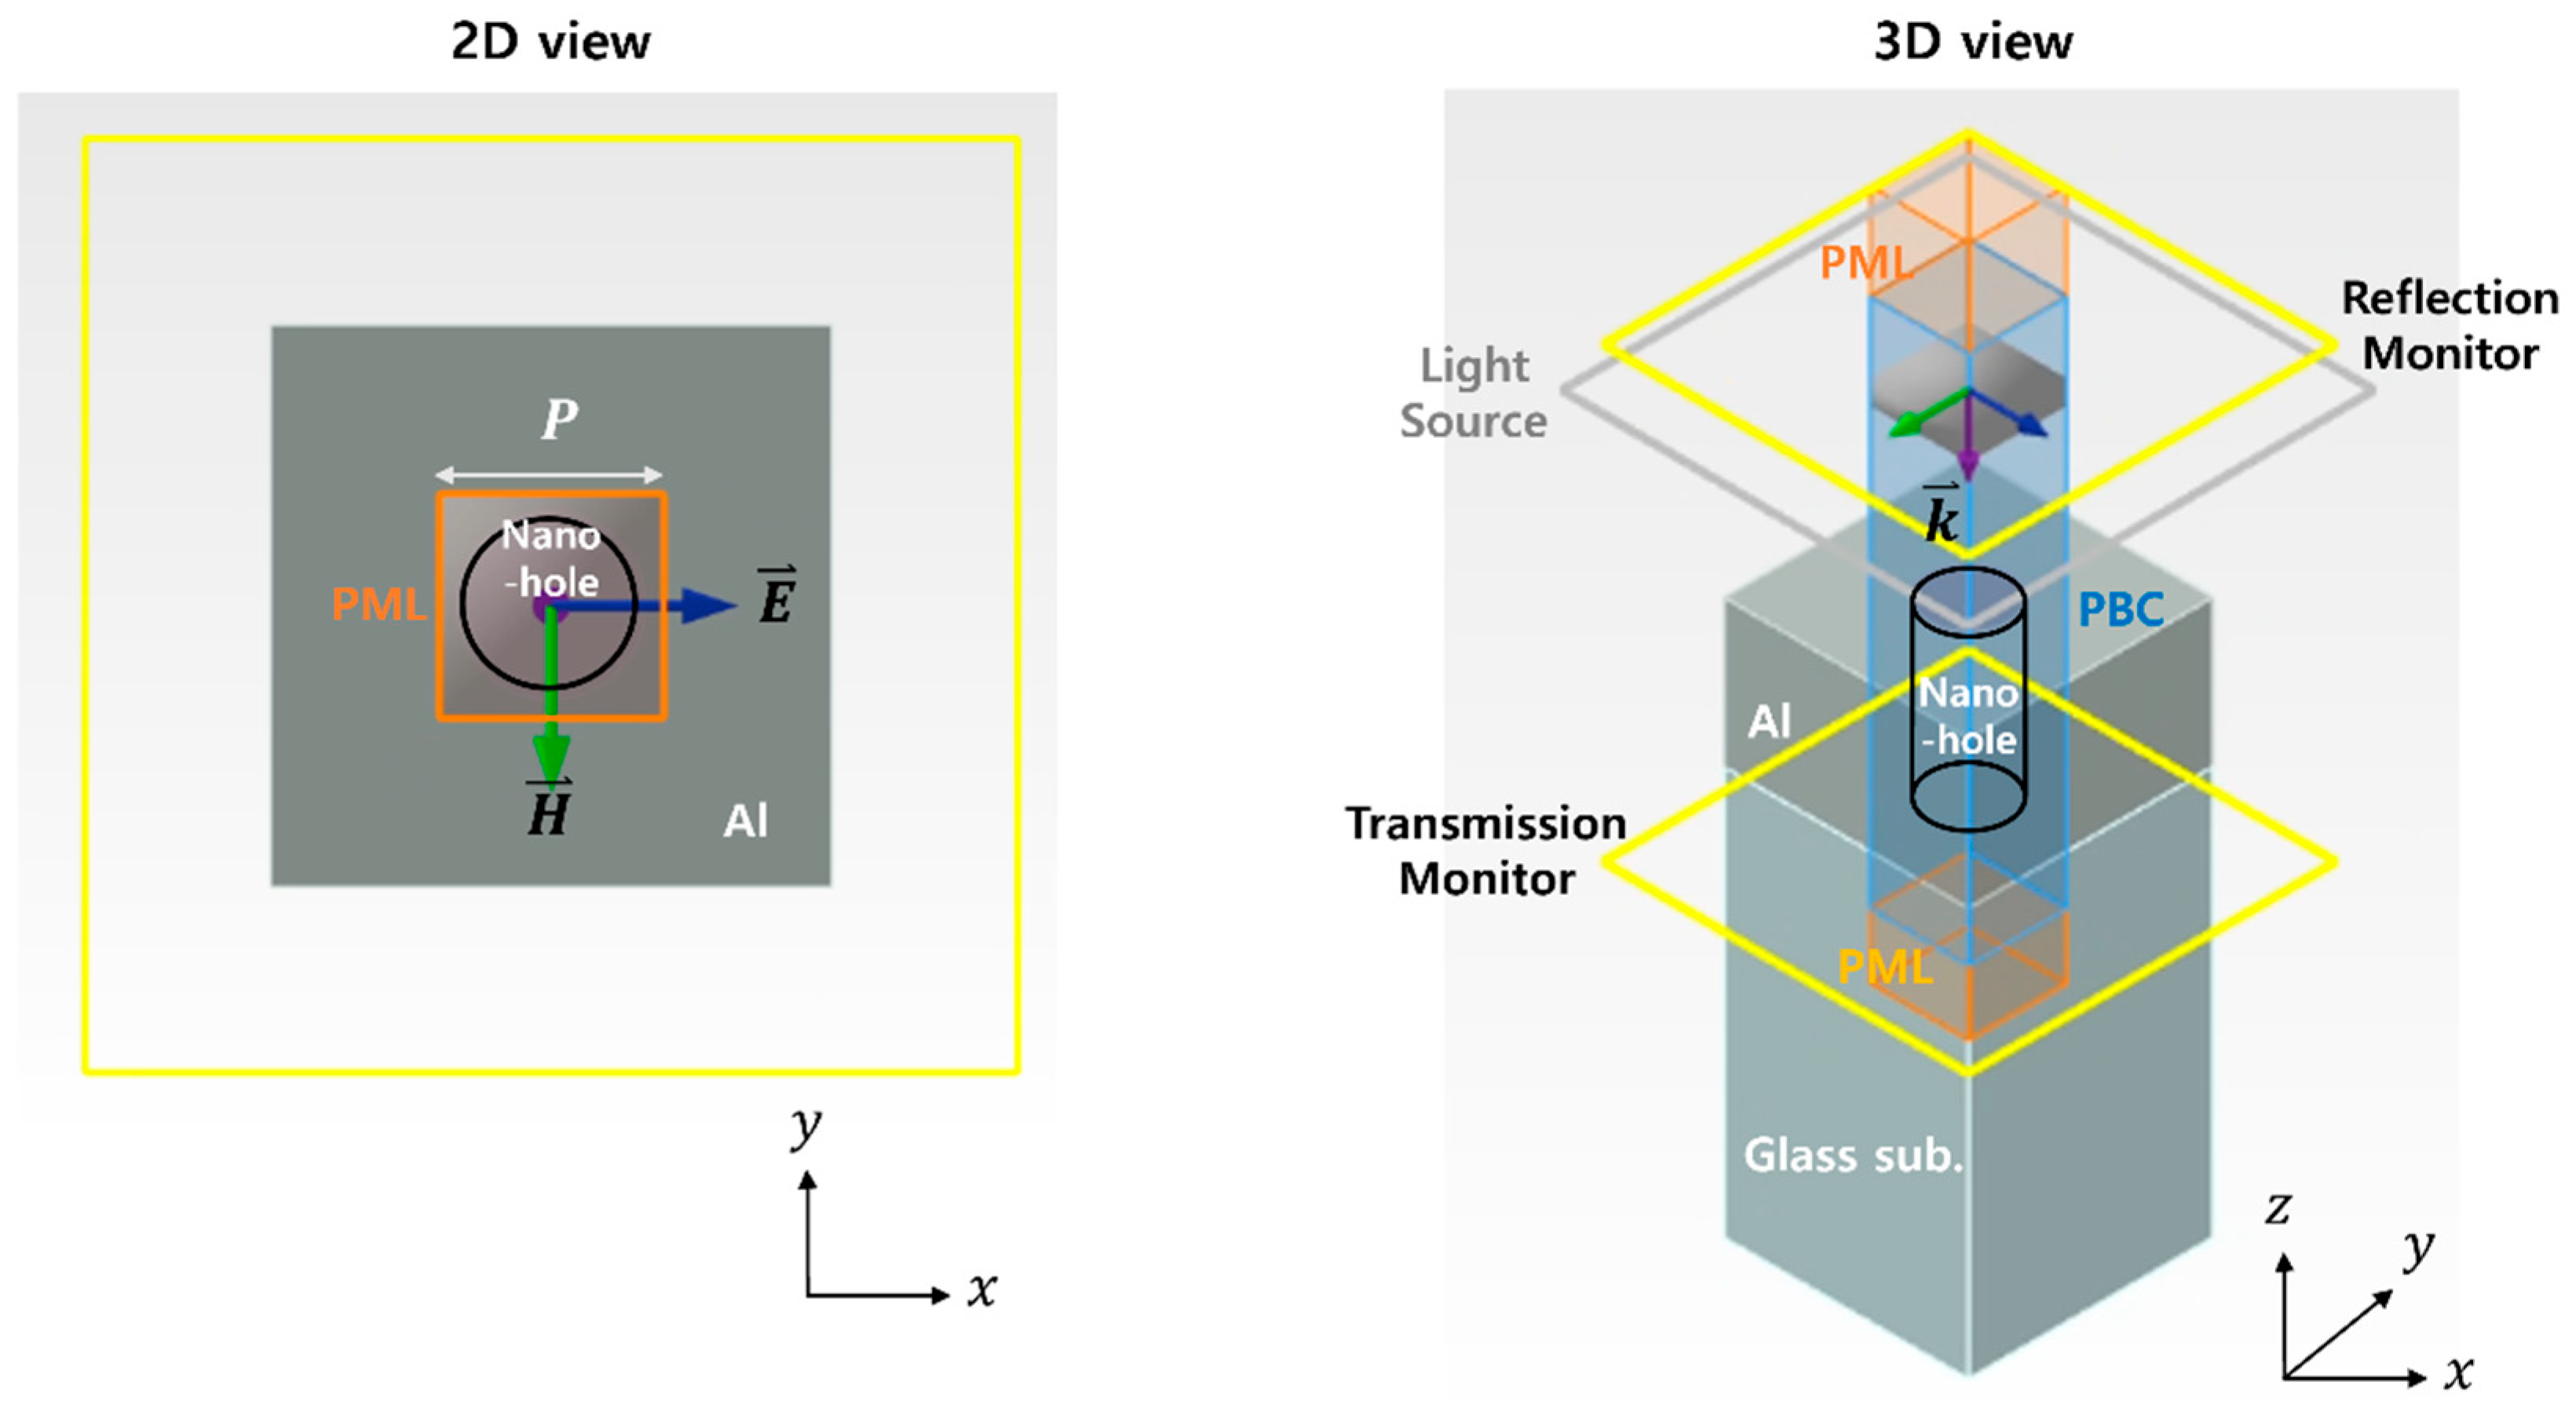
The optical characteristics of the Al NHA embedded with dielectric materials (Figure 1) were investigated through three-dimensional numerical simulations employing the finite-difference time-domain (FDTD) method (Ansys Lumerical FDTD, 2025 R2.4, Canonsburg, PA, USA). The primary objective of these simulations was to examine how variations in the nano-hole radius and lattice period influence the excitation of SPPs, including the associated resonance wavelength shifts and local E-field enhancement. Material dispersion was incorporated by using wavelength-dependent complex refractive indices (n and k) to Al and the three dielectric constituents of Al2O3, MoO3, and TiO2. These optical constants ranging from the visible to short-wave infrared (SWIR) wavelength were obtained from experimentally validated data [33]. Excitation of the NHA was achieved using a monochromatic plane wave with a wavelength of 1.5 μm. The incident wave was launched from the region above the structure along the positive z-direction and propagated downward toward the NHA along the negative z-axis. To simulate infinitely periodic array, periodic boundary conditions (PBCs) were imposed in both the x- and y-directions, while the simulation domain was terminated with perfectly matched layers (PMLs) along the z-direction to avoid spurious boundary reflections. Here, we set a threshold of 1 × 10⁻⁵ to automatically terminate the simulation when the total field energy drops below this threshold.
Spatially resolved electromagnetic fields were calculated using a locally refined mesh, with enhanced resolution applied near the metal–dielectric interfaces and within the nano-hole regions. The E-field intensity distributions inside the dielectric-filled nano-holes were recorded to identify plasmon-induced field localization and corresponding changes in the effective resonance wavelength. The reflection and transmission spectra were characterized by placing frequency-domain power monitors above and below the NHA structure. All simulations were executed until the field energy within the computational domain decayed to a predefined threshold, confirming the numerical stability and convergence. The observed results were subsequently analyzed to establish the relationship between geometric parameters and plasmonic behavior.

2.2. Complex Refractive Indices of Al2O3, MoO3, and TiO2

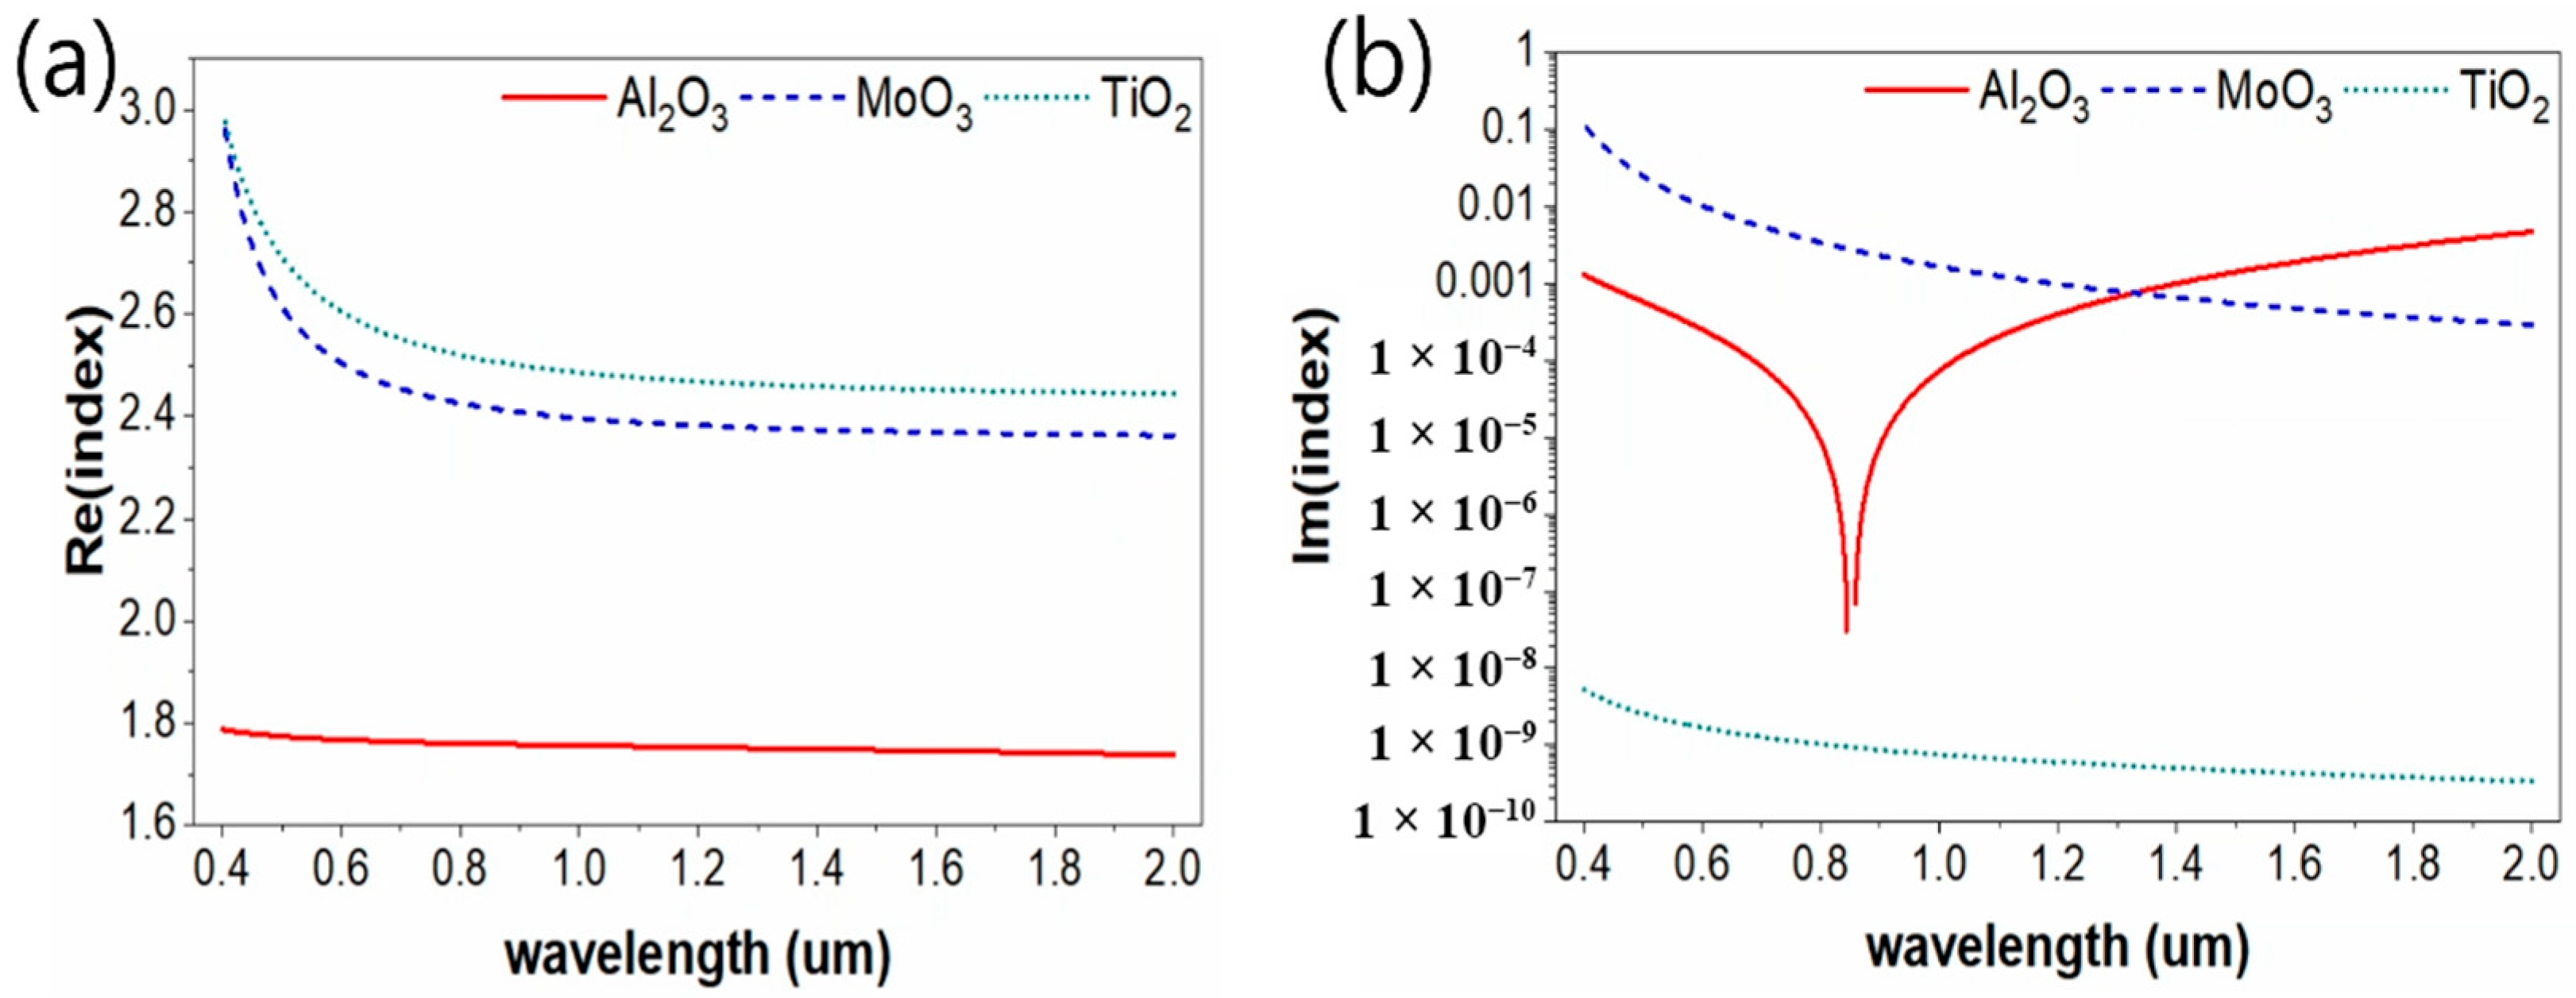
Figure 2 presents the wavelength-dependent complex refractive indices of Al2O3, MoO3, and TiO2 in the range of 0.4–2.0 μm. As shown in Figure 2a, TiO2 and MoO3 exhibit relatively high refractive indices with normal dispersion behavior, while Al2O3 shows a lower refractive index and weaker wavelength dependence. In Figure 2b, Al2O3 displays a minimum in the imaginary part of the refractive index near 0.84 μm wavelength; the extinction coefficient gradually increases when the wavelength shifts either to shorter or longer values from this wavelength. The increase toward shorter wavelengths is attributed to the proximity to the electronic absorption edge of the wide-bandgap Al2O3 [34], whereas the increase at longer wavelengths, beyond ~1.5 μm in the SWIR region, is associated with lattice vibrational (multi-phonon) absorption and defect-related losses [35]. While TiO2 remains nearly lossless across the spectrum, MoO3 exhibits higher absorption than Al2O3 at shorter wavelengths, which then decreases toward the near-infrared.
In this study, the plasmonic behavior of NHAs was analyzed at the 1.5 µm wavelength, where the refractive index of Al2O3 is relatively lower than that of MoO3 and TiO2. In addition, Al2O3 exhibits higher absorption than MoO3, while TiO2 shows nearly lossless behavior. Thus, the selection of Al2O3, MoO3, and TiO2 allows us to distinctly investigate the influence of dielectric confinement on the wavelength compression. At this wavelength, plasmonic modes are reported to exhibit strong subwavelength confinement, enabling highly compact integrated photonic devices and high-density circuit integration [36]. Such strong confinement has been utilized toward practical devices including high-speed small-footprint modulators [37]. Moreover, telecom-band plasmonics provides a technological platform to confront intrinsic metal loss and develop loss-aware/mitigation strategies, which is essential for realistic on-chip integration and optical interconnect applications [38].

3. Results and Discussion

For normally incident light at a wavelength of 1.5 µm, nano-holes with subwavelength radii in the range of 300–400 nm were investigated, while varying the nano-hole period from 1.0 to 1.2 µm. The evolution of the compressed wavelength was analyzed based on the E-field intensity distributions in the vertical cross sections of the nano-holes for different dielectric materials, along with the corresponding variations in transmittance (T) and reflectance (R) as a function of the period (P). Then, the nano-hole period was fixed at 1.2 µm, and the nano-hole radius (r) was increased from 300 nm to 500 nm in 50 nm increments to observe the dielectric-dependent changes in the compressed wavelength. The interplay between the cavity effect and LSPR was clarified through a detailed analysis of the E-field intensity distributions in both vertical and horizontal cross sections of the nano-holes. Finally, the spatial variation of the compressed wavelength at characteristic positions at the hole diameter and at one-third and two-thirds of the radius was analyzed for each dielectric material to assess the stability and overall trends of the compressed wavelength behavior.

3.1. Variation of Compressed Wavelength of NHAs Filled with Different Dielectric Materials

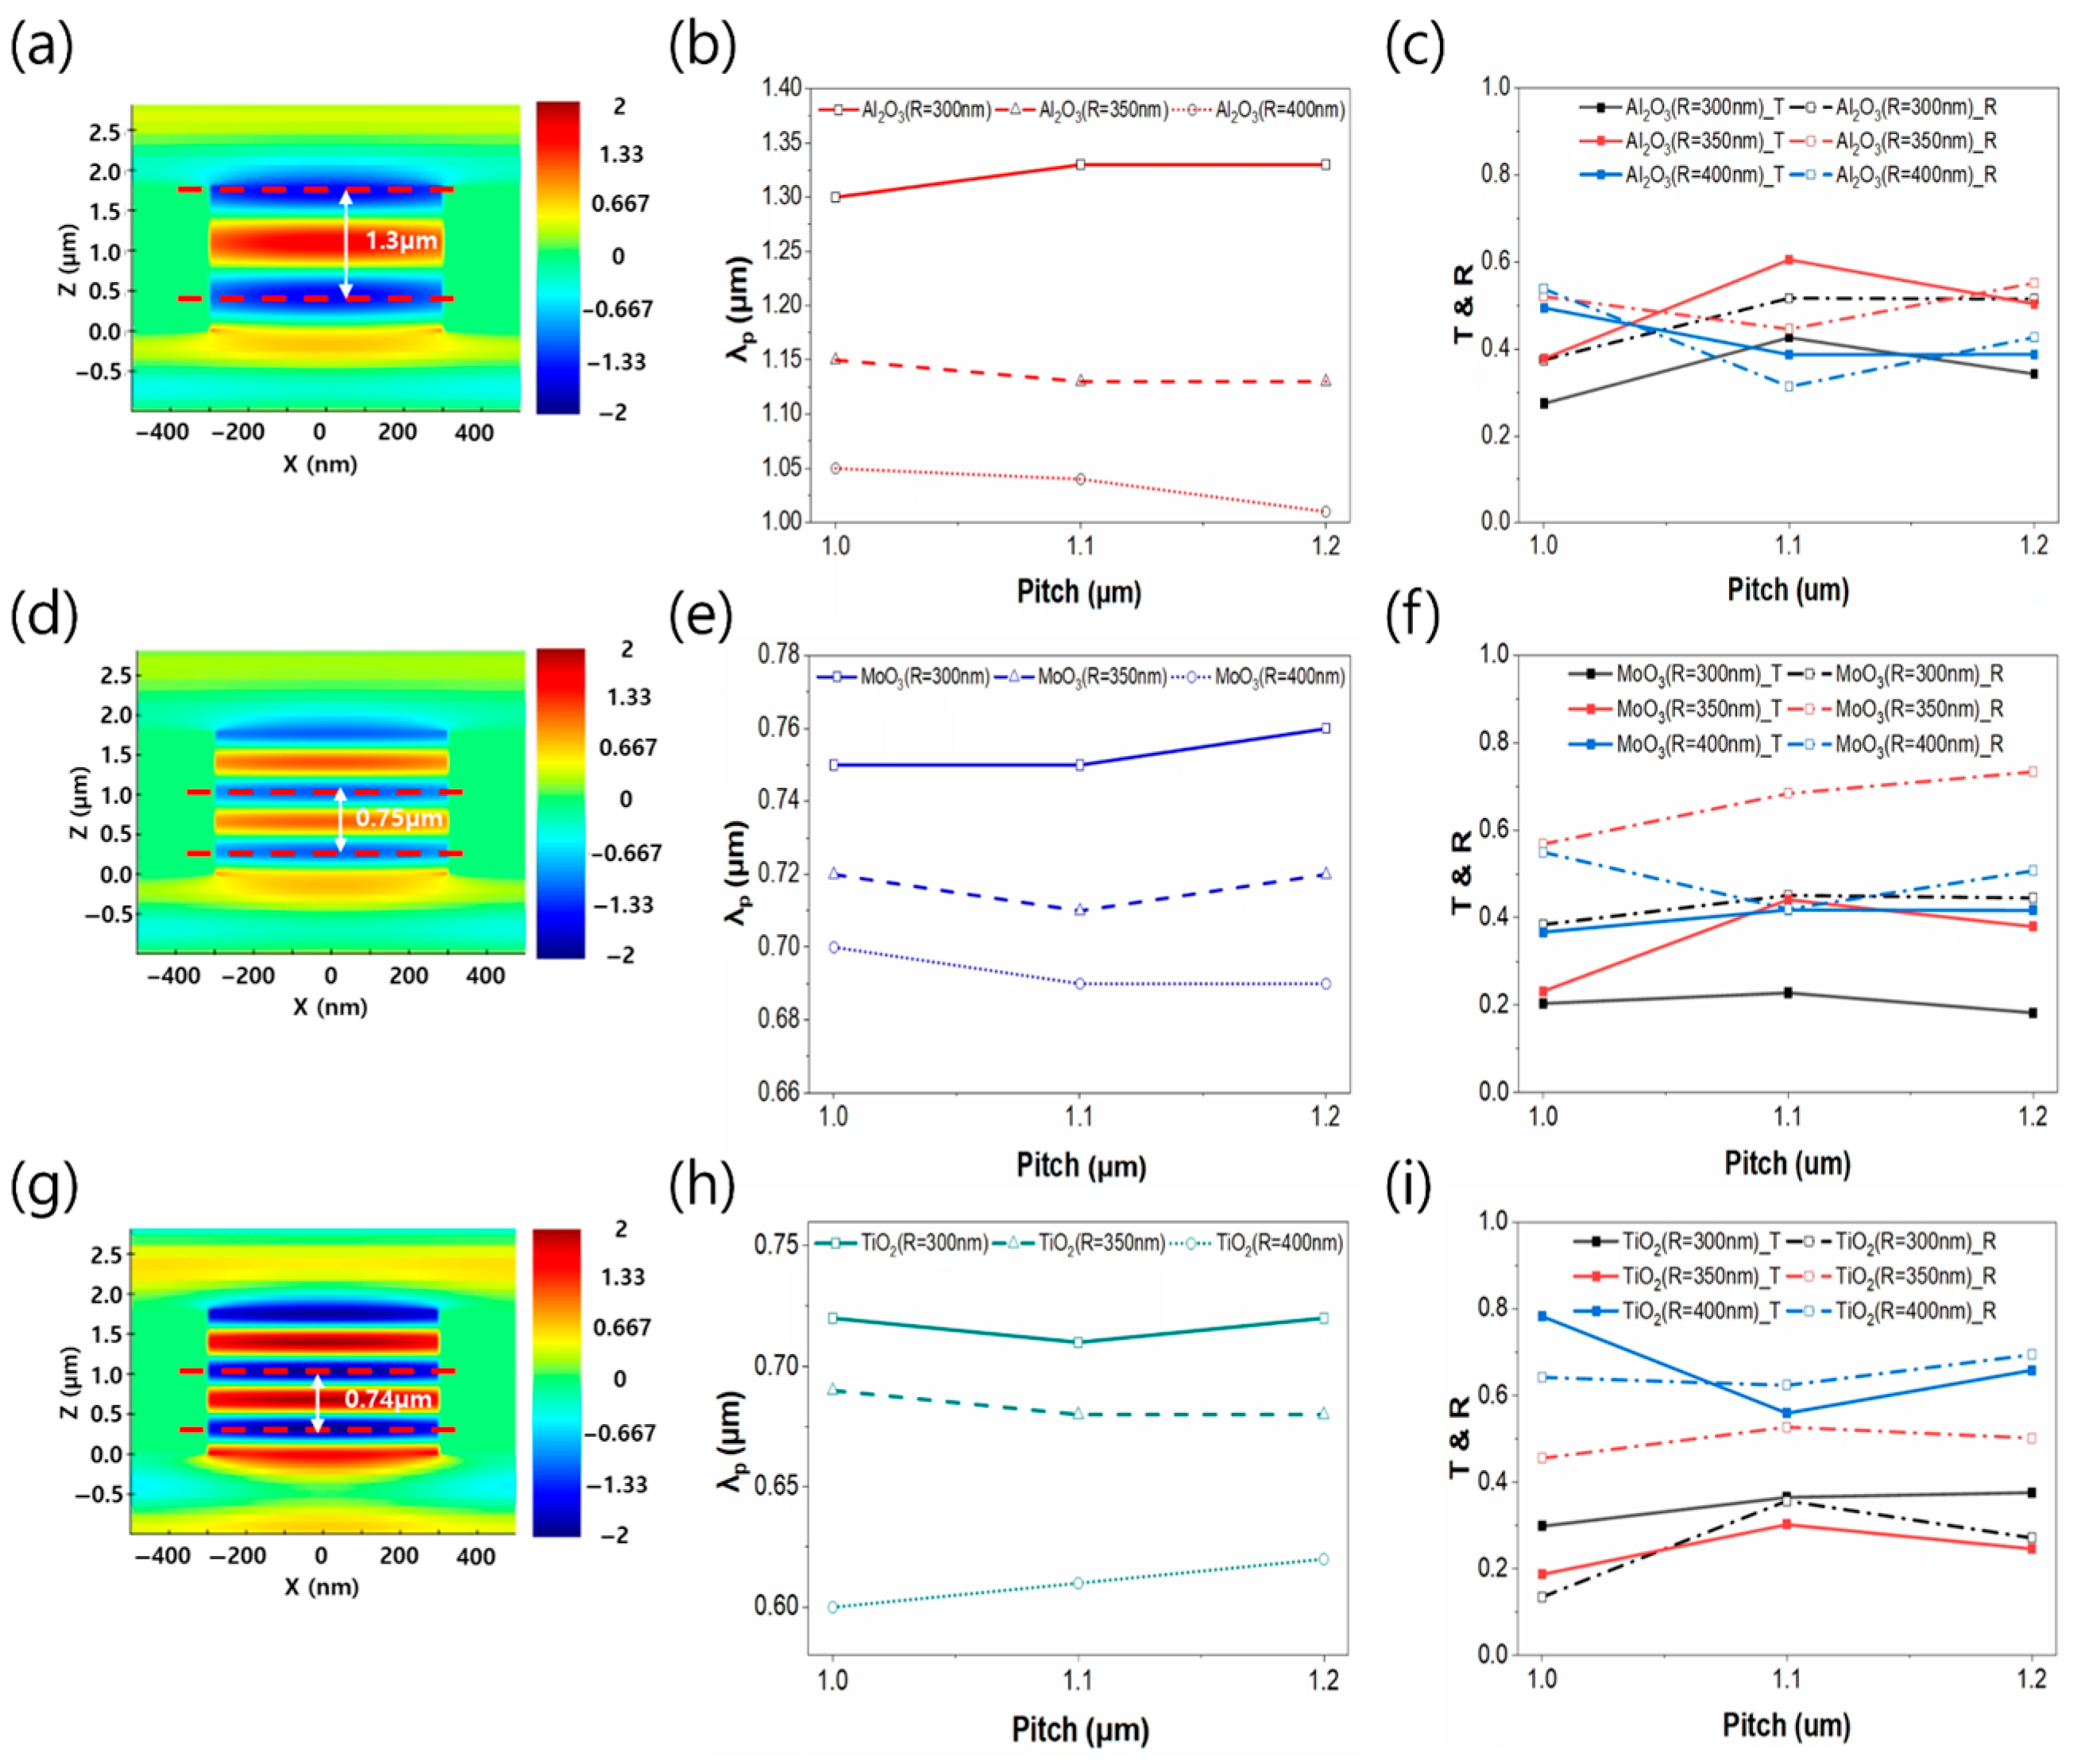
Figure 3a,d,g show representative xz-plane E-field amplitude distribution of the NHAs (radius of 300 nm, period of 1 μm) filled with Al2O3, MoO3, and TiO2, respectively. The compressed wavelengths extracted from the spacing between adjacent amplitude maxima and minima of these E-field distributions are 1.3 μm, 0.75 μm, 0.74 μm, accordingly. In a similar way, the effective compressed wavelengths (λp) inside the NHAs (radii of 300, 350, 400 nm) filled with Al2O3, MoO3, and TiO2 are shown in Figure 3b,e,h, respectively, as a function of the nano-hole period. For all three dielectrics, λp exhibits a relatively weak dependence on the period compared to the hole radius. Increasing the hole radius generally leads to a reduction in λp, indicating stronger wavelength compression due to enhanced light confinement and modal interaction within larger nano-holes.
Meanwhile, the period mainly modulates λp slightly through inter-hole coupling effects. Figure 3c,f,i show the variations in the transmission and reflection through the NHAs filled with Al2O3, MoO3, and TiO2, respectively. The transmission and reflection spectra exhibit a stronger dependence on the period than λp. Changes in the hole radius affect the overall magnitude of T and R rather than their period-dependent trends.

3.2. Radius-Dependent Compressed Wavelength of NHAs Filled with Different Dielectric Materials

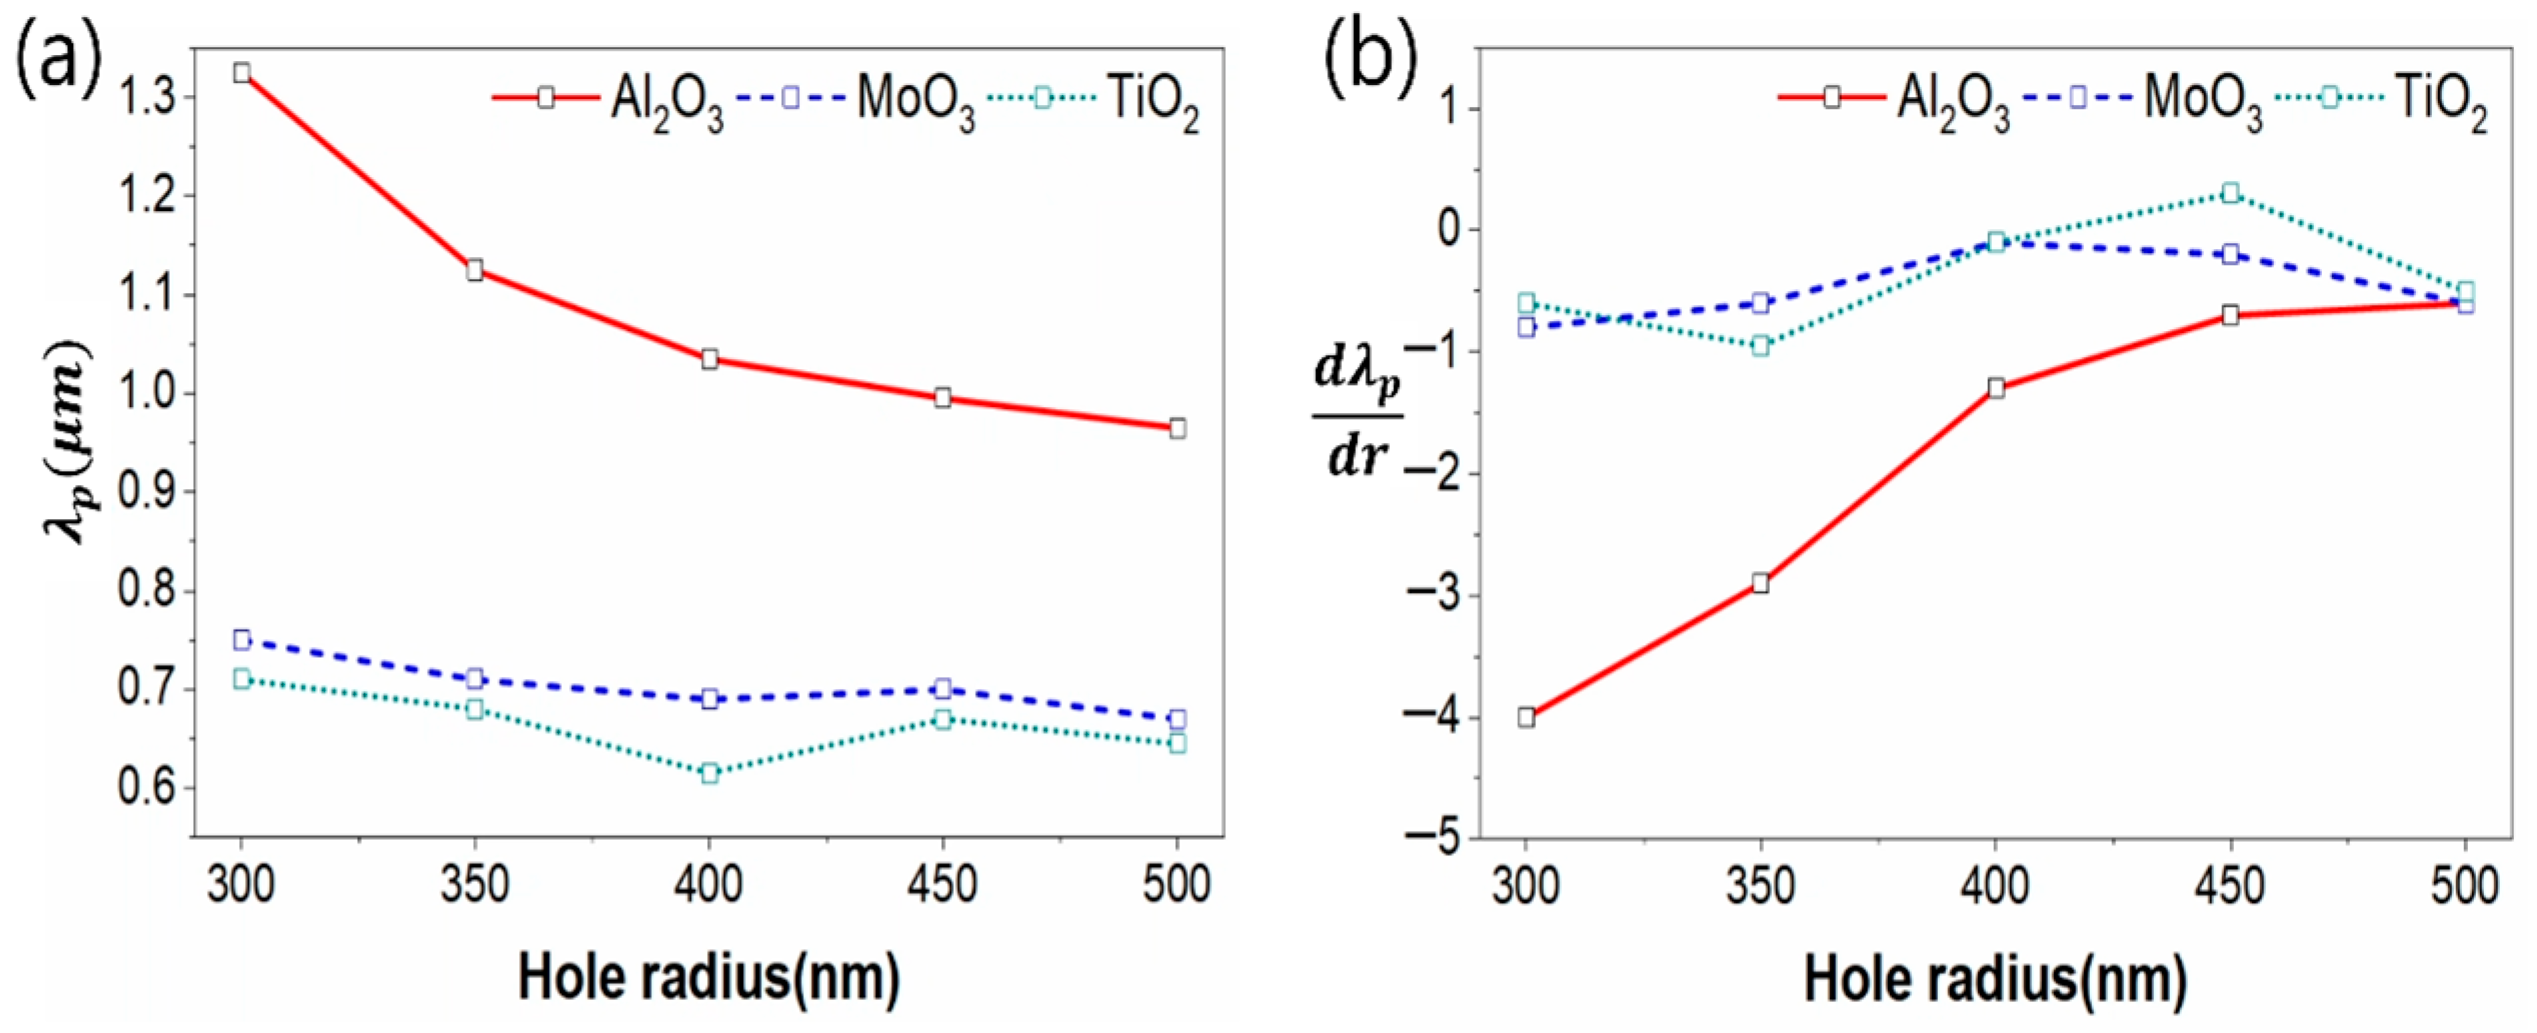
For a nano-hole period of 1.2 µm and a thickness of 1.8 µm, the dielectric-dependent changes in the compressed wavelength were analyzed as a function of the nano-hole radius from 300 nm to 500 nm. Figure 4a shows the variation in the compressed wavelength (λp) as a function of the hole radius for the NHAs filled with different dielectric materials. For Al2O3 (red solid line), the λp decreases monotonically from 1.325 to 0.965 µm, as the hole radius increases from 300 to 500 nm, indicating a strong wavelength compression due to enhanced light confinement and modal interaction with increasing nano-hole size. Meanwhile, MoO3 (blue solid line) exhibits a relatively weak dependence on the hole radius, with λp showing only a slight decrease from 0.750 to 0.670 µm over the same range, implying greater confinement stability against geometric variations. TiO2 (green solid line) shows a modest reduction in λp from 0.710 to 0.615 µm, followed by an increase to 0.645 µm, as the radius increases from 300 nm to 500 nm, although its overall magnitude remains lower than that of MoO3 over the entire range. Figure 4b represents a sensitivity parameter ( d λ p / d r ) to allow for objective comparison among the dielectric materials. Al2O3 reveals higher sensitivity to structural variation, indicating that geometric confinement strongly affects the effective modal behavior, whereas MoO3 exhibits relatively moderate variation over the same radius range. The sensitivity observed for TiO2 implies a balance between the dielectric confinement and cavity-mode evolution as the geometry changes. These results highlight that both dielectric properties filling the nano-holes and structural dimensions collectively govern the degree of wavelength compression in the NHAs. In a metal nano-slit, the wavelength squeeze originates from the dispersion of a guided in-slit surface plasmon polariton, which results from the strong coupling between the two opposing metal sidewalls of the slit [29]. For a 1 μm wavelength normally incident on a 1.8 μm-thick nano-slit, the compressed wavelength decreases from 0.96 μm to 0.73 μm, as the slit spacing is reduced from 0.8 μm to 0.05 μm. On the other hand, the wavelength compression in the metallic NHAs is mainly associated with localized and hybrid plasmonic resonance. Owing to the closed and two-dimensional boundary of the nano-hole, the electromagnetic field experiences strong multidirectional confinement along the hole rim, leading to rapid phase variation and a reduced effective local wavelength. In addition, periodic arrays introduce collective surface-wave and Bloch-mode effects that further enhance this confinement [39,40]. Therefore, unlike the nano-slit case, the wavele-ngth squeeze in a nano-hole array is not a purely guided-wave effect but arises from localized plasmonic confinement and array-mediated surface-wave coupling.
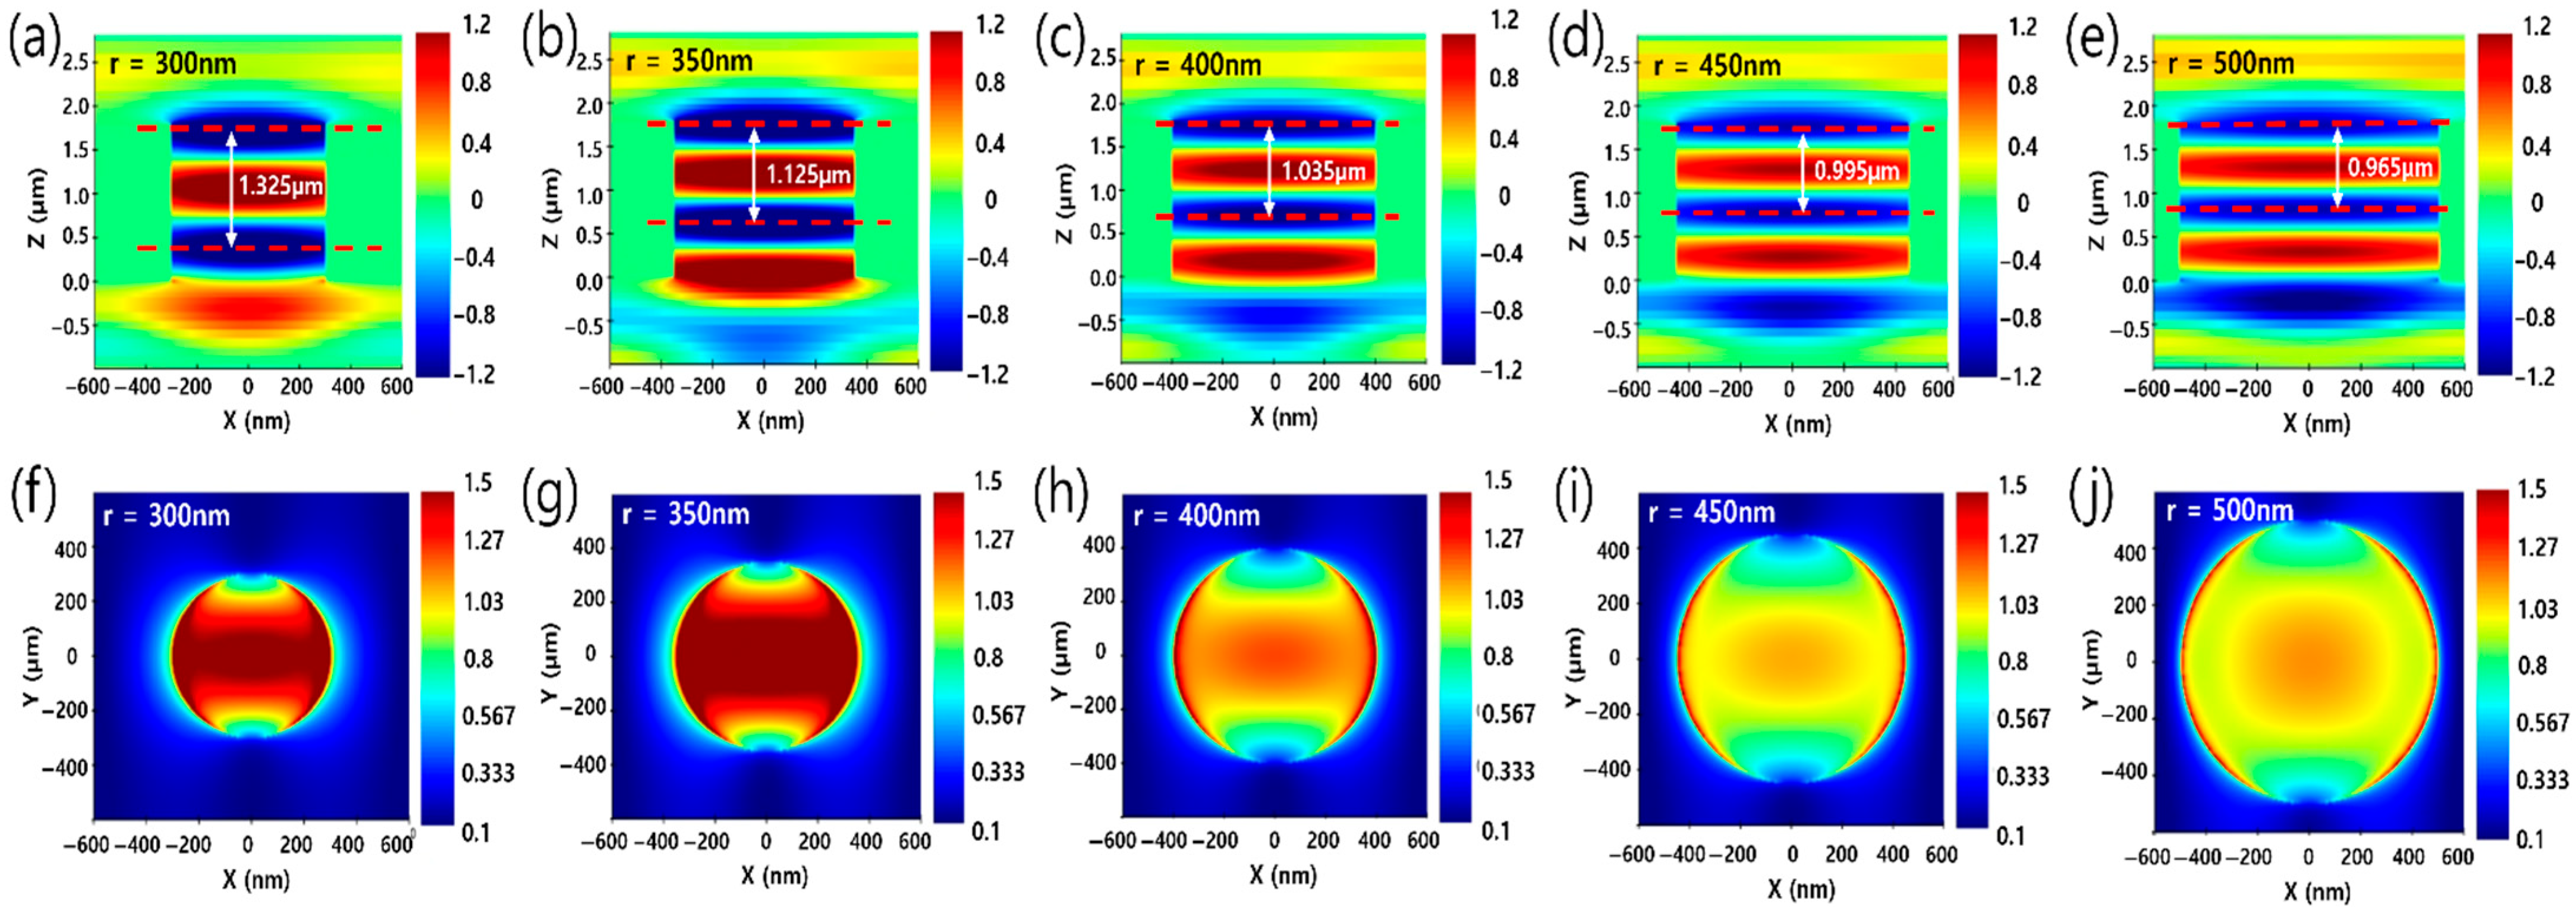
To elucidate the interplay between the cavity effects and LSPR responsible for the dielectric-dependent variation of λp observed in Figure 4, we performed a detailed analysis of the E-field distributions in both vertical and horizontal cross sections of the nano-holes. The E-field amplitude distributions in the vertical cross sections presented in Figure 5a–e reveal that the Al2O3-filled NHAs function as effective plasmonic cavities. Distinct standing-wave patterns appear along the vertical (z)-direction due to multiple reflections at metal–dielectric boundaries and partial confinement at the top and bottom nano-hole opening. As the nano-hole radius increases from 300 to 500 nm, the resonant wavelength continuously shifts toward a shorter wavelength, decreasing from 1.325 μm to 0.965 μm. It is seen that the resonance tuning is governed by both the longitudinal cavity length and the evolution of transverse cavity modes. The increased nano-hole radius induces higher-order lateral modes, which leads to reduced field confinement within the cavity, as evidenced by the gradual spreading and weakening of the field amplitude. Figure 5f–j show the E-field intensity distributions on a horizontal plane located just above the nano-holes. For smaller radii (300 and 350 nm), the E-field is strongly localized near the center of the nano-hole, indicating a dominant dipolar-like plasmon mode and strong coupling with the cavity-confined fields. With an increasing radius to 400–500 nm, the E-field intensity distribution gradually extends toward the nano-hole perimeter, revealing a transition toward higher-order plasmon modes dominated by edge effects. Thus, increasing the nano-hole size produces lateral mode expansion, which reduces the electromagnetic confinement within the cavity and leads to a broader spatial distribution of the E-field amplitude. Here, it is noted that higher-order lateral modes contribute to field spreading in larger holes; the nanohole structure studied here does not support pure TEmn or TMmn modes due to the finite conductivity of the metal and the open asymmetric boundary conditions. The modes are therefore better described as hybrid plasmonic lateral modes.
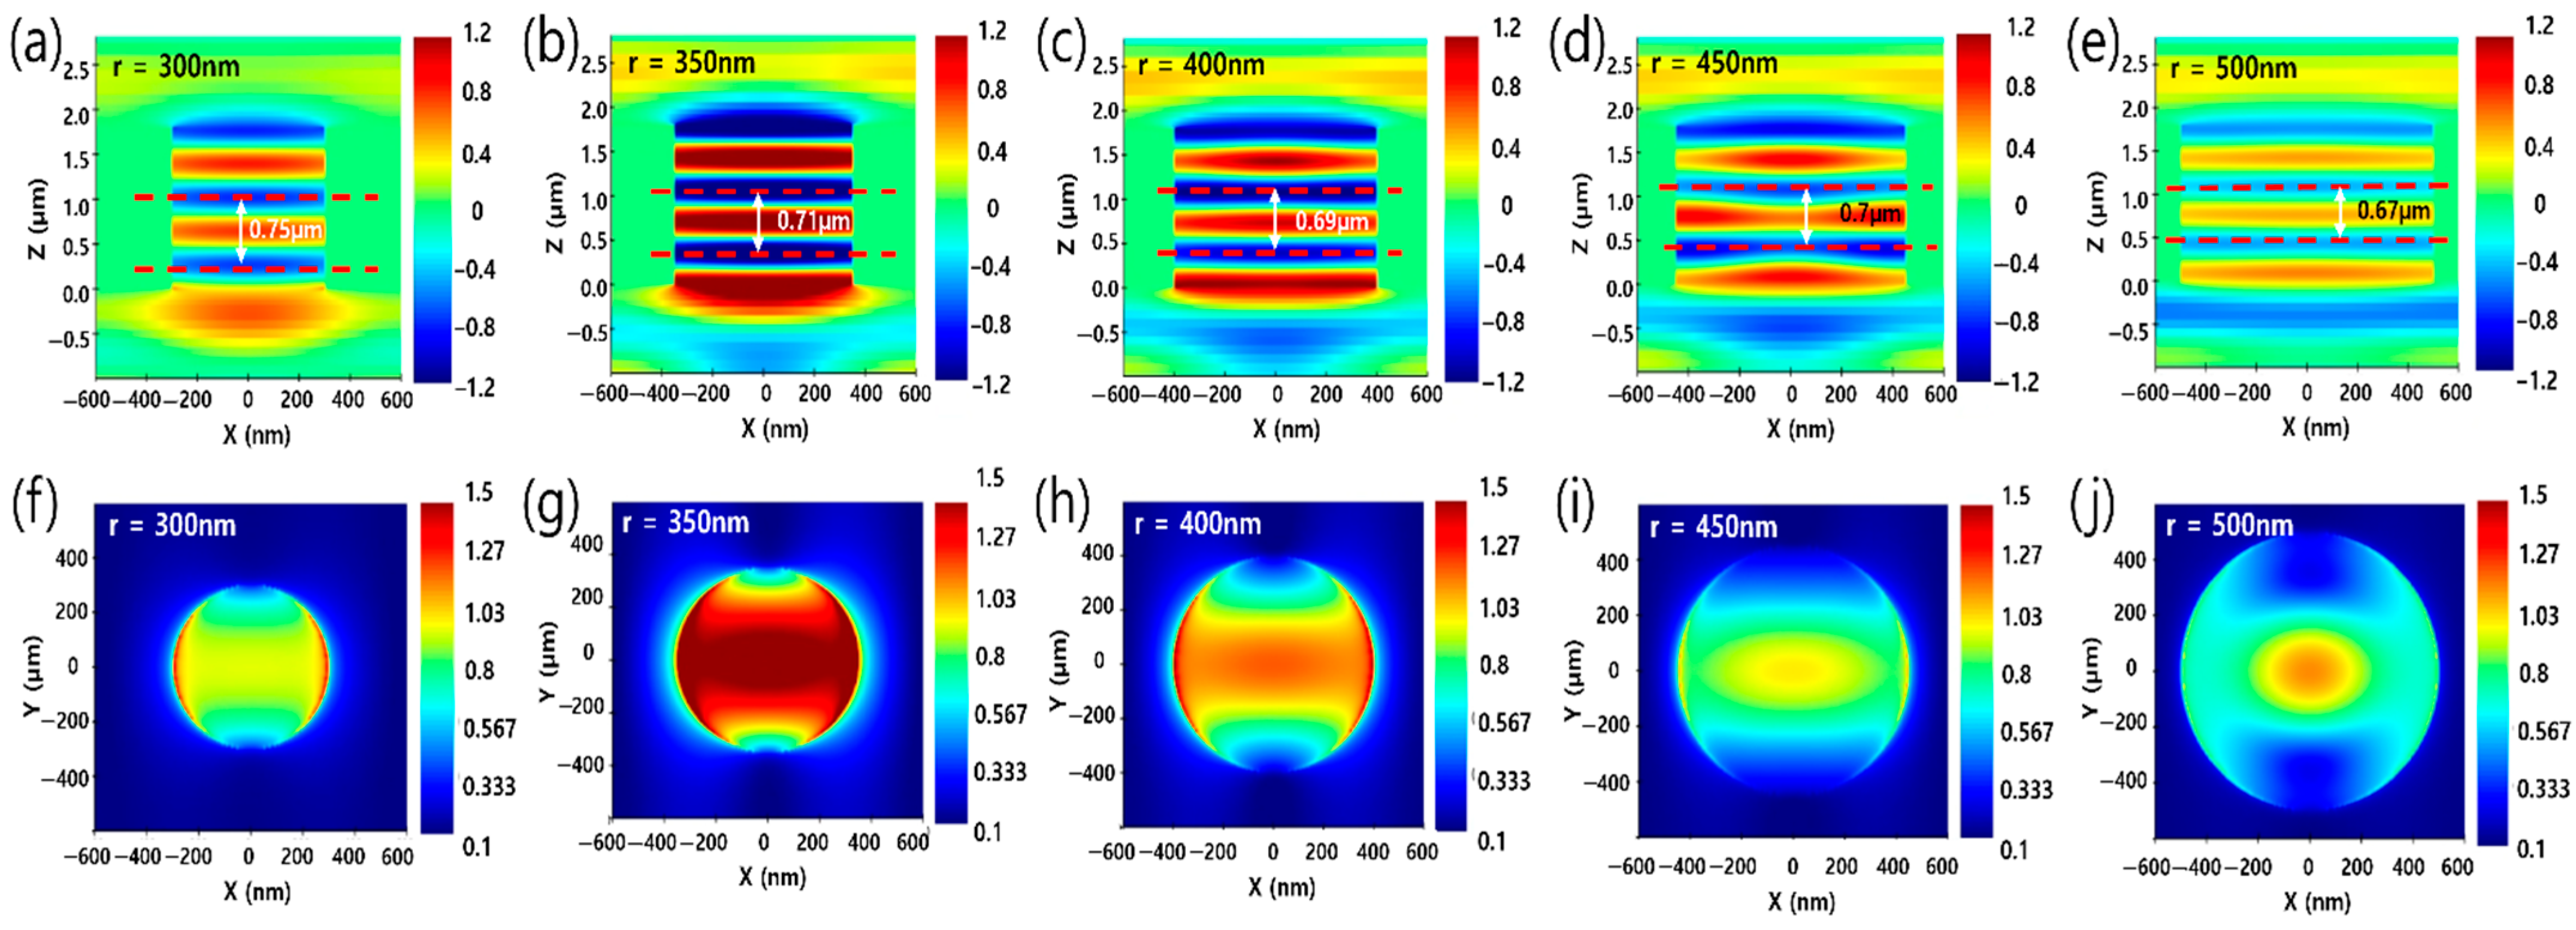
The vertical E-field amplitude distributions in Figure 6a–e exhibit that the MoO3-filled NHAs maintain cavity modes whose spatial characteristics vary with the nano-hole radius. Pronounced standing-wave patterns are also observed along the vertical direction, indicating effective electromagnetic confinement between the upper and lower interfaces of the nano-hole. As the radius increases from 300 to 500 nm, λp extracted from the E-field distribution gradually decreases from 0.75 μm to 0.67 μm, revealing that the resonance condition is gradually influenced by lateral mode expansion rather than only by vertical confinement. Figure 6a–e exhibits a more compressed field distribution along the z-direction in comparison with Figure 5a–e showing a stronger and more extended vertical field confinement. This behavior indicates a weakened cavity effect, likely associated with enhanced transverse mode coupling and increased lateral field leakage. The corresponding E-field intensity distributions obtained on a horizontal plane immediately above the nano-holes, shown in Figure 6f–j, provide the evolution of LSPR. For smaller nano-hole radii (300–400 nm), the field intensity remains largely confined within the nano-hole region, revealing the presence of coupled cavity–plasmon modes with limited surface localization. With increasing radius, the intensity patterns become progressively smoother and more spatially extended, while pronounced edge-localized hotspots are noticeably suppressed compared to those in Figure 5f–j. It reveals a diminished contribution from higher-order LSPR and a reduced role of perimeter-dominated plasmon modes. Thus, the plasmonic response in MoO3-filled NHAs is less strongly localized, and the overall resonance is characterized by weaker cavity–plasmon interaction and reduced electromagnetic confinement compared to the Al2O3 case.
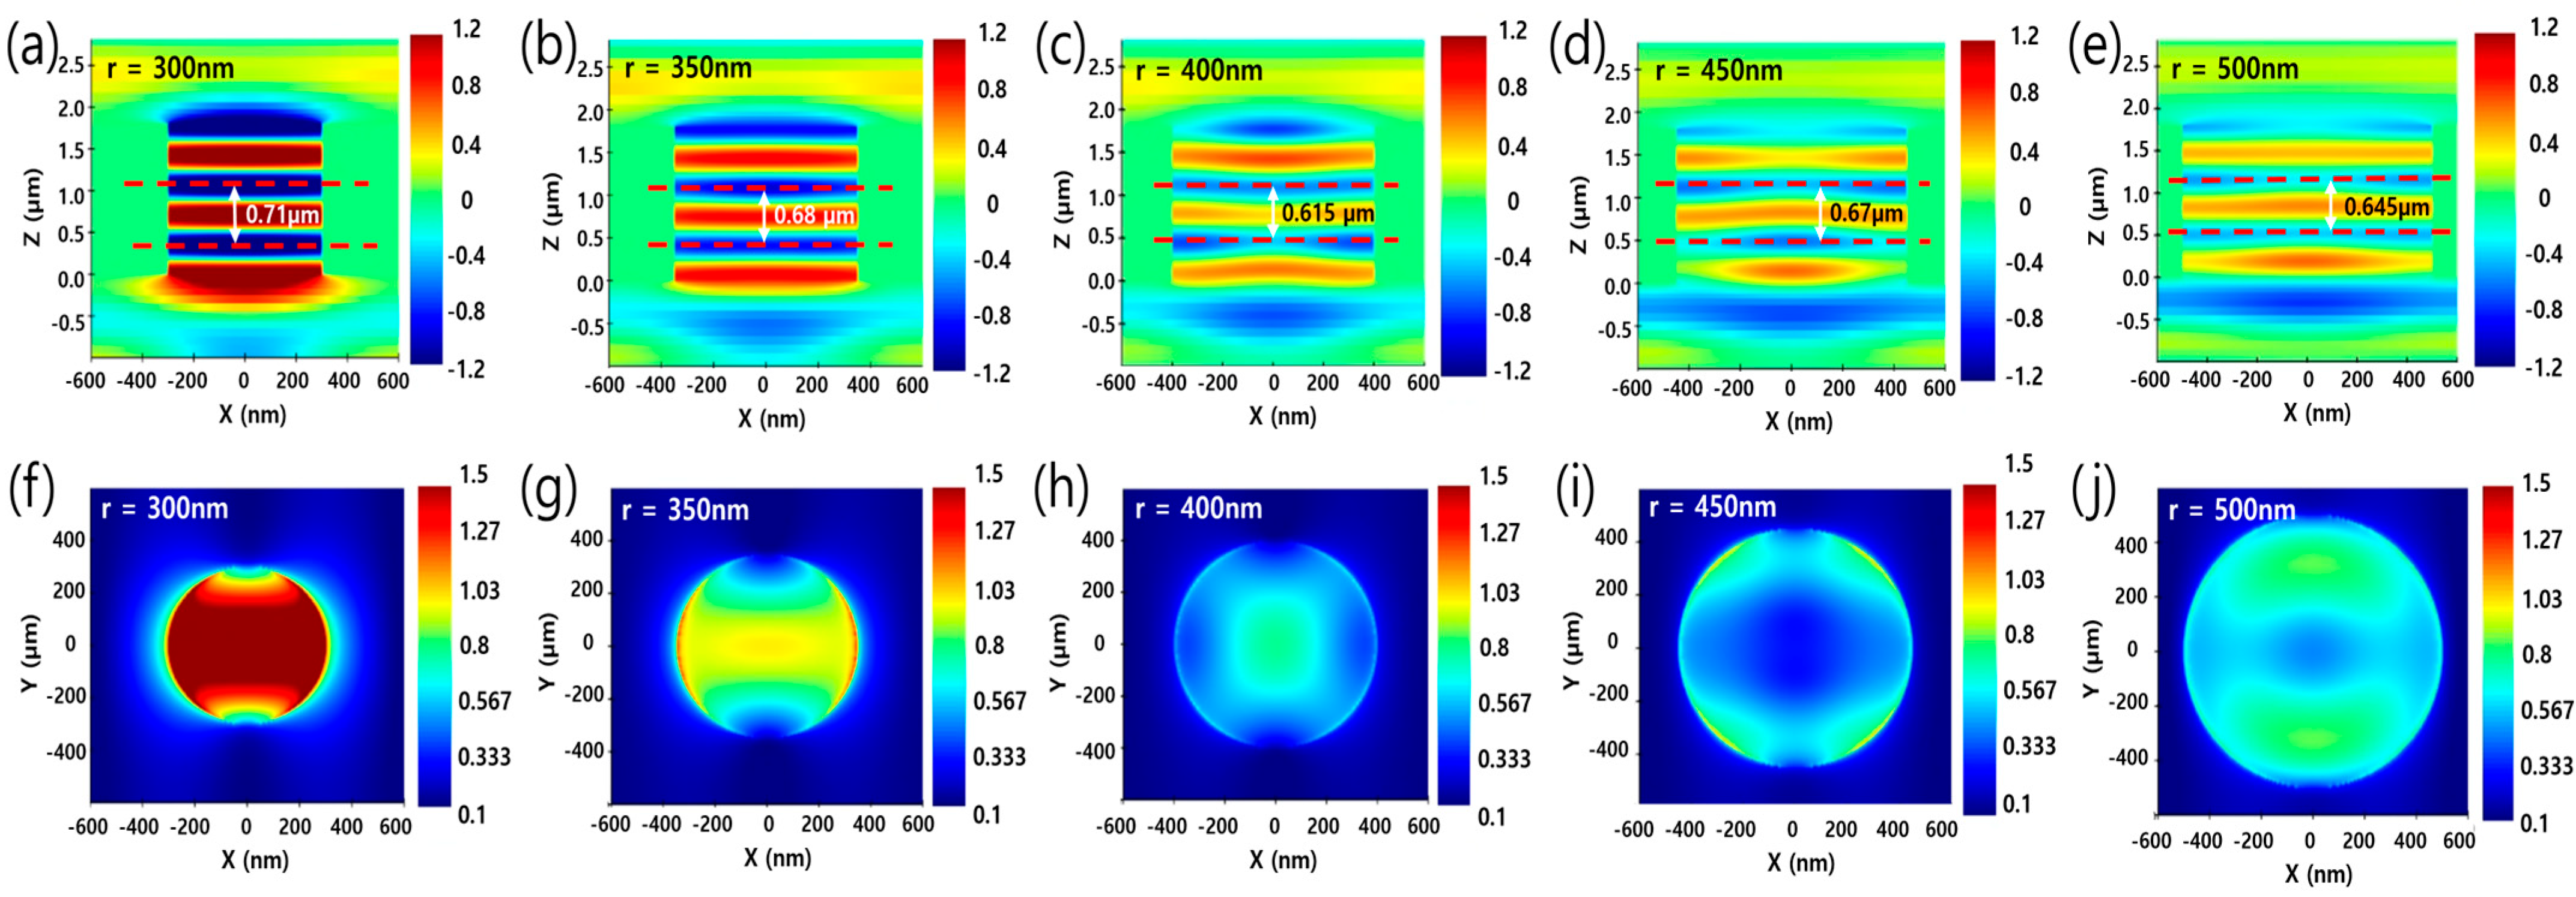
The vertical E-field amplitude distributions in Figure 7a–e exhibit that the TiO2-filled NHAs sustain standing-wave-like cavity modes. As the nano-hole radius increases from 300 to 500 nm, λp slightly decreases from 0.71 μm to 0.645 μm. Figure 7a–e illustrate an intermediate confinement regime, bridging the transition between the pronounced vertical confinement observed in Figure 5a–e and the more significant mode compression characterized in Figure 6a–e. The lateral mode expansion increasingly influences the resonance with preserving vertical cavity structure, which shows a partial weakening of the cavity effect without complete loss of the vertical field confinement. The E-field intensity distributions on the horizontal plane above the nano-holes, shown in Figure 7f–j, also exhibit the evolution of LSPR. For smaller radii (300, 350 nm), the field intensity remains strongly concentrated within the nano-hole region. As the radius increases, the intensity distribution becomes more uniform and less sharply localized with reduced hotspot formation near the nano-hole edges. Unlike the intense edge-confinement in Figure 5f–j or the nearly extinguished features in Figure 6f–j, this case maintains a moderate plasmonic response characterized by weakened but still discernible surface localization. Thus, TiO2-filled NHAs show a transitional regime in which LSPR contributes to the overall electromagnetic response while remaining strongly influenced by the underlying cavity modes.
The wavelength compression observed in Figure 5, Figure 6 and Figure 7 originates from the excitation of plasmonic modes confined within the nano-hole cavity. Here, the compressed wavelength (λp) is determined by the real part of the modal propagation constant (β), i.e., λp = 2π/Re(β). Due to strong dielectric confinement and Al–dielectric interface effects, these modes exhibit a propagation constant (β) larger than that of free-space light. Thus, the effective modal wavelength becomes shorter than the incident wavelength, resulting in subwavelength confinement. In addition, the observed field distributions inside the NHAs can be understood through Fabry–Pérot-type resonance conditions. The nanohole cavity sustains vertically confined plasmonic modes satisfying a phase-matching condition of 2 β L + ϕ r = m 2 π . Here, L, ϕ r , and m are the effective cavity length, the reflection phase at the cavity interfaces, and an integer mode order, respectively. In this case, the spacing between adjacent amplitude maxima or minima corresponds to λp, reflecting the effective modal wavelength. Thus, wavelength compression in this study is physically interpreted as a reduction in the effective plasmonic modal wavelength due to strong dielectric confinement and cavity-supported plasmonic resonances.
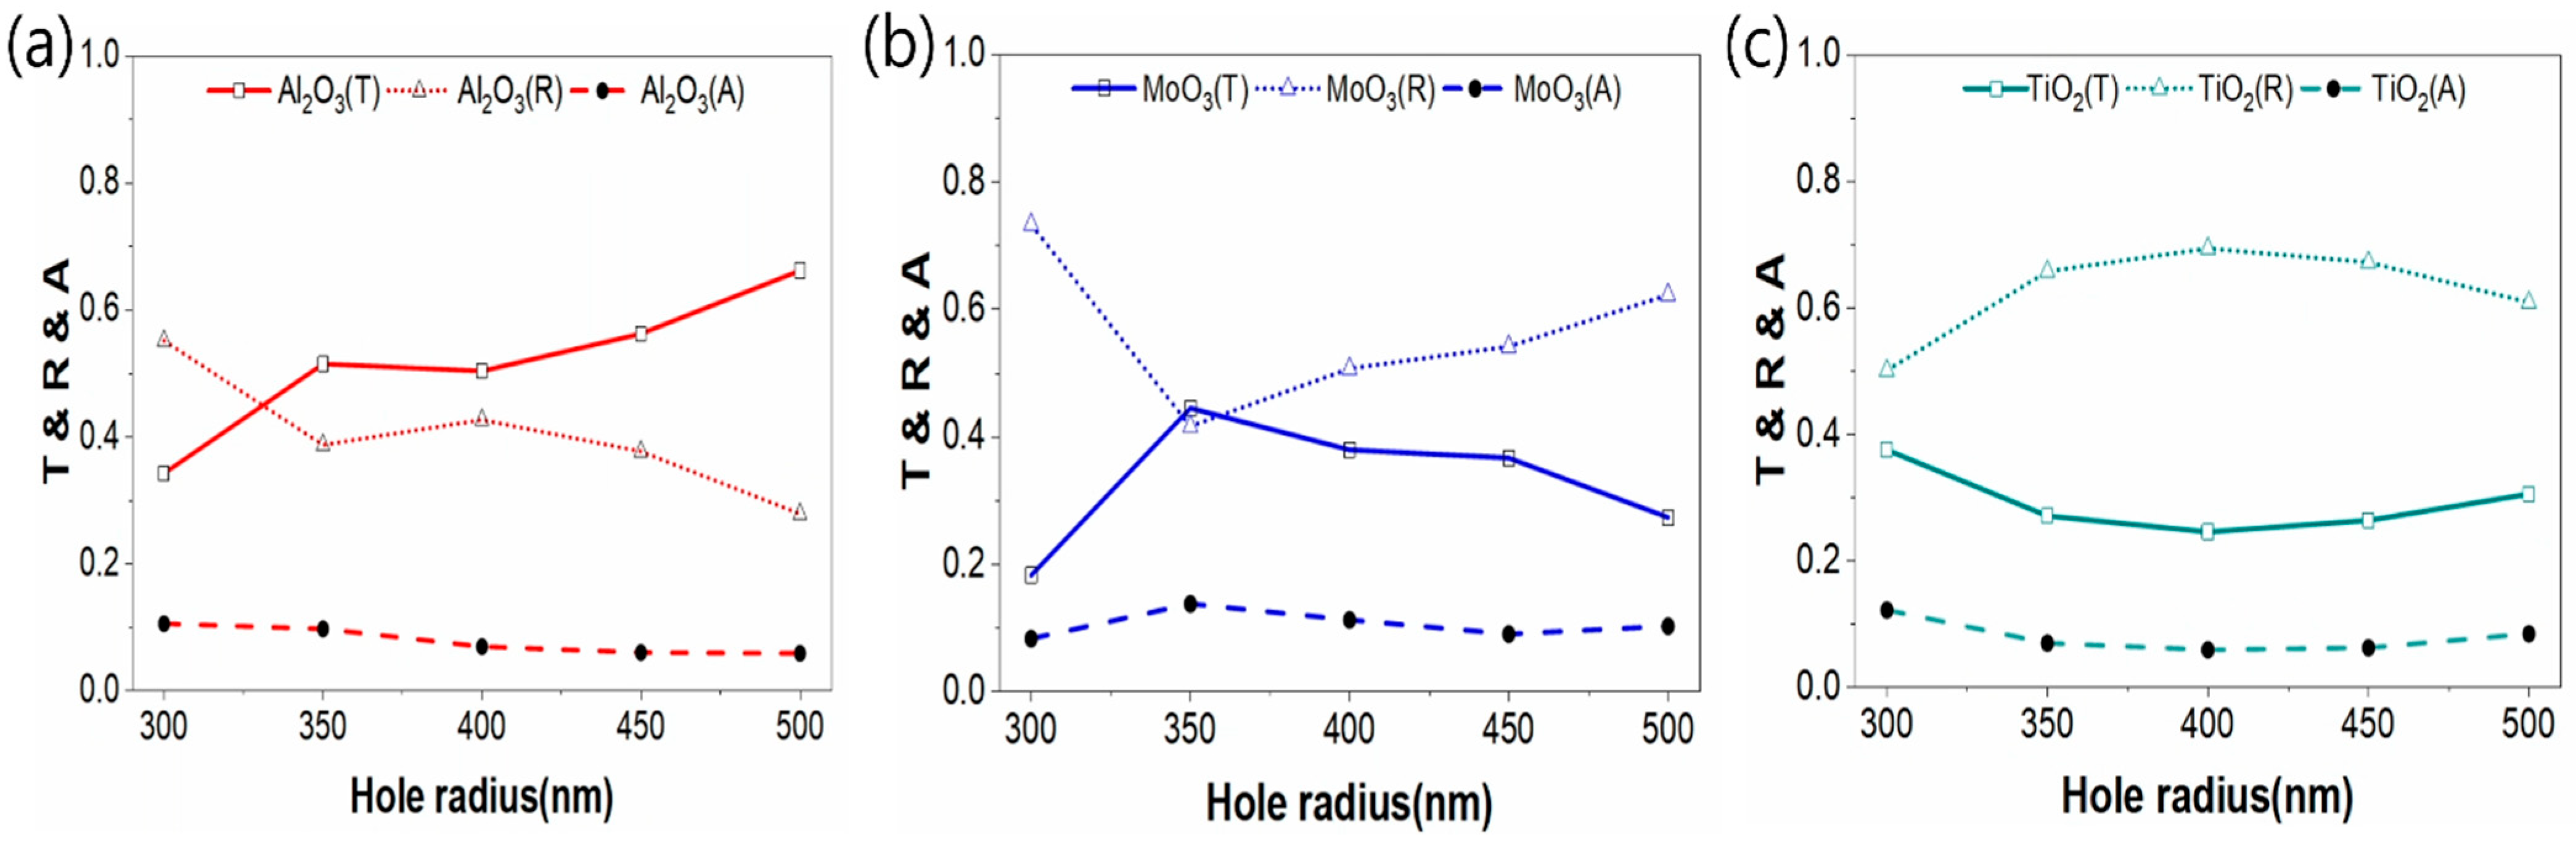
Figure 8 reveals the radius-dependent spectral responses of NHAs filled with different dielectric materials, revealing distinct trends governed by the interplay between geometric effects and dielectric properties. For the NHAs filled with Al2O3 (Figure 8a), the monotonic increase in transmittance with increasing hole radius, accompanied by a reduction in reflectance, is attributed to the enhanced optical coupling and reduced effective impedance mismatch, whereas the consistently low absorptance indicates negligible intrinsic material loss. In the case of MoO3 (Figure 8b), the transmittance exhibits a peak at an intermediate radius due to the resonant interplay between cavity-like modes and LSPRs. Beyond this point, the intensified field confinement induces both reflectance and absorption. This shift in the energy balance accounts for the observed non-monotonic optical response, which is driven by the coupling of these plasmonic modes. For the NHAs filled with TiO2 (Figure 8c), the suppression of transmittance at intermediate radii and the corresponding enhancement of reflectance are mainly associated with higher refractive index contrast (Figure 2a) and mode mismatch, whereas the weak variation in absorptance suggests that scattering and reflection dominate over absorption. In addition, the Q-factor of the metallic NHAs is mainly limited by absorptive losses arising from the intrinsic dissipation of the constituent metal. Because the resonant modes are characterized by strong field confinement near the nano-hole rim and metal surfaces, a significant portion of the electromagnetic energy is stored in regions with high ohmic loss. As a result, an increase in absorption directly leads to a reduction in the Q-factor by accelerating the energy dissipation. Although collective lattice or surface-wave effects can partially redistribute the field away from the metal and enhance the radiative lifetime, the overall Q-factor in NHAs remains fundamentally constrained by metal absorption.

3.3. Spatial Variation of the Compressed Wavelength at Characteristic Positions of the NHAs

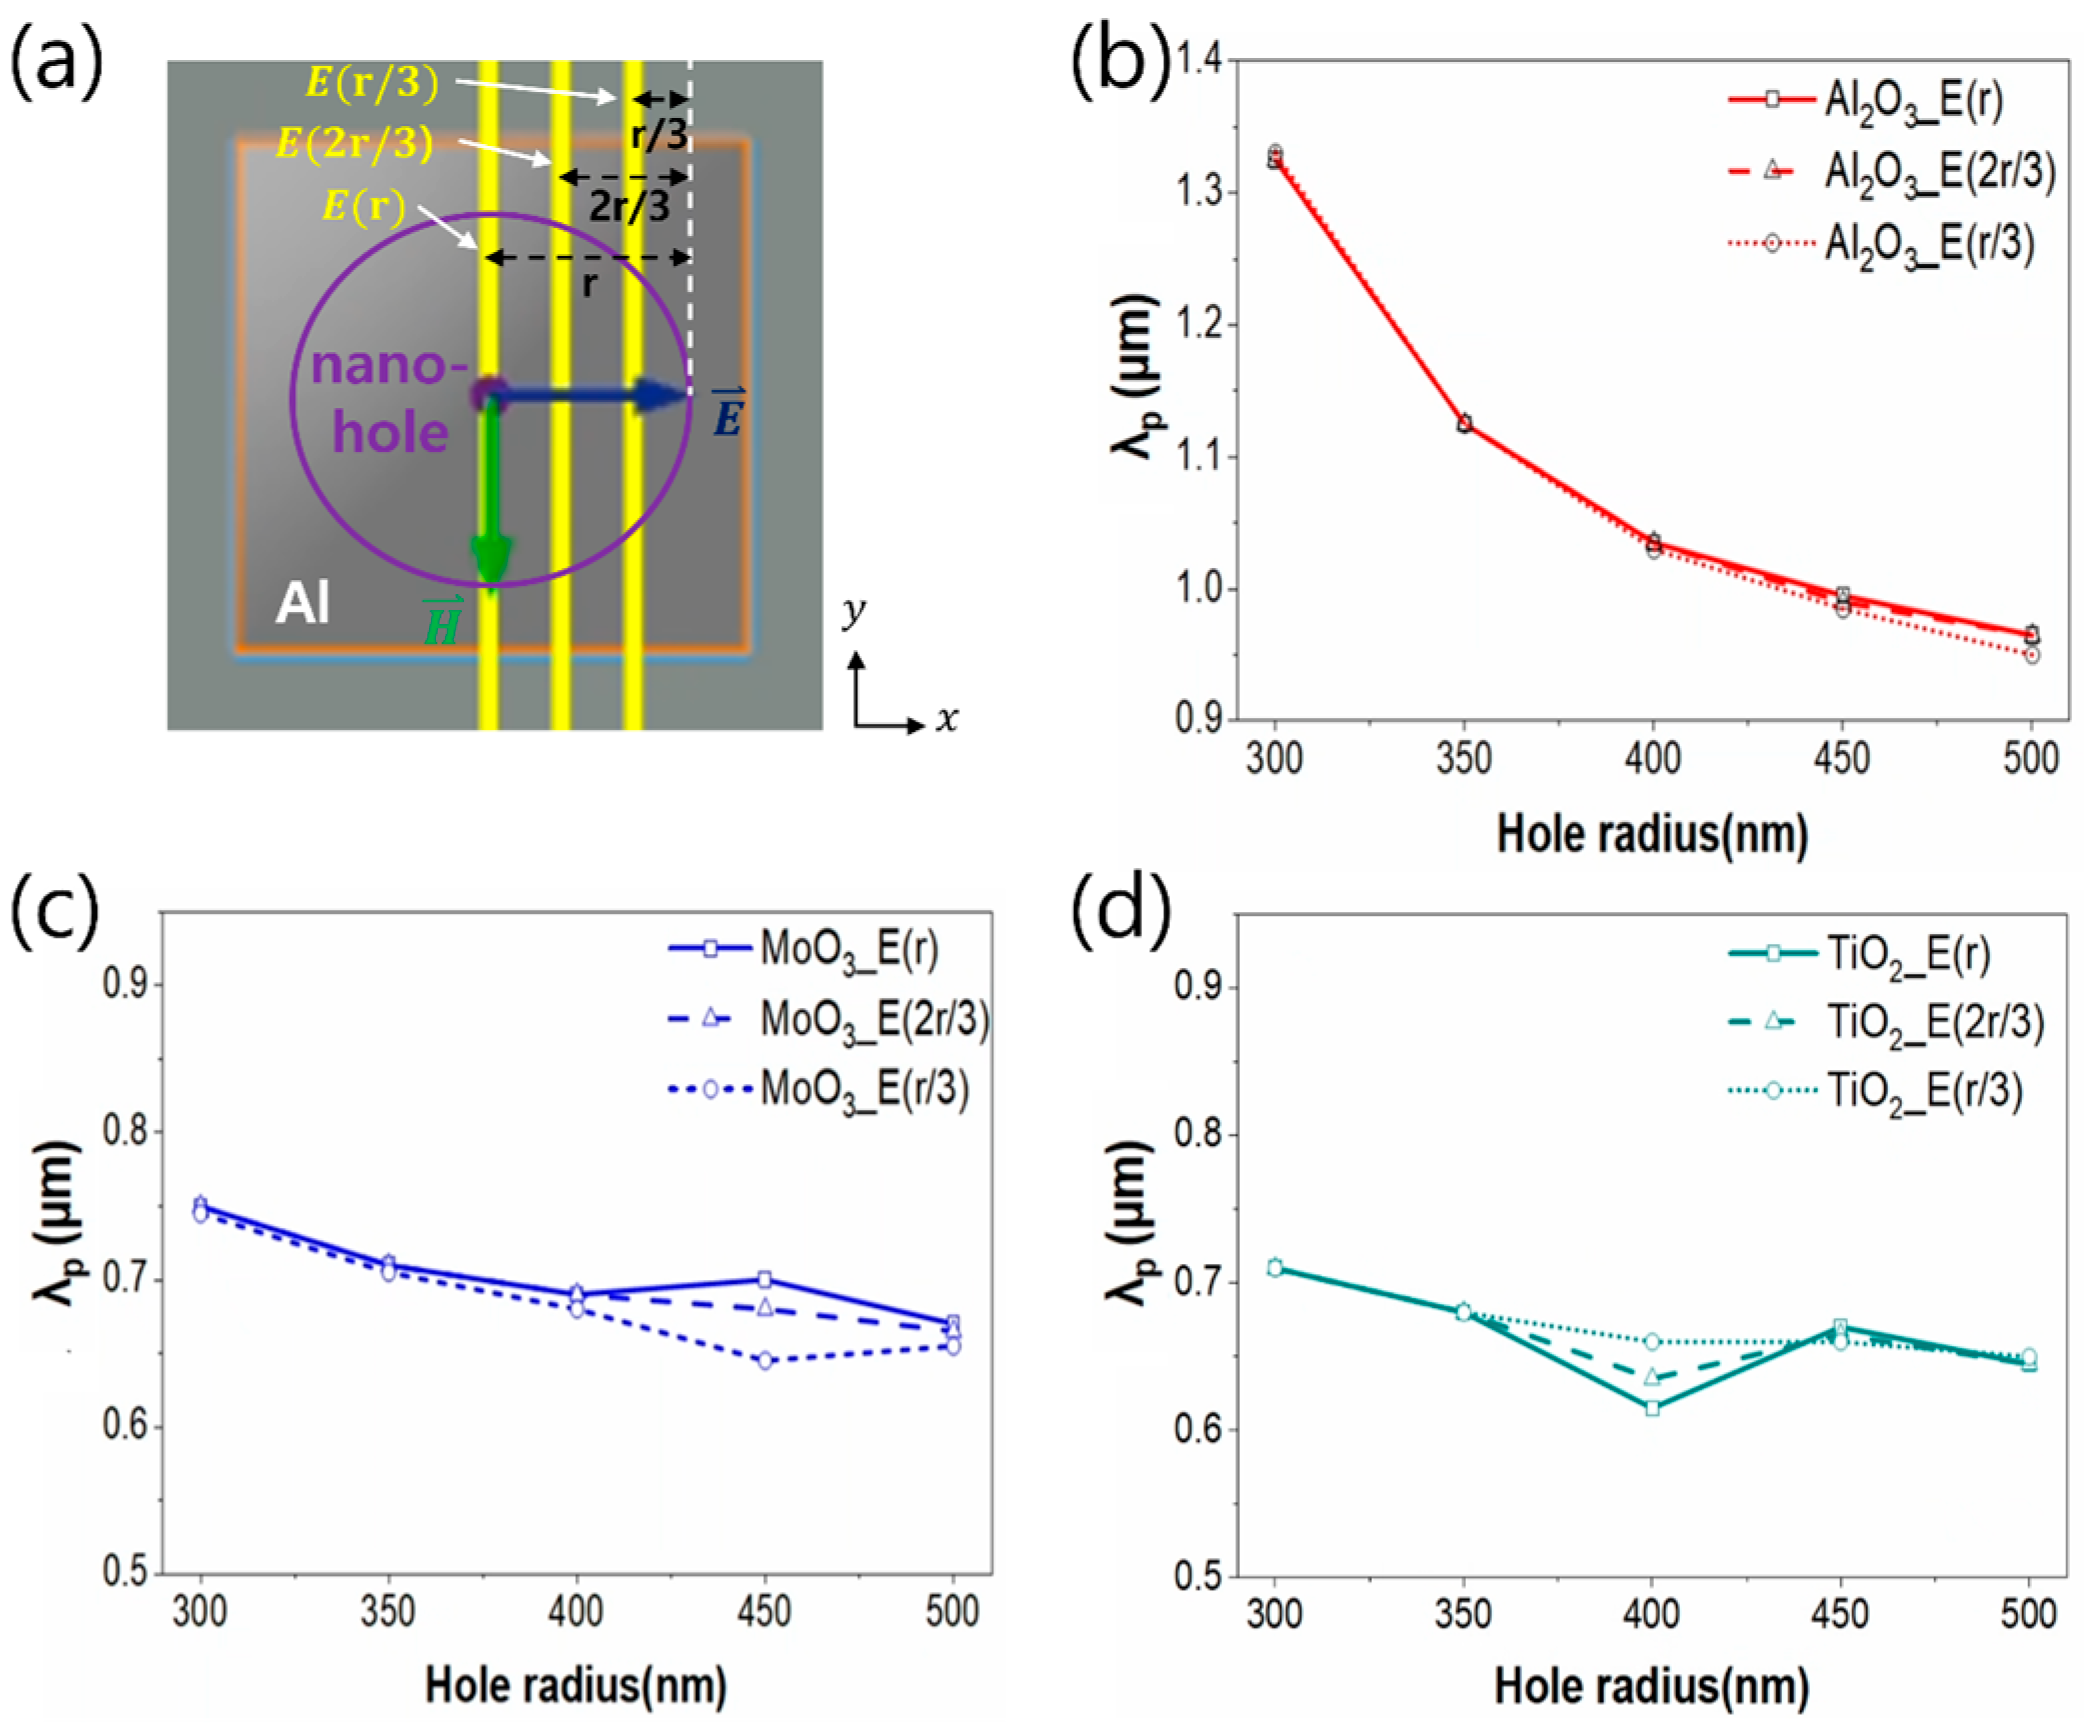
Figure 9a illustrates the 2D schematic of the unit-cell structure with a circular nano-hole embedded in an Al film and three representative radial positions—at the nano-hole radius (r), two-thirds of the radius (2r/3), and one-third of the radius (r/3)—are indicated by dashed lines. These positions are selected to investigate the spatial variation of the compressed wavelength within the nano-holes and to analyze how the locally observed compressed wavelength depends on both the nano-hole size and the radial position inside the dielectric-filled nano-hole.
Figure 9b–d show the variations in the compressed wavelength with the nano-hole radius for the NHAs filled with Al2O3, MoO3, and TiO2, respectively, evaluated at three radial positions inside the nano-hole (r, 2r/3, and r/3). In all cases, an overall reduction in the λp is observed as the nano-hole radius increases, but the degree of radial position dependence differs markedly among the three dielectrics. For Al2O3-filled NHAs (Figure 9b), the λp, measured at different radial positions, closely follows the same trend over the entire radius range. This behavior reconfirms that the effective mode index is predominantly governed by the overall nano-hole geometry rather than by local radial confinement, leading to a nearly uniform spatial distribution of the compressed field within the nano-hole. Meanwhile, MoO3-filled NHAs exhibit noticeable separation among the wavelengths at r, 2r/3, and r/3 at an intermediate radius of 450 nm, as shown in Figure 9c. The observed result is attributed to a modified effective refractive index profile within the nano-hole, resulting in position-dependent mode confinement. This radial dependence becomes also pronounced for TiO2-filled NHAs (Figure 9d). The λp exhibits a non-monotonic variation with the nano-hole radius, especially at radial positions of r and 2r/3, where a minimum appears at an intermediate radius of 400 nm, whereas the wavelength measured at r/3 shows a comparatively smoother trend. These results indicate the strong radial inhomogeneity of the compressive mode, reflecting enhanced dielectric-induced confinement and a highly non-uniform field distribution within the nano-hole.
The observed results reveal that dielectric-dependent wavelength compression via the NHA structures is primarily determined by the interaction between cavity-supported resonances and LSPR modes. Al2O3-filled NHAs show strong vertical confinement and sustain robust cavity modes that strongly interact with surface plasmons, giving rise to highly localized electromagnetic fields. MoO3-filled NHA exhibits diminished cavity confinement due to enhanced lateral field leakage, which weakens the interaction between cavity and plasmonic modes and produces a more spatially extended surface response. TiO2-filled NHAs lie between these two regimes, where the residual cavity confinement enables partial coupling with moderately localized plasmon modes. This systematic transition demonstrates that adjustments in the nano-hole geometry directly influence cavity–plasmon interactions, thereby governing the redistribution of electromagnetic energy between confined and delocalized resonant modes.
Although we performed the analysis by assuming ideal vertical sidewalls of the NHAs, practical fabrication may introduce tapering or minor geometric deviations. Such tapering slightly modifies the effective cavity diameter along the vertical direction, leading to small shifts in the modal propagation constant (β) and resonance condition. As a result, the compressed wavelength and resonance position vary modestly. However, since the wavelength compression fundamentally arises from strong dielectric confinement and enhanced modal momentum, the existence of the compressed modes is expected to remain robust against moderate structural imperfections, with tapering mainly affecting resonance sharpness or loss rather than the underlying mechanism.
In the case of incomplete dielectric filling, the average refractive index within the nanohole would be reduced, which decreases the real part of the modal wavevector (Re(β)). Thus, the effective modal wavelength increases, leading to a reduced amount of wavelength compression and behavior closer to that of an air-filled cavity. Interface roughness or small voids could additionally cause scattering losses and slightly alter the phase condition associated with Fabry–Pérot-type resonances, resulting in broader or less pronounced resonances. Nevertheless, the wavelength compression mechanism due to the increase in modal momentum induced by dielectric confinement would not change. Highly conformal deposition methods such as atomic layer deposition are capable of significantly reducing void formation even in high-aspect-ratio nanostructures, enhancing the practical reliability.

4. Conclusions

We investigated the wavelength compression in Al-based NHAs by varying both the hole radius and the dielectric material filling the nano-holes under 1.5 µm illumination. Distinct dielectric-dependent trends were observed in the compressed wavelength, spatial mode distribution, and optical energy balance. The structure filled with Al2O3 shows a continuous reduction in the effective wavelength as the hole radius increases, along with minimal spatial variation inside the holes. It is attributed to strong vertical confinement with robust cavity–plasmon coupling and highly localized electromagnetic fields. Meanwhile, the NHAs incorporating MoO3 and TiO2 exhibit weaker geometric dependence and pronounced spatial changes in the compressed wavelength at intermediate radii, indicating enhanced modal interaction. The MoO3-filled NHAs show weakened cavity confinement due to enhanced lateral leakage, resulting in delocalized surface responses. TiO2-filled NHAs are in-between these two regimes with partial cavity–plasmon coupling and moderately localized plasmon modes. The observed results provide an effective handle for tuning wavelength squeezing, offering design principles for plasmonic structures operating in the near-infrared.

Author Contributions

This work was performed through the collaboration of all authors. Conceptualization, J.-K.L.; methodology, J.-K.L.; software, O.J.; validation, O.J.; formal analysis, O.J.; investigation, J.-K.L.; resources, J.-K.L.; data curation, O.J.; writing—original draft preparation, J.-K.L. and O.J.; writing—review and editing, J.-K.L.; visualization, O.J.; supervision, J.-K.L.; project administration, J.-K.L.; funding acquisition, J.-K.L. All authors have read and agreed to the published version of the manuscript.

Funding

The present work was supported by the Korea Evaluation Institute of Industrial Technology (KEIT) grant, funded by the South Korea government (MOTIE, RS-2022-00144322), and the Regional Innovation System & Education (RISE) program through the Chungbuk RISE, funded by the Ministry of Education (MOT) and the Chungcheongbuk-do, Republic of Korea (2025-RISE-11-013-03).

Data Availability Statement

The original contributions presented in this study are included in the article. Further inquiries can be directed to the corresponding author.

Conflicts of Interest

The authors declare no conflicts of interest.

References

  1. Ebbesen, T.W.; Lezec, H.J.; Ghaemi, H.F.; Thio, T.; Wolff, P.A. Extraordinary optical transmission through sub-wavelength hole arrays. Nature 1998, 391, 667–669. [Google Scholar] [CrossRef] [Scilit]
  2. Ghaemi, H.F.; Thio, T.; Grupp, D.E.; Ebbesen, T.W.; Lezec, H.J. Surface plasmons enhance optical transmission through subwavelength holes. Phys. Rev. B 1998, 58, 6779–6782. [Google Scholar] [CrossRef] [Scilit]
  3. Martín-Moreno, L.; García-Vidal, F.J.; Lezec, H.J.; Pellerin, K.M.; Thio, T.; Pendry, J.B.; Ebbesen, T.W. Theory of Extraordinary Optical Transmission through Subwavelength Hole Arrays. Phys. Rev. Lett. 2001, 86, 1114–1117. [Google Scholar] [CrossRef] [Scilit] [PubMed]
  4. Genet, C.; Ebbesen, T.W. Light in tiny holes. Nature 2007, 445, 39–46. [Google Scholar] [CrossRef] [Scilit] [PubMed]
  5. García de Abajo, F.J. Colloquium: Light scattering by particle and hole arrays. Rev. Mod. Phys. 2007, 79, 1267–1290. [Google Scholar] [CrossRef] [Scilit]
  6. Maleki, M.J.; Soroosh, M.; Akbarizadeh, G. Design and simulation of compact subwavelength electro-optic switch based on graphene surface plasmon polaritons. Q. J. Optoelectron. 2023, 6, 41–50. [Google Scholar]
  7. Cheng, Y.; Cao, W.; He, X. Hybrid Plasmonic Waveguides with Tunable ENZ Phenomenon Supported by 3D Dirac Semimetals. Laser Photonics Rev. 2024, 18, 2400167. [Google Scholar] [CrossRef] [Scilit]
  8. Porto, J.A.; García-Vidal, F.J.; Pendry, J.B. Transmission Resonances on Metallic Gratings with Very Narrow Slits. Phys. Rev. Lett. 1999, 83, 2845–2848. [Google Scholar] [CrossRef] [Scilit]
  9. Degiron, A.; Ebbesen, T.W. The role of localized surface plasmon modes in the enhanced transmission of periodic subwavelength apertures. J. Opt. A 2005, 7, S90–S96. [Google Scholar] [CrossRef] [Scilit]
  10. Bravo-Abad, J.; Degiron, A.; Przybilla, F.; Genet, C.; García-Vidal, F.J.; Martín-Moreno, L.; Ebbesen, T.W. How light emerges from an illuminated array of subwavelength holes. Nat. Phys. 2006, 2, 120–123. [Google Scholar] [CrossRef] [Scilit]
  11. Lalanne, P.; Hugonin, J.P.; Rodier, J.C. Theory of Surface Plasmon Generation at Nanoslit Apertures. Phys. Rev. Lett. 2005, 95, 263902. [Google Scholar] [CrossRef] [Scilit]
  12. Gallinet, B.; Martin, O.J.F. Influence of Electromagnetic Interactions on the Line Shape of Plasmonic Fano Resonances. ACS Nano 2011, 5, 8999–9008. [Google Scholar] [CrossRef] [Scilit]
  13. Takakura, Y. Optical Resonance in a Narrow Slit in a Thick Metallic Screen. Phys. Rev. Lett. 2001, 86, 5601–5603. [Google Scholar] [CrossRef] [Scilit] [PubMed]
  14. Bravo-Abad, J.; Martín-Moreno, L.; García-Vidal, F.J. Transmission Properties of a Single Metallic Slit: From the Subwavelength Regime to the Geometrical-Optics Limit. Phys. Rev. E 2004, 69, 026601. [Google Scholar] [CrossRef] [Scilit] [PubMed]
  15. Hibbins, A.P.; Lockyear, M.J.; Sambles, J.R. The Resonant Electromagnetic Fields of an Array of Metallic Slits Acting as Fabry–Pérot Cavities. J. Appl. Phys. 2006, 99, 124903. [Google Scholar] [CrossRef] [Scilit]
  16. Wang, Y.; Kong, Y.; Xu, S.; Li, J.; Liu, G. Simulated Studies of Polarization-Selectivity Multi-Band Perfect Absorber Based on Elliptical Metamaterial with Filtering and Sensing Effect. Photonics 2023, 10, 295. [Google Scholar] [CrossRef] [Scilit]
  17. Yun, H.S.; Liu, X.; Salihoglu, H.; Li, Z.; Shen, S. Electromechanically reconfigurable plasmonic nanoslits for efficient nano-opto-electro-mechanical tuning. Mater. Today Phys. 2024, 42, 101369. [Google Scholar] [CrossRef] [Scilit]
  18. Shen, Q.; Jin, W.; Yang, G.; Rodriguez, A.W.; Mikkelsen, M.H. Active Control of Multiple, Simultaneous Nonlinear Optical Processes in Plasmonic Nanogap Cavities. ACS Photonics 2020, 7, 901–907. [Google Scholar] [CrossRef] [Scilit]
  19. Janneh, M. Surface enhanced infrared absorption spectroscopy using plasmonic nanostructures: Alternative ultrasensitive on-chip biosensor technique. Results Opt. 2022, 6, 100201. [Google Scholar] [CrossRef] [Scilit]
  20. Huck, C.; Vogt, J.; Sendner, M.; Hengstler, D.; Neubrech, F.; Pucci, A. Plasmonic Enhancement of Infrared Vibrational Signals: Nanoslits versus Nanorods. ACS Photonics 2015, 2, 1489–1497. [Google Scholar] [CrossRef] [Scilit]
  21. Lospinoso, D.; Colombelli, A.; Rella, R.; Manera, M.G. Rational Design and Optimization of Plasmonic Nanohole Arrays for Sensing Applications. Chemosensors 2024, 12, 157. [Google Scholar] [CrossRef] [Scilit]
  22. Shokova, M.A.; Bochenkov, V.E. Impact of Optical Cavity on Refractive Index Sensitivity of Gold Nanohole Arrays. Biosensors 2023, 13, 1038. [Google Scholar] [CrossRef] [Scilit] [PubMed]
  23. Levene, M.J.; Korlach, J.; Turner, S.W.; Foquet, M.; Craighead, H.G.; Webb, W.W. Zero-Mode Waveguides for Single-Molecule Analysis at High Concentrations. Science 2003, 299, 682–686. [Google Scholar] [CrossRef] [Scilit] [PubMed]
  24. Yang, S.; Klughammer, N.; Barth, A.; Tanenbaum, M.E.; Dekker, C. Zero-Mode Waveguide Nanowells for Single-Molecule Detection in Living Cells. ACS Nano 2023, 17, 20179–20193. [Google Scholar] [CrossRef] [Scilit] [PubMed]
  25. Ghaffari, A.; Kashani, S.; Do, K.; Weninger, K.; Riehn, R. A nanophotonic interferometer. Nanotechnology 2023, 34, 185201. [Google Scholar] [CrossRef] [Scilit]
  26. Yokogawa, S.; Burgos, S.P.; Atwater, H.A. Plasmonic Color Filters for CMOS Image Sensor Applications. Nano Lett. 2012, 12, 4349–4354. [Google Scholar] [CrossRef] [Scilit]
  27. Shaukat, A.; Noble, F.; Arif, K.M. Nanostructured Color Filters: A Review of Recent Developments. Nanomaterials 2020, 10, 1554. [Google Scholar] [CrossRef] [Scilit]
  28. Luo, Y.; Liu, J.; Yang, H.; Liu, H.; Zeng, G.; Huang, B. Enhanced Circular Dichroism by F-Type Chiral Metal Nanostructures. Photonics 2023, 10, 1028. [Google Scholar] [CrossRef] [Scilit]
  29. Li, C.; Zhou, Y.-S.; Wang, H.-Y.; Wang, F.-H. Wavelength Squeeze of Surface Plasmon Polariton in a Subwavelength Metal Slit. J. Opt. Soc. Am. B 2010, 27, 59–64. [Google Scholar] [CrossRef] [Scilit]
  30. Catrysse, P.B.; Shin, H.; Fan, S. Propagating modes in subwavelength cylindrical holes. J. Vac. Sci. Technol. B 2005, 23, 2675–2678. [Google Scholar] [CrossRef] [Scilit]
  31. Shin, H.; Catrysse, P.B.; Fan, S. Effect of the plasmonic dispersion relation on the transmission properties of subwavelength cylindrical holes. Phys. Rev. B 2005, 72, 085436. [Google Scholar] [CrossRef] [Scilit]
  32. Ruan, Z.; Qiu, M. Enhanced Transmission through Periodic Arrays of Subwavelength Holes: The Role of Localized Waveguide Resonances. Phys. Rev. Lett. 2006, 96, 233901. [Google Scholar] [CrossRef] [Scilit]
  33. Palik, E.D. Handbook of Optical Constants of Solids; Academic Press: San Diego, CA, USA, 1985. [Google Scholar]
  34. Zhang, Y.; Liu, M.; Jena, D.; Khalsa, G. Tight-binding band structure of- and-phase Ga2O3 and Al2O3. J. Appl. Phys. 2022, 131, 175702. [Google Scholar] [CrossRef] [Scilit]
  35. Namjioshi, K.V.; Mitra, S.S. Infrared absorption due to multiphonon process in the transparent regime of solids. Phys. Rev. B 1974, 9, 815–822. [Google Scholar] [CrossRef] [Scilit]
  36. Gramotnev, D.K.; Bozhevolnyi, S.I. Plasmonics beyond the diffraction limit. Nat. Photonics 2010, 4, 83–91. [Google Scholar] [CrossRef] [Scilit]
  37. Haffner, C.; Chelladurai, D.; Fedoryshyn, Y.; Josten, A.; Baeuerle, B.; Heni, W.; Watanabe, T.; Cui, T.; Cheng, B.; Saha, S.; et al. Low-loss plasmon-assisted electro-optic modulator. Nature 2018, 556, 483–486. [Google Scholar] [CrossRef] [Scilit] [PubMed]
  38. Khurgin, J.B. How to deal with the loss in plasmonics and metamaterials. Nat. Nanotechnol. 2015, 10, 2–6. [Google Scholar] [CrossRef] [Scilit] [PubMed]
  39. Crampton, K.T.; Joly, A.G.; El-Khoury, P.Z. Uncovering surface plasmon optical resonances in nanohole arrays through interferometric photoemission electron microscopy. Appl. Phys. Lett. 2022, 120, 081102. [Google Scholar] [CrossRef] [Scilit]
  40. Zhang, X.; Liu, H.; Zhong, Y. Microscopic analysis of surface Bloch modes on periodically perforated metallic surfaces and their relation to extraordinary optical transmission. Phys. Rev. B 2014, 89, 195431. [Google Scholar] [CrossRef] [Scilit]
Figure 1. Schematics of the FDTD simulation setup for a dielectric-material-embedded Al NHAs (left: 2D xy-view, right: 3D xyz-view) formed on a glass substrate. Here, P, E , H , and k denote a period, electric-field, magnetic-field, and propagation direction of light, respectively.
Photonics 13 00235 g001
Figure 2. Spectral dependence of the complex refractive indices of Al2O3, MoO3, and TiO2 from 0.4 to 2.0 μm: (a) real part and (b) imaginary part of the complex refractive index.
Photonics 13 00235 g002
Figure 3. Representative xz-plane E-field intensity distributions (r = 300 nm, P = 1.0 μm) and the variations in compressed wavelength and the transmittance/reflectance of NHAs filled with (ac) Al2O3, (df) MoO3, and (gi) TiO2 as functions of period and hole radius.
Photonics 13 00235 g003
Figure 4. The variations (a) in compressed wavelength (λp) and (b) the sensitivity parameter ( d λ p / d r ) as a function of nanohole radius for the NHAs filled with Al2O3, MoO3, and TiO2 at a pitch of 1.2 μm.
Photonics 13 00235 g004
Figure 5. (ae) E-field amplitude distribution in xz-plane and (fj) E-field intensity distribution in xy-plane for a nano-hole radius of 300, 350, 400, 450, and 500 nm filled with Al2O3.
Photonics 13 00235 g005
Figure 6. (ae) E-field amplitude distribution in xz-plane and (fj) E-field intensity distribution in xy-plane for a nano-hole radius of 300 nm, 350 nm, 400 nm, 450 nm, and 500 nm filled with MoO3.
Photonics 13 00235 g006
Figure 7. (ae) E-field amplitude distribution in xz-plane and (fj) E-field intensity distribution in xy-plane for a nano-hole radius of 300 nm, 350 nm, 400 nm, 450 nm, and 500 nm filled with TiO2.
Photonics 13 00235 g007
Figure 8. Transmittance (solid lines), reflectance (dotted lines), and absorptance (dashed lines) of the NHAs as a function of hole radius for different dielectric fillings: (a) Al2O3, (b) MoO3, and (c) TiO2, under incident illumination at a wavelength of 1.5 µm.
Photonics 13 00235 g008
Figure 9. (a) 2D schematic of an Al NHA filled with a dielectric material, indicating different radial positions within the nano-hole (r, 2r/3, r/3). Variation in the compressed wavelength of the NHAs filled with (b) Al2O3, (c) MoO3, and (d) TiO2 at r, 2r/3, and r/3 positions as a function of nano-hole size.
Photonics 13 00235 g009
Disclaimer/Publisher’s Note: The statements, opinions and data contained in all publications are solely those of the individual author(s) and contributor(s) and not of MDPI and/or the editor(s). MDPI and/or the editor(s) disclaim responsibility for any injury to people or property resulting from any ideas, methods, instructions or products referred to in the content.