Article

Numerical Analysis of an Ultra-Sensitive Optical Fiber for Hemoglobin Concentration Detection

by
Aryan Abbaszadeh
1,
Somayeh Makouei
1,*,
Samrand Rash-Ahmadi
2 and
Sebelan Danishvar
3,*
1
Faculty of Electrical and Computer Engineering, University of Tabriz, Tabriz 51664, Iran
2
Department of Mechanical Engineering, Faculty of Engineering, Urmia University, Urmia 15311-57561, Iran
3
College of Engineering, Design and Physical Sciences, Brunel University London, Uxbridge UB8 3PH, UK
*
Authors to whom correspondence should be addressed.
Photonics 2025, 12(9), 933; https://doi.org/10.3390/photonics12090933
Submission received: 4 August 2025 / Revised: 13 September 2025 / Accepted: 17 September 2025 / Published: 19 September 2025
(This article belongs to the Special Issue Optical Fiber Sensors: Design and Application)

Abstract

Hemoglobin is a vital protein in the human body, and its deficiency leads to anemia. This condition reduces oxygen levels in red blood cells, which can be life-threatening. This paper presents the design of a novel optical fiber (OF) sensor for label-free detection of hemoglobin concentration. The sensor features concentric layers of gold and silica arranged sequentially. Finite element method (FEM) simulations were used to analyze its performance. The results indicate that for a refractive index (RI) range of 1.34 to 1.41, the sensor achieves a wavelength sensitivity (Sw) of up to 38,000 nm/RIU and an amplitude sensitivity (SA) of 11,280 RIU−1. The sensor exhibits a resolution of 1.85 × 10⁻⁶ RIU and a figure of merit (FOM) of 736.56 RIU−1. Its simple construction and high sensitivity make it a promising candidate for hemoglobin detection applications.

1. Introduction

Hemoglobin is a protein found in red blood cells that plays a crucial role in transporting oxygen throughout the body. A deficiency in hemoglobin leads to anemia, a condition that can cause symptoms such as dizziness, fatigue, shortness of breath, and an increased risk of heart complications [1]. This disease is hazardous, especially for pregnant women, leading to abortion, infection, and mortality [2]. The 2019 reports from the World Health Organization indicate that the global prevalence of this disease was 39.8% among children aged 6 to 59 months and 29.9% among women of reproductive age. Table 1 presents the normal hemoglobin levels for adult men, adult women, and neonates [3]. High or low levels of this protein indicate a disease that must be treated on time.
So far, the sensors used to detect hemoglobin are divided into two categories: electronic and optical [4,5,6,7]. Although electrical sensors may have high sensitivity, they still have a series of disadvantages, including a short life span, high manufacturing cost, need for an identifier, and lack of immunity to electromagnetic waves [8,9,10]. On the other hand, optical sensors do not have these disadvantages and can measure the substance in real-time [11,12]. In optical sensors, the optical property of the analyte, such as the RI, is used to detect an analyte in a solution [12,13]. A spectroscopy system based on absorption, reflection, fluorescent, and Raman spectroscopy is usually used in the structure of these sensors [14]. Optical sensors can be based on label-free or labeled. However, the label-free types are more reliable and precise than the labeled ones. This reliability depends on the application and sensor design more broadly. These sensors have a small size and a high sensitivity, which makes them give precise results [15]. They can be used for real-time monitoring, which may be useful for clinical experiments. The surface plasmon resonance (SPR) method is a famous label-free biosensor that has been used for detecting biomaterials [16,17,18]. However, any factor in the surrounding environment that can change the RI of the sensing area creates interference [19]. In [20], they have proposed a gold (Au) and aluminum (Al)-based SPR sensor with a sensitivity of 0.62°/dgL−1 for detecting hemoglobin concentration in human blood. In [21], they used a gold layer with carbon nanotubes to increase the sensitivity of the proposed SPR biosensor. In [22], they proposed an SPR sensor that gives high sensitivity and quality factors of 1782 nm/RIU and 21,214, respectively. In reference [22], the authors attempted to enhance the sensitivity of SPR biosensors by incorporating graphene and metal dichalcogenides to improve the detection of hemoglobin concentrations. However, these sensors are bulky and expensive.
Photonic crystal fibers (PCFs) are another type of OF. The observed sensor performance is attributed to the devices’ distinctive structure, which facilitates high sensitivity [23,24] and low confinement loss [25].
These types of fibers are used to detect several physical properties, such as gases [23], liquids [26], pressure [27], and temperature [28]. In [29], a D-shaped photonic crystal fiber (PCF) was introduced, achieving a sensitivity, FOM, and resolution of 14,933.34 nm/RIU, 401.05 RIU−1, and 6.69 × 10⁻⁶, respectively. They have used molybdenum disulfide, graphene, and gold materials in their simulations. In this article, the size of some of the holes has been chosen to be larger, which may make the manufacturing process more difficult. In [30], the authors proposed a novel PCF-based SPR biosensor utilizing gold (Au) and titanium dioxide materials, achieving a high sensitivity of 25,000 nm/RIU. In this paper, smaller holes are also used in the center of the fiber, which leads to complexity in the manufacturing process. The amounts of the FOM and resolution were 502 RIU−1 and 4 × 10⁻⁶. In [31], a dual-core PCF-based SPR sensor is reported with a sensitivity, FOM, and resolution of 28,000 nm/RIU, 2800 RIU−1 and 5 × 10⁻⁶. In this article, large and small holes with irregular structures are used, which makes the construction process longer and more complicated. A new PCF structure has been proposed to detect hemoglobin, which gives the highest sensitivity of 34,800 nm/RIU within the analyte detection range of 1.34–1.41 RIU [32]. The amounts of the FOM and resolution were 229 RIU−1 and 2.86 × 10⁻⁶. Recently, they have combined the SPR method with PCFs for biosensor applications. These sensors are classified into five types, including metal coating [33], internal nanowire filling [34], D-shaped [35], and external coating [36]. In [37], they have proposed a D-shaped PCF sensor based on SPR with a square shape to detect analytes with large RIs. They can achieve a maximum sensitivity of 60,000 nm/RIU. In [38], they have designed a surface plasmon U-channel PCF for hemoglobin sensing. This sensor gives a sensitivity and FOM of 7500 nm/RIU and 634.1 RIU−1, respectively. In [39], they have proposed a Dual-Core Bilateral Surface Optimized PCF SPR Biosensor for Early Detection of Six Distinct Cancer Cells, which gives the highest sensitivity of 5714.28 nm/RIU. In [40], they have reported an MXene-coated concave-shaped microchannel PCF SPR biosensor for the detection of HIV and sickle cell anaemia with an optimized sensitivity of 10,571.43 nm/RIU. However, all these techniques require a time-consuming process, and placing an analyte in this sensor is also difficult. Although several hemoglobin-detecting sensors have been reported, a device capable of high-accuracy measurement is still required. To achieve this goal, the sensor that is designed must have both high Sw and high SA, which we tried to achieve in the proposed structure.
In this paper, a new design of an OF refractometric sensor with a simple structure is proposed for detecting hemoglobin concentrations. The idea behind our sensor design is derived from one-dimensional PCF sensors, where layers are placed side by side in an alternating fashion [41]. In the proposed architecture, every layer is positioned around the neighboring layer at a specified interlayer distance. The sensor designed in this article operates based on changes in the refractive index of hemoglobin. Studies conducted on the refractive index of blood hemoglobin show that these changes in the concentration of the substance occur mostly between 1.34 and 1.41 in the range of visible/near-infrared wavelengths [42,43]. The sensor we have proposed has both SW and high SA. In the following sections, the geometry of the fiber and the materials used in this structure are introduced. Next, the equations required to evaluate the sensor’s performance in the simulations are presented. Finally, the simulation results are reported in the concluding section. The results demonstrate that our proposed sensor can detect hemoglobin with the highest sensitivity, paving the way for the development of a compact and cost-effective device.

2. The Geometry of the Proposed OF

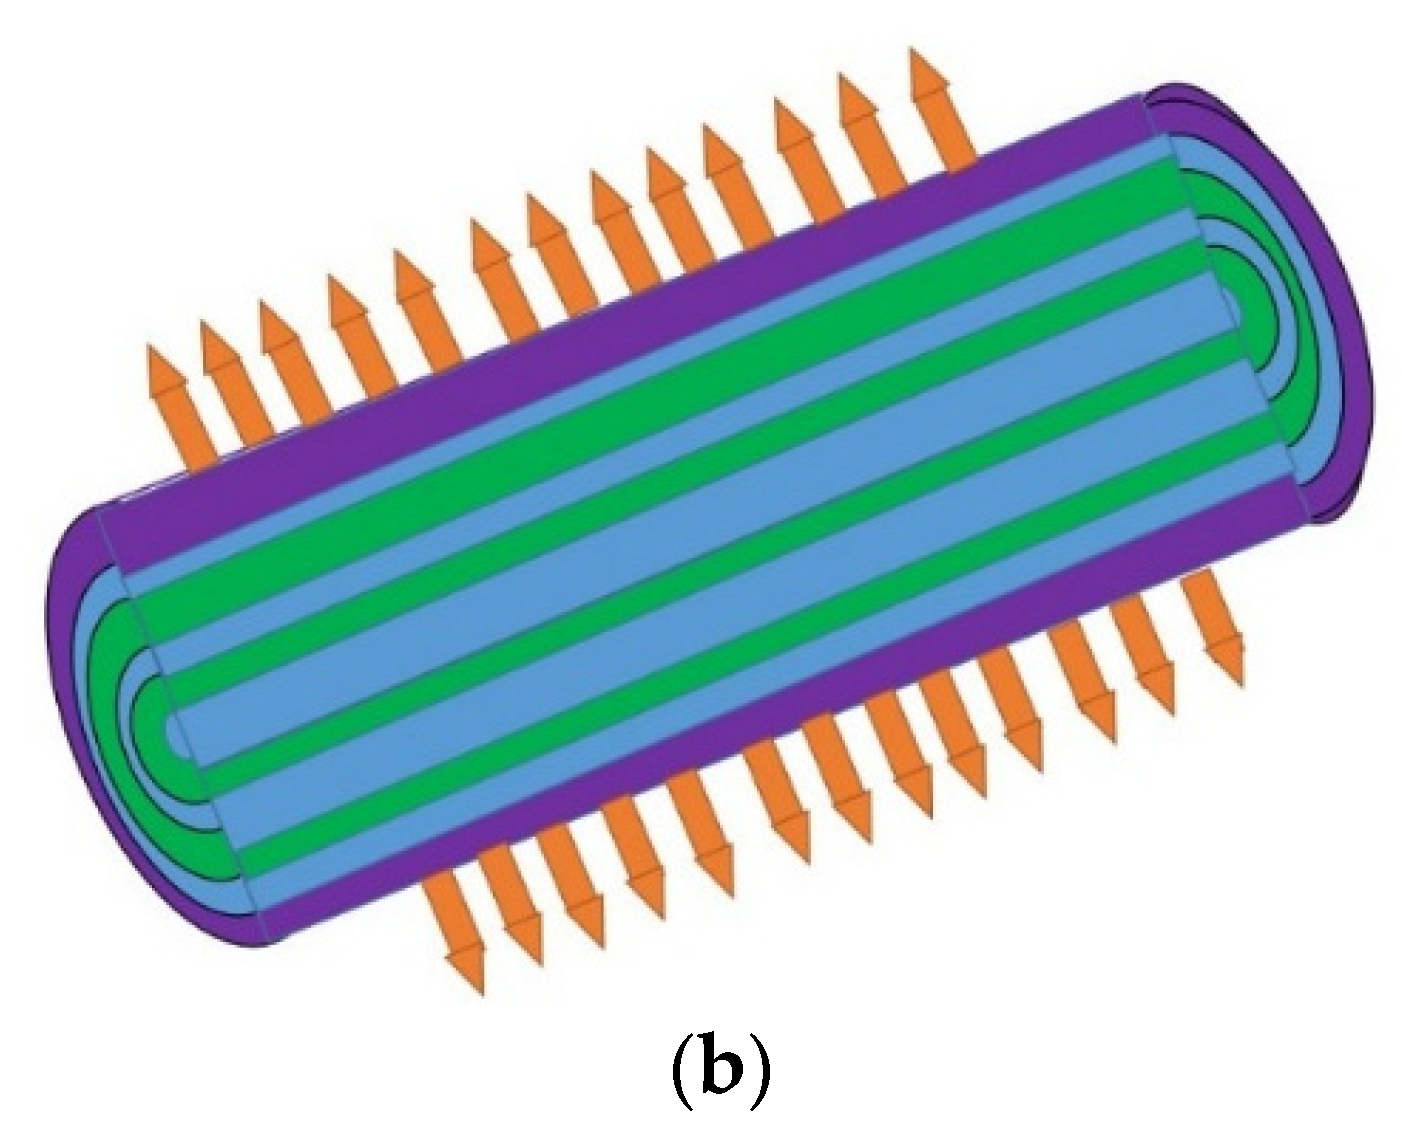
Figure 1a shows the 2D view of the proposed OF. The structure is made of two circular gold layers, three circular silica layers, and an analyte region in the external area of the OF. Two layers of silica are represented by d, d2, and d4 parameters. Two layers of gold are represented by the parameters d1 and d3. The size of the area where the analyte is placed is indicated by parameter d. Table 2 shows the value of these parameters. The idea of designing the proposed structure originates from the one-dimensional design of optical crystal structures [41]. Figure 1b shows a 3D view of the reported OF. The orange region is a biological element that can be attached to an external region of the OF. The greater the amount of the substance to be measured, the more it interacts with the sensor. Therefore, it will cause a change in the refractive index (RI) and ultimately affect the evanescent field. In the following, the RI of the materials used in this structure is introduced.

Refractive Index of the Layers and Meshing of the Proposed Structure

In this section, we have introduced how to calculate the refractive index of layers. Finally, we have introduced how to mesh the structure in the COMSOL version 5.3a software package.
The RI of silica can be obtained from Sellmeier’s expression by the following equation [44]:
n 2 λ = 1 + A 1 λ 2 λ 2 B 1 + A 2 λ 2 λ 2 B 2 + A 3 λ 2 λ 2 B 3
The A and B parameters are considered as the Sellmeier coefficients up to the third order, and their values are A1 = 0.69616300, A2 = 0.407942600, A3 = 0.897479400, B1 = 0.00467914826, B2 = 0.0135120631, and B3 = 97.9340025 [44].
The relative permittivity of plasmonic materials in the visible and near-infrared region is obtained from the Drude model as follows [45]:
ε G o l d = ε ω d 2 ω ( ω + j γ d )
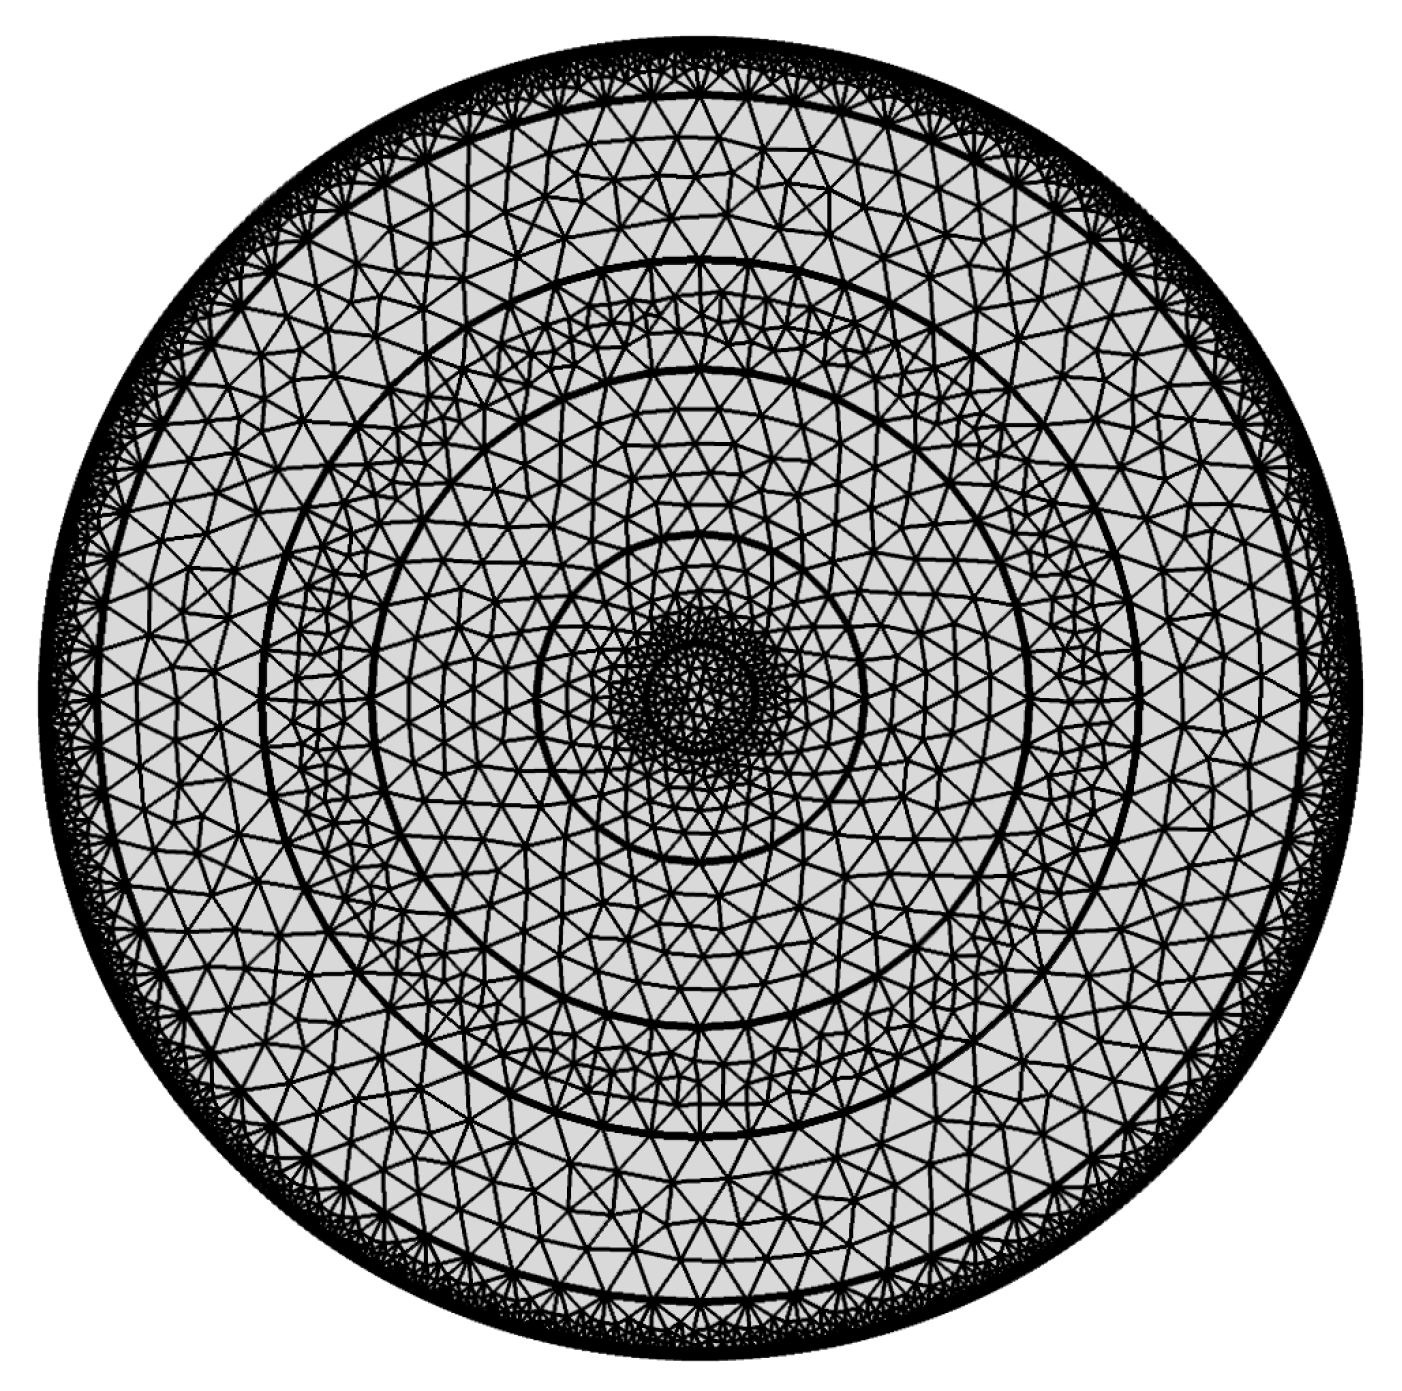
Here εGold is the relative permittivity of the gold, ε = 5.9673 is the high frequency permittivity, ωd = 2113.6 × 2π THz is the plasma frequency, and γd = 15.92 × 2π THz denotes decaying frequency. The ω parameter is angular frequency and is equal to 2πc/λ. The c parameter is the constant light velocity and is equal to 3 × 10⁸ m/s [45]. A perfectly matched Layer (PML) is added to the outer layer of the fiber to decrease the losses. The size of PML is 0.6 µm. Figure 2 shows how the meshing is distributed along the OF. The number of degrees of freedom is 43,006. The free triangular type is used for meshing operations. The three-operation meshing scheme is implemented for the gold, silica, and analyte regions. Table 3 provides a summary of the critical parameter values employed in the proposed structure meshing.

3. Mathematical Equations

This section presents the set of equations that must be solved to analyze each sensor. The confinement loss is a key parameter that can be determined from the imaginary part of the effective refractive index. This parameter shows how photons are distributed around the OF. It can be calculated from the following equation [46]:
α λ d B c m = 8.686 × 2 π λ × I m n e f f × 10 4
where Im(neff) is the imaginary part of the RI, and λ is the wavelength with the unit of this parameter is µm. When the value of this parameter is low, it shows that the light is trapped in the desired location and, therefore, the sensor sensitivity is increased. A further parameter, SW, is determined via the following equation [47]:
S W n m R I U = λ n
where Δλ is the resonance wavelength shift, and Δn is the difference between two adjacent RIs. As we can see, to increase the value of this parameter, the difference between the two wavelength peaks should be increased. Another parameter is the SA, which utilizes the confinement losses of the resonance wavelengths. It can be obtained from the following equation [48]:
S A 1 R I U = 1 α ( λ , n ) δ α ( λ , n ) Δ n
where α(λ,n) is the confinement loss at the wavelength of λ, and δα(λ,n) specifies the confinement loss difference between two adjacent RIs. In this study, the materials with RIs of 1.34 to 1.41 are investigated.
The performance of the sensor is quantified by the figure of merit (FOM) parameter. This parameter can be computed by dividing the SW by the Full Width at half maximum (FWHM) parameter as follows:
F O M R I U 1 = S w F W H M
To reach a high value of FOM, the amount of sensitivity should be high, and the amount of FWHM should be low. Resolution is another important parameter that shows how accurately a sensor detects. This parameter can be obtained using the following equation:
R R I U = n   ×   λ m i n λ p e a k
where Δλmin is considered as detector resolution, and it is usually equal to 0.1 nm [49]. This parameter indicates the sensor’s ability to measure analytes with high accuracy. In the next section, the simulation results of the proposed fiber are reviewed.

4. Simulation Results

This section is divided into four parts. First, the distribution of the electric field and the loss spectrum are analyzed for various refractive indices ranging from 1.34 to 1.41. In the next section, the effect of changing the diameters of different materials used in the fiber is examined. Following that, the influence of varying hemoglobin concentrations on sensor performance is evaluated. Finally, the practical implementation of the sensor is discussed.

4.1. Evaluation of the Overall Performance of the Sensor

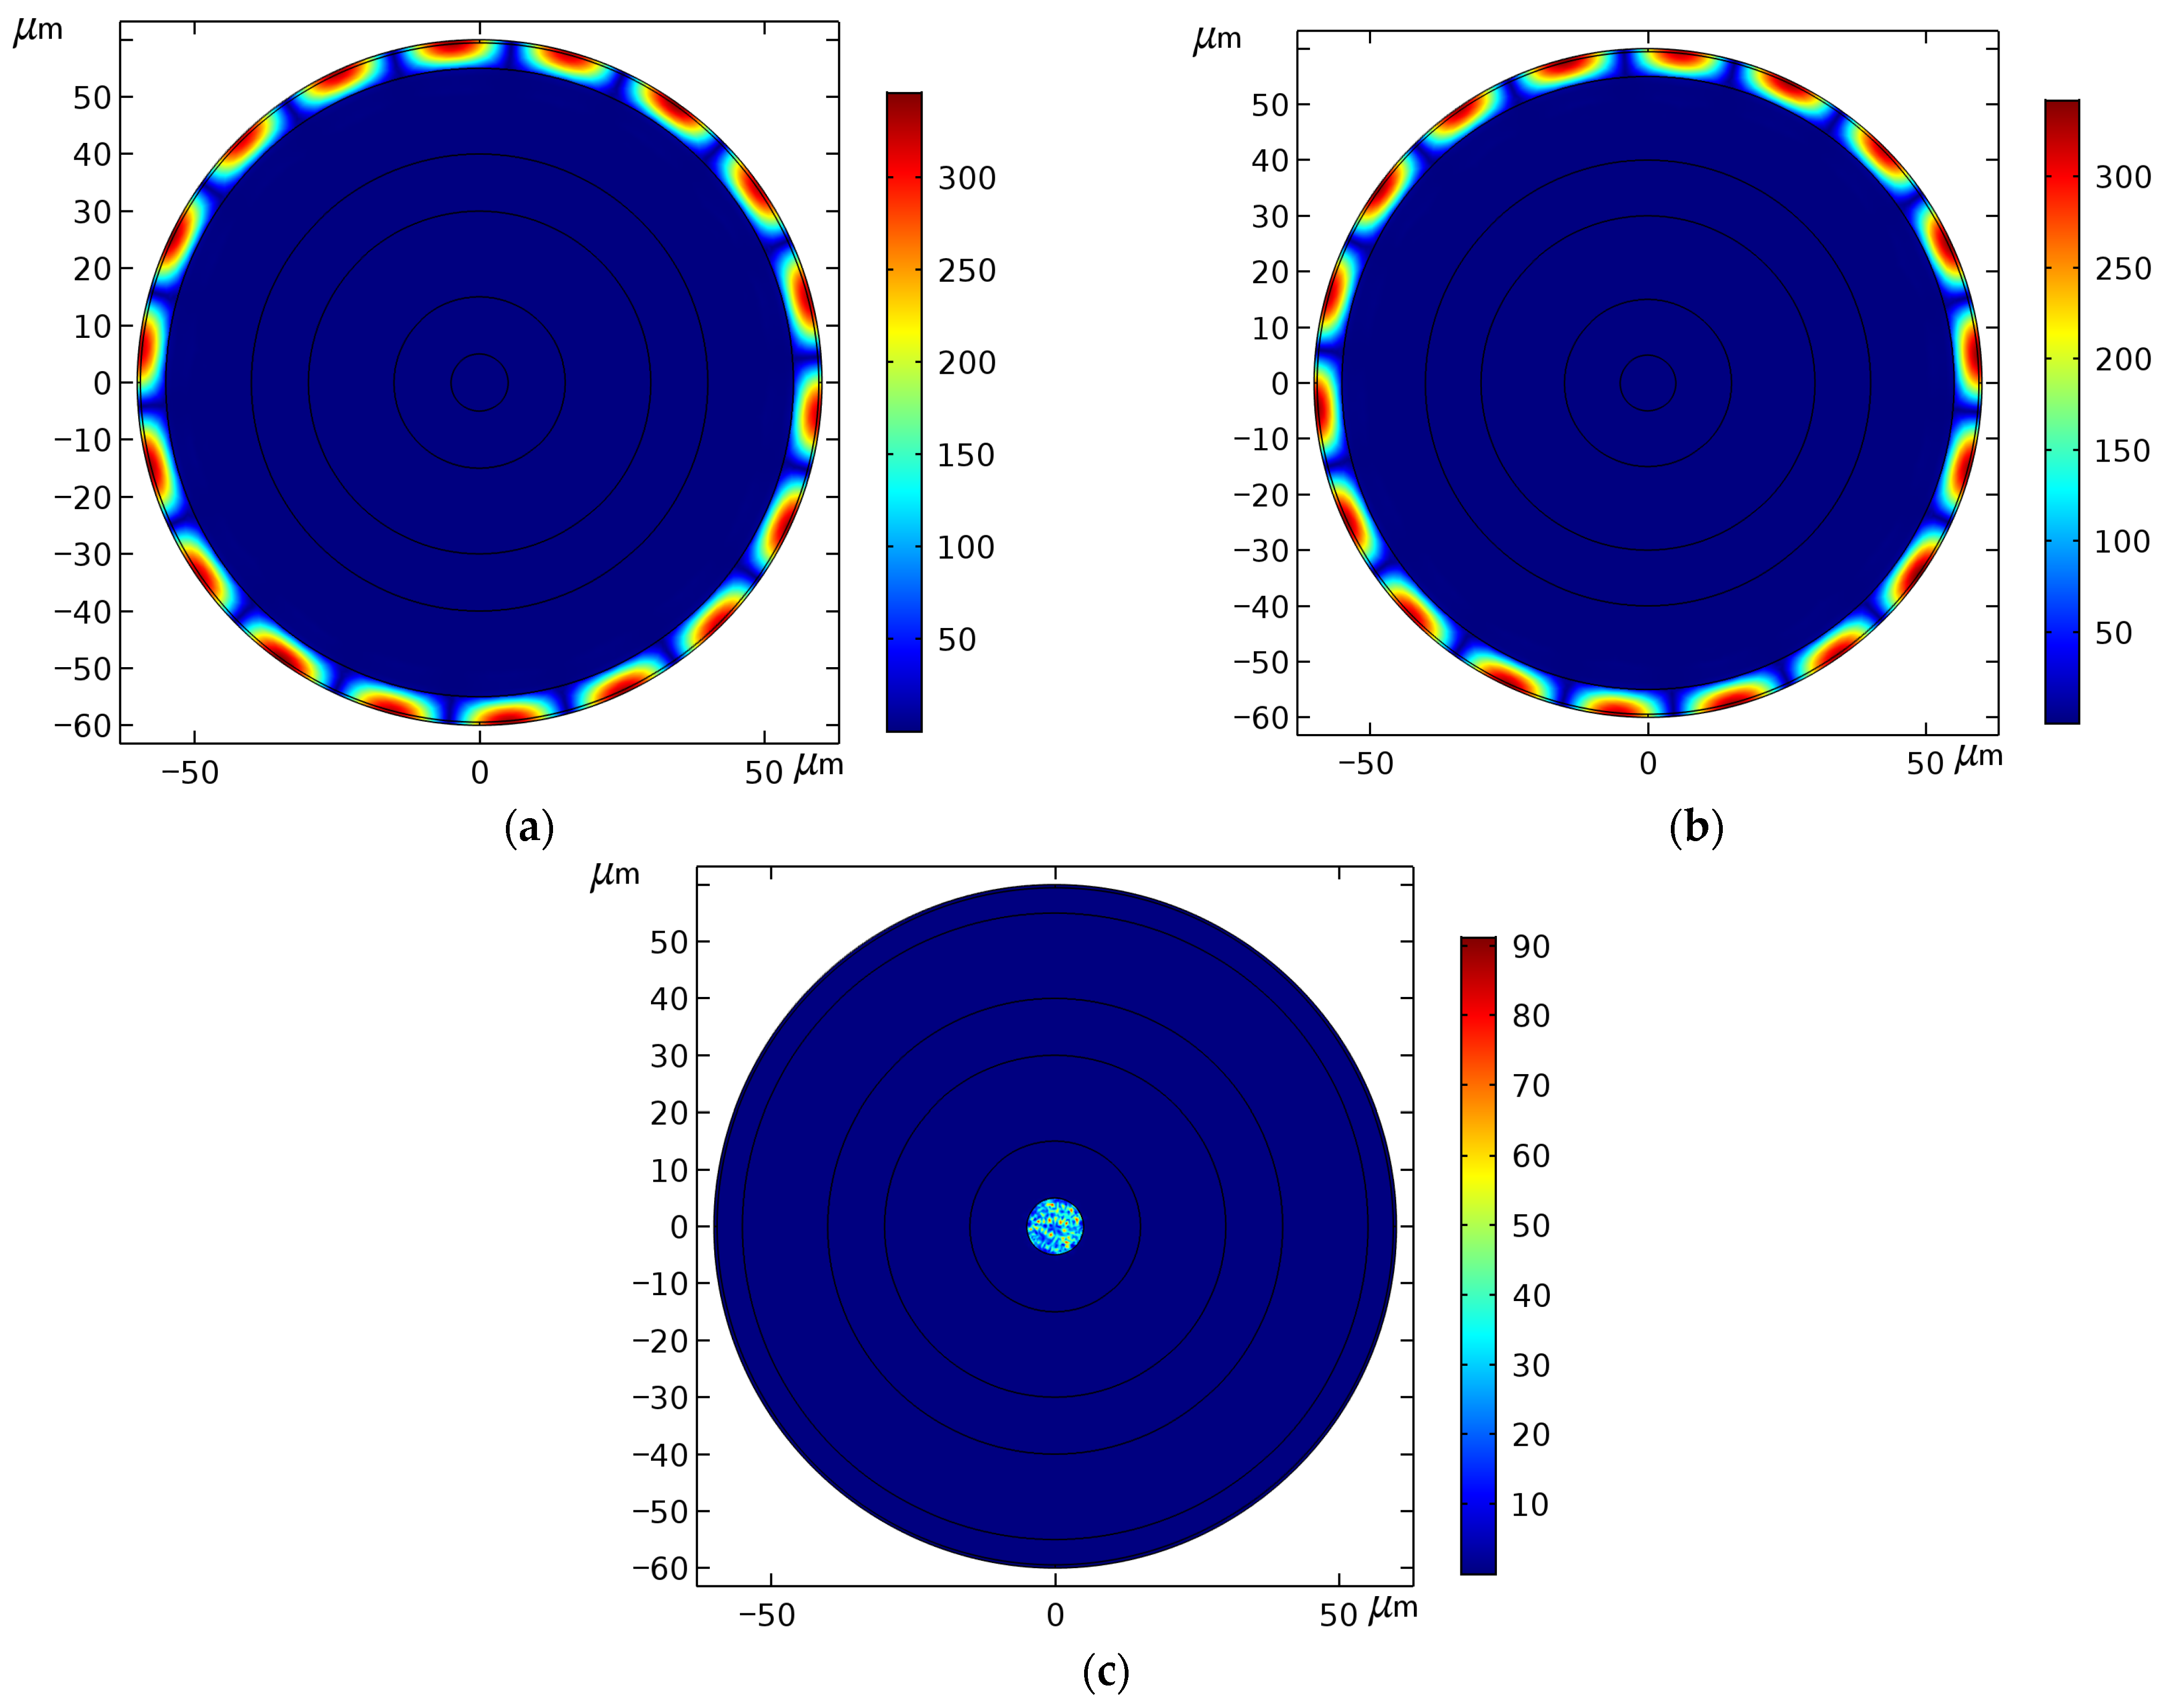
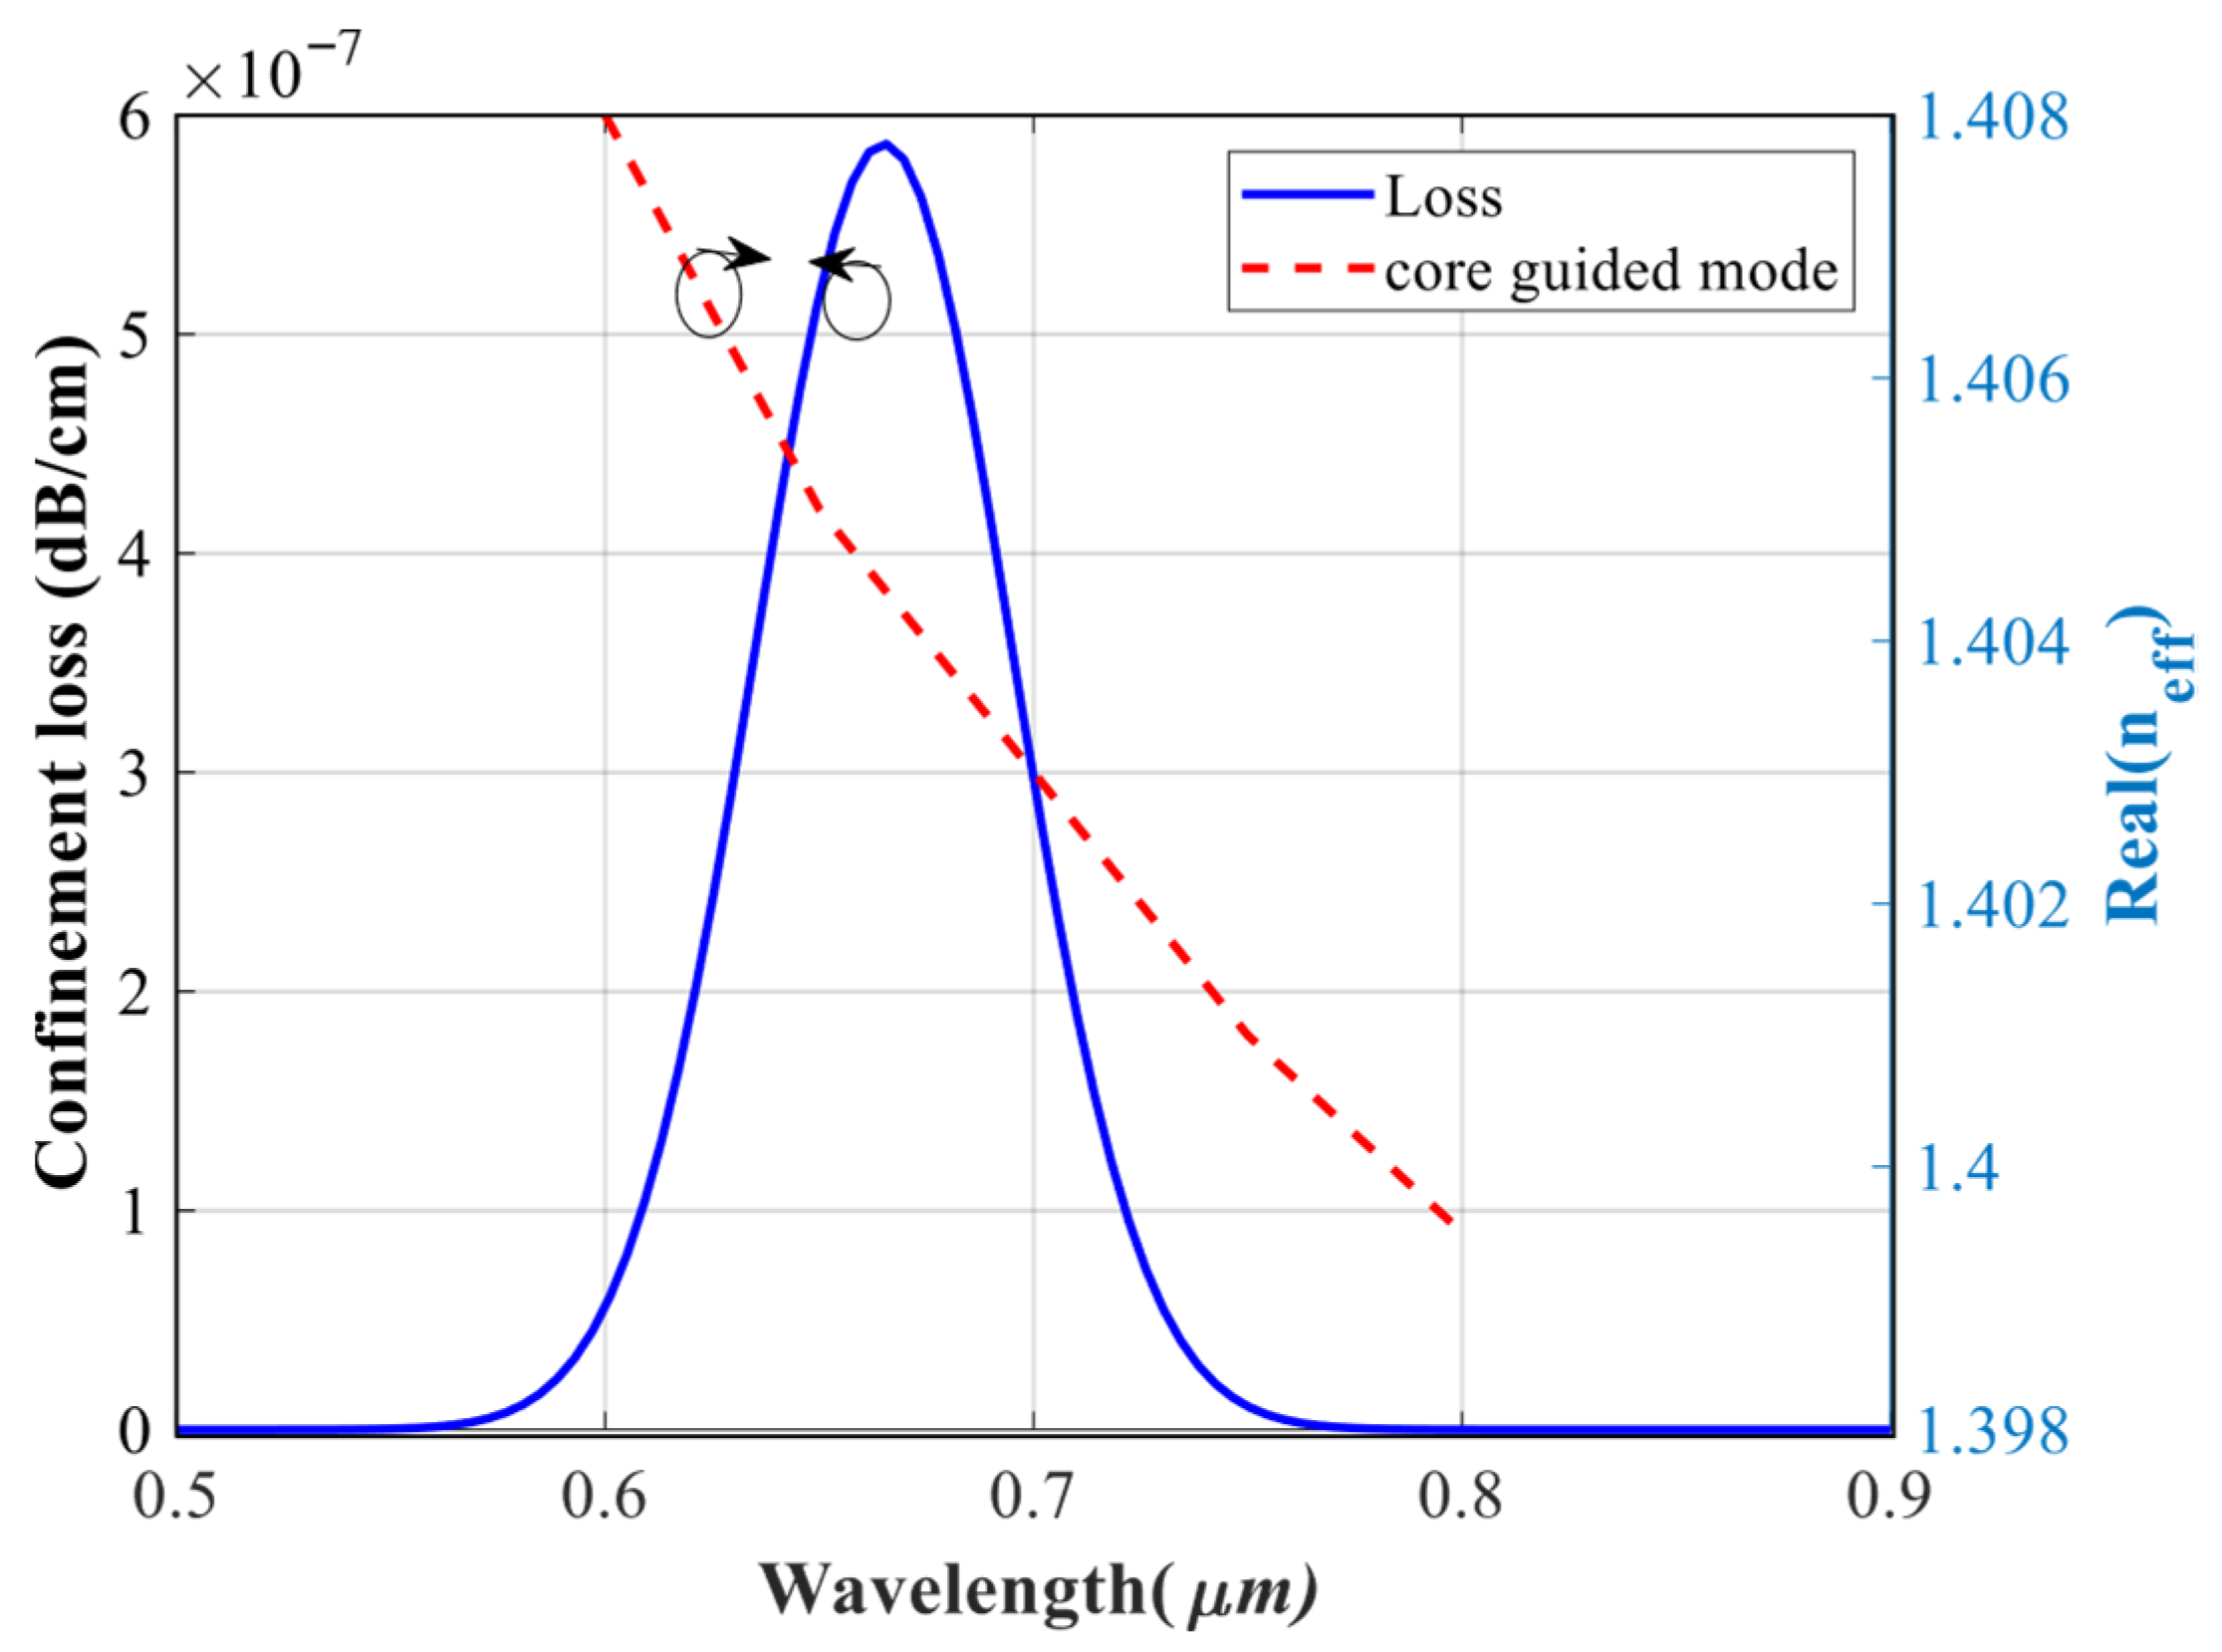
The simulation results have been obtained using COMSOL, which is based on the FEM. This method is a reliable technique to solve physics problems [50]. An analyte with a RI of 1.34 is filled into the external region of the OF. Figure 3 shows the distribution of electric fields for the plasmonic and core modes. As can be seen, the electric field is trapped in the external region of the OF. The obtained modes are based on the surface resonance phenomenon created by the presence of the gold layer. Figure 4 shows the loss spectra of the plasmonic mode for a RI of 1.34, and the real effective indices of the core mode for the proposed OF. The peak loss curve shows that the energy transfer for an analyte with a refractive index of 1.34 reaches a maximum at a wavelength of 665 nm and then decreases. Next, materials with different refractive indices ranging from 1.34 to 1.40 are placed in this area, and the resulting wavelength shifts are calculated. A graph illustrating these shifts will also be generated.
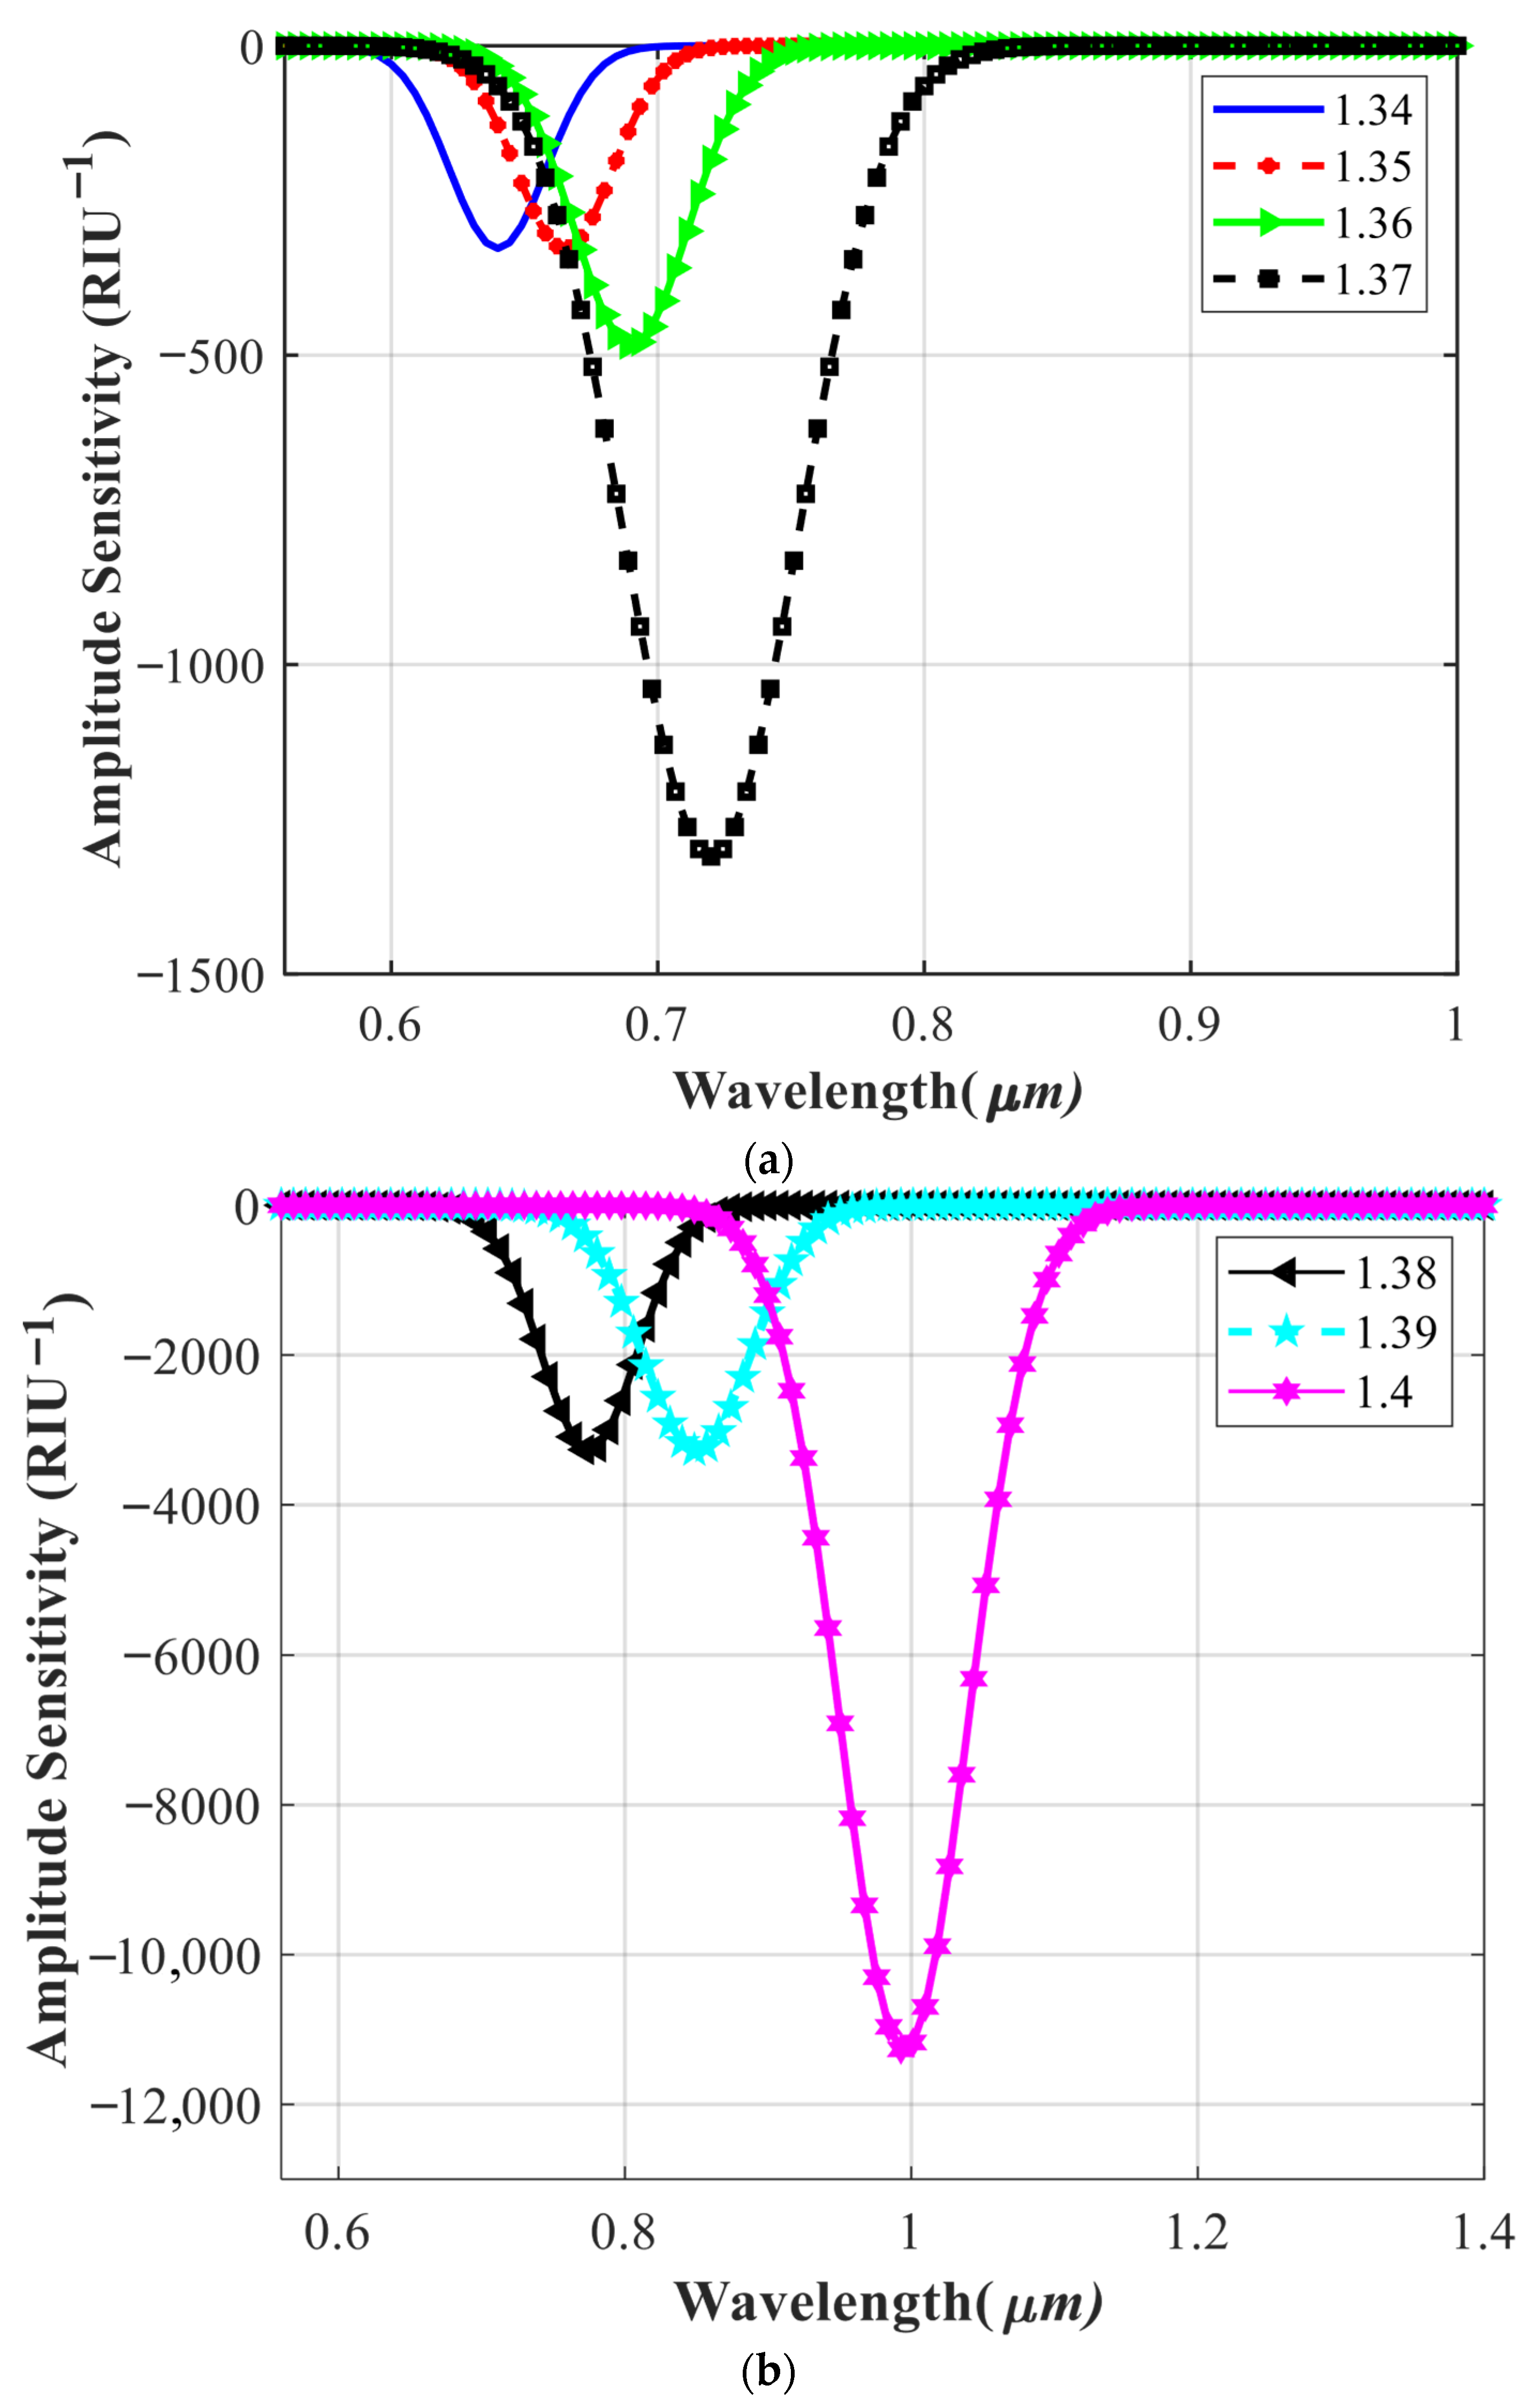
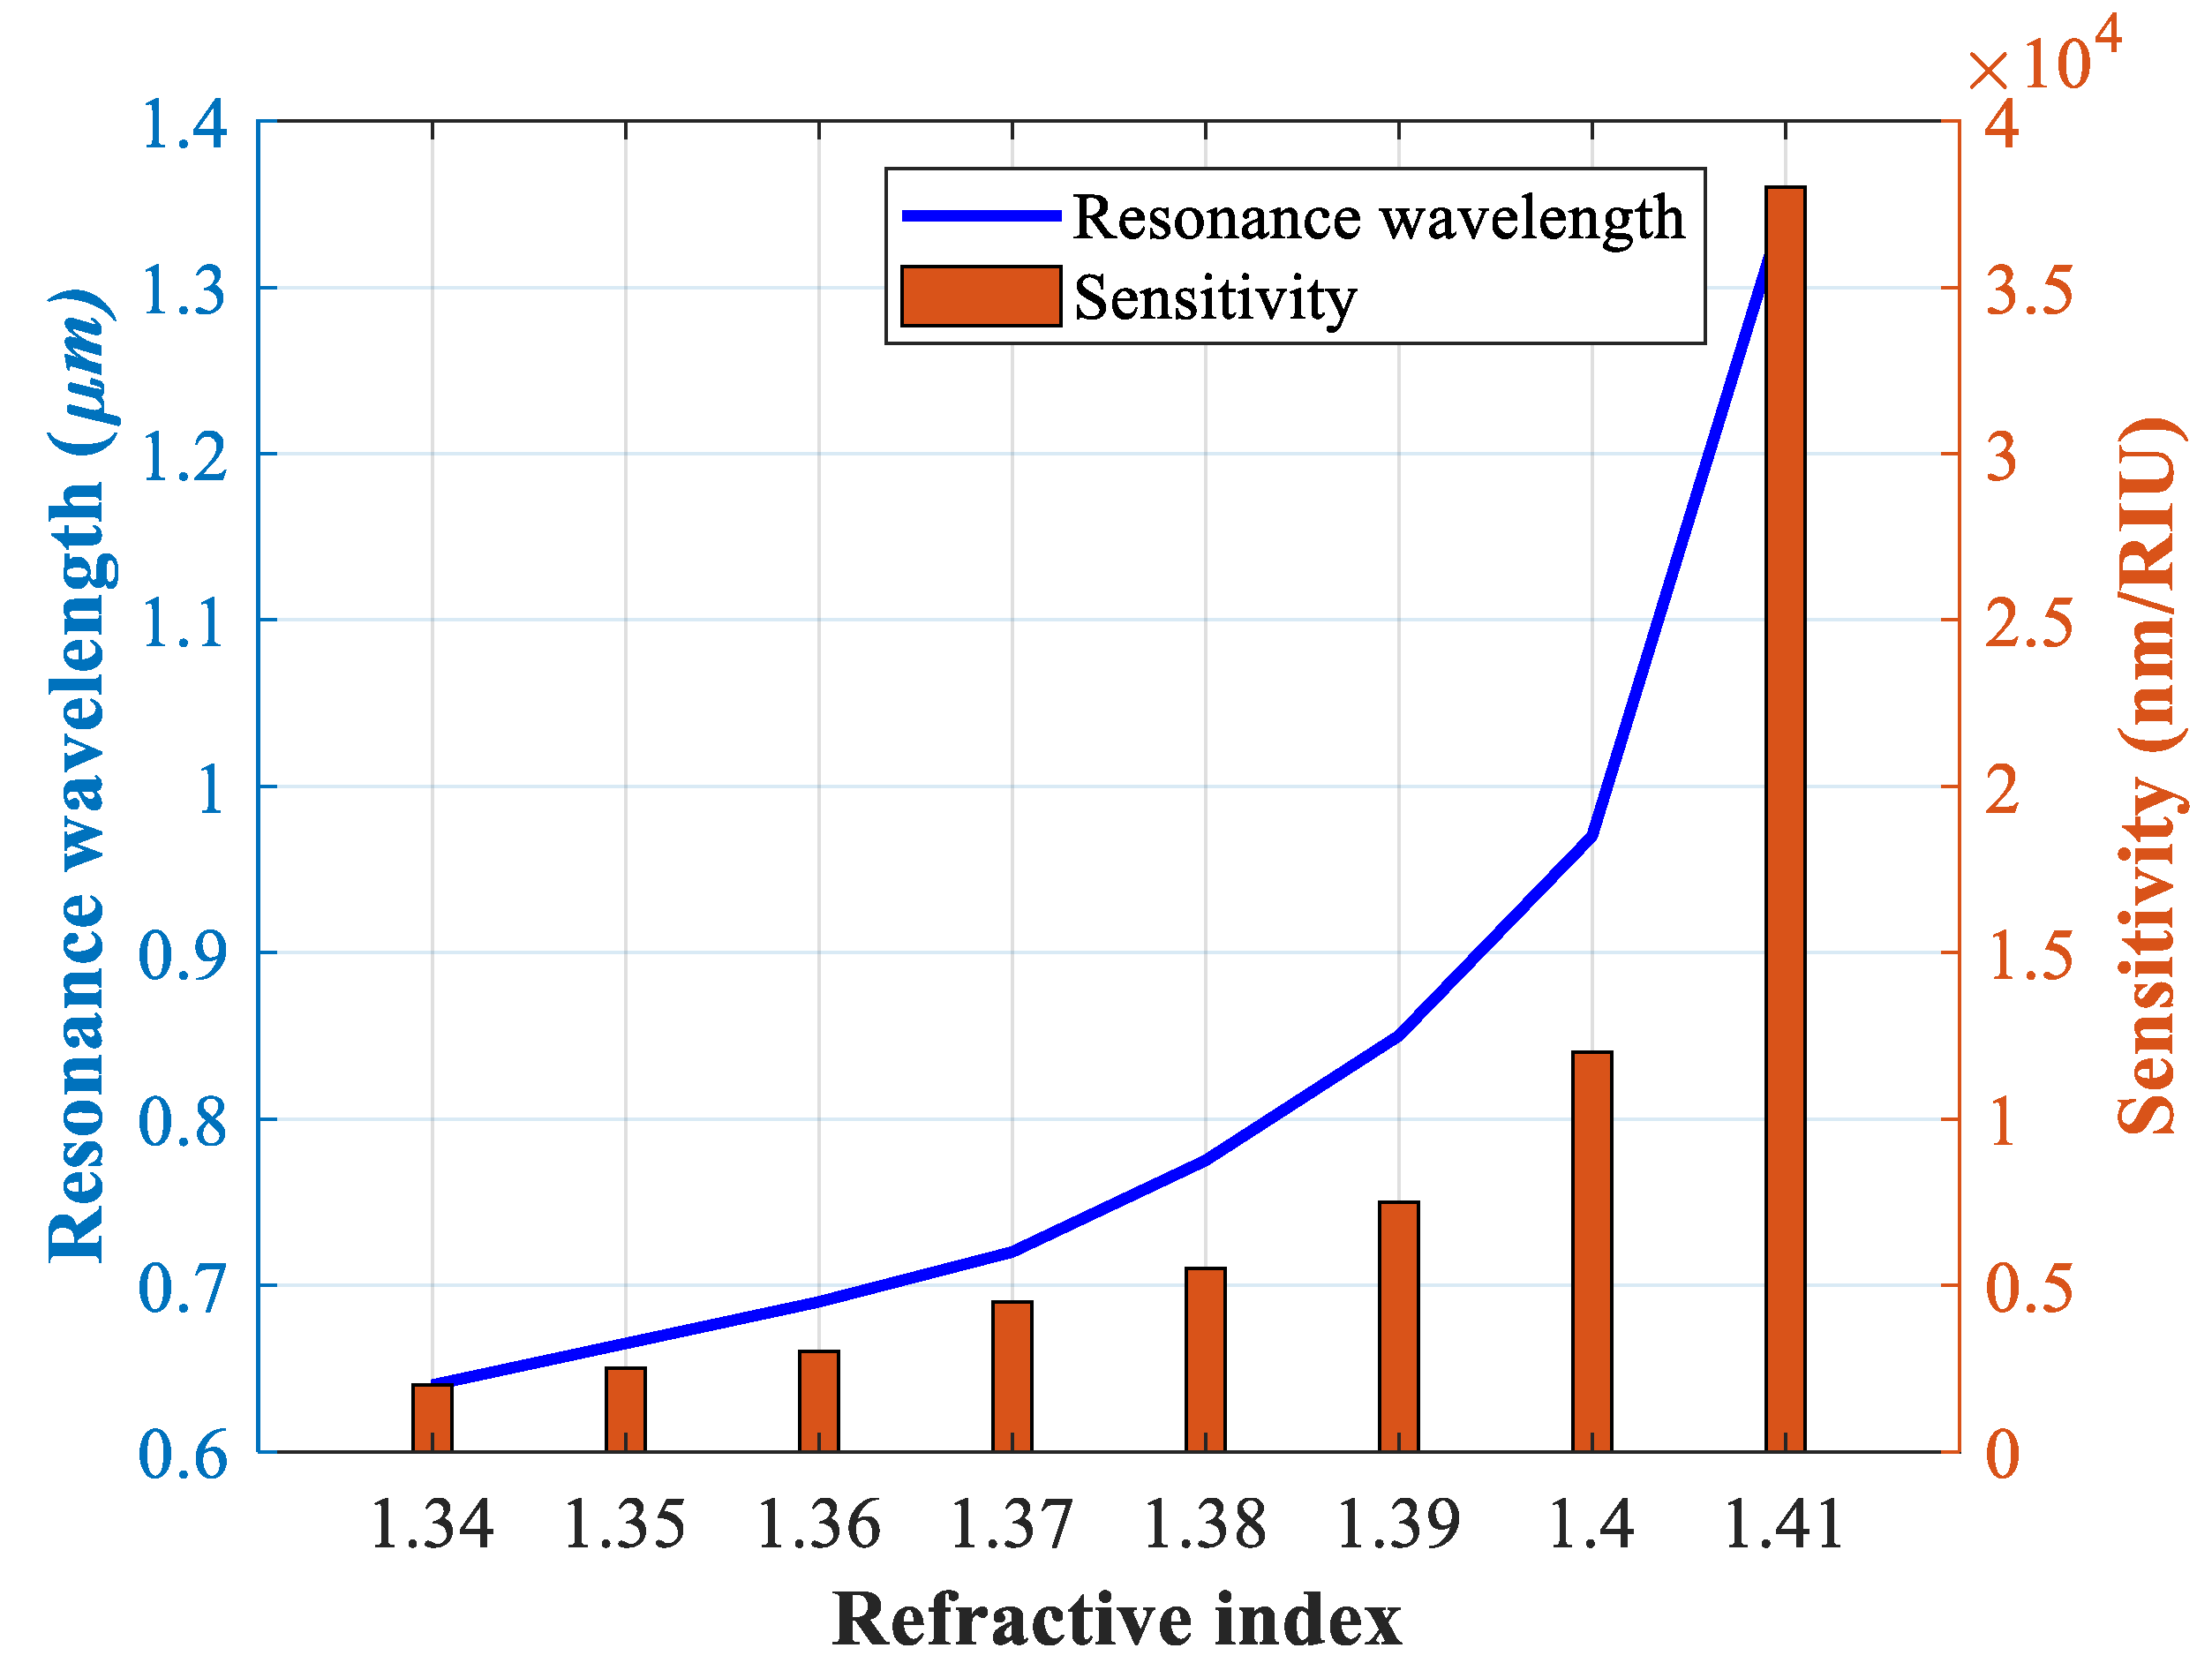
Figure 5a,b illustrate the variation in the loss spectra for refractive indices (RIs) ranging from 1.34 to 1.41, which can be used for detecting biological materials within these ranges. The data indicate that increasing the refractive index leads to a red shift, i.e., a shift to longer wavelengths. The wavelength peaks shift from 640 nm to 1350 nm as shown in Figure 5. The Sw is calculated from Equation (4) for the corresponding wavelength. From these observations, as is clear from Table 2, the minimum sensitivity is 2000 nm/RIU, and the maximum sensitivity is 38,000 nm/RIU. Figure 6 shows the values of SA for the RIs of 1.34 to 1.41. The maximum SA value also occurs at an RI of 1.41, which is equal to 11,280 RIU−1. As mentioned earlier, to have a higher FOM value, the Sw parameter should be increased, and the FWHM value should be lower. As shown in Figure 5a, the overall width of the FWHM is relatively small. It can be seen from Table 4 that the highest value of the FOM parameter is 736.56 RIU−1 for a RI of 1.41. Furthermore, the value of the resolution is 1.85 × 10⁻⁶ RIU. Consequently, the sensor demonstrates sensitivity to refractive-index changes at the level of 10−6 in RI. Figure 7 shows the values of the resonance wavelength and Sw. As can be seen, increasing the RI results in an increase in the values of both parameters.

4.2. Investigating the Effect of Parameter Variations on Sensor Performance

During sensor construction, a portion of the diameter-related parameters may vary; therefore, it is prudent to assess parameter-size variations for each designed sensor. In examining the parameters in each step, it is assumed that only one parameter has changed, and the size of the other parameters is constant. Figure 8a shows the impact of the d parameter on the confinement loss, wavelength peak, and the FWHM. The changes in this parameter produce only a limited impact on the sensor’s performance. By increasing this parameter, the wavelength spectrum has changed from 640 nm to 642 nm, and the FWHM value has also increased slightly. Figure 8b shows the effect of changes in parameter d1 on the performance of the sensor. As can be seen, this parameter has a greater impact on the performance of the sensor than the previous parameter. The value of the peak wavelength for a diameter of 9 µm is 620 µm, and for a diameter of 11 µm is 652 µm. Also, when the value of the parameter increases, the FWHM increases. Figure 8c shows the impact of variation in parameter d2 on the performance of the sensor. Across diameters 14–16 µm, the peak wavelength increases linearly from 635 nm to 645 nm, with a step of 5 nm per 1 µm in diameter. Overall, this parameter also has a low effect on the performance of the sensor. Figure 8d shows the impact of variation in parameter d3 on the performance of the sensor. The values of the peak wavelength for the diameters of 9, 10, and 11 µm are 625, 640, and 655 nm, respectively. By increasing this diameter, the FWHM is also increased. Figure 8e shows the impact of variation in parameter d4 on the performance of the sensor. The values of the peak wavelength for the diameters of 9, 10, and 11 µm are 625, 640, and 655 nm, respectively. By increasing this diameter, the FWHM is also increased. Figure 8f exhibits the effect of variation in parameter d5 on the performance of the sensor. The values of the peak wavelength for the diameters of 4, 5, and 7 µm are 638, 640, and 642 nm, respectively. Variations in this parameter have little effect on the value of FWHM. As we can see from Figure 8, the changes in all parameters have a negligible effect on the value of confinement losses. In addition, it is clear that most of the changes in gold parameters have affected the performance of the sensor. Therefore, when making the sensor, we should pay more attention to the changes in gold parameters. In general, as I can see from the graphs, the sensor has shown good stability to changes in the size of the layers.

4.3. Investigating the Performance of the Sensor in Detecting Different Concentrations of Hemoglobin

As mentioned in the introduction section, the percentage of hemoglobin concentration plays a significant role in the diagnosis of various diseases, especially anemia. Furthermore, it is necessary to have a small, low-cost device that can detect the percentage of this protein in the blood in a short time. This protein can be extracted directly from thawed human blood cells without adding any chemical materials. The process of isolating the hemoglobin from human cells can be performed by the steps mentioned in [51].
In order to calculate the RI of a hemoglobin solution for increasing the concentration of this solution, we use the following equation:
n H b λ , C H b = n H 2 O λ β λ C H b + 1
Here, nHb is the RI of hemoglobin, CHb is the concentration of hemoglobin (g/dL), and β is the refractive increment. The value of the β parameter can be 0.00199 dL/g for the wavelength range from 500 to 1100 nm [33]. In this equation, the absorption term (λ) has been omitted for simplicity. The RI of water-dependent wavelength can be calculated from the following equation in the range of the visible and near-infrared region:
n H 2 O λ = 1.3199 + 6878 λ 2 + 1.321 × 10 9 λ 4 + 1.11 × 10 14 λ 6
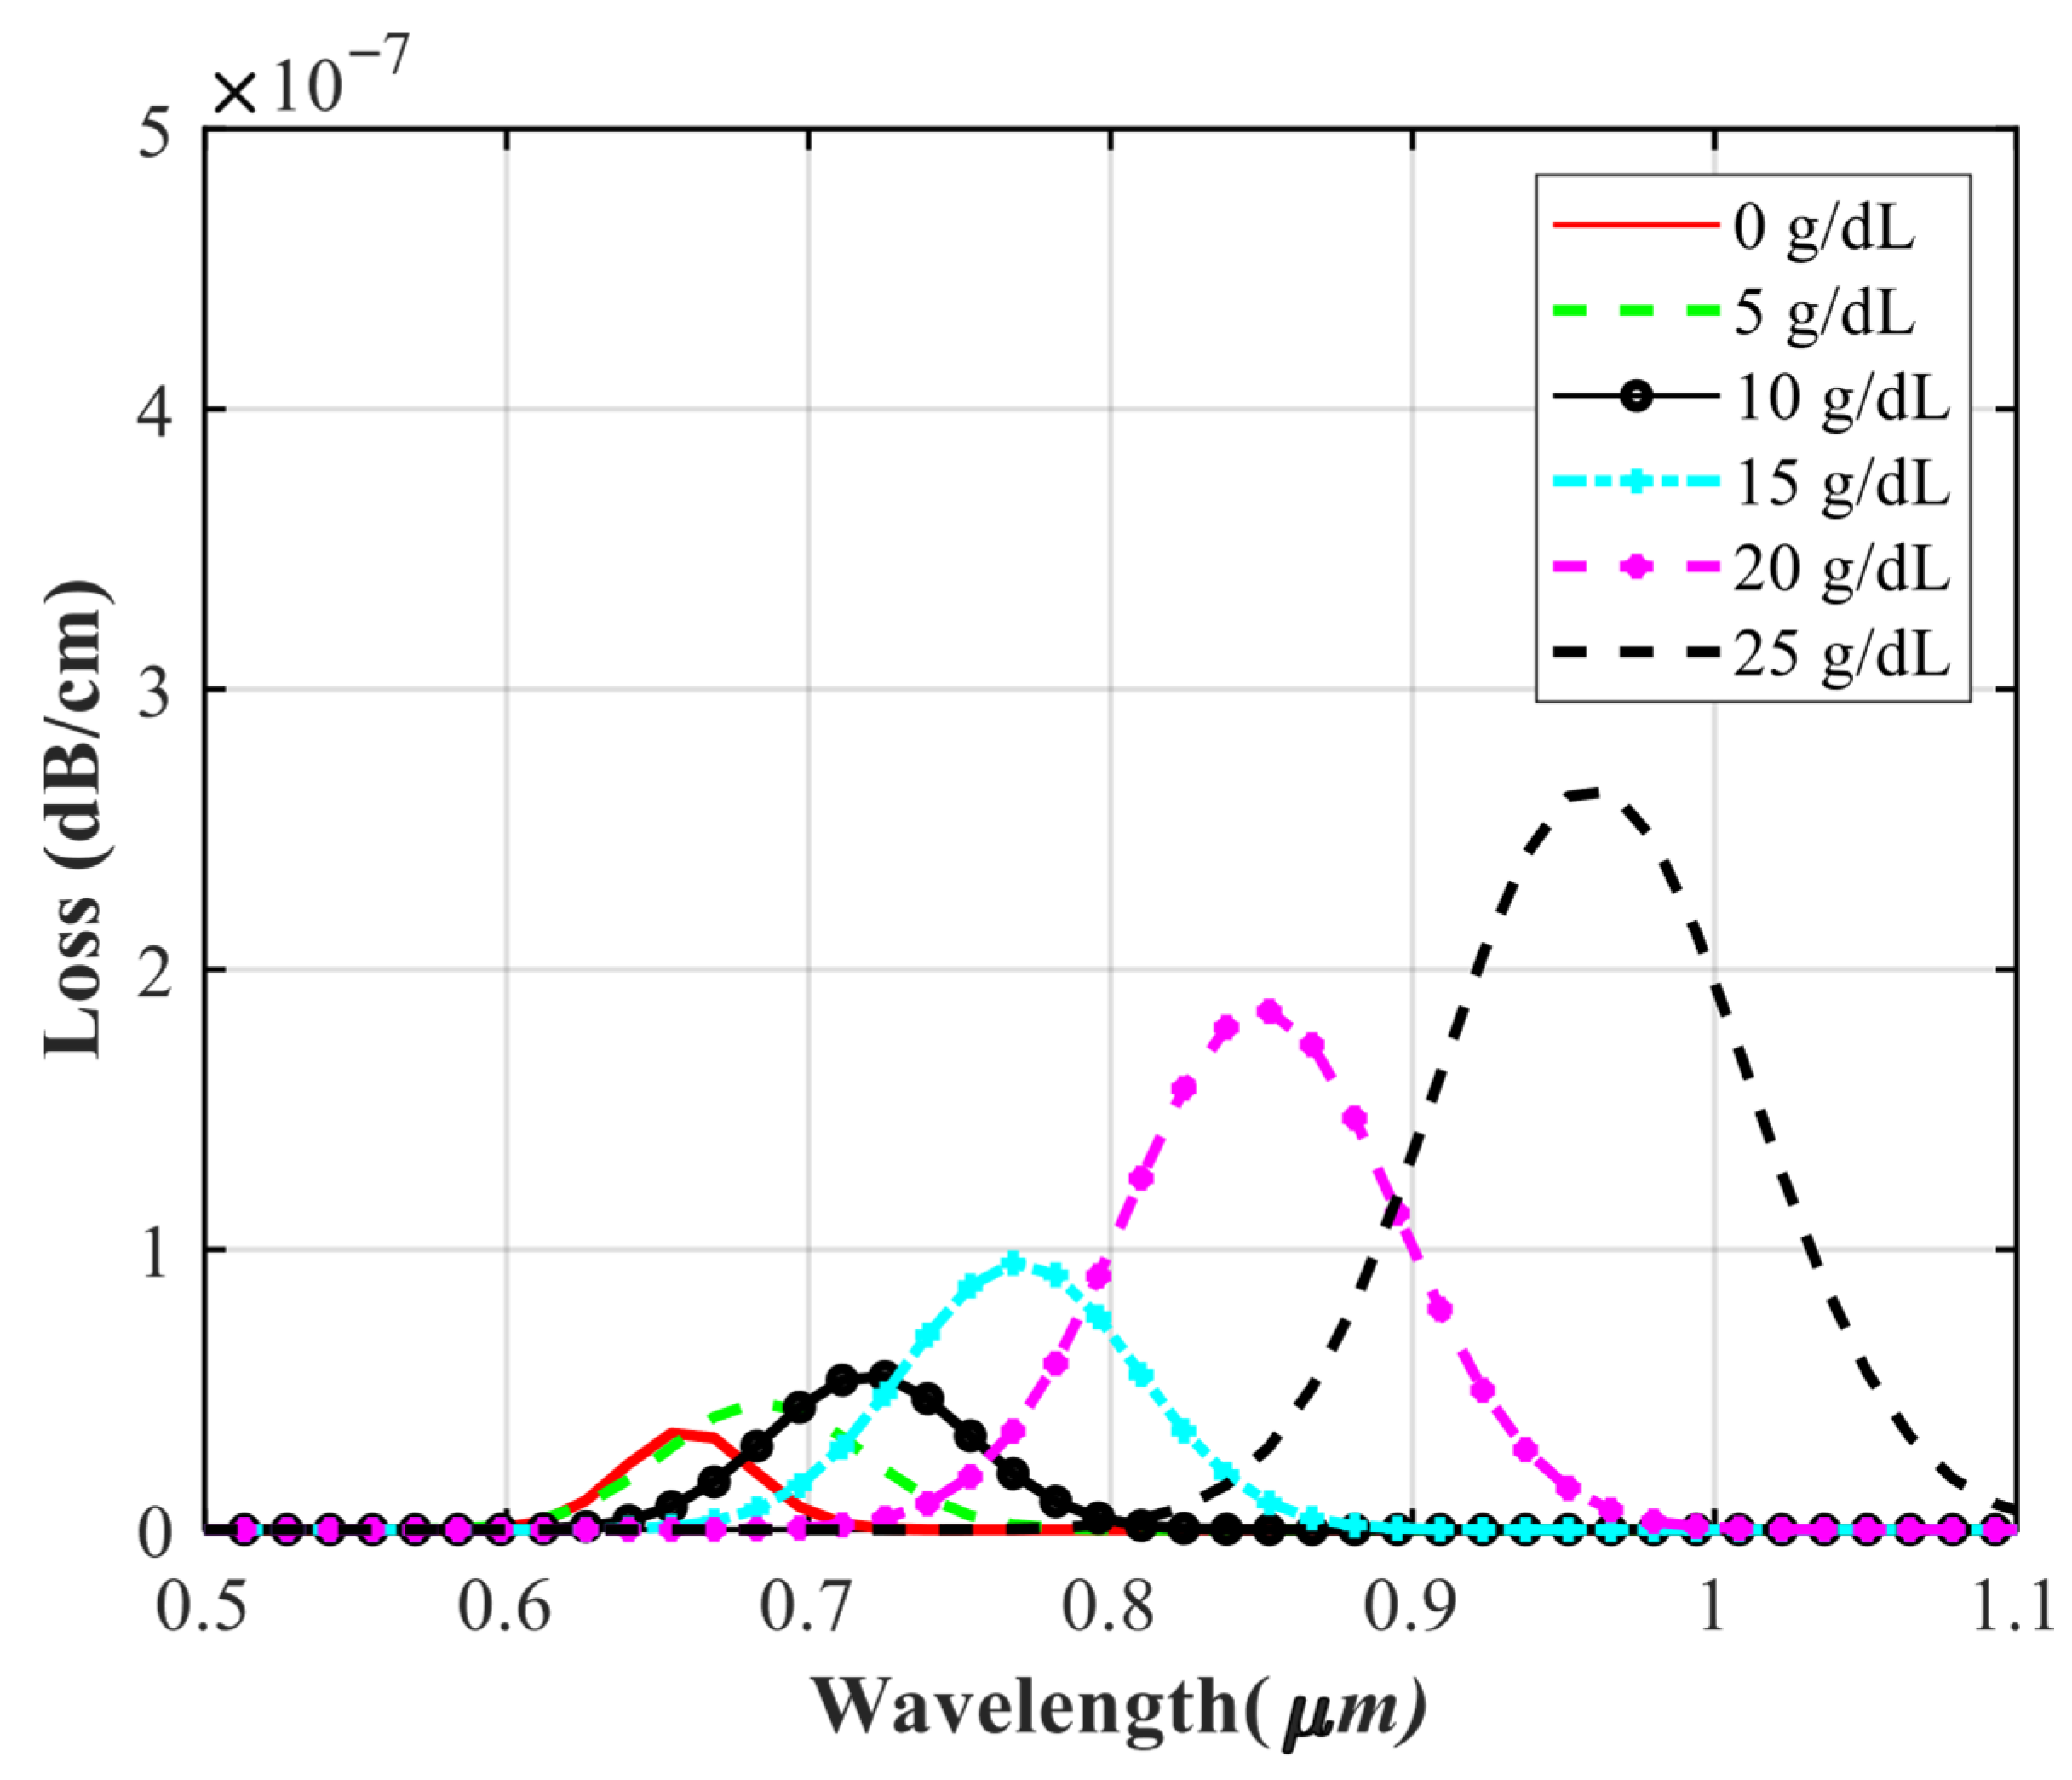
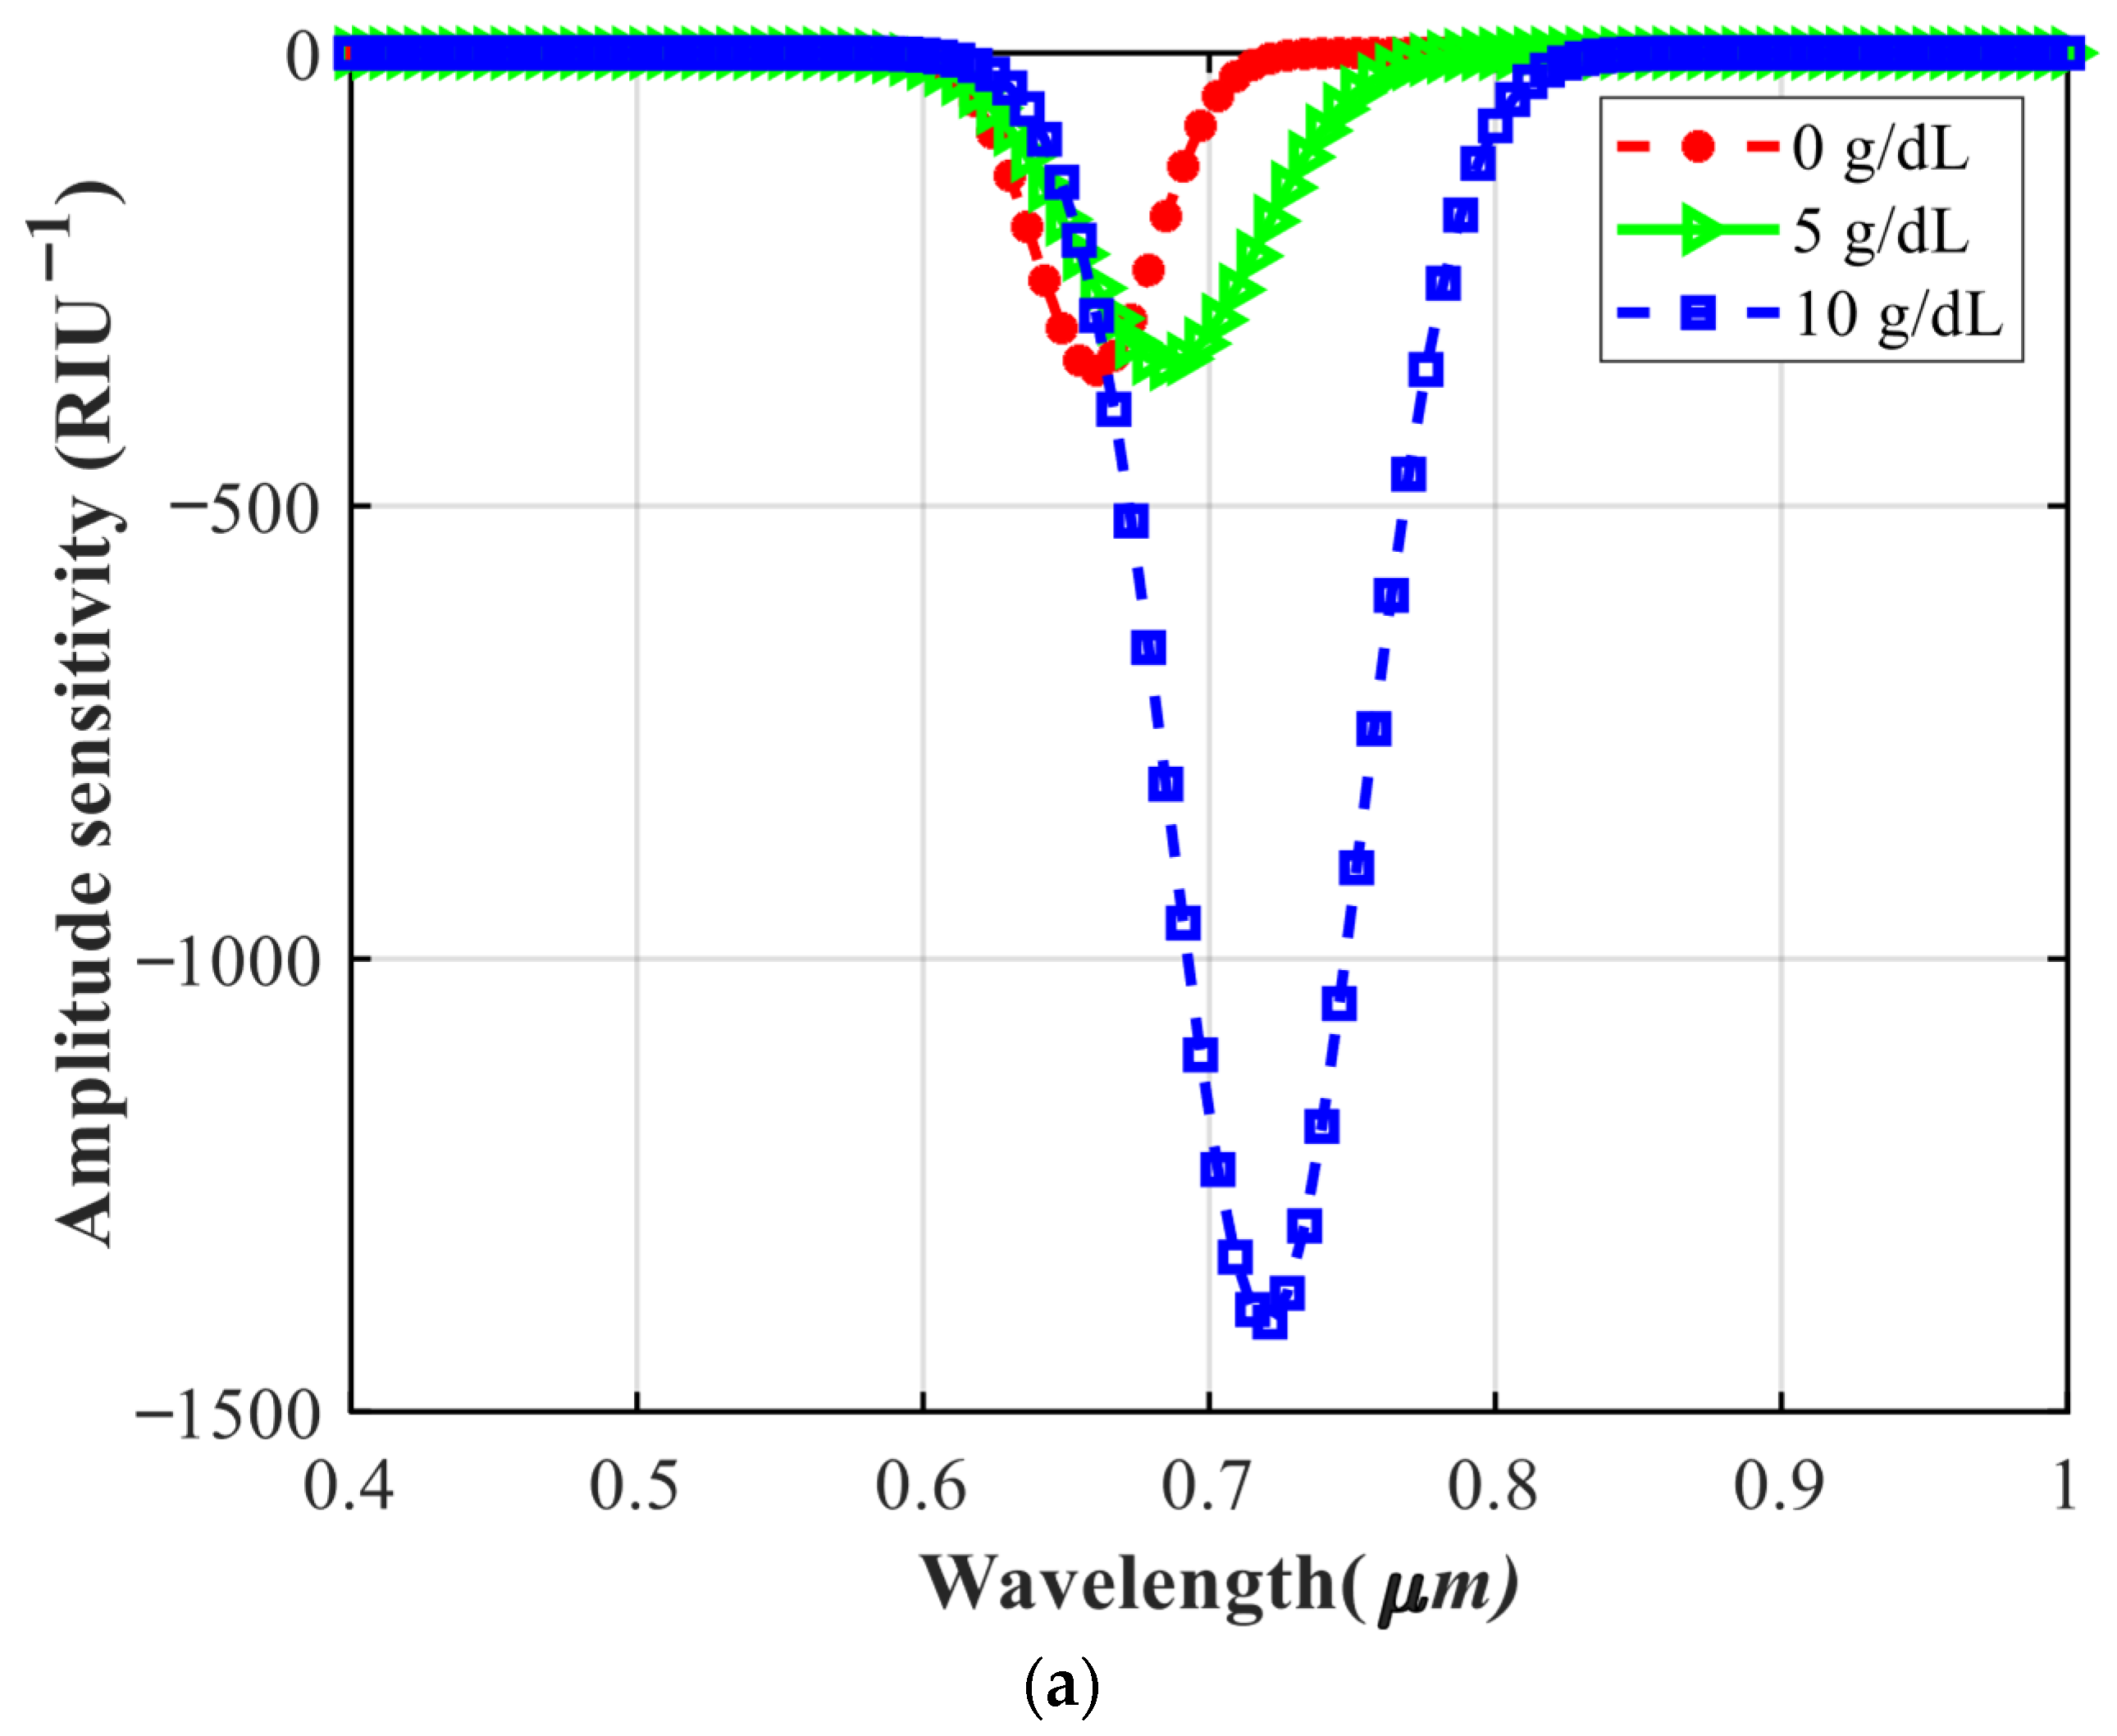
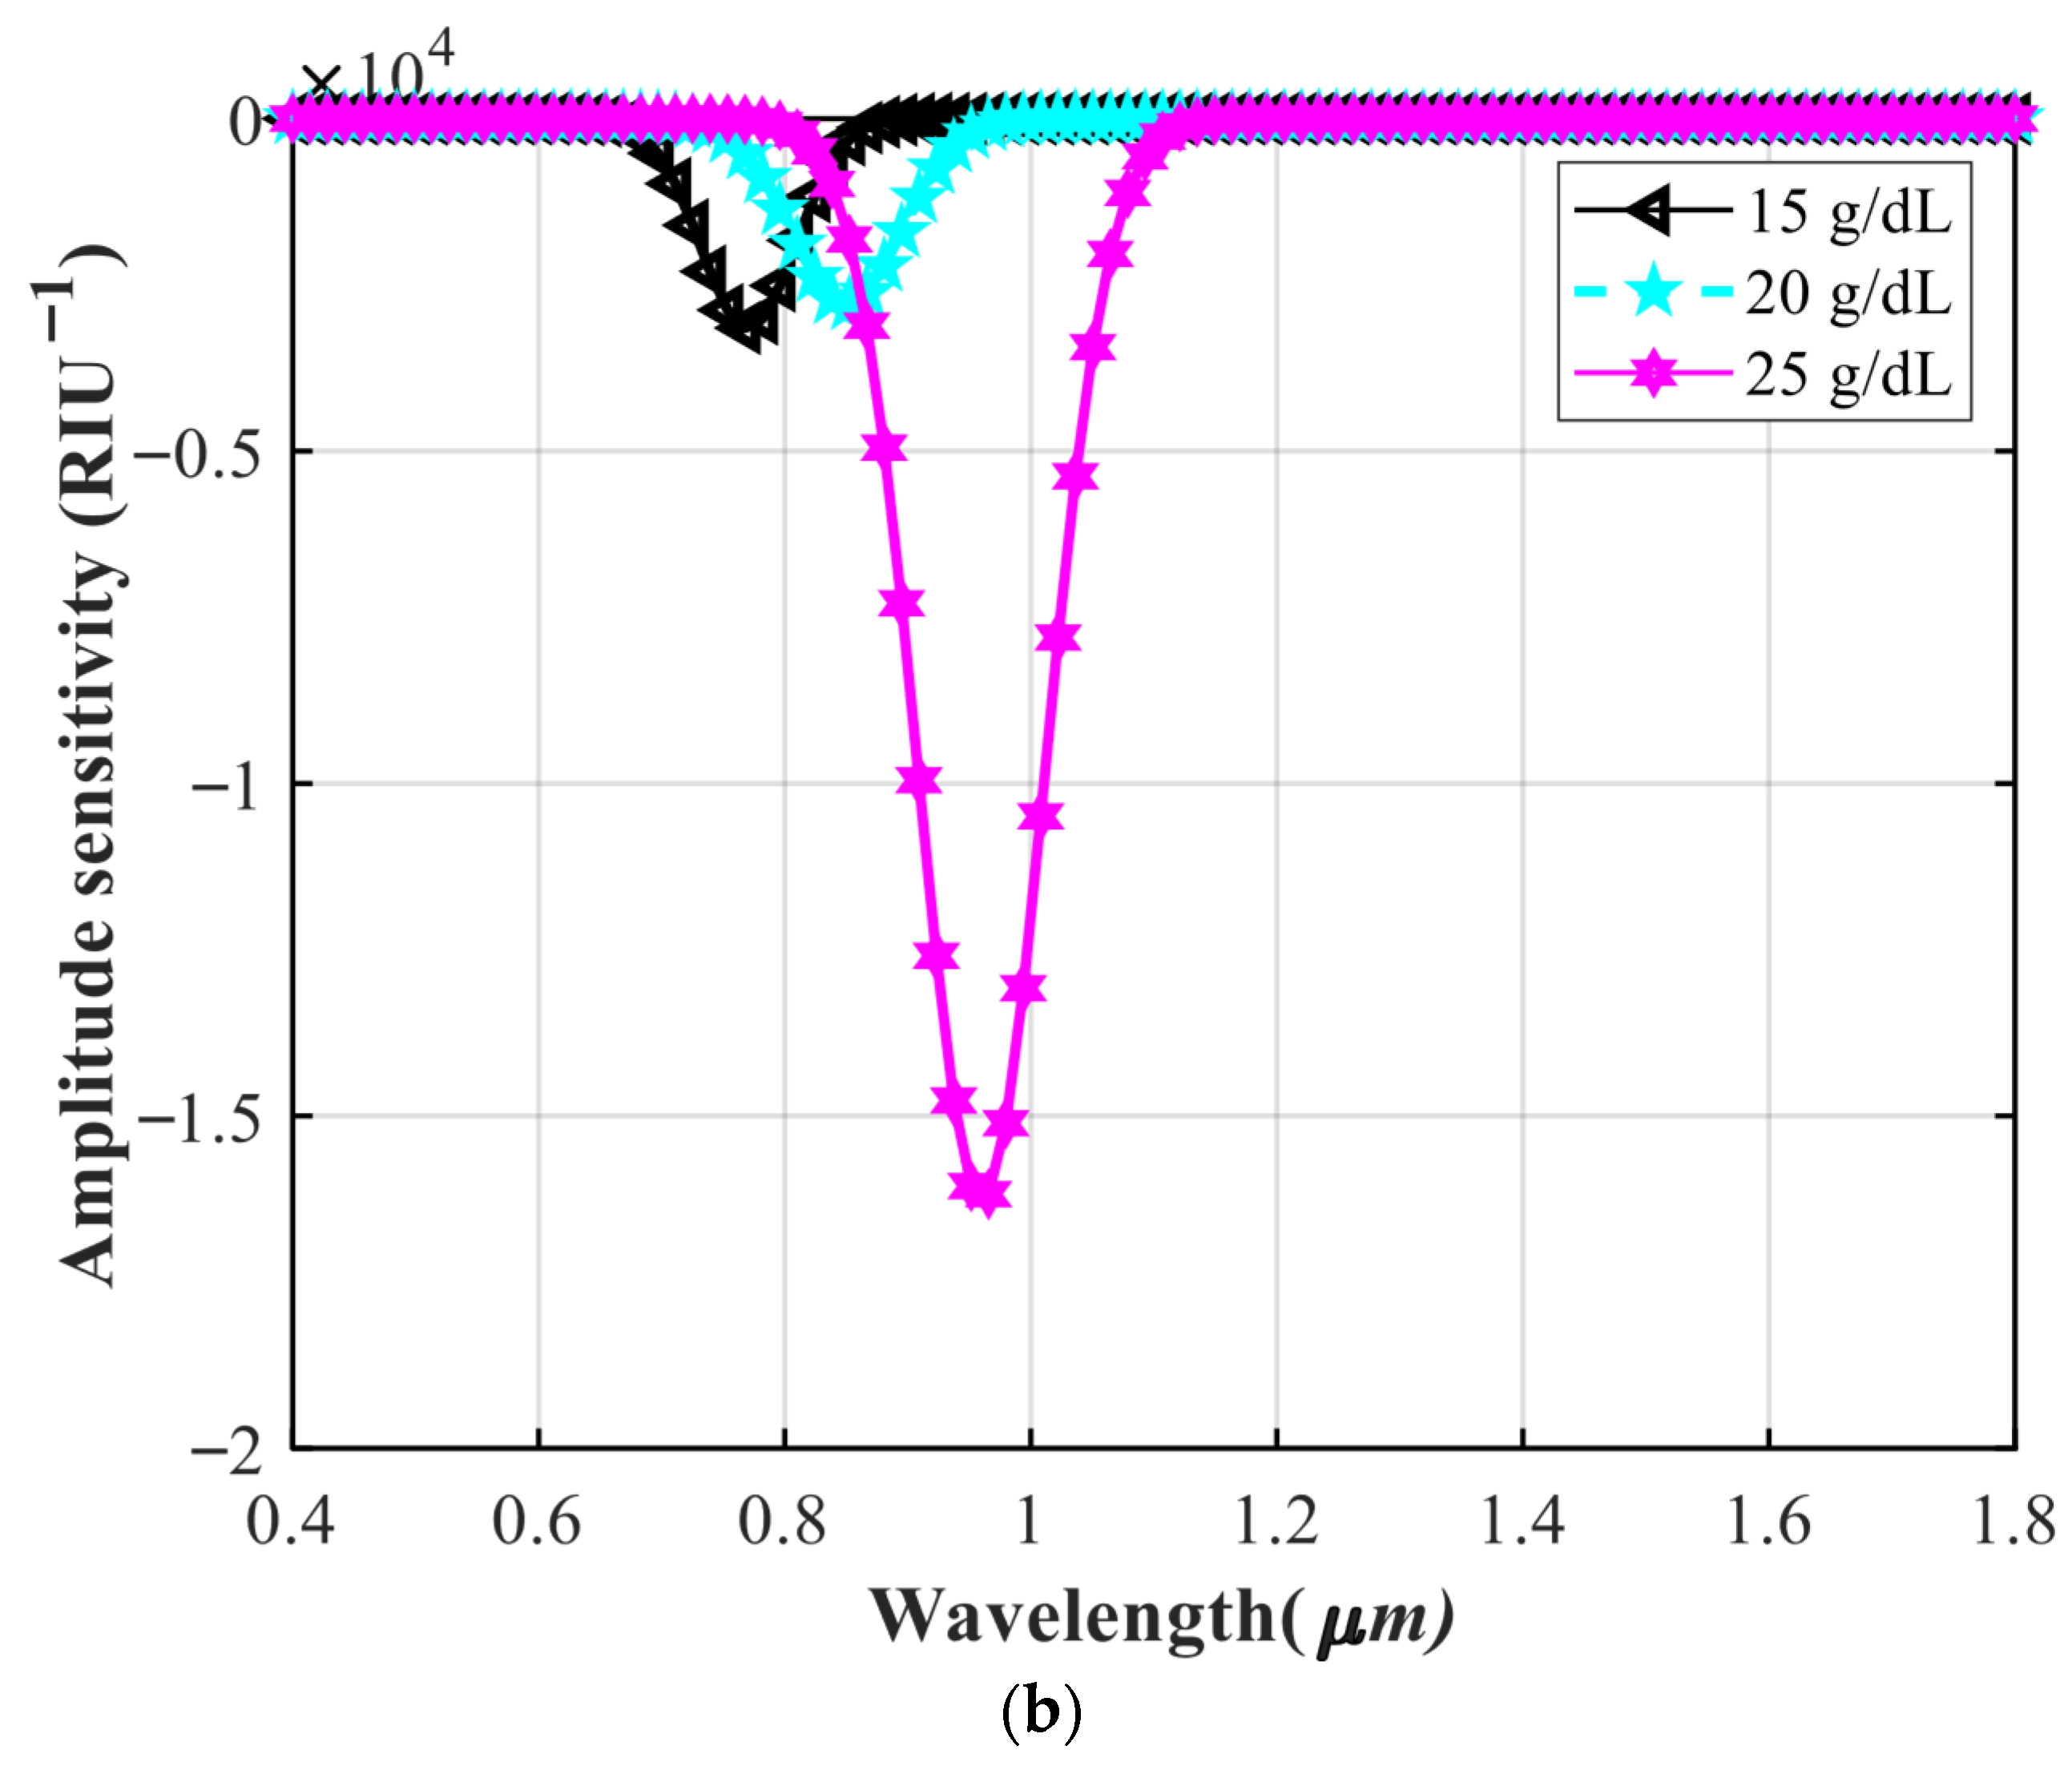
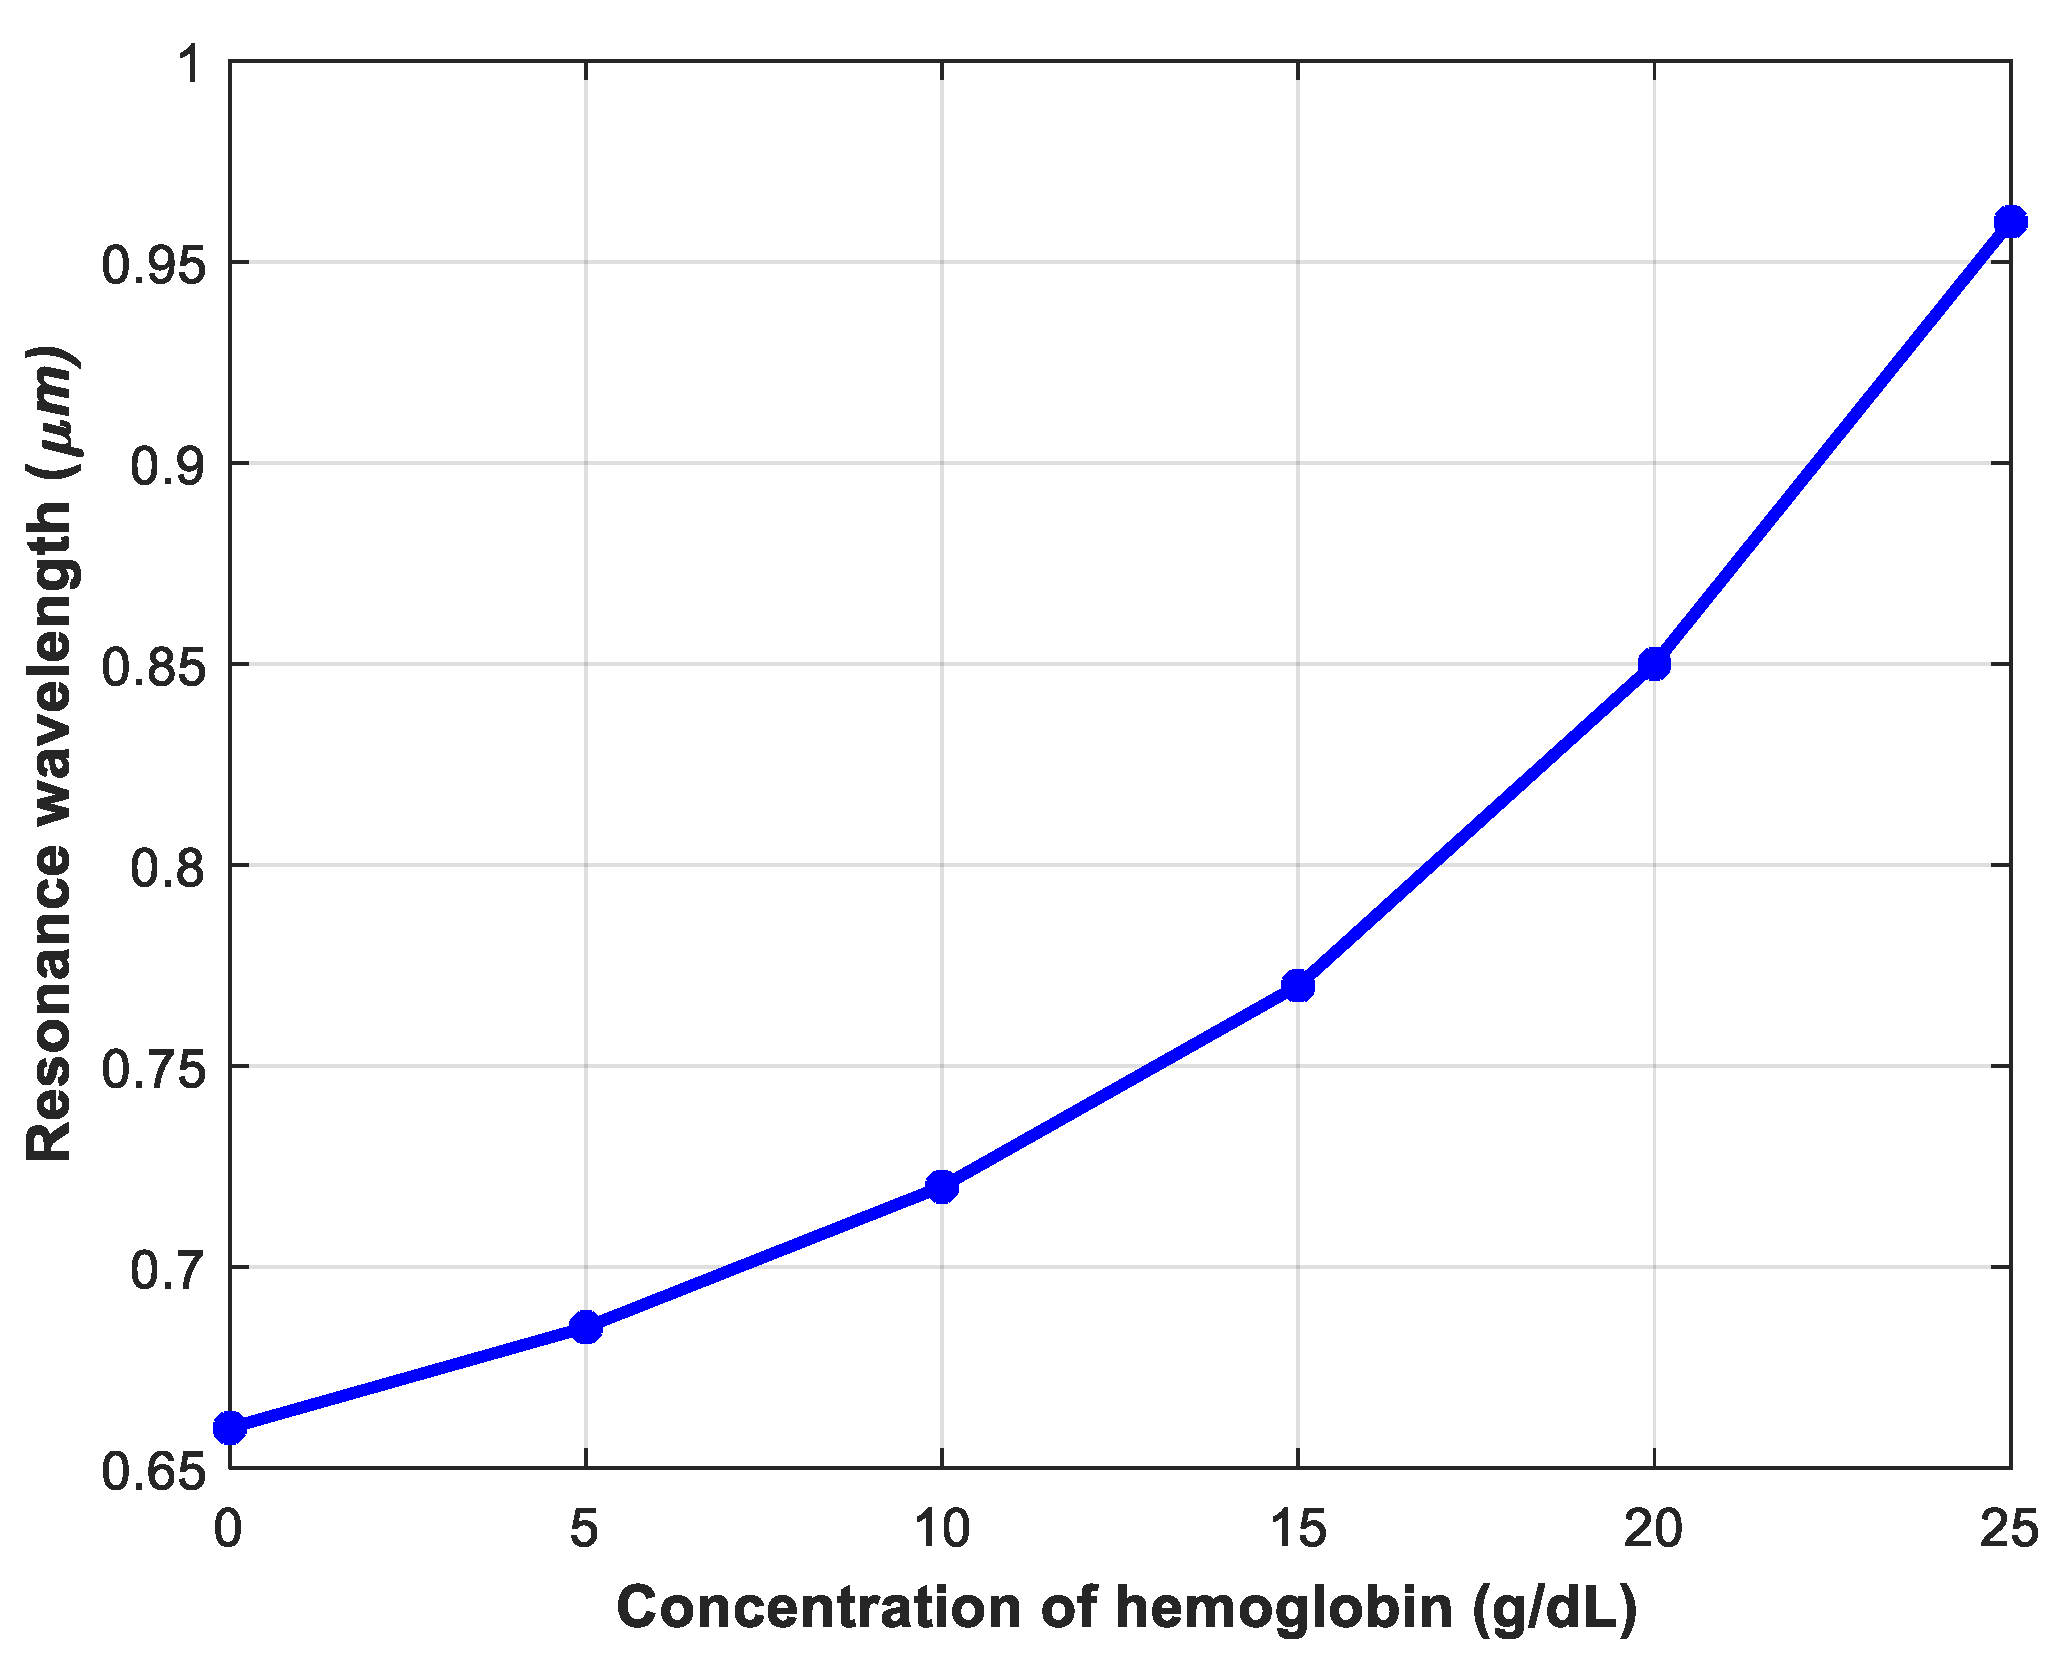
Figure 9 shows the values of the RIs of hemoglobin for different concentrations from 0 g/dL to 25 g/dL which is calculated from Equation (8). These values are calculated from Equations (8) and (9). The amount of impurity in the hemoglobin solution can change its refractive index. To prepare the hemoglobin solutions, it is best to follow the steps mentioned by Friebel et al. [51]. Figure 10 shows the graph of wavelength-dependent RI of the hemoglobin analyte for concentrations from 0 g/dL to 25 g/dL. As can be seen, by increasing the concentration of hemoglobin, the red wavelength shift is seen. Figure 11 shows the values of SA for the hemoglobin concentrations from 0 g/dL to 25 g/dL. The maximum SA is 16,270 RIU−1. The location of resonance peaks for different hemoglobin concentrations is shown in Figure 12. The resonance wavelengths occur at the wavelengths of 660, 685, 720, 770, 850, and 960 for concentrations from 0 g/dL to 25 g/dL.
The sensitivity of the hemoglobin can be calculated by the following equation:
S ( n m / g / d L ) = Δ λ H b Δ C H b
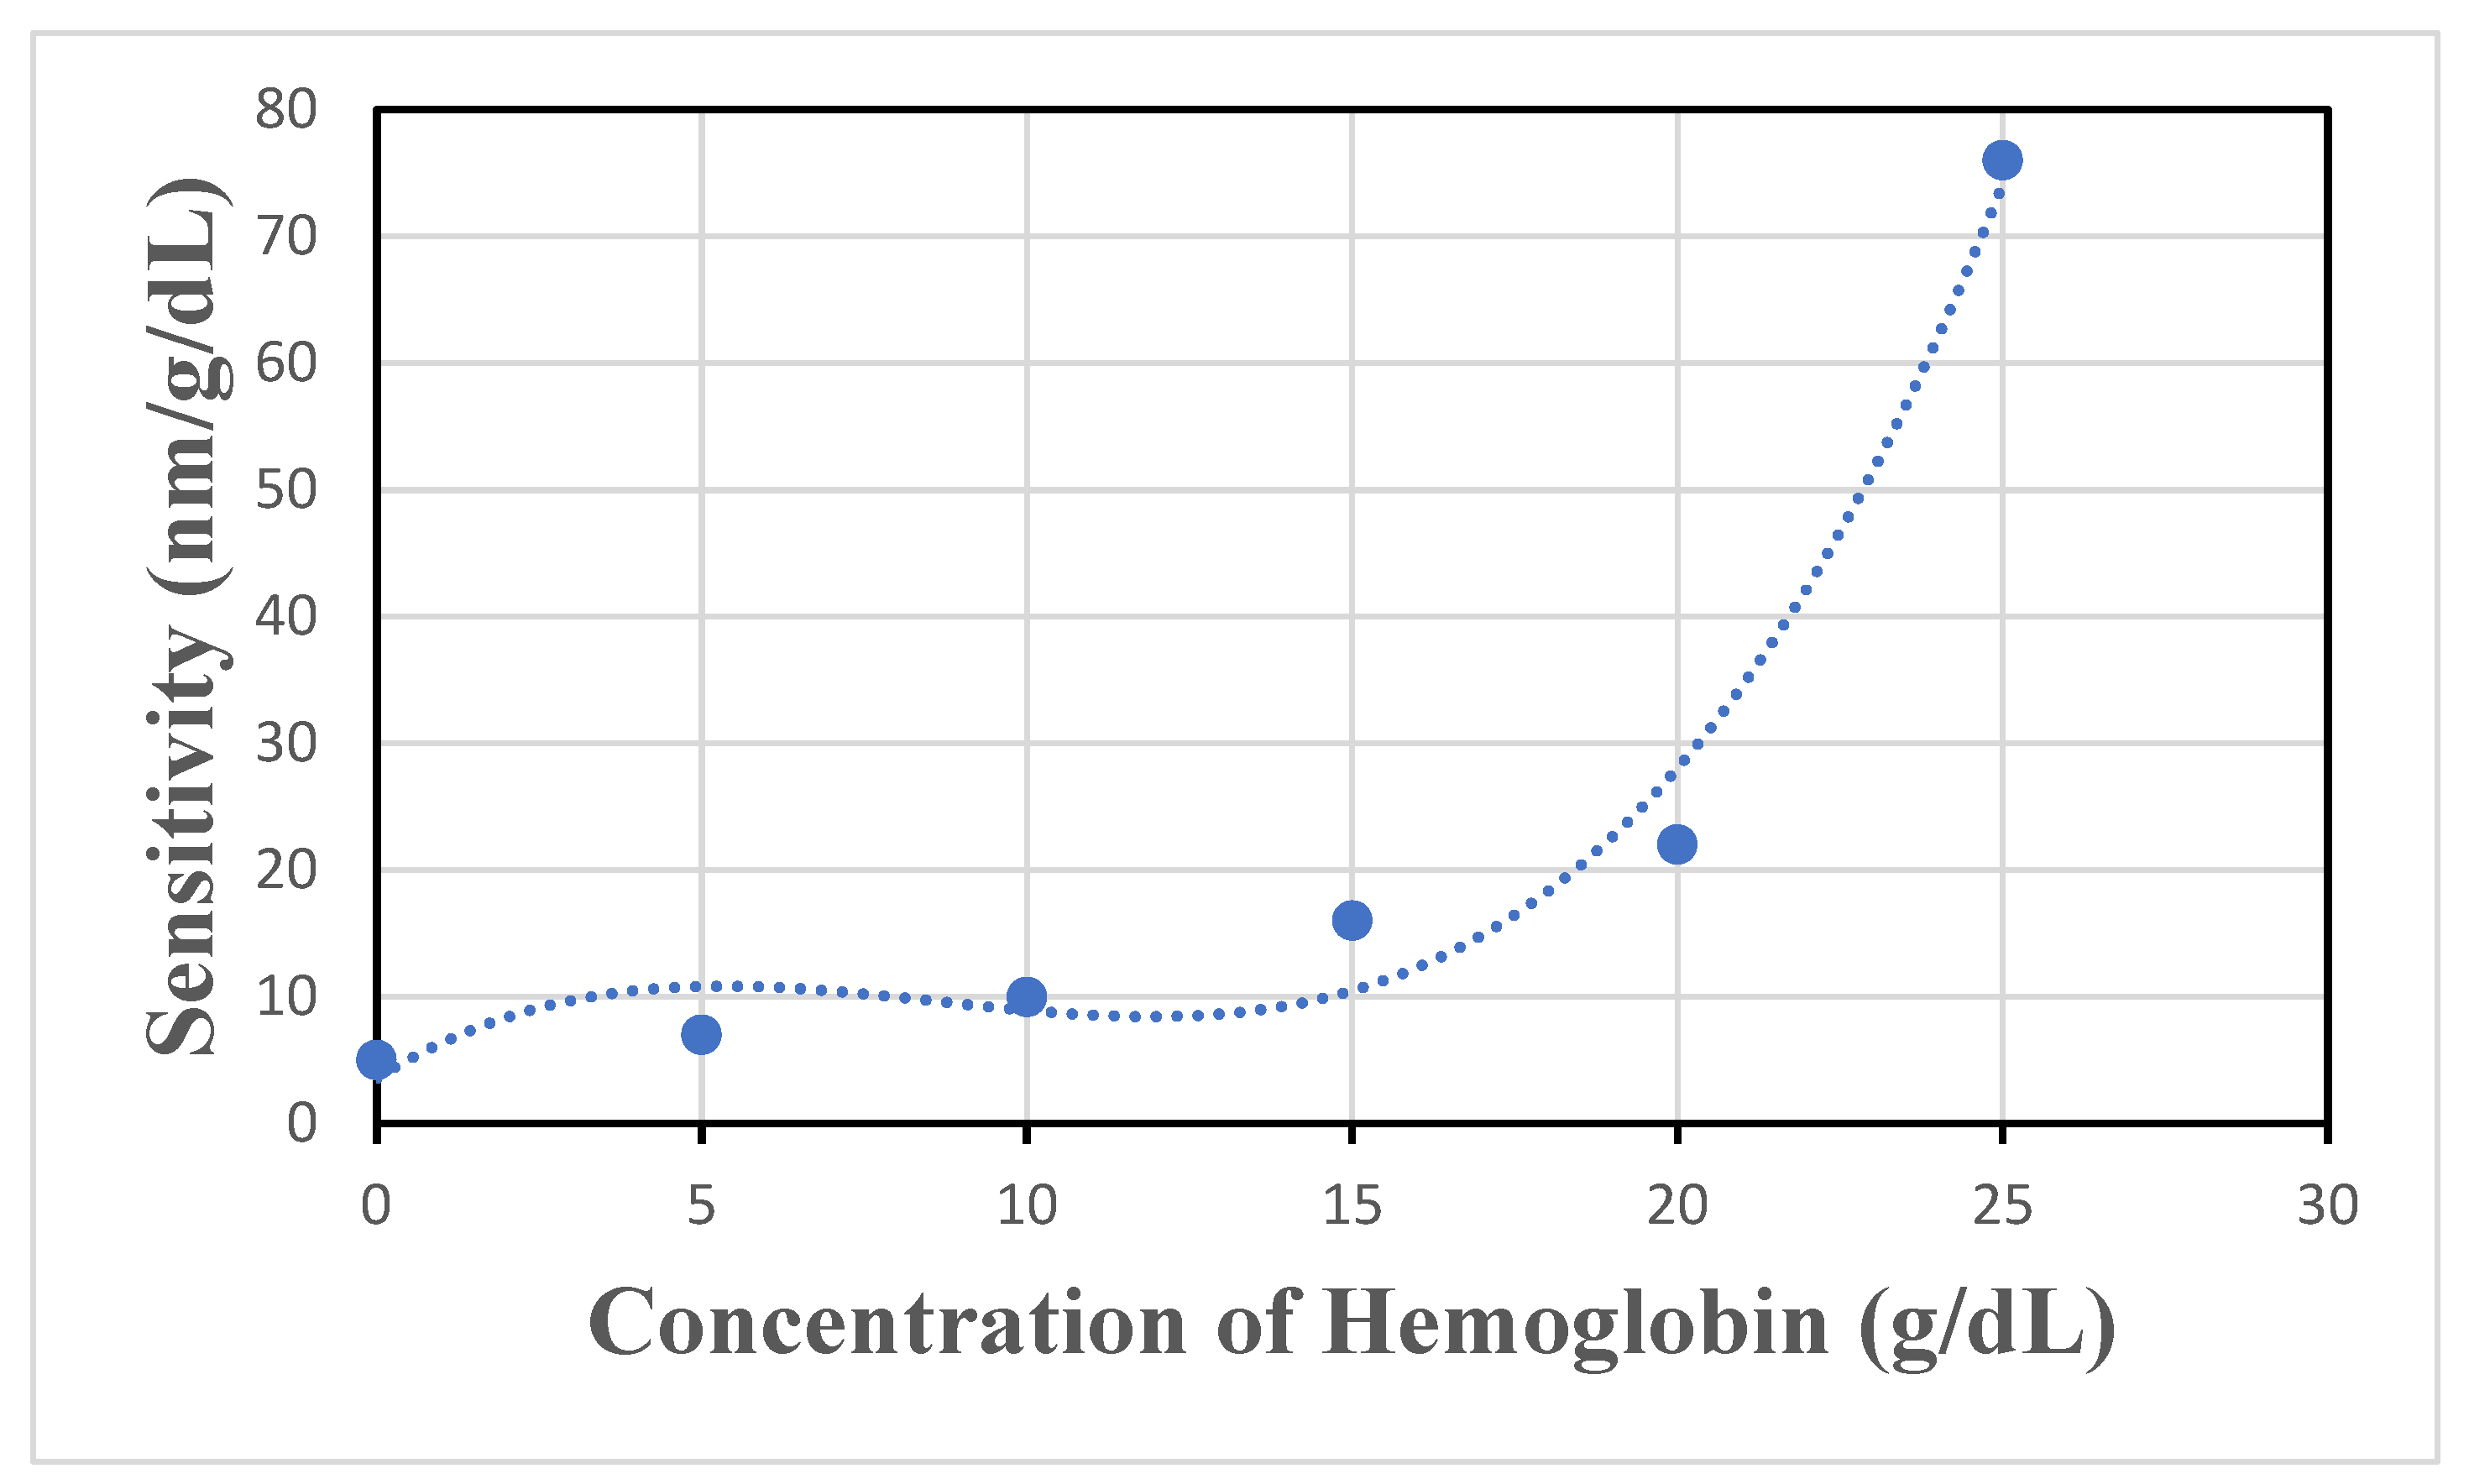
where ΔλHb is the difference between two adjacent shifted resonant wavelengths, and ΔCHb is the difference between two adjacent hemoglobin concentrations. The sensitivity of the sensor is 5 to 76 (nm/g/dL). The values of sensitivities can be seen in the diagram of Figure 13. In order to detect the higher concentrations of the curve fitting line that passes near these points is plotted. As can be seen, the curve fitting line is a third-order polynomial fitting. This equation is described as follows:
S λ C H b = 0.0167 C H b 3 0.4335 C H b 2 + 3.1966 C H b + 3.5794
This line gives a good fit with a degree of 0.9756, which is a suitable value to detect unknown percentages of hemoglobin. A high resolution with the amount of 6.57 × 10⁻³ is also calculated for the concentration of 25 g/dL. At concentrations above 20 g/dL, the sensitivity increased with a steeper slope. As hemoglobin concentration rises, the stronger interaction with the detector leads to larger, more discernible signals, indicating enhanced sensitivity and accuracy. This suggests that the sensor’s performance is dominated by its ability to resolve small changes in hemoglobin concentration.

4.4. Investigating the Steps of How to Make the Proposed Sensor for Practical Work

Fabrication of the presented fiber is possible due to the progress of the nanotechnology industry. For practical purposes, it may be difficult to stack a silicon layer and a gold layer. We propose the method described in [52]. First, a silicon disk cavity is made using photolithography, silicon etching and XeF2 etching. Then, a gold layer with a specific thickness is sputtered on the silicon disk cavity and a CO2 laser is irradiated from above the device.
Figure 14 shows the tools needed to implement the refractometric optical fiber (ROF) sensor system in practical work. First, a laser source is required to produce photons with specific wavelengths. The light produced will be transmitted through a single-mode fiber (SMF). The two ends of the proposed fiber are connected to the SMF using a fusion splicer. A fluidic system requires that the liquid enter from one side and exit from the other side. Liquids can be injected into this system to detect analytes [53]. The proposed OF is placed inside the liquid so that the analyte connects to the reagent in the outer environment of the fiber. The inlet and outlet ports can be drilled using the laser cutting method [54]. Finally, the light from the end of the single-mode fiber is connected to an optical spectrum analyzer. The output spectrum is displayed on a PC, where it can be analyzed.

4.5. Comparison of Proposed Sensor Parameters with Previous Works

We introduced the sensors that were proposed for hemoglobin measurement in the introduction section. In this section, we compare the parameters of the reported sensors with the proposed sensor. Table 5 compares the different parameters reported in previous articles with the parameters presented in this article. As can be seen, our proposed sensor has the highest Sw and SA compared to the other sensors. As can be seen from Table 5, the proposed sensor has a lower FOM than reference [31]. However, one of the problems with PCFs not connecting well with SMFs is that this increases coupling losses. Most of the fibers that we introduced in the introduction were irregular and the fiber core was not located in the center. This causes increased coupling losses. One of the advantages of our proposed fiber is that the core is located in the center and can couple the center of SMFs with. Since the core of our proposed structure is located in the center of the fiber, it will create lower connection losses when connecting SMFs. Additionally, the lowest resolution value indicates that the sensor can operate with higher accuracy. Therefore, the proposed sensor is a suitable option for detection in the field of the ROF sensor, especially hemoglobin detection.

5. Conclusions

In this paper, we propose an OF with a simple structure for detecting hemoglobin. The sensor’s performance was analyzed using the finite element method (FEM). The results demonstrate that the proposed sensor achieves a maximum sensitivity of 38,000 nm/RIU for SW and 11,280 RIU−1 for SA. Due to its compact size and simple design, the sensor can be used for real-time, label-free detection of hemoglobin. Additionally, we developed a nonlinear equation to identify abnormal hemoglobin concentrations. The results indicate that the sensor can detect hemoglobin with a sensitivity of up to 75 nm/g/dL and a resolution on the order of 10−3.

Author Contributions

Conceptualization, A.A., S.M. and S.R.-A.; methodology, A.A., S.M. and S.R.-A.; software, A.A.; validation, S.M. and S.R.-A.; formal analysis, A.A.; investigation, A.A.; resources, A.A.; data curation, A.A.; writing—original draft preparation, A.A.; writing—review and editing, A.A., S.M., S.R.-A. and S.D.; supervision, S.M. and S.R.-A.; project administration, S.M., S.D. and S.R.-A. All authors have read and agreed to the published version of the manuscript.

Funding

This research received no external funding.

Data Availability Statement

No data was used in this research.

Conflicts of Interest

The authors declare no conflicts of interest.

References

  1. Elsharkawy, N.B.; Abdelaziz, E.M.; Ouda, M.M.; Oraby, F.A. Effectiveness of health information package program on knowledge and compliance among pregnant women with anemia: A randomized controlled trial. Int. J. Environ. Res. Public Health 2022, 19, 2724. [Google Scholar] [CrossRef]
  2. Al-Jawaldeh, A.; Taktouk, M.; Doggui, R.; Abdollahi, Z.; Achakzai, B.; Aguenaou, H.; Al-Halaika, M.; Almamary, S.; Barham, R.; Coulibaly-Zerbo, F. Are countries of the eastern mediterranean region on track towards meeting the world health assembly target for anemia? A review of evidence. Int. J. Environ. Res. Public Health 2021, 18, 2449. [Google Scholar] [CrossRef]
  3. Hamouleh-Alipour, A.; Forouzeshfard, M.; Baghbani, R.; Vafapour, Z. Blood Hemoglobin Concentration Sensing by Optical Nano Biosensor-Based Plasmonic Metasurface: A Feasibility Study. IEEE Trans. Nanotechnol. 2022, 21, 620–628. [Google Scholar] [CrossRef]
  4. Han, G.-C.; Su, X.; Hou, J.; Ferranco, A.; Feng, X.-Z.; Zeng, R.; Chen, Z.; Kraatz, H.-B. Disposable electrochemical sensors for hemoglobin detection based on ferrocenoyl cysteine conjugates modified electrode. Sens. Actuators B Chem. 2019, 282, 130–136. [Google Scholar] [CrossRef]
  5. Meng, Z.; Tayyab, M.; Lin, Z.; Raji, H.; Javanmard, M.A. Smartphone-Based Disposable Hemoglobin Sensor Based on Colorimetric Analysis. Sensors 2023, 23, 394. [Google Scholar] [CrossRef] [PubMed]
  6. Chahkoutahi, A.; Emami, F.; Rafiee, E. Sensitive Hemoglobin Concentration Sensor Based on Graphene-Plasmonic Nano-structures. Plasmonics 2022, 17, 423–431. [Google Scholar] [CrossRef]
  7. Nida, M.H.; Al-Bassam, S.S. Coreless optical fiber for hemoglobin (HB) sensing with bilayer based on surface plasmon resonance. J. Opt. 2023, 52, 1724–1729. [Google Scholar] [CrossRef]
  8. Bharti, R.; Gupta, J.; Rajamani, P.; Moulick, R.G.; Bhattacharya, J. Iron oxide nanoparticles/PEDOT: PSS nanocomposite-based modification of both glassy carbon electrode and flexible cotton fiber OECT for highly sensitive multi-analytes detection. Appl. Nanosci. 2022, 12, 3823–3833. [Google Scholar] [CrossRef]
  9. Cheng, Z.Q.; He, J.; Zhou, L.; Li, Y.; Lin, P.; Guo, J.; Cai, S.; Xiong, X. Smart handheld device with flexible wrist and electrical bioimpedance sensor for tissue inspection. Proceedings of the Institution of Mechanical Engineers. Part H J. Eng. Med. 2022, 236, 416–426. [Google Scholar] [CrossRef]
  10. Yousuf, M.A.; Asiyanbola, B.A. A review of force and resonance sensors used in the clinical study of tissue properties. Proceedings of the Institution of Mechanical Engineers. Part H J. Eng. Med. 2013, 227, 1333–1340. [Google Scholar] [CrossRef]
  11. Dhara, P.; Singh, V.K.; Kumar, A.; Olivero, M.; Perrone, G. Reflection based silicon incorporated silver coated fiber optic SPR sensor for refractive index and temperature measurement. Microsyst. Technol. 2024, 30, 913–922. [Google Scholar] [CrossRef]
  12. Chew, J.W.; Gan, S.X.; Cui, J.; Chan, W.D.; Chu, S.T.; Tam, H.-Y. Recent Advancements in Optical Fiber Sensors for Non-Invasive Arterial Pulse Waveform Monitoring Applications: A Review. Photonics 2025, 12, 662. [Google Scholar] [CrossRef]
  13. Nizar, S.M.; Caroline, B.E.; Krishnan, P. Photonic crystal fiber sensor for the detection of hazardous gases. Microsyst. Technol. 2022, 28, 2023–2035. [Google Scholar] [CrossRef]
  14. Rossman, G.R. Optical spectroscopy. Rev. Mineral. Geochem. 2014, 78, 371–398. [Google Scholar] [CrossRef]
  15. Allsop, T.; Bhamber, R.; Lloyd, G.; Miller, M.R.; Dixon, A.; Webb, D.; Ania Castañón, J.D.; Bennion, I. Respiratory function monitoring using a real-time three-dimensional fiber-optic shaping sensing scheme based upon fiber Bragg gratings. J. Biomed. Opt. 2012, 17, 117001. [Google Scholar] [CrossRef]
  16. Singh, A.K.; Anwar, M.; Pradhan, R.; Ashar, M.S.; Rai, N.; Dey, S. Surface plasmon resonance based-optical biosensor: Emerging diagnostic tool for early detection of diseases. J. Biophotonics 2023, 16, e202200380. [Google Scholar] [CrossRef]
  17. Aray, A.; Chiavaioli, F.; Arjmand, M.; Trono, C.; Tombelli, S.; Giannetti, A.; Cennamo, N.; Soltanolkotabi, M.; Zeni, L.; Baldini, F. SPR-based plastic optical fibre biosensor for the detection of C-reactive protein in serum. J. Biophotonics 2016, 9, 1077–1084. [Google Scholar] [CrossRef]
  18. Eftimov, T.; Genova-Kalou, P.; Dyankov, G.; Bock, W.J.; Mankov, V.; Shoar Ghaffari, S.; Veselinov, P.; Arapova, A.; Makouei, S. Capabilities of Double-Resonance LPG and SPR Methods for Hypersensitive Detection of SARS-CoV-2 Structural Proteins: A Comparative Study. Biosensors 2023, 13, 318. [Google Scholar]
  19. Helmerhorst, E.; Chandler, D.J.; Nussio, M.; Mamotte, C.D. Real-time and Label-free Bio-sensing of Molecular Interactions by Surface Plasmon Resonance: A Laboratory Medicine Perspective. The Clinical biochemist. Reviews 2012, 33, 161–173. [Google Scholar]
  20. Bijalwan, A.; Rastogi, V. Gold–aluminum-based surface plasmon resonance sensor with a high quality factor and figure of merit for the detection of hemoglobin. Appl. Opt. 2018, 57, 9230–9237. [Google Scholar] [CrossRef]
  21. Luo, M.; Wang, Q. A reflective optical fiber SPR sensor with surface modified hemoglobin for dissolved oxygen detection. Alex. Eng. J. 2021, 60, 4115–4120. [Google Scholar] [CrossRef]
  22. Sadeghi, Z.; Shirkani, H. Highly sensitive mid-infrared SPR biosensor for a wide range of biomolecules and biological cells based on graphene-gold grating. Phys. E Low-Dimens. Syst. Nano. 2020, 119, 114005. [Google Scholar] [CrossRef]
  23. Abbaszadeh, A.; Makouei, S.; Meshgini, S. Ammonia measurement in exhaled human breath using PCF sensor for medical applications. Photonics Nano. Fundam. Appl. 2021, 44, 100917. [Google Scholar] [CrossRef]
  24. Abbaszadeh, A.; Makouei, S.; Meshgini, S. New hybrid photonic crystal fiber gas sensor with high sensitivity for ammonia gas detection. Can. J. Phys. 2022, 100, 129–137. [Google Scholar] [CrossRef]
  25. Amiri, I.; Yupapin, P.; Rashed, A.N.Z. Mathematical model analysis of dispersion and loss in photonic crystal fibers. J. Opt. Commun. 2023, 44, 139–144. [Google Scholar] [CrossRef]
  26. Fakhri, M.A.; Salim, E.T.; Sulaiman, G.M.; Albukhaty, S.; Ali, H.S.; Salim, Z.T.; Gopinath, S.C.; Hashim, U.; Al-aqbi, Z.T. Gold nanowires based on photonic crystal fiber by laser ablation in liquid to improve colon biosensor. Plasmonics 2023, 18, 2447–2463. [Google Scholar] [CrossRef]
  27. Abbaszadeh, A.; Rash-Ahmadi, S. A novel graphene-based circular dual-core photonic crystal fiber pressure sensor with high sensitivity. Appl. Phys. A 2023, 129, 570. [Google Scholar]
  28. Chao, C.-T.C.; Chen, S.-H.; Huang, H.J.; Kooh, M.R.R.; Lim, C.M.; Thotagamuge, R.; Mahadi, A.H.; Chau, Y.-F.C. Improving Temperature-Sensing Performance of Photonic Crystal Fiber via External Metal-Coated Trapezoidal-Shaped Surface. Crystals 2023, 13, 813. [Google Scholar]
  29. Singh, S.; Prajapati, Y.K. Dual-polarized ultrahigh sensitive gold/MoS2/graphene based D-shaped PCF refractive index sensor in visible to near-IR region. Opt. Quantum Electron. 2019, 52, 17. [Google Scholar] [CrossRef]
  30. Islam, M.S.; Cordeiro, C.M.B.; Sultana, J.; Aoni, R.A.; Feng, S.; Ahmed, R.; Dorraki, M.; Dinovitser, A.; Ng, B.W.H.; Abbott, D. A Hi-Bi Ultra-Sensitive Surface Plasmon Resonance Fiber Sensor. IEEE Access 2019, 7, 79085–79094. [Google Scholar] [CrossRef]
  31. Mahfuz, M.A.; Hossain, M.A.; Haque, E.; Hai, N.H.; Namihira, Y.; Ahmed, F. Dual-Core Photonic Crystal Fiber-Based Plasmonic RI Sensor in the Visible to Near-IR Operating Band. IEEE Sens. J. 2020, 20, 7692–7700. [Google Scholar] [CrossRef]
  32. Das, S.; Singh, V.K. Highly sensitive PCF based plasmonic biosensor for hemoglobin concentration detection. Photonics Nano. Fundam. Appl. 2022, 51, 101040. [Google Scholar] [CrossRef]
  33. Kaur, V.; Singh, S. Design of D-Shaped PCF-SPR sensor with dual coating of ITO and ZnO conducting metal oxide. Optik 2020, 220, 165135. [Google Scholar] [CrossRef]
  34. Soghra, G.; Jamal, B.; Bahar, M. Design and analysis of surface plasmon resonance based photonic crystal fiber sensor employing gold nanowires. Optik 2022, 260, 169026. [Google Scholar] [CrossRef]
  35. Li, W.; Chen, Y.; Xu, J.; Jiang, M.; Zou, H.A. D-Shaped SPR-Based PCF Sensor with an Extremely High-Amplitude Sensitivity for Measuring the Refractive Index. Micromachines 2023, 14, 1295. [Google Scholar] [CrossRef] [PubMed]
  36. Paul, A.K.; Mollah, M.A.; Hassan, M.Z.; Gomez-Cardona, N.; Reyes-Vera, E. Graphene-coated highly sensitive photonic crystal fiber surface plasmon resonance sensor for aqueous solution: Design and numerical analysis. Photonics 2021, 8, 155. [Google Scholar] [CrossRef]
  37. Liu, W.; Hu, C.; Zhou, L.; Yi, Z.; Liu, C.; Lv, J.; Yang, L.; Chu, P.K. A square-lattice D-shaped photonic crystal fiber sensor based on SPR to detect analytes with large refractive indexes. Phys. E Low-Dimens. Syst. Nanostruct. 2022, 138, 115106. [Google Scholar] [CrossRef]
  38. Dai, T.; Yan, J.; Zhu, W.; Bian, L.; Yi, Z.; Liu, M.; Tang, B.; Sun, T.; Li, G.; Yu, Z. Ultra-high sensitivity surface plasmon U-channel photonic crystal fiber for hemoglobin sensing. Sens. Actuators A Phys. 2024, 366, 115053. [Google Scholar] [CrossRef]
  39. Dagar, H.B.N.; Krishnan, P. High-Performance Dual-Core Bilateral Surface Optimized PCF SPR Biosensor for Early Detection of Six Distinct Cancer Cells. Plasmonics 2025, 20, 4799–4809. [Google Scholar] [CrossRef]
  40. Krishnan, P.; Khamaru, A.; Kumar, A. MXene coated concave shaped microchannel PCF SPR biosensor for the detection of HIV and sickle cell anaemia. Opt. Quantum Electron. 2025, 57, 270. [Google Scholar] [CrossRef]
  41. Bijalwan, A.; Singh, B.K.; Rastogi, V. Analysis of one-dimensional photonic crystal based sensor for detection of blood plasma and cancer cells. Optik 2021, 226, 165994. [Google Scholar] [CrossRef]
  42. Lazareva, E.; Tuchin, V. Measurement of refractive index of hemoglobin in the visible/NIR spectral range. J. Biomed. Opt. 2018, 23, 035004. [Google Scholar] [CrossRef]
  43. Elblbesy, M.A. The refractive index of human blood measured at the visible spectral region by single-fiber reflectance spectroscopy. AIMS Biophys. 2021, 8, 57–65. [Google Scholar] [CrossRef]
  44. Hassani, A.; Skorobogatiy, M. Photonic crystal fiber-based plasmonic sensors for the detection of biolayer thickness. J. Opt. Soc. Am. B 2009, 26, 1550–1557. [Google Scholar] [CrossRef]
  45. Erdmanis, M.; Viegas, D.; Hautakorpi, M.; Novotny, S.; Santos, J.L.; Ludvigsen, H. Comprehensive numerical analysis of a surface-plasmon-resonance sensor based on an H-shaped optical fiber. Opt Express 2011, 19, 13980–13988. [Google Scholar] [CrossRef] [PubMed]
  46. Hasanuzzaman, G.K.M.; Sakib, T.M.; Paul, A.K. Gold coated surface plasmon resonance based biosensor: An hexagonal photonic crystal Fiber platform. Sens. Bio-Sens. Res. 2023, 42, 100582. [Google Scholar] [CrossRef]
  47. Chen, S.-H.; Lin, H.-B.; Wang, X.-Z.; Hu, S.-Q.; Luo, Y.-H. Enhanced sensitivity of a surface plasmon resonance biosensor utilizing Au/ITO hyperbolic metamaterial. Results Phys. 2023, 49, 106522. [Google Scholar] [CrossRef]
  48. Wang, H.; Chen, S.; Dai, W.; Cai, X.; Fu, H. A High Sensitivity Surface Plasmon Resonance Biosensor Based on Photonic Crystal Fibers for Refractive Index Sensing. In Proceedings of the 2022 Photonics & Electromagnetics Research Symposium (PIERS), Hangzhou, China, 25–29 April 2022. [Google Scholar] [CrossRef]
  49. Hasan, M.M.; El Hameed, A.A.A. Serum adipokine (apelin) in lean and obese polycystic ovary syndrome patients before and after metformin treatment. Middle East Fertil. Soc. J. 2018, 23, 315–318. [Google Scholar] [CrossRef]
  50. Monro, T.; Belardi, W.; Furusawa, K.; Flanagan, J.; Broderick, N.G.R.; Richardson, D.J. Sensing with microstructured optical fibres. Meas. Sci. Technol. 2001, 12, 854. [Google Scholar] [CrossRef]
  51. Friebel, M.; Meinke, M. Model function to calculate the refractive index of native hemoglobin in the wavelength range of 250–1100 nm dependent on concentration. Appl. Opt. 2006, 45, 2838–2842. [Google Scholar] [CrossRef]
  52. Tamaki, S.; Yoshiki, W.; Tanabe, T. Characterization and fabrication of silica-gold composite toroidal optical microcavity. Front. Opt. 2015, jw2a.11. [Google Scholar] [CrossRef]
  53. Homola, J.; Dostálek, J.; Chen, S.; Rasooly, A.; Jiang, S.; Yee, S.S. Spectral surface plasmon resonance biosensor for detection of staphylococcal enterotoxin B in milk. Int. J. Food Microbiol. 2002, 75, 61–69. [Google Scholar] [CrossRef] [PubMed]
  54. Dostálek, J.; Vaisocherová, H.; Homola, J. Multichannel surface plasmon resonance biosensor with wavelength division multiplexing. Sens. Actuators B Chem. 2005, 108, 758–764. [Google Scholar] [CrossRef]
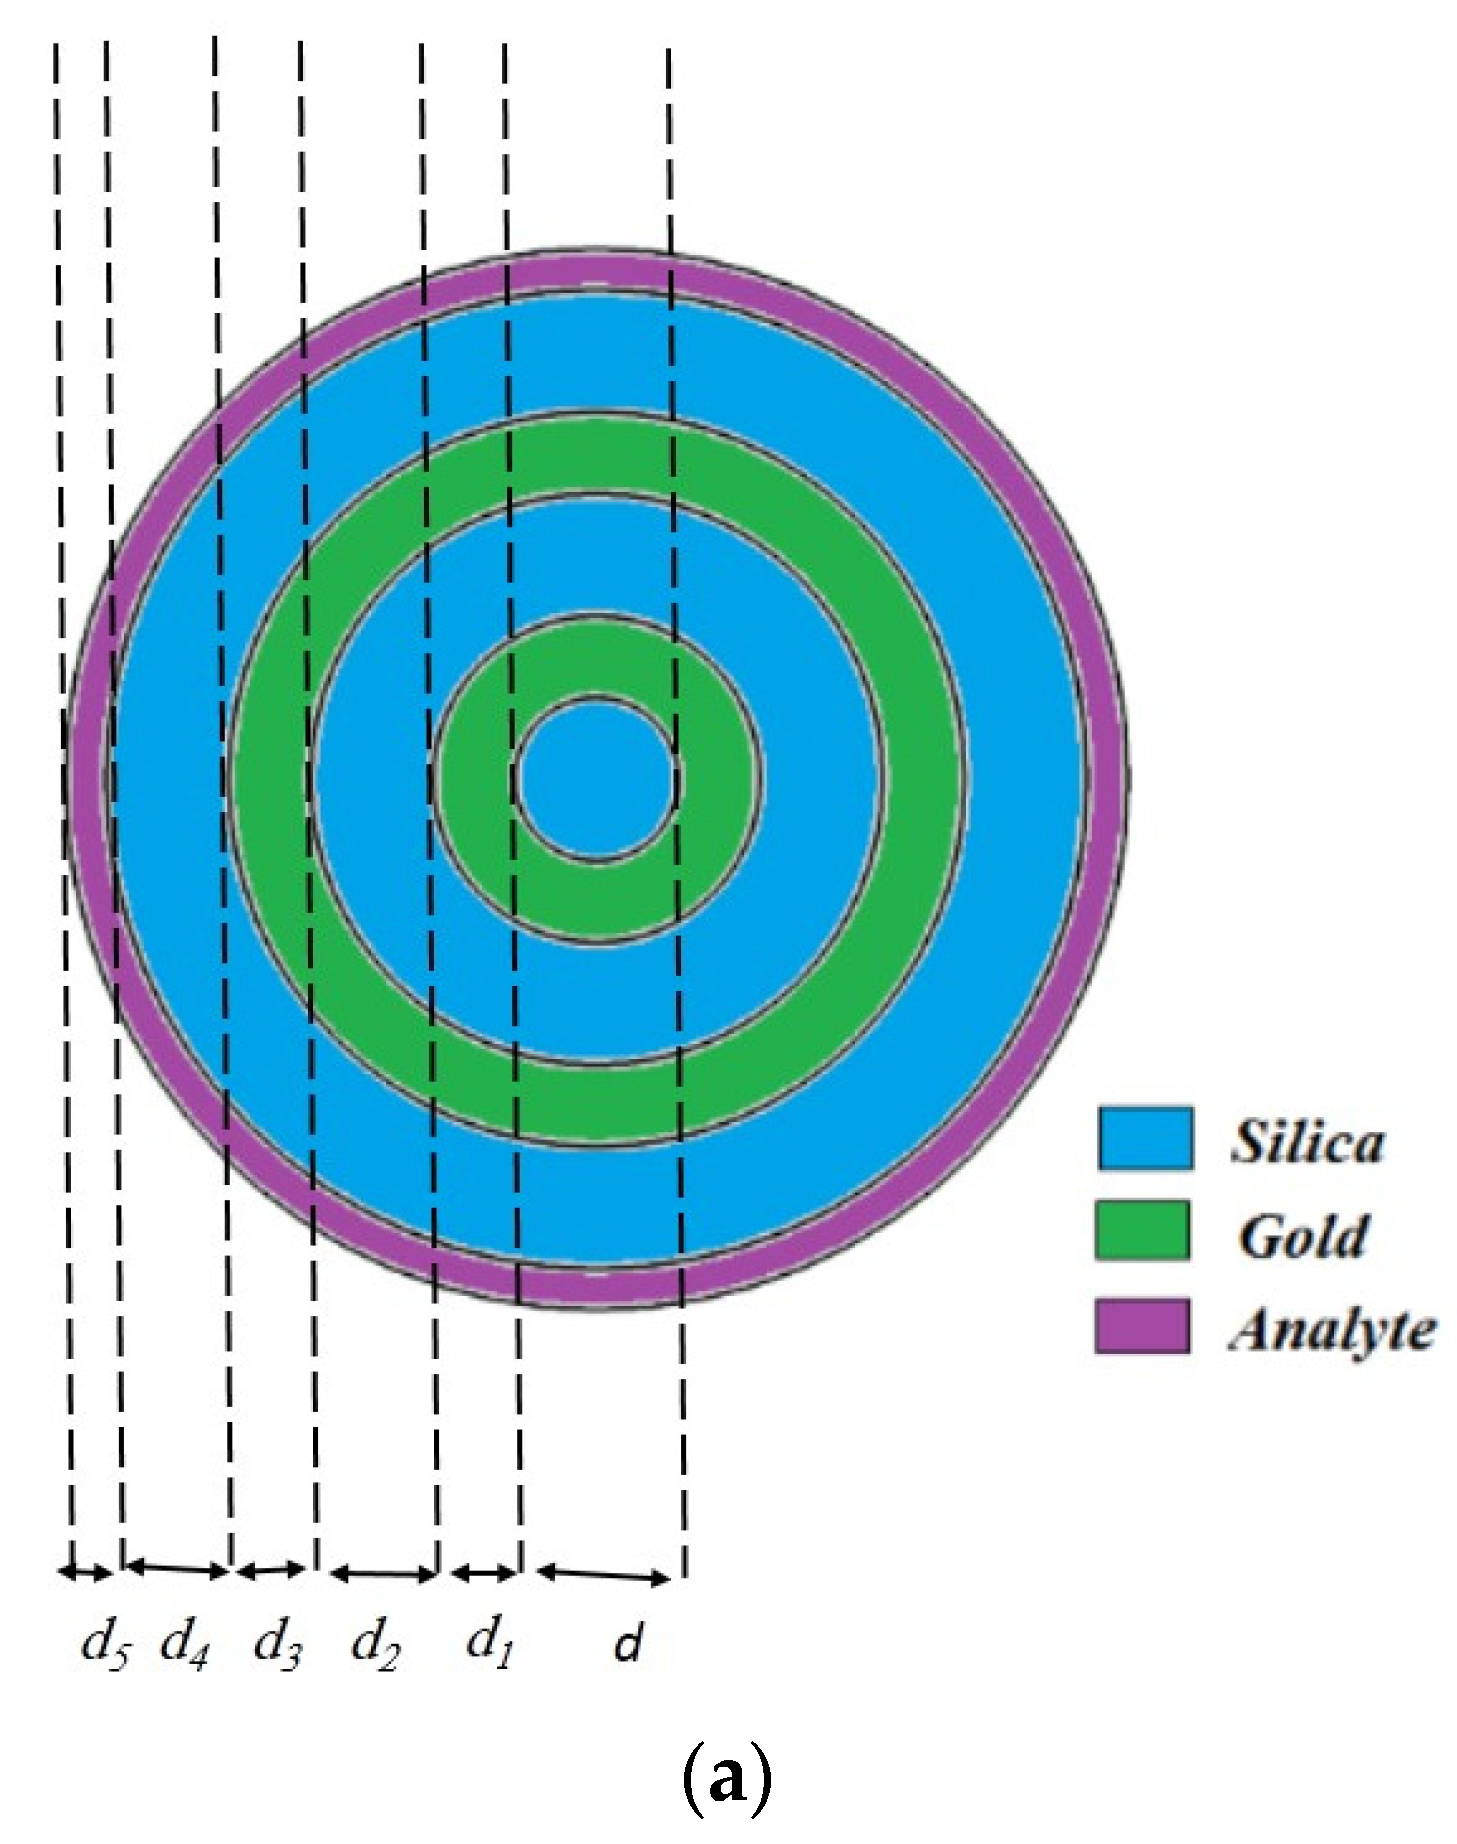
Figure 1. The (a) 2D and (b) 3D view of the geometry structure for the proposed OF.
Photonics 12 00933 g001aPhotonics 12 00933 g001b
Figure 2. The 2D view of how to mesh the proposed fiber structure.
Photonics 12 00933 g002
Figure 3. The 2D view of the electric field distribution for the (a) x and (b) y polarizations of the plasmonic modes, and (c) core mode.
Photonics 12 00933 g003
Figure 4. The loss spectra of the plasmonic mode for a RI of 1.34, and the real effective indices of the core mode for the proposed OF.
Photonics 12 00933 g004
Figure 5. The values of loss spectra for RIs of (a) 1.34 to 1.38, and (b) 1.39 to 1.41.
Photonics 12 00933 g005
Figure 6. The values of SA for RIs of (a) 1.34 to 1.38, and (b) 1.39 to 1.41.
Photonics 12 00933 g006
Figure 7. The values of the resonance wavelength and Sw for RIs of 1.34 to 1.41.
Photonics 12 00933 g007
Figure 8. The values of loss spectra for parameters of (a) d, (b) d1, (c) d2, (d) d3, (e) d4, and (f) d5.
Photonics 12 00933 g008
Figure 9. The values of RIs of hemoglobin for different concentrations from 0 to 30 g/dL.
Photonics 12 00933 g009
Figure 10. The loss spectra for different hemoglobin concentrations from 0 to 25 g/dL.
Photonics 12 00933 g010
Figure 11. The values of SA for different hemoglobin concentrations from (a) 0 to 10 g/dL and (b) 15 to 25 g/dL.
Photonics 12 00933 g011aPhotonics 12 00933 g011b
Figure 12. The resonance wavelength of the proposed OF for different concentrations from 0 to 30 g/dL.
Photonics 12 00933 g012
Figure 13. The values of sensitivity for different hemoglobin concentrations from 0 to 30 g/dL.
Photonics 12 00933 g013
Figure 14. Block diagram of the proposed sensor structure for implementation in practical works.
Photonics 12 00933 g014
Table 1. The normal level of Hemoglobin for different stages of life [3].
Stages of LifeNormal Level of Hb (g/dL)
Adult men13.0–17.5
Adult women12.0–15.3
Neonates14.0–24.0
Table 2. The values of the parameters for the proposed OF.
ParametersValues (µm)
d10
d110
d215
d310
d415
d55
Table 3. Important parameter values for meshing the proposed structure.
RegionMaximum Element Size (µm)Minimum Element SizeMaximum Growth RateCurvature Factor
Gold4.440.0151.250.25
Silica2.40.0091.20.25
Analyte1.20.00241.10.2
Table 4. The values of the important parameters for different RIs range from 1.34 to 1.41.
RIλpeakSW (nm/RIU)SA (RIU−1)FWHM (nm)FOM (RIU−1)R (RIU)
1.346402000−327.5218.25109.584 × 10−5
1.356652500−327.5221.53116.114 × 10−5
1.366903000−484.4132.6591.883.33 × 10−5
1.377204500−1310.1033.45134.521.81 × 10−5
1.387755500−3275.2038.46143.001.33 × 10−5
1.398507500−3395.5045.16166.076.89 × 10−6
1.497012,000−3385.1051.32282.542.59 × 10−6
1.41135038,000−1128052.27736.561.85 × 10−6
Table 5. Comparison between the calculated parameters of the proposed sensor with the sensors reported in the introduction.
ReferencesRI RangeSw (nm/RIU) aSA (RIU−1)Resolution (RIU)FOM (RIU−1)
[29]1.33–1.414,933.34-6.69 × 10−6401.05
[30]1.33–1.3825,00014114 × 10−6502
[31]1.33–1.4228,00068295 × 10−62800
[32]1.34–1.4134,800-2.86 × 10−6229
[38]1.26–1.427,500-6 × 10−6634.1
Proposed OF1.34–1.4138,00011,2801.85 × 10−6736.56
a The highest sensitivity.
Disclaimer/Publisher’s Note: The statements, opinions and data contained in all publications are solely those of the individual author(s) and contributor(s) and not of MDPI and/or the editor(s). MDPI and/or the editor(s) disclaim responsibility for any injury to people or property resulting from any ideas, methods, instructions or products referred to in the content.