Article

Research on Polar-Axis Direct Solar Radiation Spectrum Measurement Method

1
School of Optoelectronic Engineering, Changchun University of Science and Technology, Changchun 130022, China
2
School of Artificial Intelligence, Changchun University of Science and Technology, Changchun 130022, China
3
Jilin Optoelectronic Measurement and Control Instrument Engineering Technology Research Center, Changchun 130022, China
4
Key Laboratory of Optoelectronic Measurement and Control and Optical Information Transmission Technology of Ministry of Education, Changchun 130022, China
5
State Key Laboratory of High Power Semiconductor Laser, Changchun University of Science and Technology, Changchun 130022, China
6
Chongqing Academy of Metrology and Quality Inspection, Chongqing 401123, China
7
Army Academy of Armored Forces, Changchun 130021, China
*
Author to whom correspondence should be addressed.
Photonics 2025, 12(9), 931; https://doi.org/10.3390/photonics12090931
Submission received: 13 August 2025 / Revised: 1 September 2025 / Accepted: 17 September 2025 / Published: 18 September 2025

Abstract

High-precision measurements of direct solar radiation spectra are crucial for the development of solar resources, climate change research, and agricultural applications. However, the current measurement systems all rely on a moving two-axis tracking system with a complex structure and many error transmission links. In response to the above problems, a polar-axis rotating solar direct radiation spectroscopic measurement method is proposed, and an overall architecture consisting of a rotating reflector and a spectroradiometric measurement system is constructed, which simplifies the system’s structural form and enables year-round, full-latitude solar direct radiation spectroscopic measurements without requiring moving tracking. The paper focuses on the study of its optical system, optimizes the design of a polar-axis rotating solar direct radiation spectroscopy measurement optical system with a spectral range of 380–780 nm and a spectral resolution better than 2 nm, and carries out spectral reconstruction of the solar direct radiation spectra as well as the assessment of measurement accuracy. The results show that the point error distribution of the AM0 spectral curve ranges from −9.05% to 13.35%, and the area error distribution ranges from −0.04% to 0.09%; the point error distribution of the AM1.5G spectral curve ranges from −9.19% to 13.66%, and the area error distribution ranges from −0.03% to 0.11%. Both exhibit spatial and temporal uniformity exceeding 99.92%, ensuring excellent measurement performance throughout the year. The measurement method proposed in this study enhances the solar direct radiation spectral measurement system. Compared to the existing dual-axis moving tracking measurement method, the system composition is simplified, enabling direct solar radiation spectrum measurement at all latitudes throughout the year without the need for tracking, providing technical support for the development and application of new technologies for solar direct radiation measurement. It is expected to promote future theoretical research and technological breakthroughs in this field.

1. Introduction

The direct solar irradiance spectrum serves as a fundamental data source for solar energy exploitation [1], climate change studies [2], and agricultural yield prediction [3], with its high-precision measurement being critical for advancing renewable energy technologies and Earth system modeling [4,5]. Accurate solar tracking is the basis of direct solar radiation spectroscopy measurement, and the current stage of solar tracking technology is mainly the mobile tracking method [6,7], of which, in 2016, the STR series of dual-axis mobile tracking system developed by EKO, Japan, combines GPS with four-quadrant sensors [8], which controls the tracking error within 0.01°, but its mechanical complexity restricts large-scale applications. In 2020, Nurzhigit Kuttybay et al. showed that although single-axis moving tracking devices lagged behind dual-axis moving tracking devices in terms of tracking accuracy, single-axis moving tracking devices were cheaper to install and operate [9]. In 2021, Junying Wong et al. designed a 1.5-axis moving tracking scheme aimed at balancing the advantages and disadvantages of single-axis and dual-axis tracking systems to improve solar tracking efficiency; however, its performance is limited under certain conditions [10]. With the development of solar tracking technology, dual-axis moving tracking has become the main tracking method in the field of direct solar radiation spectroscopy measurement nowadays [11,12], among which Barreto áfrica et al. in 2016 achieved a direct solar radiation spectroscopy measurement error of better than 3% for eight spectral channels within the range of 340–1640 nm by using the filter stacking technique [13]. In the same year, the POM-02 solar spectrometer introduced by PREDE, Japan, achieved a direct solar radiation spectral measurement error of better than 2% for 11 spectral channels over a wide wavelength range from 315 nm to 1020 nm [14]. In 2019, Tatsiankou V et al. developed a solar direct radiation spectroscopic measurement device utilizing concave gratings [15], achieving solar direct radiation spectroscopic measurements in the spectral range of 350–1000 nm with a resolution of 1.4 nm with a measurement error of better than 2%. In 2021, Z Qi et al. developed a novel solar-sky spectral radiometer utilizing different transmittance filters, which realized solar direct radiation spectral measurements in the spectral range of 380–1100 nm with a resolution of 2 nm and a measurement error better than 5% [16]. However, due to the high maintenance cost, complicated error transmission, and insufficient latitude adaptability of the mobile tracking device [17], the solar direct radiation spectral measurement device has never been widely used [18]. In order to solve the shortcomings of the moving tracking device, in 2022, Yang et al. utilized a free-form surface reflector with a polar-axis rotating mirror tracking method, which possessed the ability to control the reflected direct solar beam, and realized the homogeneous collection of direct solar radiation at full latitude [19]. On this basis, in 2025, Mo Xiaoxu et al. designed a solar direct radiation measurement reflector [20], which produced large progress in the precise control of the beam, with an irradiance uniformity of 97.95% in the spatial and temporal scales within the 3 mm diameter spot range but still did not have the capability of solar direct radiation spectral measurement. In 2025, Sun et al. proposed a method for measuring the direct solar radiation spectrum based on a free-form surface and polar axis rotation [21] and constructed a brand-new system architecture that does not require moving tracking, enabling the measurement of the direct solar radiation spectrum throughout the year and across all latitudes. However, due to the presence of slits, the optical system requires strict coupling, making it difficult to design and requiring high processing standards.
In summary, in the current field of direct solar radiation measurement, the solar tracking method has evolved from the traditional mobile tracking method to the polar-axis rotation tracking method. Additionally, the mirror surface type in the polar-axis rotation tracking method has also advanced from the frosted surface to the free-form surface. However, due to issues such as the complex coupling of optical systems, high design difficulty, and stringent requirements for processing precision, direct solar radiation spectral measurement without tracking remains challenging to achieve. To this end, this paper proposes a polar-axis-based direct solar radiation spectrum measurement method. It constructs a system architecture comprising a polar-axis rotating mirror and a Solar Spectral Measurement System. An optical system is designed to enable unconstrained light propagation within the system, facilitating polar-axis direct solar radiation spectrum measurements. Furthermore, a solar spectral reconstruction chain utilizing isospectral lines is established, achieving direct solar radiation spectrum measurements without tracking. The polar axis solar direct radiation spectroscopy measurement optical system designed in this article overcomes the error accumulation problem of traditional biaxial tracking and provides a new technological paradigm for high-precision solar direct radiation spectroscopy measurement, which is of great significance in the fields of industry and science. In industry, high-precision spectral data support can be provided for fields such as photovoltaics, agriculture, and environmental protection, assisting in the technological upgrading and precision development of related fields. In science, it not only provides new free-form surface design ideas for optical engineering and promotes the development of lightweight and low-cost spectroscopic instruments but also provides more reliable observation methods for disciplines such as meteorology, climate, and solar physics, which helps to promote interdisciplinary and technological innovation.

2. Overall Architecture and Measurement Principle of Polar-Axis Solar Direct Radiation Spectrum Measurement System

The celestial motion of the Sun can be precisely characterized by its altitude angle and azimuth angle. At noon on the vernal and autumnal equinoxes, the Sun’s direct rays strike the ground perpendicularly (assuming the incidence angle of the Sun’s direct rays at this time is 0°). The incidence angle of the Sun’s direct rays varies by no more than ±23.5° throughout the year, while the Sun’s azimuth angle ranges between ±90° [22]. Therefore, Direct solar radiation spectrum measurement can be achieved using free-form mirrors [23] and dispersive optical path structures [24]. The overall architecture of the polar-axis direct solar radiation spectrum measurement system (PADS) constructed in this study consists of two parts: a polar-axis rotating reflector and a solar spectrum measurement system. Among them, the polar-axis rotating mirror, through its surface characteristics and rotation around the axis, is responsible for reflecting direct solar radiation within a range of ±23.5° of solar altitude angle and ±90° of solar azimuth angle to the solar spectrum measurement system. In currently common grating spectroscopic measurement systems, slits can reduce the utilization efficiency of incident light, thereby affecting measurement performance [25,26]. To allow light to propagate freely within the system space to the solar spectrum measurement system, the solar spectrum measurement system adopts a cross-type Czerny-Turner optical path structure [27] and is combined with a polar-axis rotating mirror for an optimized design to avoid interference from the slit on light beams entering the system at different solar incidence angles. Reduced the coupling requirements between optical systems, decreased the difficulty of optical system design, and lowered the processing difficulty of optical systems. The overall architecture of the PADS is shown in Figure 1.

3. Joint Optimization Design of Solar Spectral Measurement System and Polar-Axis Rotating Mirror

The wavelength of direct solar radiation covers 280–3000 nm, of which about 50% of the solar radiation energy is concentrated in the visible spectral region between 380–780 nm [28]. For this purpose, 380–780 nm was selected as the operating wavelength range for the system. The solar spectral measurement system is the core part of the spectral measurement. Therefore, its initial structure should be constructed first, and its grating diffraction equation: [29,30]
d ( sin θ i ± sin θ d ) = m λ ,
where d is the grating period, λ is the incident wavelength, m is the diffraction level, θ i and θ d are the angle of incidence and the diffraction angle of the corresponding diffraction level m, respectively; ± depends on the reflection or transmission grating. At this time, the grating color resolution ability formula is as follows:
δ λ = d λ d θ δ θ = λ m N
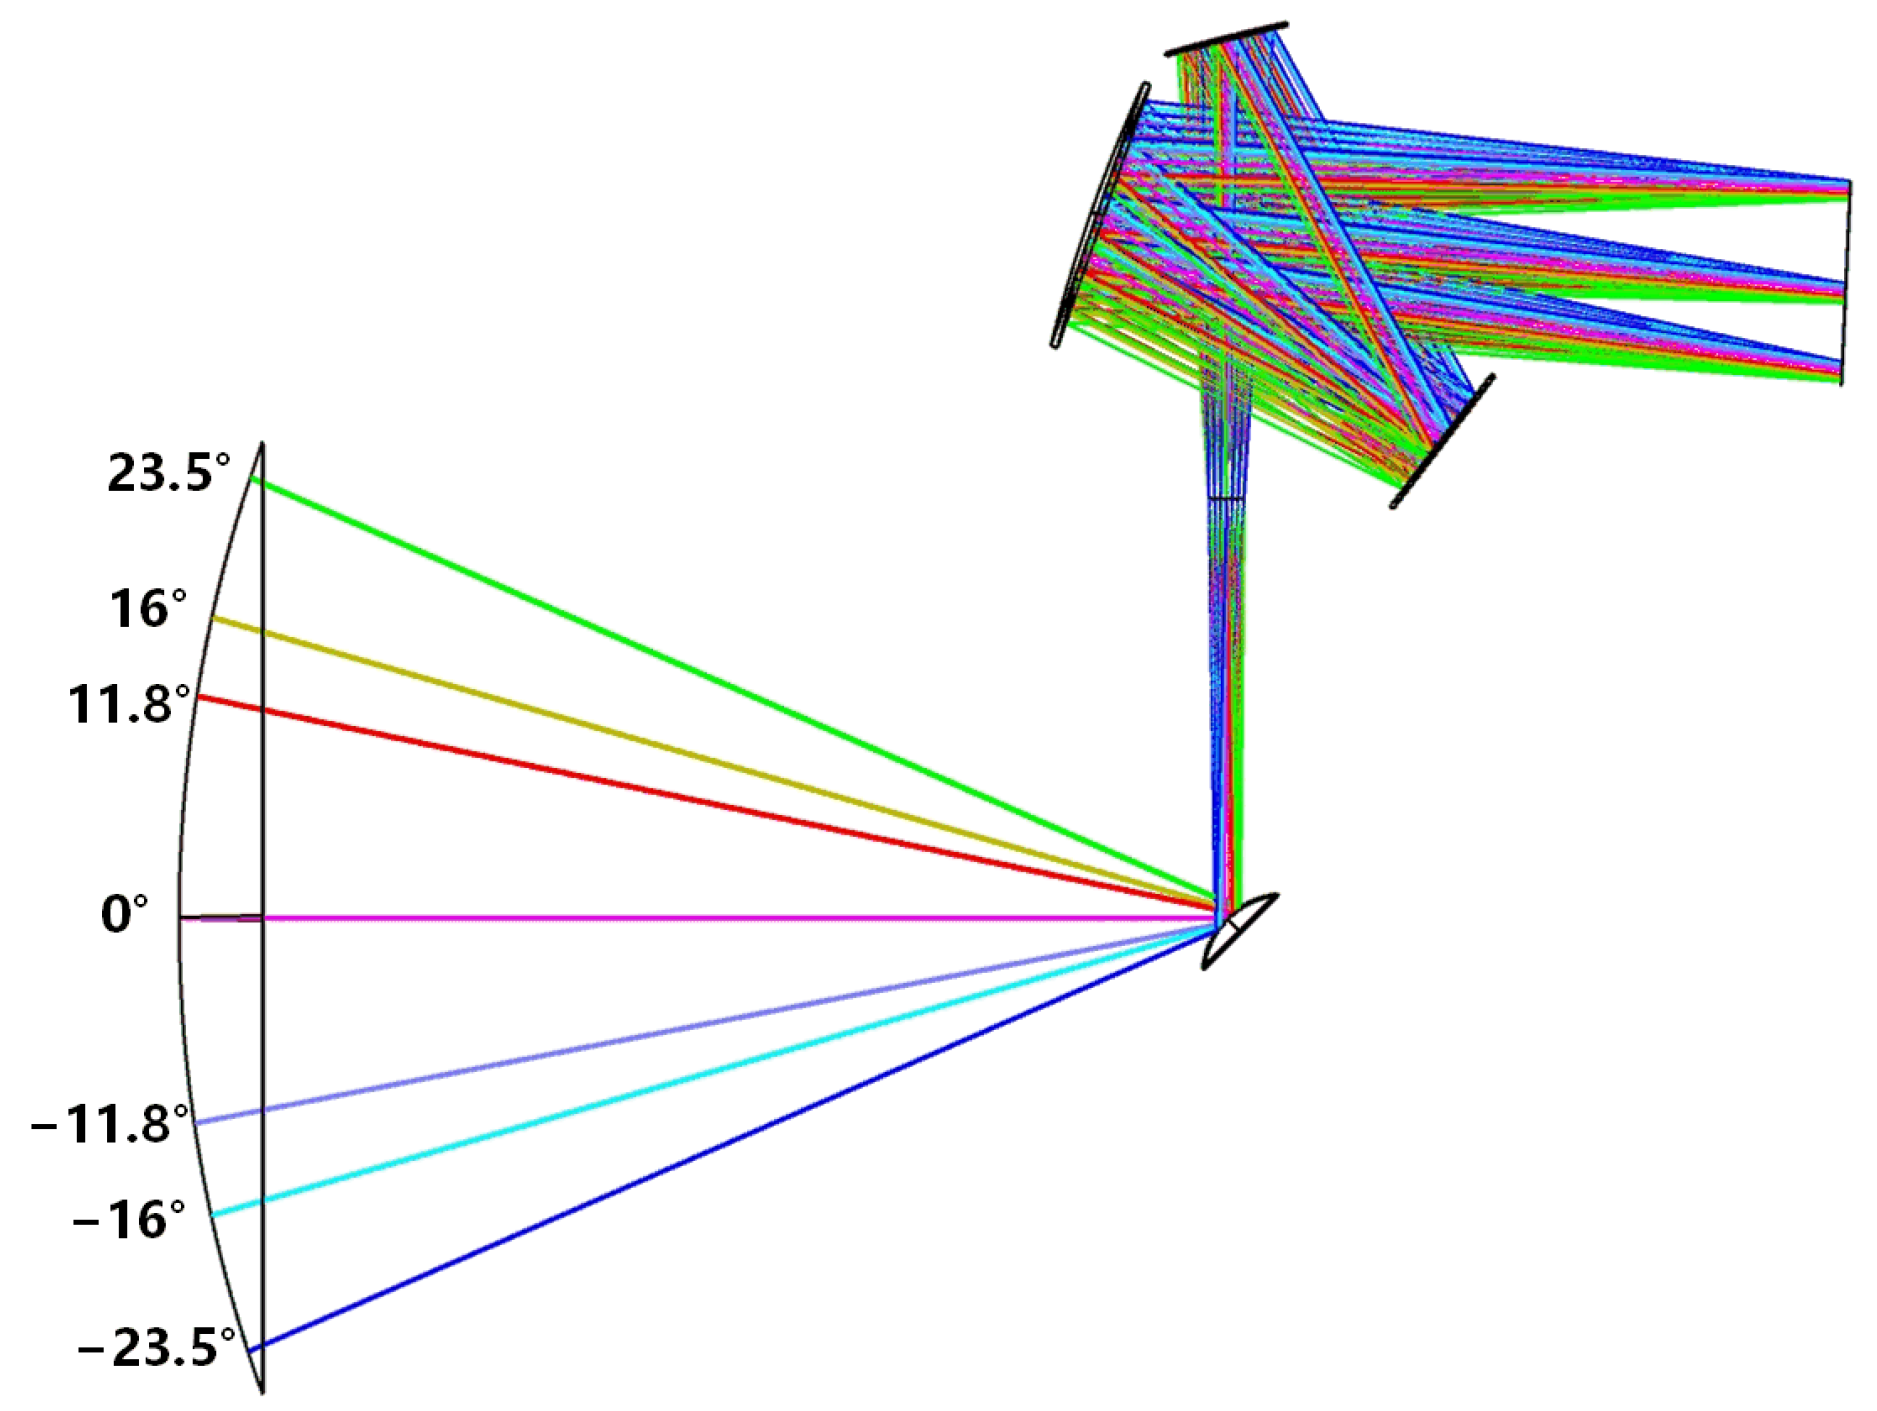
where N is the number of grating lines. Set the incident diffraction angle ϕ of the grating to 30°. Based on the grating diffraction equation, calculate the incident angle θ i of the grating to be 18.4° and the diffraction angle θ d of the grating to be 11.6°. The sensor uses a 1-inch CCD device with pixel dimensions of 8 µm × 200 µm, totaling 3648 pixels. The wavelength response range is 300–1100 nm, and the grating line count is selected as 400 lines/mm [31]. Based on the grating dispersion characteristics and aberration theory, the focal length of the collimating reflector of the initial structure of the solar spectral measurement system was solved to be 185 mm, and the focal length of the focusing reflector was 150 mm [32]. On this basis, to meet the solar altitude angle range of −23.5°~+23.5° and the coupling requirements between the polar-axis rotating mirror and the solar spectrometry system, the polar-axis rotating mirror was selected to be an XY polynomial free-form surface [33]. The polar-axis rotating mirror and the solar spectrometry system were co-optimized with the individual field-of-view spectral resolution of 2 nm as the optimization target. The optimized optical path of the polar-axis solar direct radiation spectrometry optical system is shown in Figure 2.
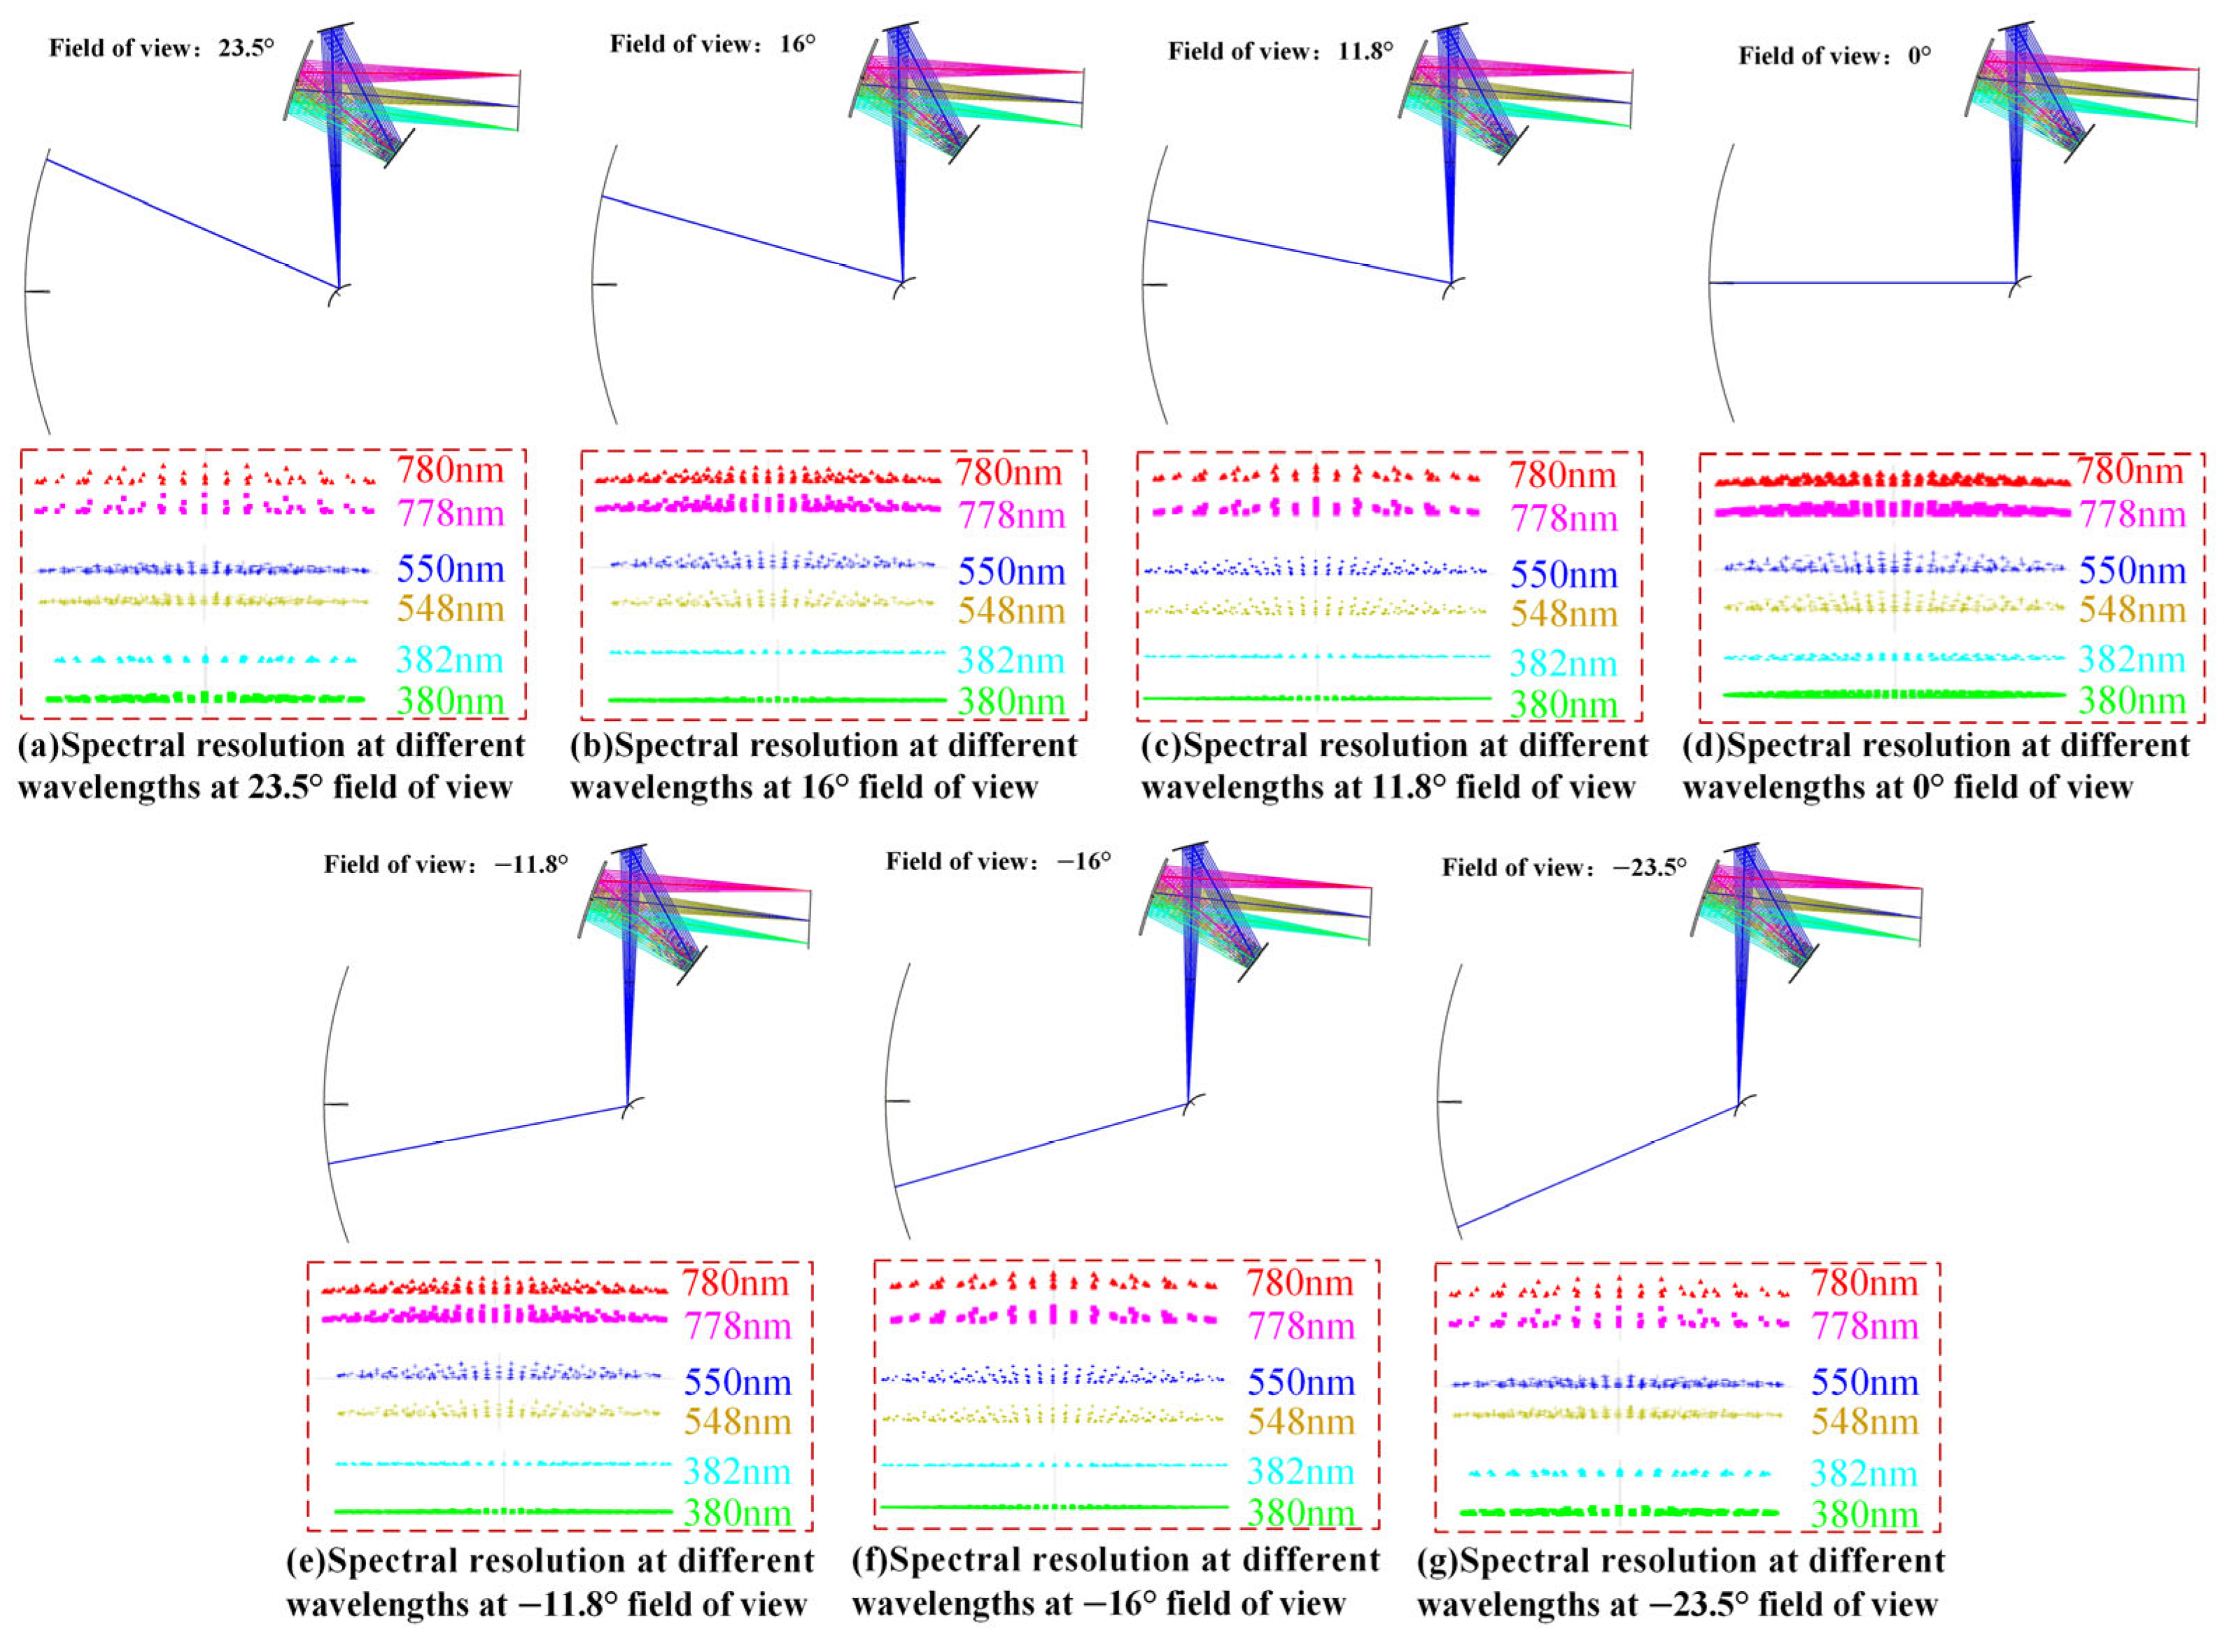
At this time, the spectral resolution of the full-band wavelengths at ±23.5°, ±16°, ±11.8°, and 0° is shown in Figure 3. At these angles, the wavelengths of 380–382 nm, 548–550 nm, and 778–780 nm can be clearly distinguished, indicating that the measurement spectral resolution of the polar-axis solar direct radiation spectral measurement optical system is better than 2 nm within the solar elevation angle range of −23.5° to +23.5°.

4. Multi-Angle Response Analysis and Spectral Reconstruction Method for PADS

To support the high-precision reconstruction of subsequent AM0 or AM1.5G solar spectra, and to avoid the impact of uncertainties in the light source spectrum on the reconstruction results during the reconstruction process. This paper utilized the Lighttools optical simulation software, employing the non-sequential ray tracing simulation based on the Monte Carlo method to construct the three-dimensional model of the system. During the simulation process, 10 million direct solar radiation rays were simulated at each angle. And uses isospectral analysis to analyze the multi-angle response of the PADS, and based on this, obtains the spectral reconstruction coefficients corresponding to each angle.
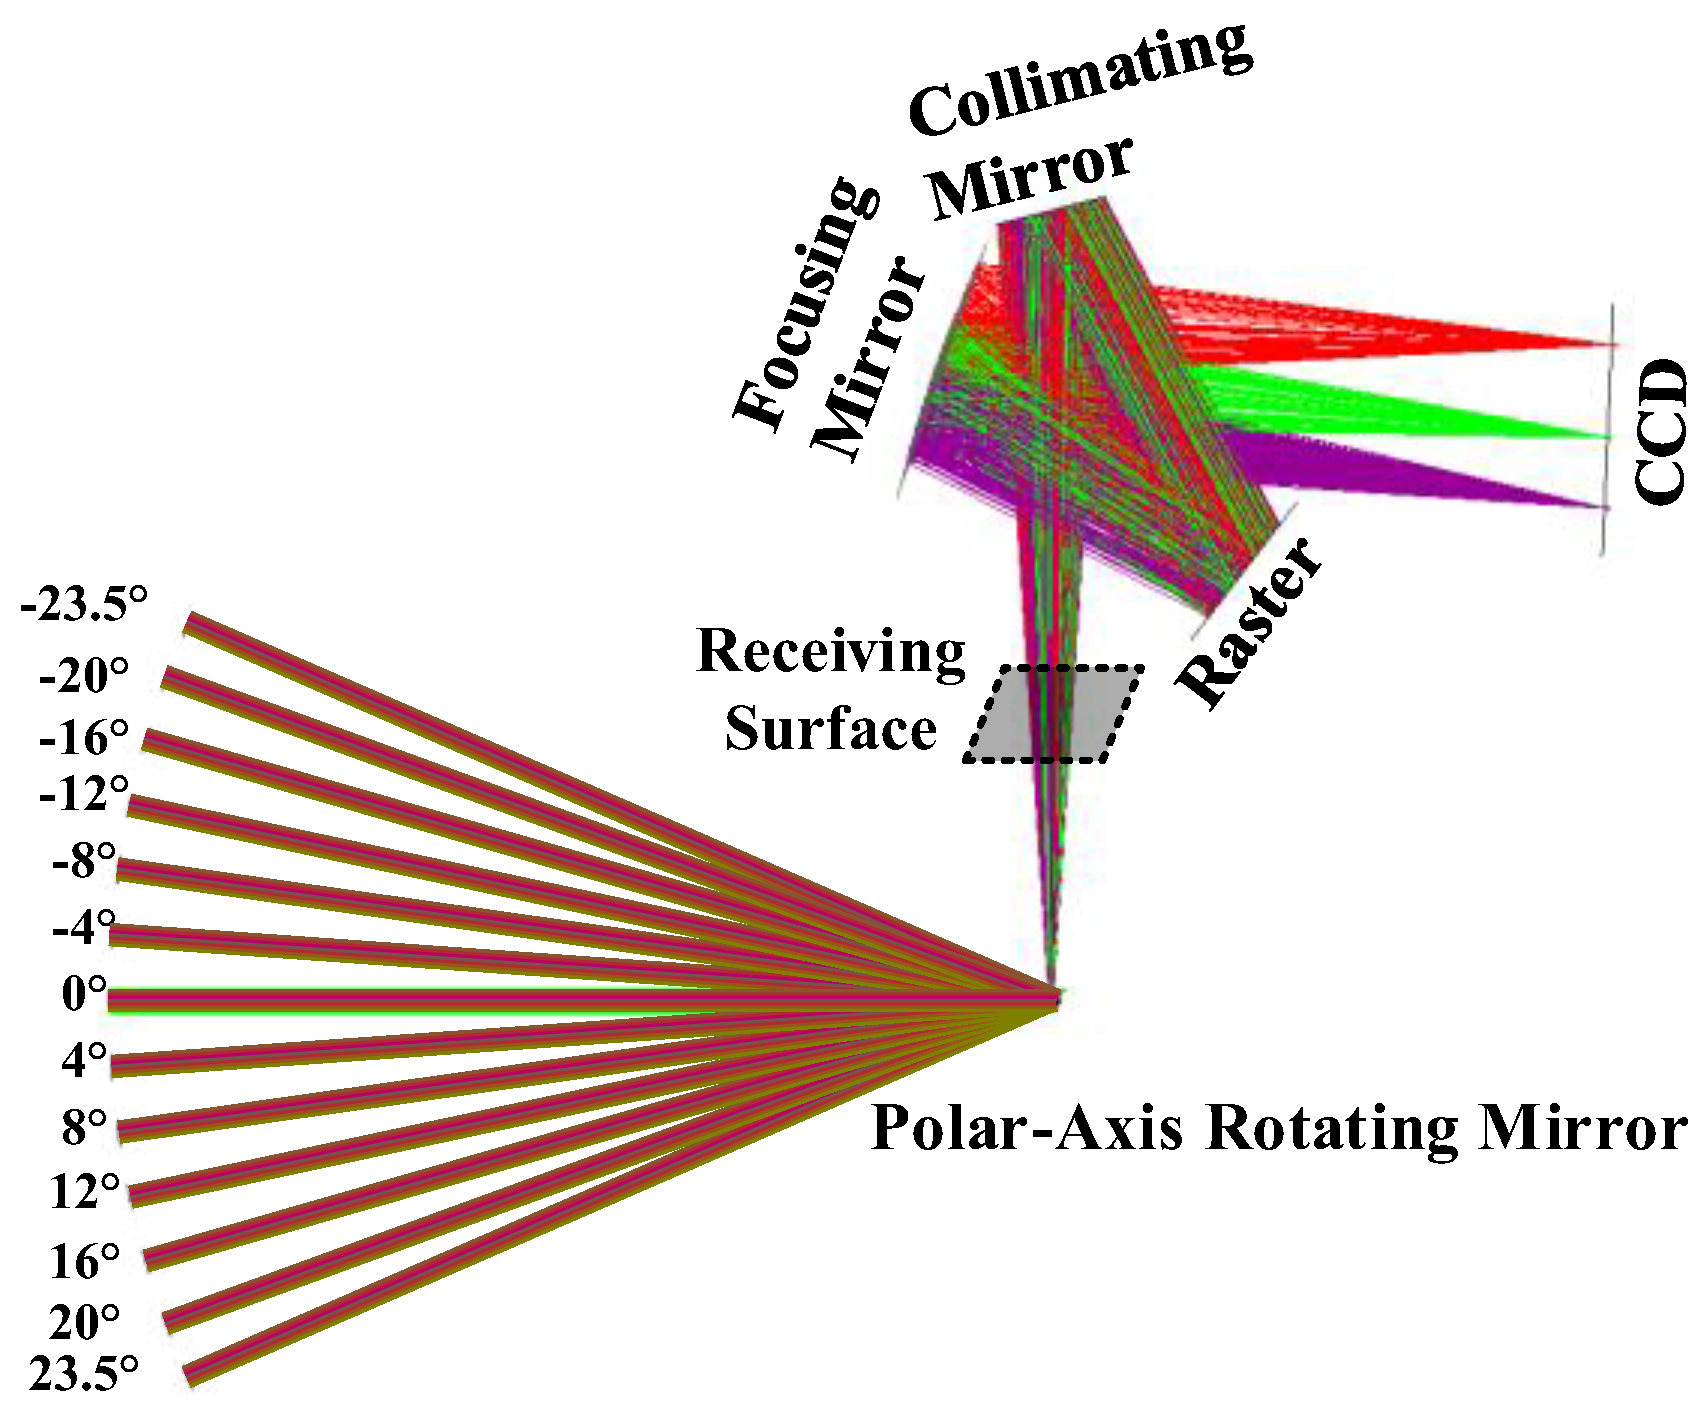
Based on the joint optimization design results of the polar-axis rotating reflector and the solar spectrum measurement system, Using 13 angular positions of −23.5°, −20°, −16°, −12°, −8°, −4°, 0°, 4°, 8°, 12°, 16°, 20°, and 23.5° as incident light sources, with a divergence angle of 32′ for the light rays, a simulation model of the polar-axis type direct solar radiation spectral measurement system was established, as shown in Figure 4.
Assuming that the energy of the incident light rays at each angle is consistent, a receiver is placed at the focal point of the collimating mirror of the spectral radiation measurement system to measure the direct solar radiation energy at each angle entering the PADS. The response results of the PADS at each angle are shown in Figure 5.
According to Figure 5, when light propagates freely in the space of the PADS, the overall energy of the direct solar radiation spectrum at each angle shows a trend of being low on both sides, high in the middle, and high on the left and low on the right. The maximum error and deviation between the energies at different angles is 6.14%, but the overall energy distribution remains relatively stable, demonstrating good angular consistency. This avoids the interference caused by the slit in the traditional cross-type Czerny-Turner optical path structure on light beams entering the system at different solar incidence angles, providing a solid foundation for subsequent solar spectrum reconstruction.
At this point, the spectral curve measurement results of the incident light rays from various angles reaching the CCD detector are shown in Figure 6a. At the same angle, the energy value in the direction of the shorter wavelength is higher than that in the direction of the longer wavelength. After the solar spectrum is systematically dispersed, different wavelengths have fixed positional correspondences on the CCD. Therefore, in this paper, this positional mapping is taken as the benchmark for spectral reconstruction. Let the incident angle be α , the wavelengths be λ ( α ) 1 , λ ( α ) 2 , , λ ( α ) n , the corresponding CCD positions be m ( α ) 1 , m ( α ) 2 , , m ( α ) n , and the measured energy distributions be φ ( α ) 1 , φ ( α ) 2 , , φ ( α ) n . At this point, the theoretical energy values corresponding to the target curve at each wavelength should be ϕ ( α ) 1 , ϕ ( α ) 2 , , ϕ ( α ) n . Let the measurement reconstruction coefficient at this point be k ( α ) 1 , k ( α ) 2 , , k ( α ) n , then k ( α ) n = φ ( α ) n ϕ ( α ) n . The reconstruction coefficients for each angle are shown in Figure 6b. These coefficients are directly used to correct the actual solar spectral measurement data to compensate for the response deviation of the system with angle.

5. Accuracy Evaluation of Polar-Axis Direct Solar Radiation Measurement System Based on AM0 and AM1.5G Spectra

In order to evaluate and analyze the measurement accuracy of the PADS under different solar spectra, this paper uses typical AM0 [34] and AM1.5G [35] solar spectra for evaluation. By replacing the incident spectrum in the PADS simulation model with AM0 and AM1.5G solar spectra, respectively, and evaluating the accuracy of the reconstructed measurement results from three aspects: measurement accuracy evaluation of AM0 solar spectrum reconstruction, measurement accuracy evaluation of AM1.5G solar spectrum reconstruction, and comparison of the two. The evaluation indicators selected are point error R E w ( λ i ) for detailed evaluation, area error R E a ( λ i ) for overall evaluation, and RFUS for evaluation of measurement accuracy throughout the year. The specific formulas for the three evaluation indicators are as follows:
R E w = E P o s t R e c o n s t r u c t i o n ( α ,   λ i ) E S t a n d a r d ( λ i ) E S t a n d a r d ( λ i )
R E a = ϕ P o s t R e c o n s t r u c t i o n ( α i ) ϕ S t a n d a r d ϕ S t a n d a r d
R F U S = 1 ϕ M a x ϕ M i n ϕ M a x + ϕ M i n
In the formula, E S t a n d a r d ( λ i ) is the standard AM solar spectrum, E P o s t R e c o n s t r u c t i o n ( α ,   λ i ) is the measured value of the reconstructed direct solar radiation spectrum, and ϕ P o s t R e c o n s t r u c t i o n ( α i ) = 380 780 E P o s t R e c o n s t r u c t i o n ( α ,   λ i ) d λ , ϕ S t a n d a r d A M X = 380 780 E S t a n d a r d ( λ i ) d λ , ϕ M a x , and ϕ M i n are the maximum and minimum values of ϕ P o s t R e c o n s t r u c t i o n ( α i ) , respectively.
(1)
Assessment of the measurement accuracy of AM0 solar spectrum reconstruction
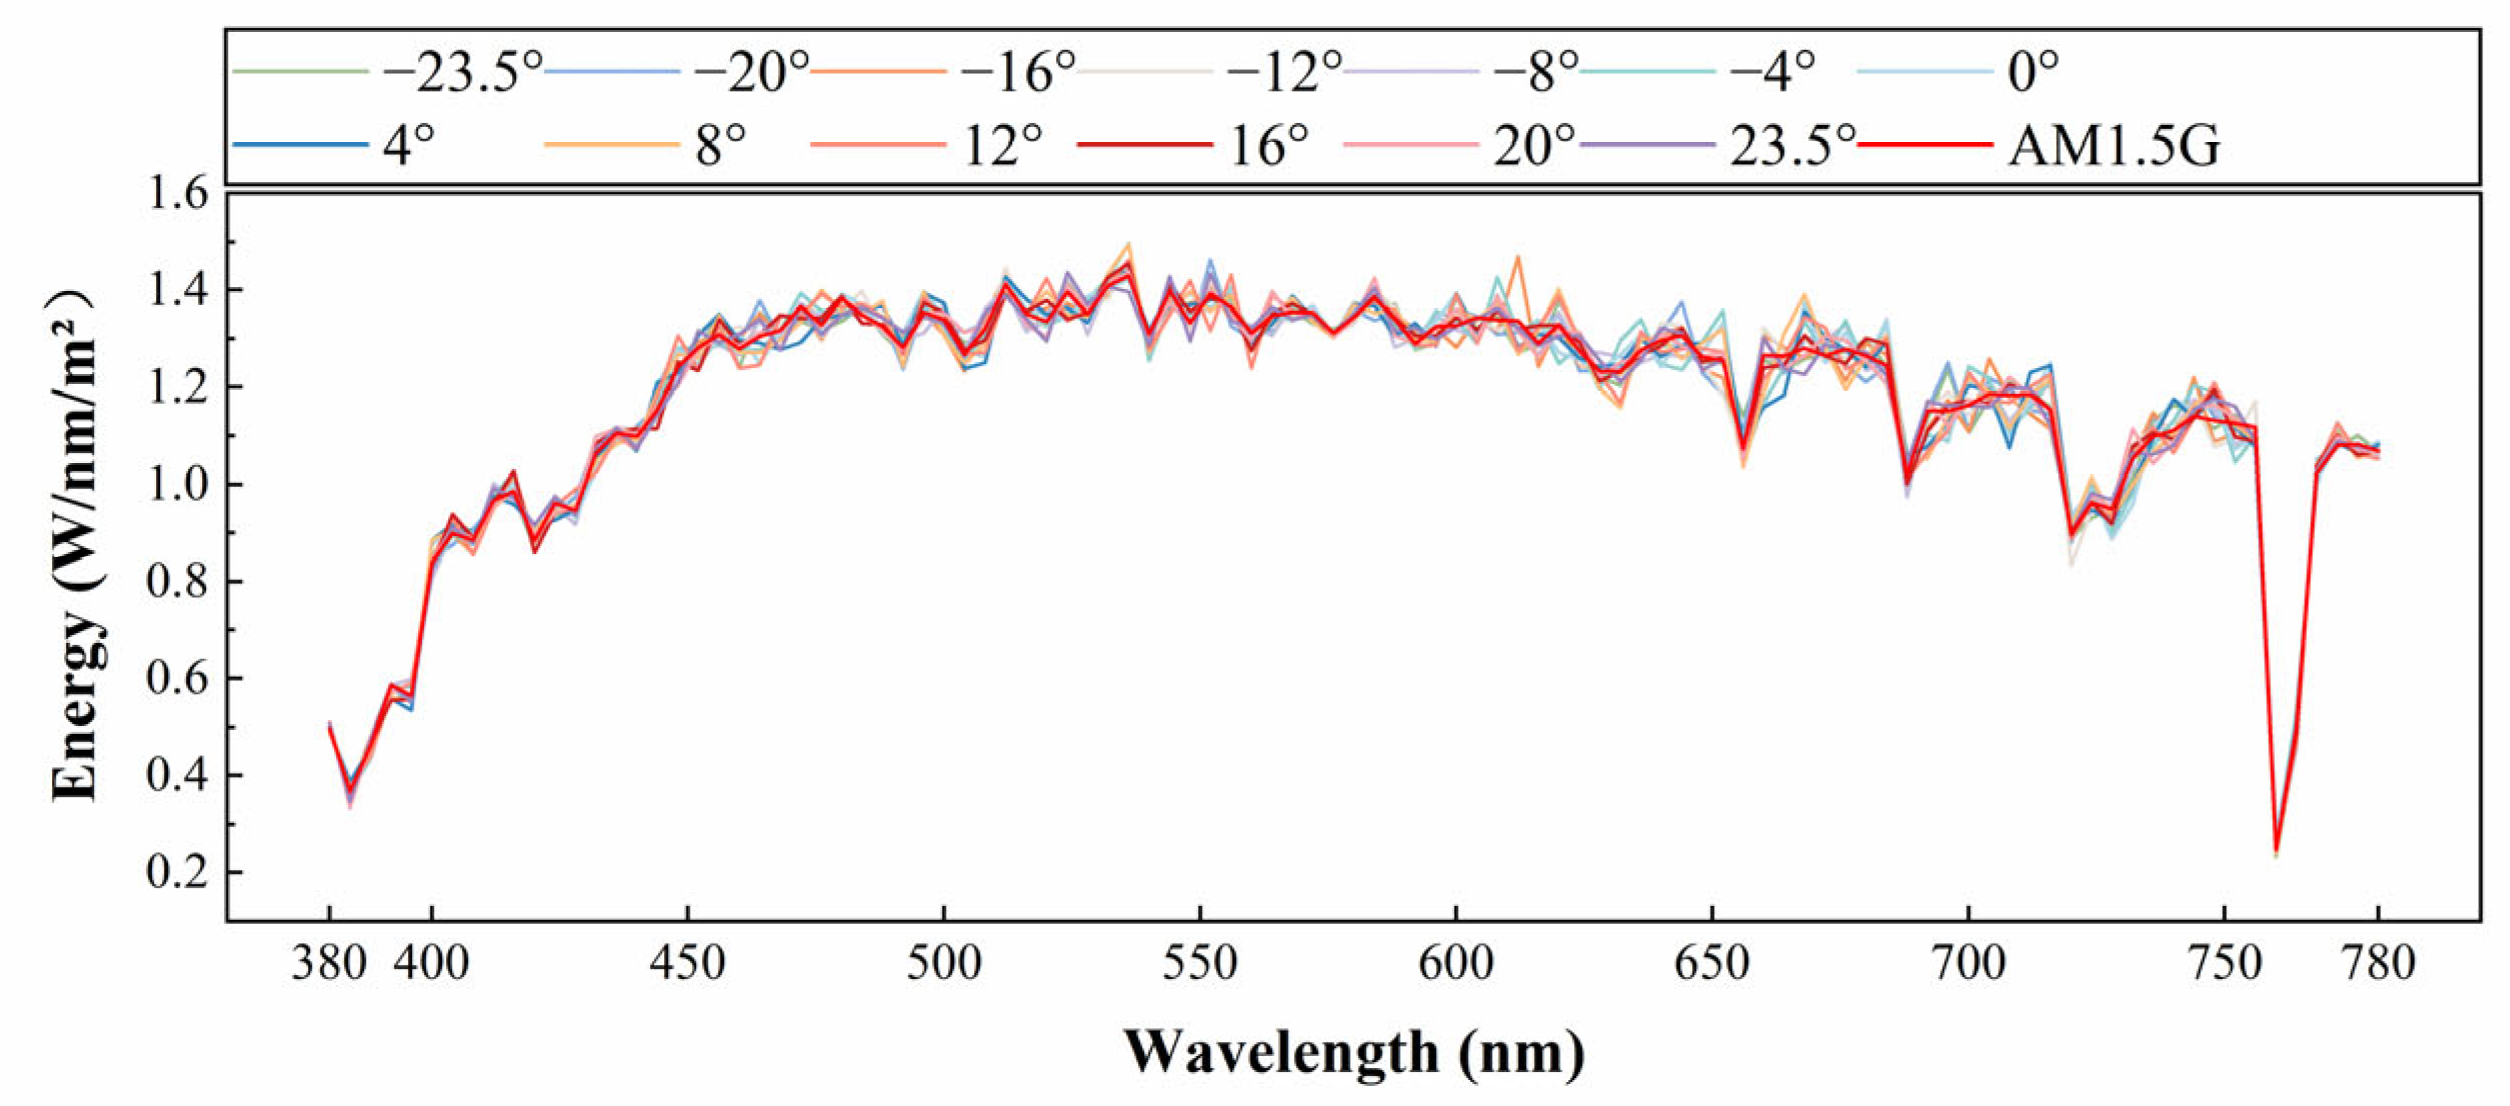
Using the AM0 solar spectrum as the incident spectrum curve, the reconstructed direct solar radiation spectrum for each angle is shown in Figure 7.
The red curve in Figure 7 is the standard AM0 solar spectrum curve. The spectrum curves reconstructed from the direct solar radiation spectrum at various angles are consistent with the AM0 spectrum curve, especially in the 380–540 nm range. The curves in the 540–780 nm range fluctuate more randomly, but are distributed around the standard AM0 curve. The violin plot for the R E w ( λ i ) results (solid dots represent the mean, box plots represent the standard deviation, and colored areas represent the error distribution) is shown in Figure 8a, and the distribution of the incident angles R E a ( λ i ) is shown in Figure 8b.
Figure 8a shows that the value of R E w ( λ i ) varies between −9.05% and 13.35% at different angles, with an average of 0.03%. The maximum error of 13.35% occurs at the 740 nm wavelength for 0° incident light angle, but this is the only point where the error exceeds 10%. The standard deviation is largest at 2.59% when the incident angle is 8°. Figure 8b shows that R E a ( λ i ) ranges from −0.04% to 0.09%, with the maximum error of 0.09% occurring at the 8° incident light. At this point, the RFUS can be calculated to be 99.93%.
(2)
Assessment of measurement accuracy of AM1.5G solar spectrum reconstruction
Using the AM1.5G solar spectrum as the incident spectrum curve, the reconstructed direct solar radiation spectrum at each angle is shown in Figure 9.
The red curve in Figure 9 is the standard AM1.5G solar spectrum curve. The measurement results after reconstruction at various angles are basically consistent with the AM1.5G curve, and the characteristic peaks are all present. A sharp peak appears at 610 nm, but it is distributed around the standard AM1.5G curve. The violin plot of the R E w ( λ i ) results (solid dots represent the mean, box plots represent the standard deviation, and colored areas represent the error distribution) is shown in Figure 10a, and the distribution of each incident angle R E a ( λ i ) is shown in Figure 10b.
Figure 10a shows that the value of R E w ( λ i ) varies between −9.19% and 13.66% at different angles, with an average of 0.02%. The maximum error of 13.66% occurs at the 760 nm wavelength for −8° incident light angle, but this is the only point where the error exceeds 10%. The standard deviation is largest at 2.86% when the incident angle is 8°. Figure 8b shows that R E a ( λ i ) ranges from −0.03% to 0.011%, with the maximum error of 0.11% occurring at the 8° incident light. At this point, the RFUS can be calculated to be 99.93%.
(3)
Comparison of AM0 and AM1.5G solar spectrum accuracy assessment
The spectral reconstruction accuracy of AM0 and AM1.5G, as well as the RFUS comparison, are shown in Table 1.
A comparative analysis of the AM0 and AM1.5G direct solar radiation spectrum measurement results shows that the two are highly consistent in terms of core accuracy indicators. The R E w ( λ i ) distributions are close to normal, with average errors as low as 0.03%. However, the maximum R E w ( λ i ) values significantly exceed 13%. Specifically, the AM0 spectrum reaches 13.35% at an incident angle of 0° and a wavelength of 740 nm, while the AM1.5G spectrum reaches 13.66% at an incident angle of −8° and a wavelength of 760 nm. This result clearly indicates that the system shows significant sensitivity in the long wavelength band (740–760 nm). The main reasons for this include two aspects: Firstly, this wavelength band is at the edge of the optical system’s response range, with a relatively low diffraction efficiency; Secondly, there is a distinct trough in the AM1.5G solar spectrum near this wavelength. The combined effect of these two factors reduces the reconstruction accuracy within this wavelength band. The R E a ( λ i ) are all very small, with the AM0 spectrum reaching a maximum value of 0.09% at an incident angle of 8°, and the AM1.5G spectrum reaching a maximum value of 0.11% at an incident angle of 12°. This confirms that the measured spectra at various angles are highly similar in overall shape to the standard spectra. Notably, the R E a ( λ i ) peak values for AM0 and AM1.5G occur at different incident angles, and the standard deviation peaks for R E a ( λ i ) both occur at an 8° incident angle, suggesting that solar spectral conditions have a weak influence on the system’s measurement results. Most importantly, the RFUS of both spectra exceeded 99.92% in terms of spatio-temporal uniformity, strongly demonstrating the system’s high adaptability (robustness) to changes in the incident angle within a range of ±23.5°, enabling it to meet the requirements for high-precision measurements throughout the year and across all latitudes.

6. Conclusions and Outlook

Existing direct solar radiation spectrum measurement systems rely on complex and costly dual-axis tracking devices, which severely limit the stability and practicality of the measurement system. Furthermore, the polar axis rotation tracking method has not yet been applied in the field of direct solar radiation spectrum measurement. To achieve direct solar radiation spectrum measurement without tracking movement, the conclusions of this study are as follows:
(1)
This study is the first to apply the polar-axis tracking method to the field of direct solar radiation spectrum measurement. It constructs the overall architecture of a polar-axis rotating direct solar radiation spectrum measurement system composed of a polar-axis rotating mirror and a Solar Spectral Measurement System, simplifies the structure of traditional direct solar radiation measurement systems, realizes direct solar radiation spectrum measurement without the need for mobile tracking throughout the year and across all latitudes, and further improves the theoretical system of direct solar radiation spectrum measurement.
(2)
The polar-axis rotating mirror and solar spectral measurement system were jointly optimized to achieve a spectral resolution of 2 nm in each field of view. This allows the solar beam reflected by the polar-axis rotating mirror to propagate freely within the system space to the solar spectral measurement system, reducing the constraints on measurement energy compared to the aperture.
(3)
Based on the design results of the polar-axis direct solar radiation spectrum measurement optical system, a direct solar radiation spectrum reconstruction model was established, with 13 angle light sources (−23.5°, −20°, −16°, −12°, −8°, −4°, 0°, 4°, 8°, 12°, 16°, 20°, and 23.5° (the spectral distribution is an equal energy spectrum)) to simulate the incident direct solar radiation, and the experimental results and reconstruction coefficients for each angle were obtained. Using the AM0 and AM1.5G solar spectra as examples, the performance parameters of the system were verified through simulation. The results show that the direct solar radiation spectrum distribution of the incident angle of direct sunlight at various angles after reconstruction is consistent with the AM0 and AM1.5G solar spectrum distribution. The point errors are distributed between −9.05% and 13.35% and −9.19% and 13.66%, respectively. However, the average errors were only 0.03% and 0.02%, indicating that individual points influenced the error intervals, with area errors ranging from −0.04% to 0.09% and −0.03% to 0.11%, respectively. The overall spectral shapes were highly similar, with spatio-temporal uniformity exceeding 99.92%.
Future research aims to construct a high-precision direct solar radiation spectrum measurement system adapted to extreme global environments. Through optimizing dustproof, waterproof, and corrosion-resistant weatherproof hardware designs to ensure long-term stable operation of equipment, developing intelligent algorithms with dynamic environmental interference calibration and adaptive learning to synergistically improve measurement accuracy and system robustness, and performing optical corrections on free-form mirrors based on World Meteorological Organization traceability standards, precisely compensating for spectral deviations caused by a 2.5° solar aperture angle. Ref. [36] In future research, we will first conduct small-scale, multi-climate field measurements on a single dimension; further improve the reconstruction algorithm; enhance the system performance; and then carry out multi-dimensional field measurements to verify the feasibility and stability of this method for high-precision direct solar radiation spectral measurement. Ultimately, this will achieve a closed-loop solar radiation monitoring technology that is compatible with all climates and traceable to international standards.

Author Contributions

Conceptualization, J.S., Y.Z. (Yangyang Zou) and G.Z.; Data curation, Y.Z. (Yu Zhang) and K.Z.; Formal analysis, J.Y. and Y.S.; Methodology, J.S., L.W. and J.Z.; Project administration, K.Z. and Y.S.; Software, Y.Z. (Yu Zhang) and R.Z.; Validation, J.S. and J.Z.; Writing—original draft, J.S., Y.Z. (Yangyang Zou) and L.W.; writing—review and editing, J.S., J.Z. and Y.Z. (Yangyang Zou). All authors have read and agreed to the published version of the manuscript.

Funding

This research was supported by Jilin Provincial Scientific and Technological Development Program (20230201053GX) and National Natural Science Foundation of China (62305031).

Institutional Review Board Statement

Not applicable.

Informed Consent Statement

Not applicable.

Data Availability Statement

The Dataset is available on request from the authors.

Conflicts of Interest

The authors declare no conflicts of interest.

References

  1. Tahir, Z.R.; Asim, M. Surface measured solar radiation data and solar energy resource assessment of Pakistan: A review. Renew. Sustain. Energy Rev. 2018, 81 Pt 2, 2839–2861. [Google Scholar] [CrossRef]
  2. Wang, Y.; Yuan, Q.; Li, T.; Zhu, L.; Zhang, L. Causes for Asymmetric Trends in Surface Solar Radiation over China: Emission Reduction and Meteorological Influence. Atmos. Chem. Phys. 2021, 21, 13383–13399. [Google Scholar]
  3. Khan, N.; Xu, X.; Ahsan, F. Solar empowerment in agriculture: Investigating photovoltaic energy’s impact on efficiency among wheat farmers. Front. Sustain. Food Syst. 2024, 8, 1426538. [Google Scholar] [CrossRef]
  4. Budiyanto, M.; Lubis, M. Physical reviews of solar radiation models for estimating global solar radiation in Indonesia. Energy Rep. 2020, 6, 1206–1211. [Google Scholar] [CrossRef]
  5. Opálková, M.; Navrátil, M.; Špunda, V.; Blanc, P.; Wald, L. A database of 10 min average measurements of solar radiation and meteorological variables in Ostrava, Czech Republic. Earth Syst. Sci. Data 2018, 10, 837–846. [Google Scholar] [CrossRef]
  6. Badgujar, U.; Badekar, A.; Shrangare, S.; Pathan, A.; Karale, P. Solar Tracking and Monitoring System. Int. J. Res. Appl. Sci. Eng. Technol. 2024, 12, 2315–2320. [Google Scholar] [CrossRef]
  7. Rajkumar, N.; Govindhavasan; Jeyasri; Kumar, A.; Mahilarasi, A. Solar Tracking Methods: A Comprehensive Survey. Int. J. Res. Appl. Sci. Eng. Technol. 2024, 12, 4361–4364. [Google Scholar] [CrossRef]
  8. García-Cabrera, R.D.; Cuevas-Agulló, E.; Barreto, Á.; Cachorro, V.E.; Pó, M.; Ramos, R.; Hoogendijk, K. Aerosol retrievals from the EKO MS-711 spectral direct irradiance measurements and corrections of the circumsolar radiation. Atmos. Meas. Tech. 2020, 13, 2601–2621. [Google Scholar] [CrossRef]
  9. Kuttybay, N.; Saymbetov, A.; Mekhilef, S.; Nurgaliyev, M.; Tukymbekov, D.; Dosymbetova, G.; Meiirkhanov, A.; Svanbayev, Y. Optimized Single-Axis Schedule Solar Tracker in Different Weather Conditions. Energies 2020, 13, 5226. [Google Scholar] [CrossRef]
  10. Wong, J.; Bai, F.; Saha, T.K.; Tan, R.H. A feasibility study of the 1.5-axis tracking model in utility-scale solar PV plants. Sol. Energy 2021, 216, 171–179. [Google Scholar] [CrossRef]
  11. Mamodiya, U.; Tiwari, N. Dual-axis solar tracking system with different control strategies for improved energy efficiency. Comput. Electr. Eng. 2023, 111, 108920. [Google Scholar] [CrossRef]
  12. Shang, H.; Shen, W. Design and Implementation of a Dual-Axis Solar Tracking System. Energies 2023, 16, 6330. [Google Scholar] [CrossRef]
  13. Barreto, Á.; Cuevas, E.; Granados-Muñoz, M.-J.; Alados-Arboledas, L.; Romero, P.M.; Gröbner, J.; Kouremeti, N.; Almansa, A.F.; Stone, T.; Toledano, C.; et al. The new sun-sky-lunar Cimel CE318-T multiband photometer—A comprehensive performance evaluation. Atmos. Meas. Tech. 2016, 9, 11077–11138. [Google Scholar] [CrossRef]
  14. Liu, J. Research on Ultraviolet Aerosol Optical Depth Based on Sky Radiometer. Ph.D. Thesis, Xi’an University of Technology, Xi’an, China, 2018. [Google Scholar]
  15. Tatsiankou, V.; Hinzer, K.; Schriemer, H.; Kazadzis, S.; Kouremeti, N.; Gröbner, J.; Beal, R. Extensive validation of solar spectral irradiance meters at the World Radiation Center. Sol. Energy 2018, 166, 80–89. [Google Scholar] [CrossRef]
  16. Qi, Z.; Li, J.; Xu, W.; Zhu, W.; Sun, F.; Huang, Y.; Xu, G.; Dai, C. Optomechanical Design and Application of Solar-Skylight Spectroradiometer. Sensors 2021, 21, 3751. [Google Scholar] [CrossRef]
  17. Flores-Hernández, D.A.; Luviano-Juárez, A.; Lozada-Castillo, N.; Gutiérrez-Frías, O.; Domínguez, C.; Antón, I. Optimal Strategy for the Improvement of the Overall Performance of Dual-Axis Solar Tracking Systems. Energies 2021, 14, 7795. [Google Scholar] [CrossRef]
  18. Lee, C.-Y.; Chou, P.-C.; Chiang, C.-M.; Lin, C.-F. Sun Tracking Systems: A Review. Sensors 2009, 9, 3875–3890. [Google Scholar] [CrossRef]
  19. Yang, X. Optimization design method of free-form surface reflector for direct solar radiation measurement. Acta Opt. Sin. 2022, 42, 0922001. [Google Scholar]
  20. Mo, X.; Zhang, J.; Wang, L.; Sun, J.; Yang, S.; Shi, H.; Zhang, Y.; Zhao, B.; Yang, J.; Zhang, G.; et al. Direct solar-radiation intensity measurement based on multiple off-axis hyperboloids fused with free-form surfaces. Opt. Express 2025, 33, 10777–10794. [Google Scholar] [CrossRef]
  21. Sun, J.; Zhang, J.; Mo, X.; Wang, L.; Zhao, B.; Zhang, Y.; Chong, W.; Liu, Q.; Zou, Y.; Ren, Z.; et al. Free-form surface-based polar-axis rotational direct solar radiation spectrum measurements. Opt. Express 2025, 33, 4176–4193. [Google Scholar] [CrossRef]
  22. Reda, I.; Andreas, A. Solar position algorithm for solar radiation applications. Sol. Energy 2004, 76, 577–589. [Google Scholar] [CrossRef]
  23. Shi, H.; Jiang, H.; Zhang, X.; Wang, C.; Liu, T. Analysis of nodal aberration properties in off-axis freeform system design. Appl. Opt. 2016, 55, 6782–6790. [Google Scholar] [CrossRef]
  24. Hu, P.-C.; Chang, D.; Tan, J.-B.; Yang, R.-T.; Yang, H.-X.; Fu, H.-J. Displacement measuring grating interferometer: A review. Front. Inf. Technol. Electron. Eng. 2019, 20, 631–654. [Google Scholar] [CrossRef]
  25. Zhang, Y.; Li, W.; Duan, W.; Huang, Z.; Yang, H. Echelle Grating Spectroscopic Technology for High-Resolution and Broadband Spectral Measurement. Appl. Sci. 2022, 12, 11042. [Google Scholar] [CrossRef]
  26. Shi, H.; Zhang, X.; Li, Y.; Li, Y.C.; Jiang, L.; Wang, C.; Liu, Z.; Jiang, H.L. Analysis of aberration characteristics in pupil off-axis freeform surface optical systems. Acta Opt. 2017, 37, 1208001. [Google Scholar]
  27. Jin, S.; Li, Z.; Feng, Z.; Gao, L.; Li, Y.; Zhang, L.; Shi, W.; Xia, G. Optical System Design of a Planar Waveguide Spectrometer. Coatings 2022, 12, 520. [Google Scholar] [CrossRef]
  28. Xia, C. Optical Design of a Portable Anastigmatic Czerny-Turner Spectrometer. Master’s Thesis, Soochow University, Suzhou, China, 2022. [Google Scholar] [CrossRef]
  29. Zhou, W.; Liu, Z.; Sun, Y.; Teng, H.; Wang, W.; Bayanheshig; Li, W. Bidirectional Littrow double grating interferometry for quadruple optical interpolation. Opt. Laser Technol. 2024, 175, 110751. [Google Scholar] [CrossRef]
  30. Kren, A.C.; Pilewskie, P.; Coddington, O. Where does earth’s atmosphere get its energy? J. Space Weather Space Clim. 2017, 7, A10. [Google Scholar] [CrossRef]
  31. Li, W. Controlling the wavefront aberration of a large-aperture and high-precision holographic diffraction grating. Light. Sci. Appl. 2025, 14, 112. [Google Scholar] [CrossRef] [PubMed]
  32. Zhou, W. A random angle error interference eliminating method for grating interferometry measurement based on symmetry littrow structure. Laser Photonics 2025, 19, 2401659. [Google Scholar] [CrossRef]
  33. Reader, J. Optimizing czerny–turner spectrographs: A comparison between analytic theory and ray tracing. J. Opt. Soc. Am. 1969, 59, 1189–1194. [Google Scholar] [CrossRef]
  34. Xu, G.; Ke, Z.; Zhuang, C.; Li, Y.; Cai, R.; Yang, Y.; Du, X. Measurements and analysis of solar spectrum in near space. Energy Rep. 2023, 9, 1764–1773. [Google Scholar] [CrossRef]
  35. Yang, J.; Zhang, G.; Zhao, B.; Yang, D.; Zhang, K.; Zhang, Y.; Zhang, J.; Ren, Z.; Sun, J.; Wang, L.; et al. Solar Spectrum Simulation Algorithms Considering AM0G and AM1.5G. Sensors 2025, 25, 1406. [Google Scholar] [CrossRef]
  36. World Meteorological Organization. Guide to Meteorological Instruments and Methods of Observation, 2017 ed.; WMO-No. 8; WMO: Geneva, Switzerland, 2017; Available online: https://library.wmo.int/index.php?lvl=notice_display&id=12407 (accessed on 20 May 2024).
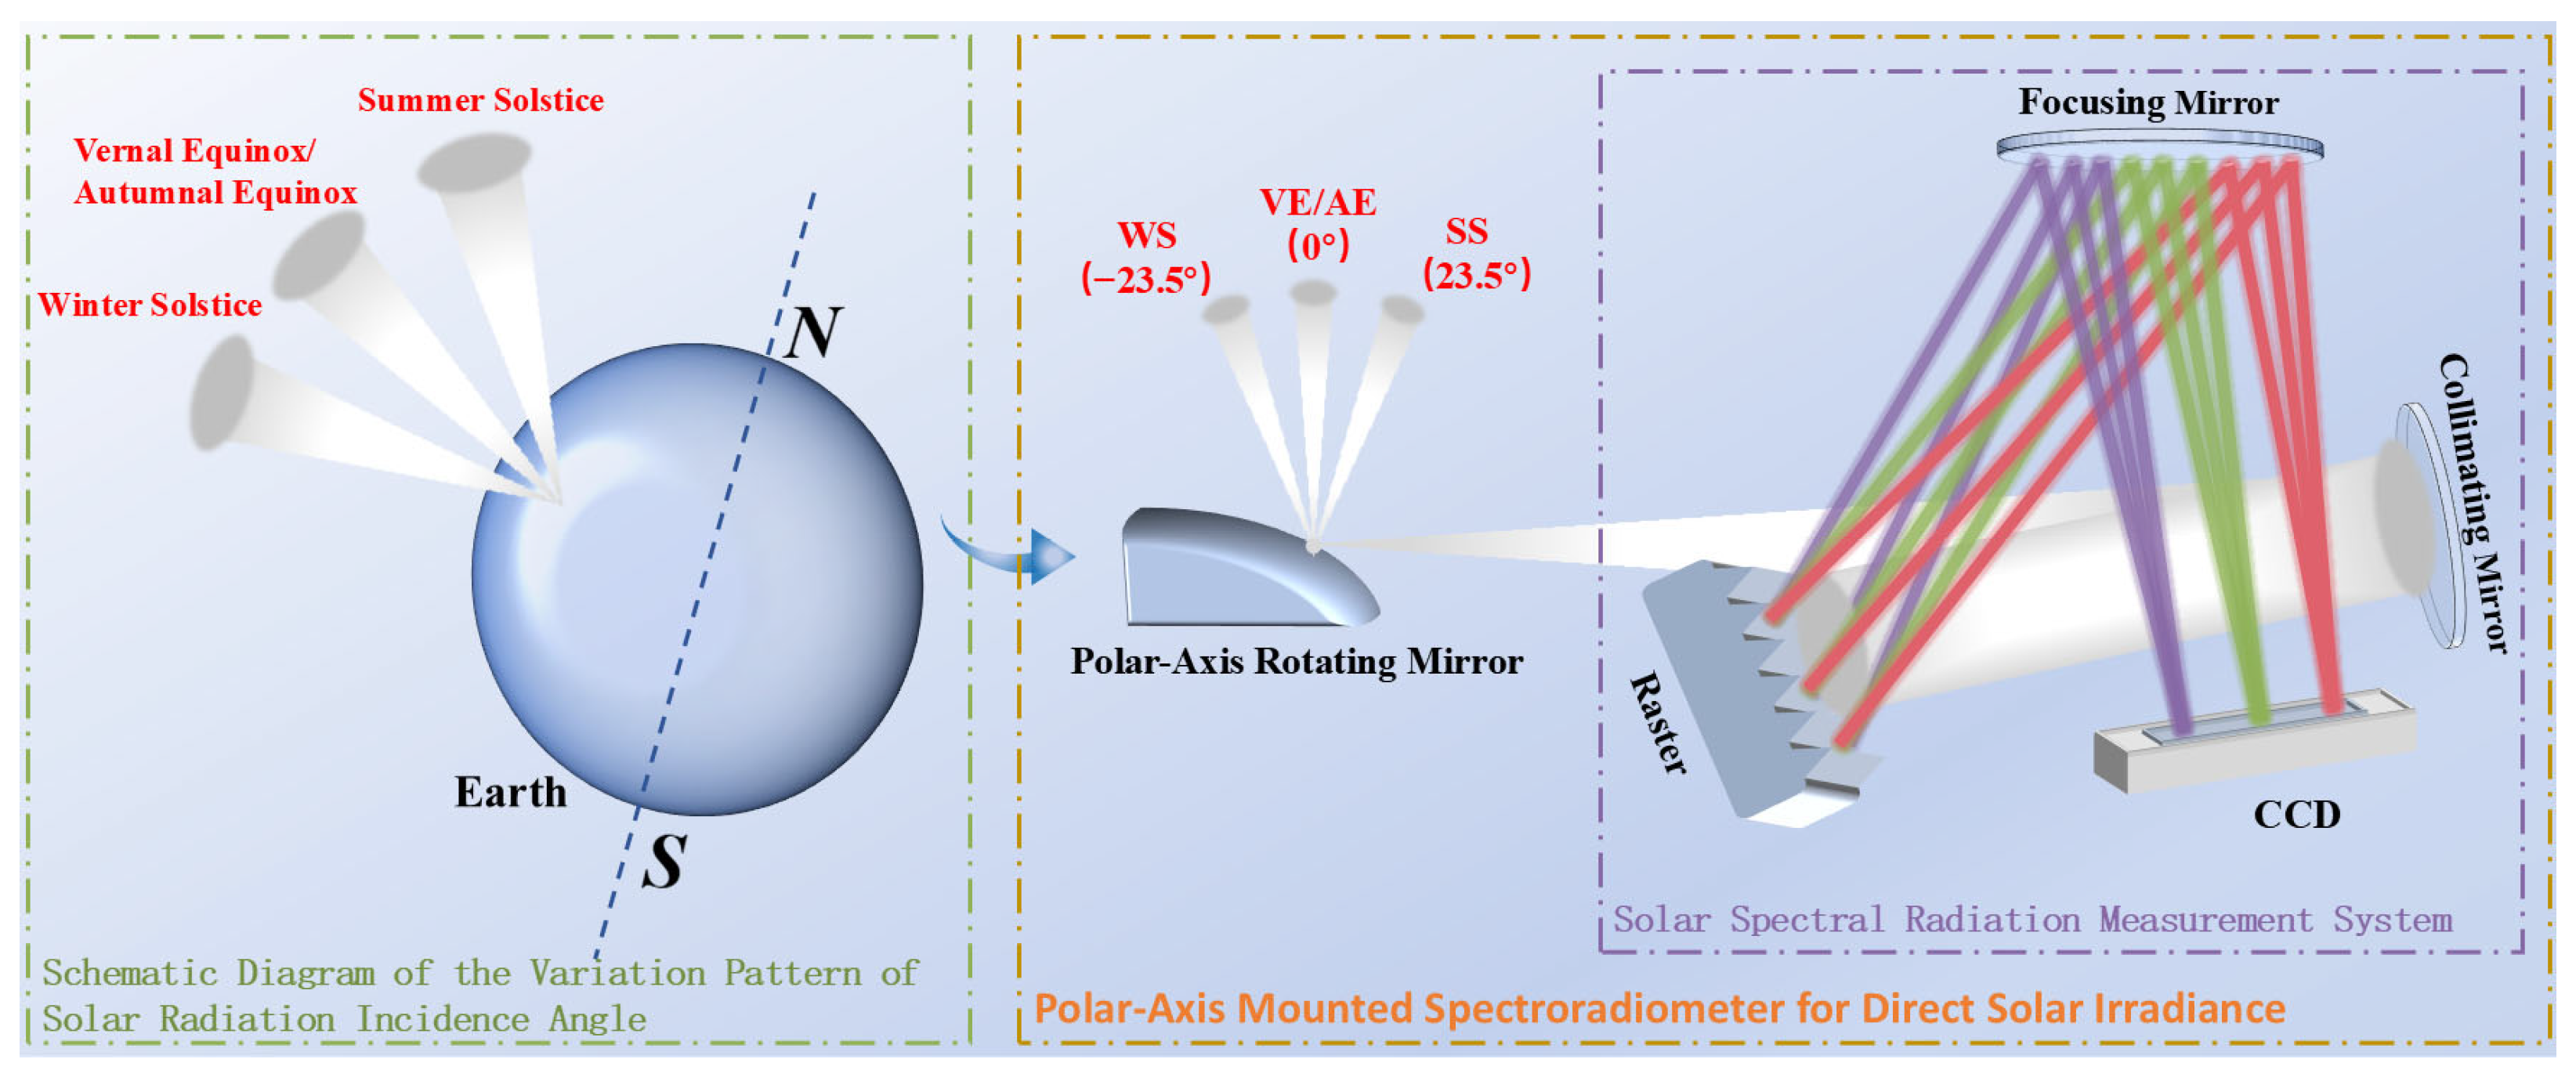
Figure 1. Overall architecture of the PADS.
Photonics 12 00931 g001
Figure 2. Optical path of the polar-axis direct solar radiation spectrum measurement optical system.
Photonics 12 00931 g002
Figure 3. Spectral resolution of the polar-axis solar direct radiation spectrometry optical system.
Photonics 12 00931 g003
Figure 4. Simulation model of PADS.
Photonics 12 00931 g004
Figure 5. Response results at various angles for the PADS.
Photonics 12 00931 g005
Figure 6. Measurement results of isospectral spectra at various angles and reconstruction coefficients, they should be listed as: (a) Measurement results of isothermal spectrum curves at various angles; (b) Reconstruction coefficient curves from various angles.
Photonics 12 00931 g006
Figure 7. Direct solar radiation spectrum at various angles after AM0 reconstruction.
Photonics 12 00931 g007
Figure 8. Measurement accuracy of AM0 direct solar radiation spectrum, they should be listed as: (a) Distribution of AM0 at each incident angle R E w ( λ i ) ; (b) Distribution of AM0 at each incident angle R E a ( λ i ) .
Photonics 12 00931 g008
Figure 9. Direct solar radiation spectrum at various angles after AM1.5G reconstruction.
Photonics 12 00931 g009
Figure 10. Measurement accuracy of AM1.5G direct solar radiation spectrum, they should be listed as: (a) Distribution of AM1.5G at each incident angle R E w ( λ i ) ; (b) Distribution of AM1.5G at each incident angle R E a ( λ i ) .
Photonics 12 00931 g010
Table 1. Comparison of spectral reconstruction accuracy between AM0 and AM1.5G.
EvaluationEvaluation CriteriaAM0 SpectrumAM1.5G Spectrum
Detailed evaluation R E w ( λ i ) scope−9.05% to 13.35%−9.19% to 13.66%
The   incident   angle   corresponding   to   the   maximum   R E w ( λ i ) −8°
Wavelength   corresponding   to   maximum   R E w ( λ i ) 740 nm 760 nm
Extreme   value   of   standard   deviation   of   R E w ( λ i ) /corresponding incident angle2.59%/8°2.86%/8°
Overall evaluation R E a ( λ i ) scope−0.04% to 0.09%−0.03% to 0.11%
The   incident   angle   corresponding   to   the   maximum   R E a ( λ i ) 99.92%
Annual measurement accuracy evaluationRFUS99.93%99.92%
Disclaimer/Publisher’s Note: The statements, opinions and data contained in all publications are solely those of the individual author(s) and contributor(s) and not of MDPI and/or the editor(s). MDPI and/or the editor(s) disclaim responsibility for any injury to people or property resulting from any ideas, methods, instructions or products referred to in the content.