Author Contributions
Methodology, formal analysis, resources, data curation, and writing—original draft preparation, Q.W. and J.L.; Conceptualization, writing—review and editing, Q.W. and X.L.; supervision and project administration, X.L., Z.G. and S.L. All authors have read and agreed to the published version of the manuscript.
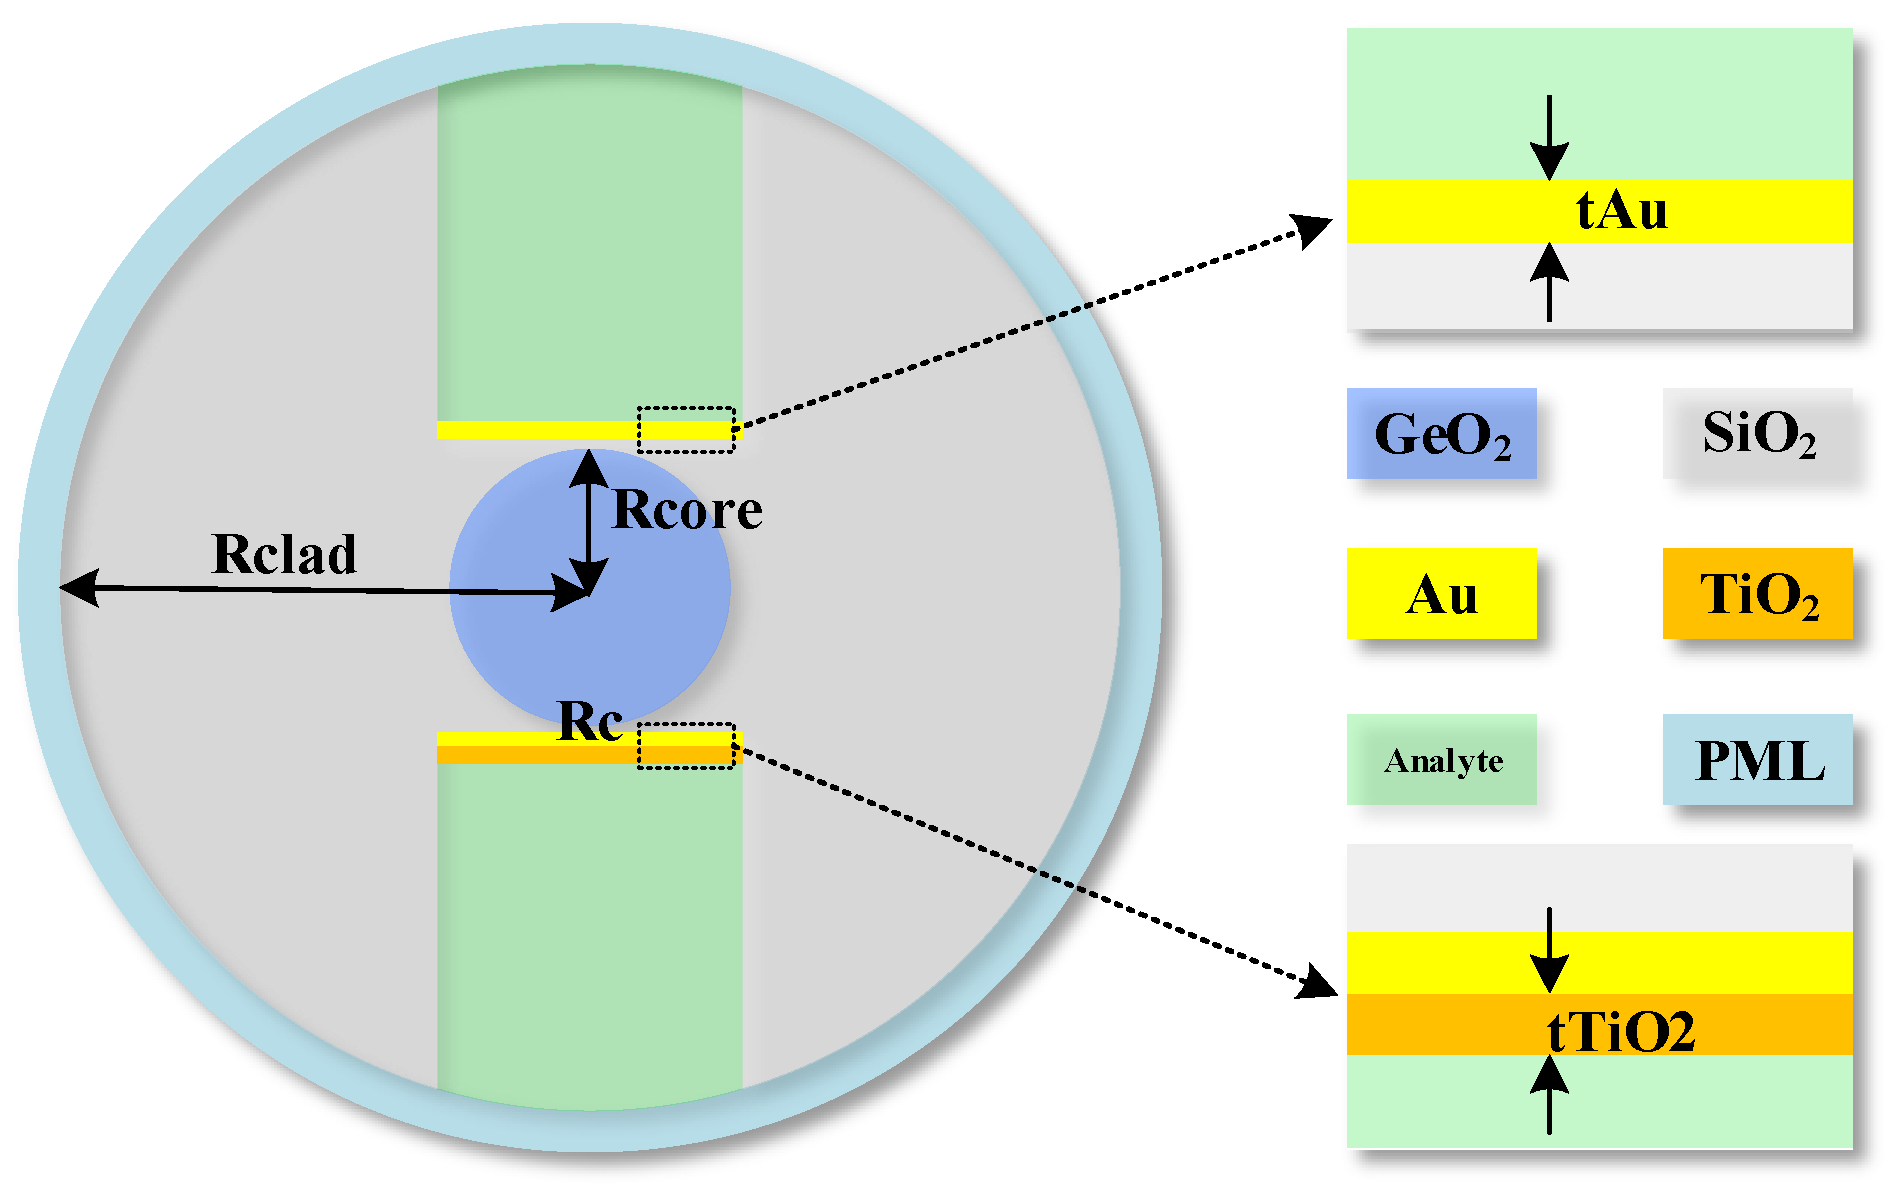
Figure 1.
Structure of the proposed dual-groove FMF-SPR sensor.
Figure 1.
Structure of the proposed dual-groove FMF-SPR sensor.
Figure 2.
Schematic illustration of the fabrication process of the dual-groove FMF-SPR sensor: (a) initial fiber structure; (b) structure after groove inscription and polishing; (c) Au film deposition; (d) formation of Au/TiO2 bilayer in one groove.
Figure 2.
Schematic illustration of the fabrication process of the dual-groove FMF-SPR sensor: (a) initial fiber structure; (b) structure after groove inscription and polishing; (c) Au film deposition; (d) formation of Au/TiO2 bilayer in one groove.
Figure 3.
Mode characteristics of the FMF-SPR sensor. (a) Real part of the effective index of LP11 and SPP modes versus wavelength. (b) Loss spectra of LP01 and LP11 modes (RI = 1.35).
Figure 3.
Mode characteristics of the FMF-SPR sensor. (a) Real part of the effective index of LP11 and SPP modes versus wavelength. (b) Loss spectra of LP01 and LP11 modes (RI = 1.35).
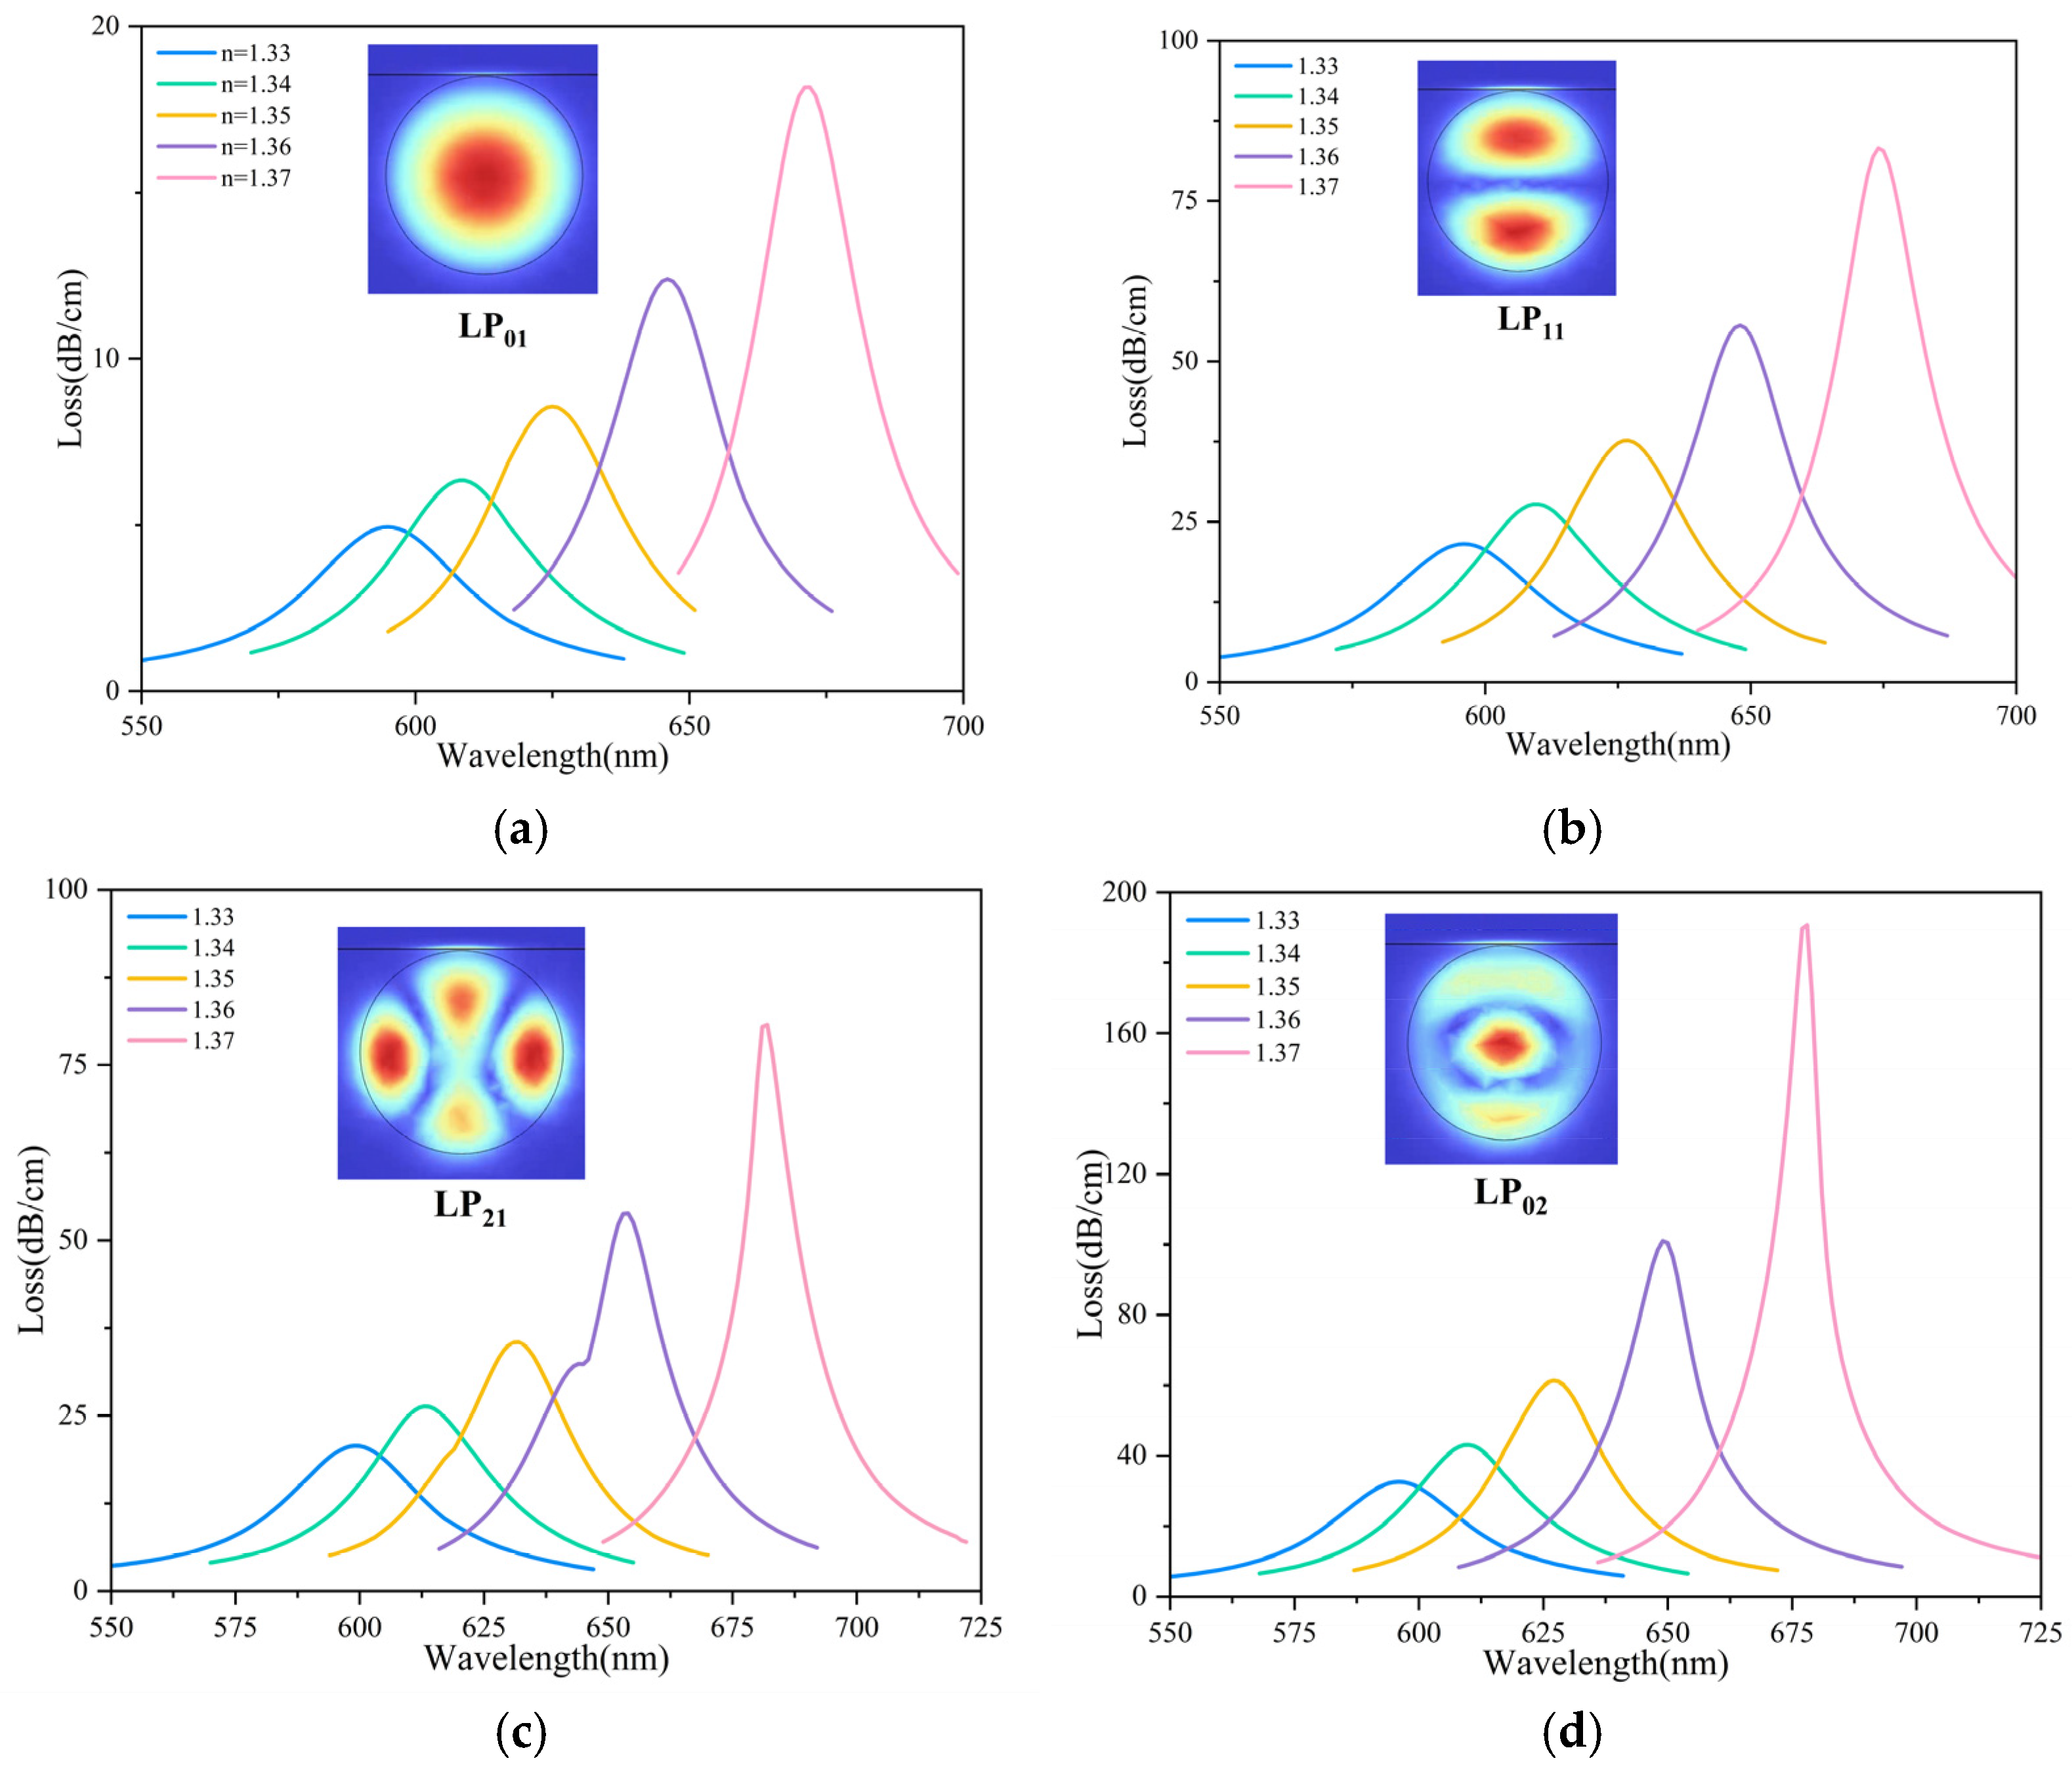
Figure 4.
Transmission loss spectra of different modes (RI = 1.33–1.37): (a) LP01, (b) LP11, (c) LP21, (d) LP02.
Figure 4.
Transmission loss spectra of different modes (RI = 1.33–1.37): (a) LP01, (b) LP11, (c) LP21, (d) LP02.
Figure 5.
Quadratic fitting curves of resonance wavelength versus RI for the four guided modes.
Figure 5.
Quadratic fitting curves of resonance wavelength versus RI for the four guided modes.
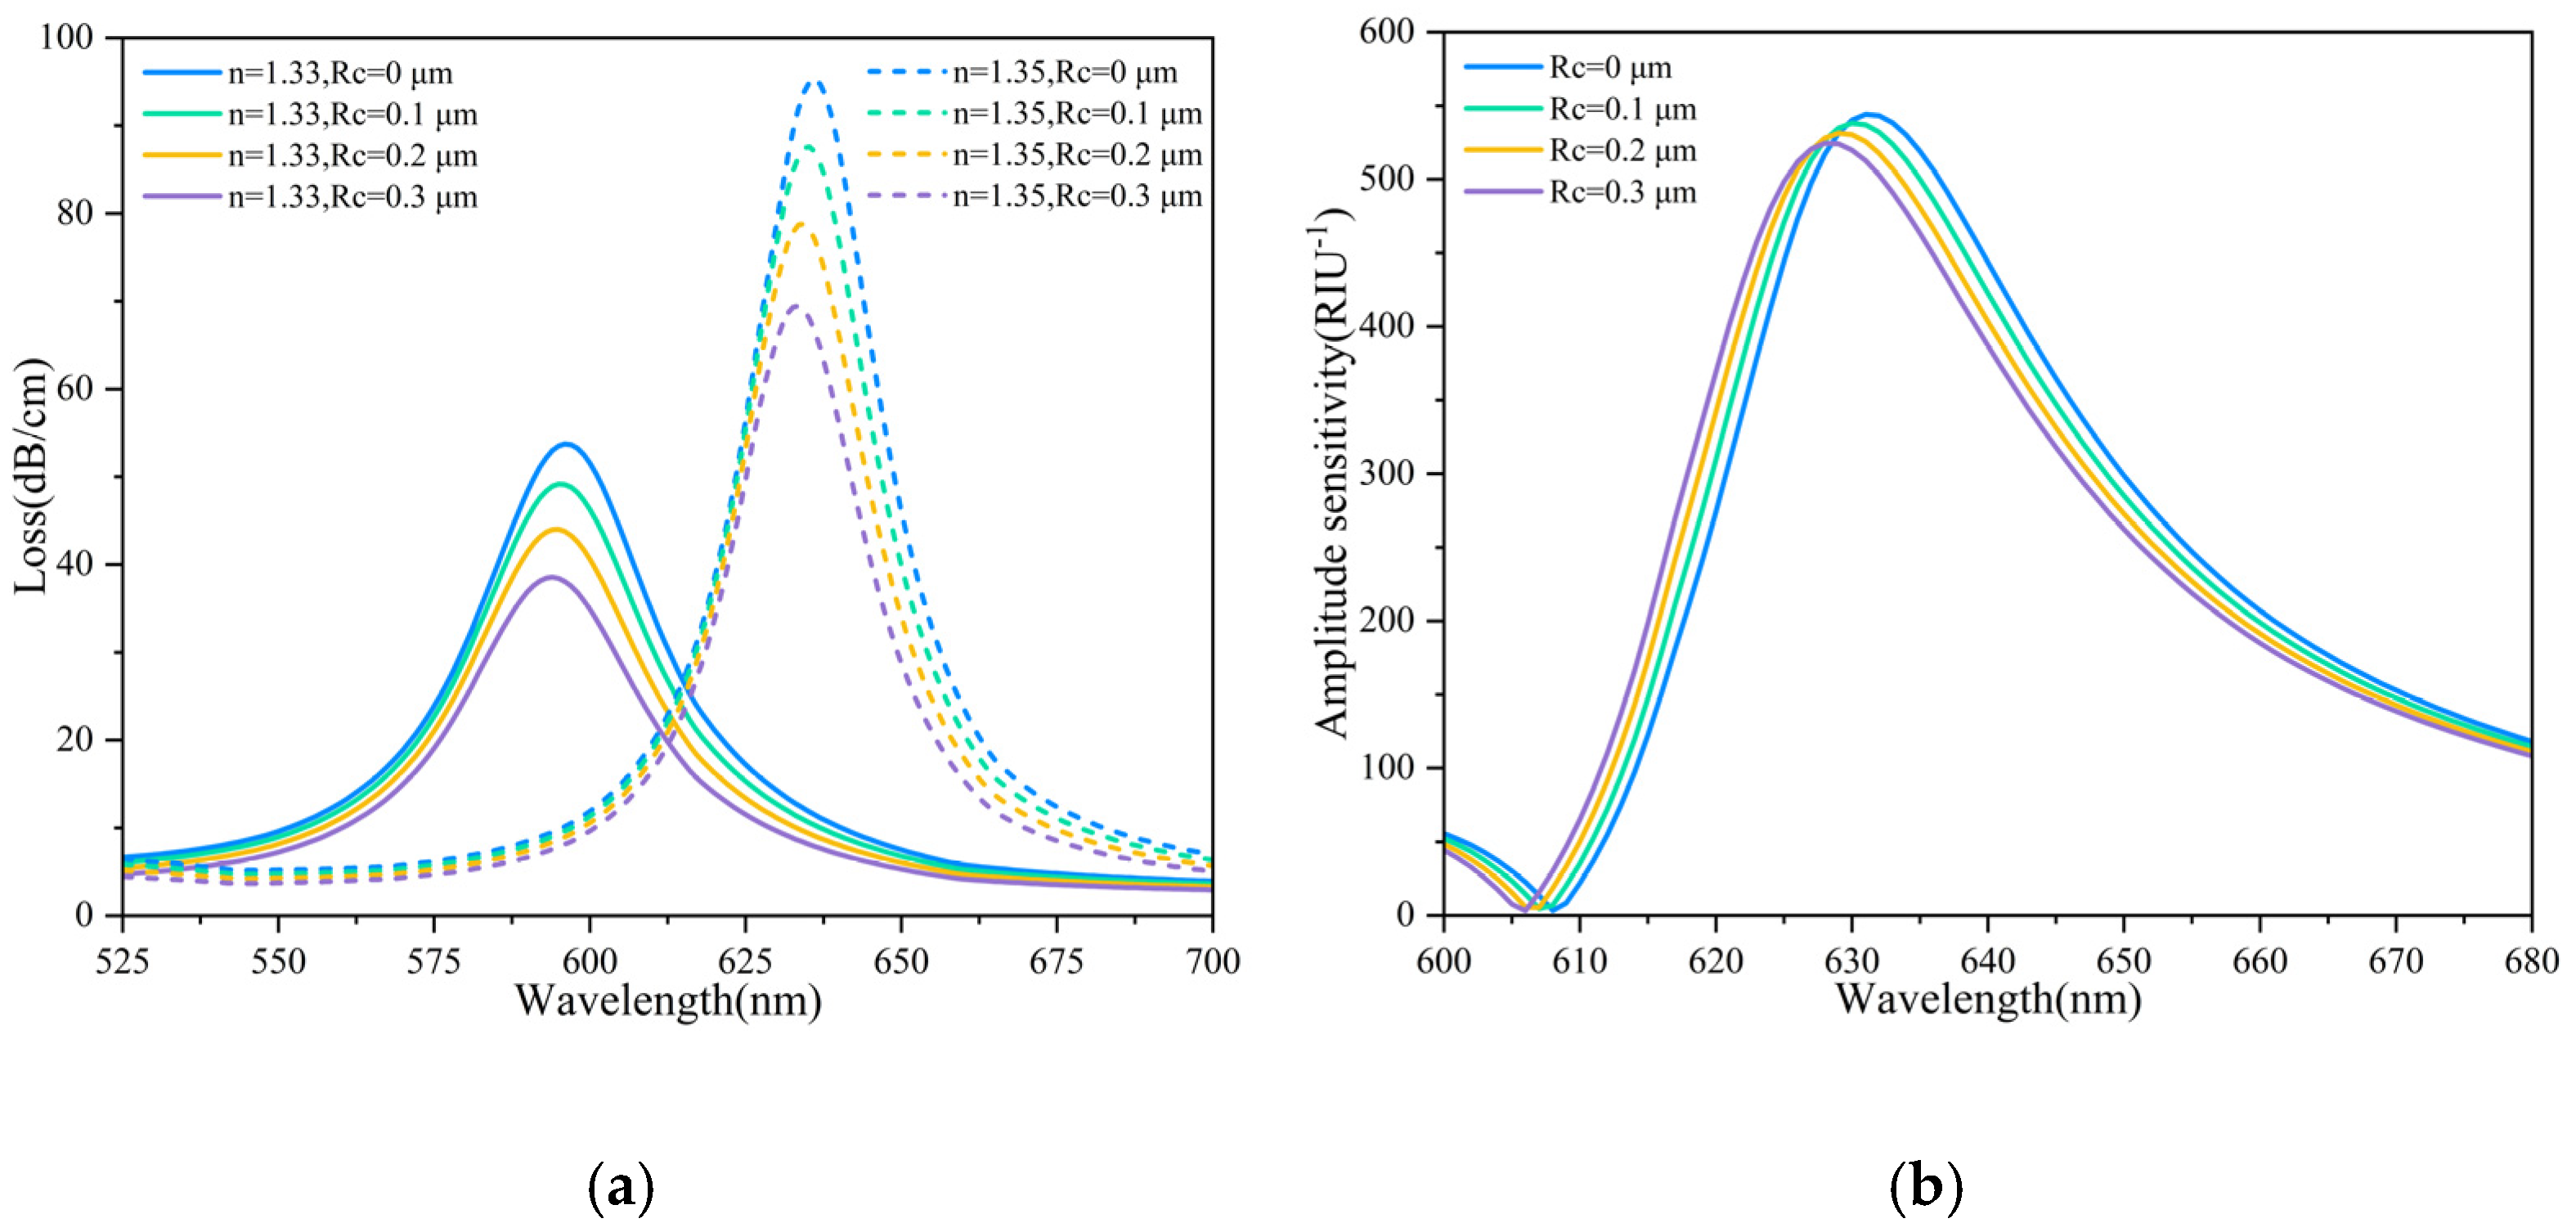
Figure 6.
(a) Loss spectra for different Rc values (RI = 1.33 and 1.35). (b) Amplitude sensitivity as a function of Rc.
Figure 6.
(a) Loss spectra for different Rc values (RI = 1.33 and 1.35). (b) Amplitude sensitivity as a function of Rc.
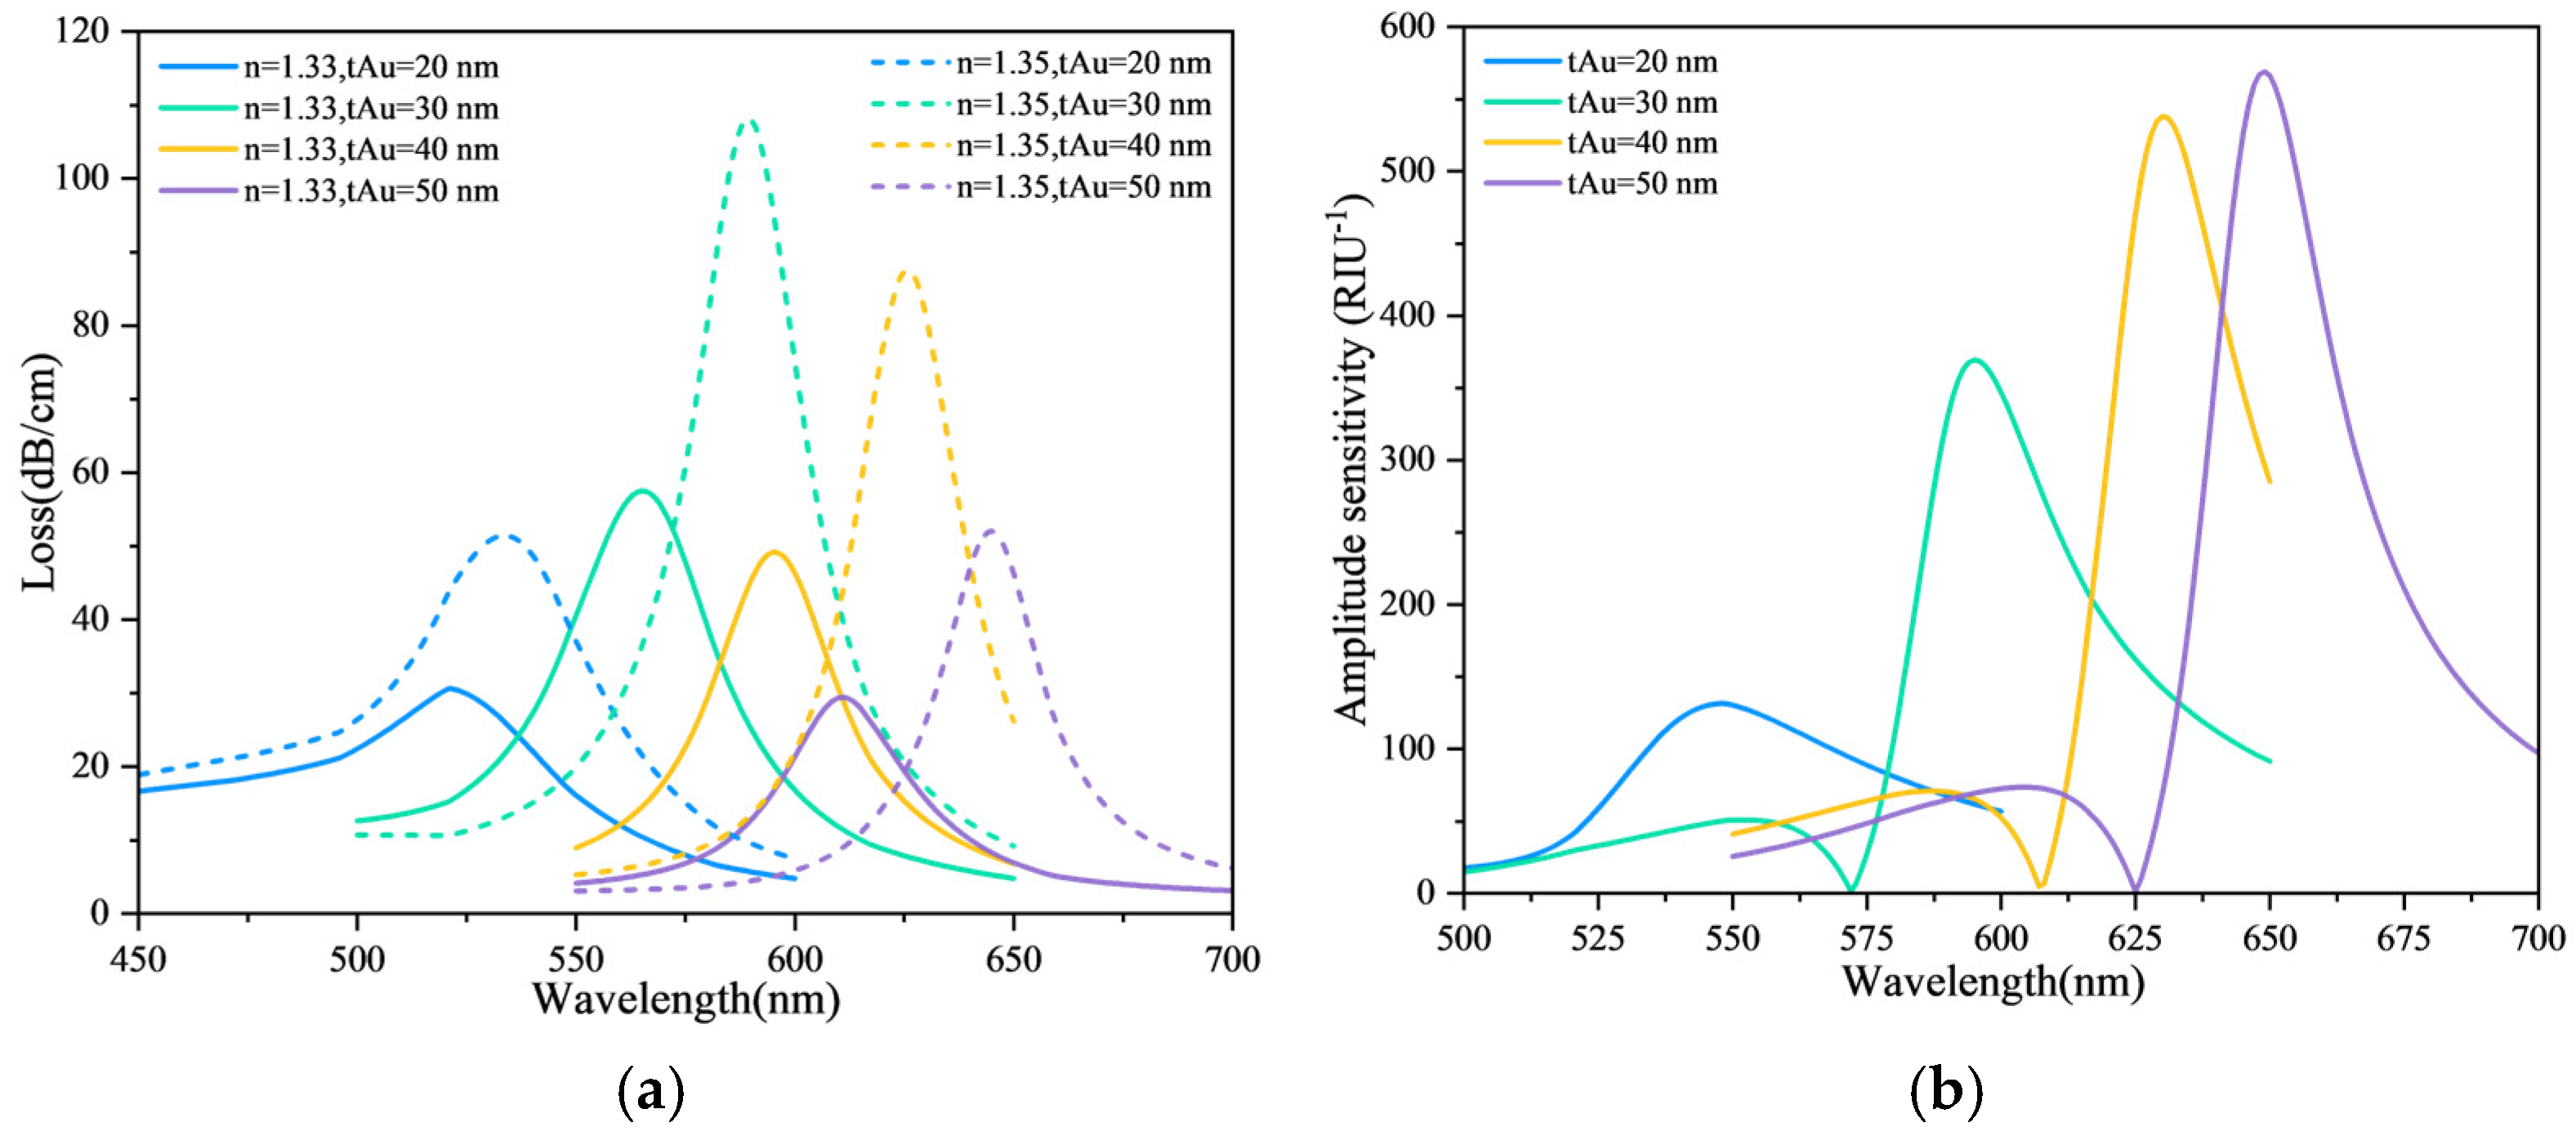
Figure 7.
(a) Loss spectra for varying tAu (Rc = 0.1 μm). (b) Amplitude sensitivity as a function of tAu (RI = 1.35).
Figure 7.
(a) Loss spectra for varying tAu (Rc = 0.1 μm). (b) Amplitude sensitivity as a function of tAu (RI = 1.35).
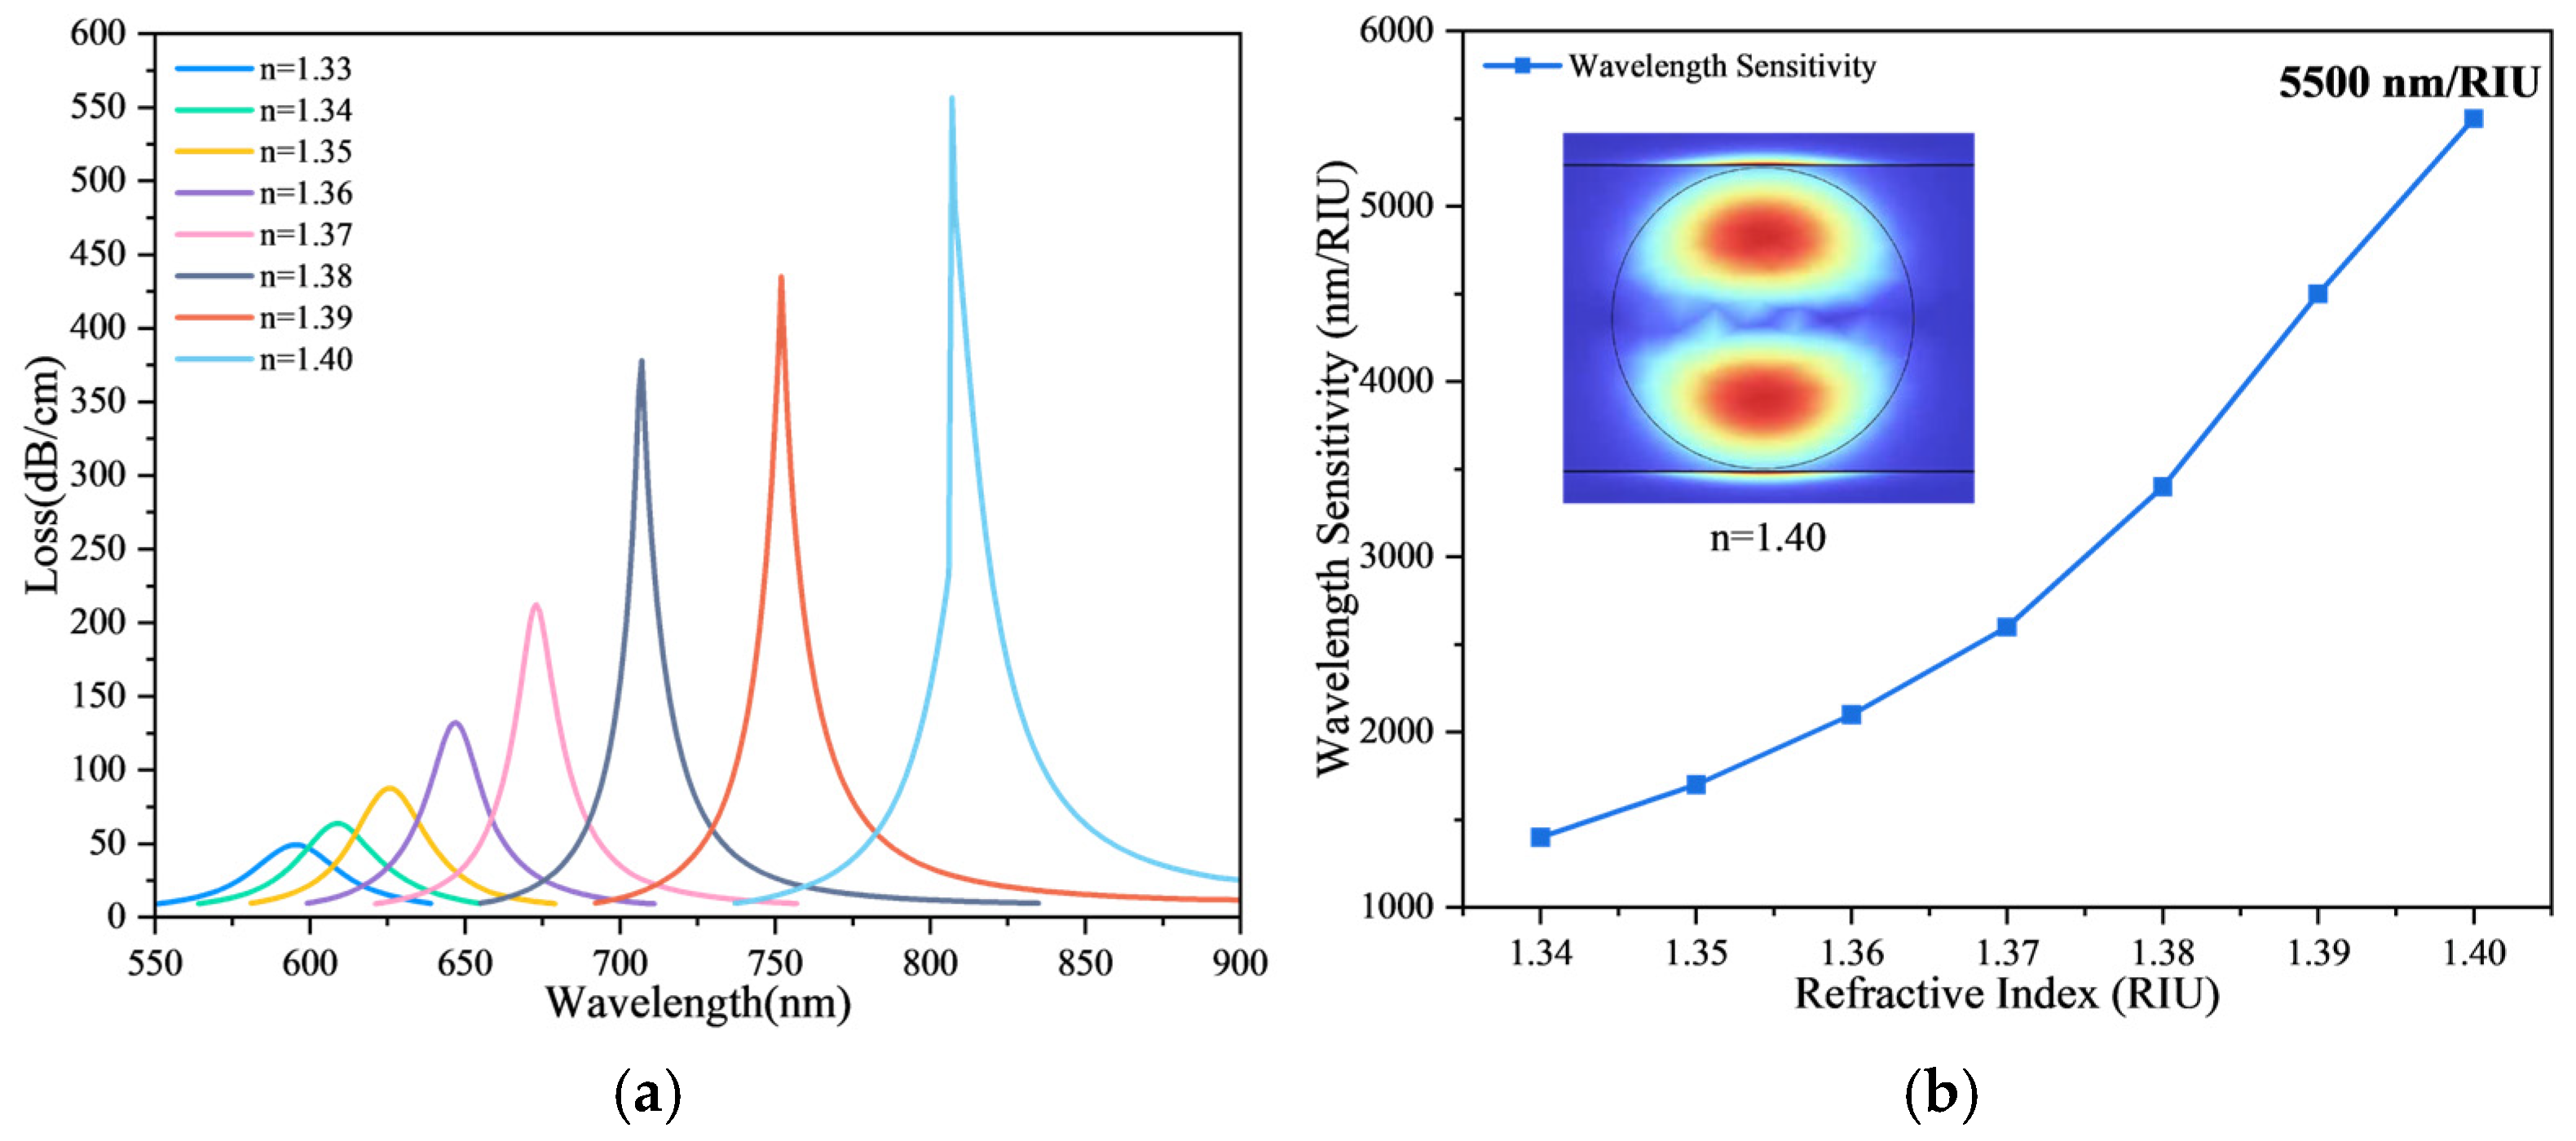
Figure 8.
Loss spectra and wavelength sensitivity of the FMF-SPR sensor under symmetric dual-channel configuration. (a) Loss spectra for RI = 1.33–1.40. (b) Wavelength sensitivity versus RI.
Figure 8.
Loss spectra and wavelength sensitivity of the FMF-SPR sensor under symmetric dual-channel configuration. (a) Loss spectra for RI = 1.33–1.40. (b) Wavelength sensitivity versus RI.
Figure 9.
Loss spectra of the FMF-SPR sensor under asymmetric dual-channel configuration (n1 = 1.33 fixed, n2 = 1.33–1.40).
Figure 9.
Loss spectra of the FMF-SPR sensor under asymmetric dual-channel configuration (n1 = 1.33 fixed, n2 = 1.33–1.40).
Figure 10.
Simulated results of the FMF-SPR sensor (tTiO2 = 10 nm). (a) Loss spectra of CH1 and CH2 (n = 1.33). (b) Wavelength sensitivity versus RI. (c) Spectral overlap of CH1 (n1 = 1.38) and CH2 (n2 = 1.33).
Figure 10.
Simulated results of the FMF-SPR sensor (tTiO2 = 10 nm). (a) Loss spectra of CH1 and CH2 (n = 1.33). (b) Wavelength sensitivity versus RI. (c) Spectral overlap of CH1 (n1 = 1.38) and CH2 (n2 = 1.33).
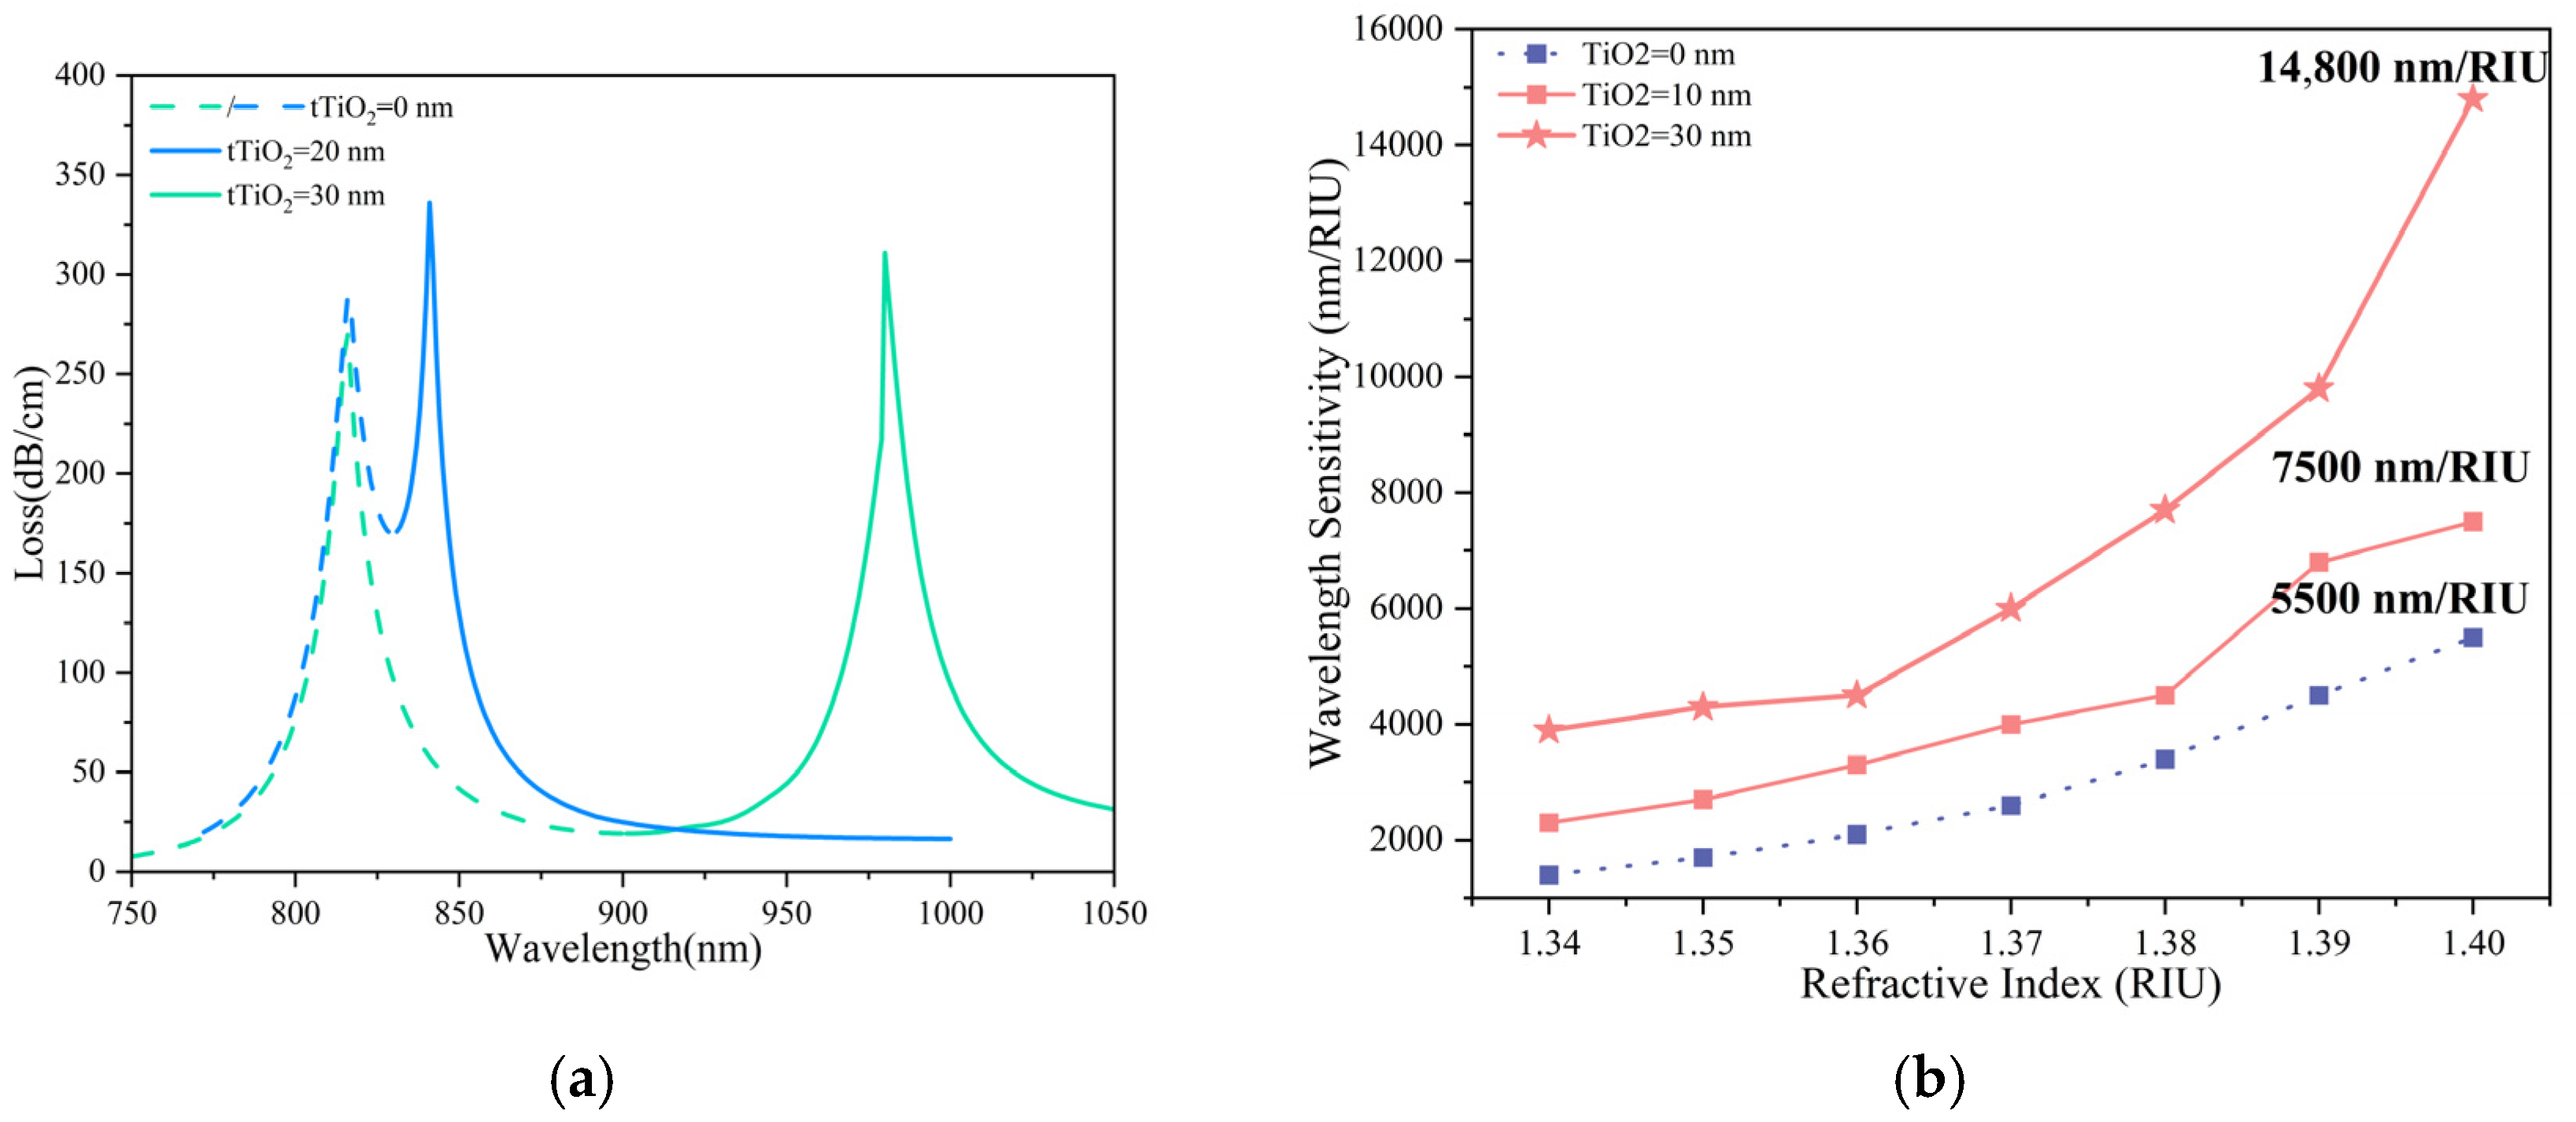
Figure 11.
(a) Evolution of dual-channel loss spectra under different TiO2 thicknesses (n1 = 1.40, n2 = 1.33). (b) Wavelength sensitivity of the FMF-SPR sensor under various TiO2 thicknesses.
Figure 11.
(a) Evolution of dual-channel loss spectra under different TiO2 thicknesses (n1 = 1.40, n2 = 1.33). (b) Wavelength sensitivity of the FMF-SPR sensor under various TiO2 thicknesses.
Figure 12.
Influence of TiO2 thickness on CH2 performance. (a) Loss spectra with 10 nm TiO2 (n2 = 1.33–1.40). (b) Loss spectra with 30 nm TiO2 (n2 = 1.33–1.40). (c) FWHM and FOM versus RI for 30 nm TiO2.
Figure 12.
Influence of TiO2 thickness on CH2 performance. (a) Loss spectra with 10 nm TiO2 (n2 = 1.33–1.40). (b) Loss spectra with 30 nm TiO2 (n2 = 1.33–1.40). (c) FWHM and FOM versus RI for 30 nm TiO2.
Figure 13.
(a) Loss spectrum of CH1 from −10 to 40 °C; (b) linear fit of resonance wavelength versus temperature.
Figure 13.
(a) Loss spectrum of CH1 from −10 to 40 °C; (b) linear fit of resonance wavelength versus temperature.
Figure 14.
SPR loss spectra comparing normal and tumor cells for (a) Basal, (b) HeLa, and (c) Jurkat type.
Figure 14.
SPR loss spectra comparing normal and tumor cells for (a) Basal, (b) HeLa, and (c) Jurkat type.
Table 1.
Quadratic fitting of resonance wavelength versus RI for different modes.
Table 1.
Quadratic fitting of resonance wavelength versus RI for different modes.
| Mode | Fitting Equation | R2 |
|---|
| LP01 | y = 37,086 − 55,937x + 21,428x2 | 0.9999 |
| LP11 | y = 34,458 − 52,060x + 20,000x2 | 0.9999 |
| LP21 | y = 38,192 − 57,715x + 22,142x2 | 0.9999 |
| LP02 | y = 46,052 − 69,327x + 26,428x2 | 0.9995 |
Table 2.
Resonance wavelength and penetration depth for each mode at RI = 1.35.
Table 2.
Resonance wavelength and penetration depth for each mode at RI = 1.35.
| Mode | Resonance Wavelength (nm) | Penetration Depth (nm) |
|---|
| LP01 | 625 | 192.45 |
| LP11 | 627 | 194.88 |
| LP21 | 632 | 194.74 |
| LP02 | 626 | 193.04 |
Table 3.
Resonance wavelength and penetration depth at different Rc values (RI = 1.35).
Table 3.
Resonance wavelength and penetration depth at different Rc values (RI = 1.35).
| Rc (μm) | Resonance Wavelength (nm) | Penetration Depth (nm) |
|---|
| 0.0 | 630 | 95.0 |
| 0.1 | 627 | 194.8 |
| 0.2 | 626 | 295.1 |
| 0.3 | 625 | 397.8 |
Table 4.
Resonance wavelength and penetration depth for different tAu at Rc = 0.1 μm, RI = 1.35.
Table 4.
Resonance wavelength and penetration depth for different tAu at Rc = 0.1 μm, RI = 1.35.
| tAu (nm) | Resonance Wavelength (nm) | Penetration Depth (nm) |
|---|
| 30 | 615 | 186.4 |
| 40 | 621 | 213.7 |
| 50 | 628 | 242.1 |
| 60 | 635 | 245.5 |
Table 5.
Resonance wavelength and penetration depth under symmetric dual-channel configuration.
Table 5.
Resonance wavelength and penetration depth under symmetric dual-channel configuration.
| RI | Resonance Wavelength (nm) | Penetration Depth (nm) |
|---|
| 1.33 | 595 | 145.2 |
| 1.35 | 627 | 196.6 |
| 1.37 | 673 | 230.6 |
| 1.39 | 752 | 297.4 |
Table 6.
Comparison of the Proposed Au–TiO2 FMF-SPR Biosensor with Previously Reported Multilayer SPR Sensors.
Table 6.
Comparison of the Proposed Au–TiO2 FMF-SPR Biosensor with Previously Reported Multilayer SPR Sensors.
| [Ref.] | RI Range (RIU) | Coating Structure | Guided Mode | Max. Sensitivity (nm/RIU) |
|---|
| [28] | 1.26–1.42 | TiO2-Au | LP01 | 7500 |
| [29] | 1.33–1.41 | MXene-Au-TiO2 | LP01 | 9400 |
| [30] | 1.33–1.40 | Ag/Au/Graphene/MoS2 | LP01 | 11,775 |
| This work | 1.33–1.40 | Au-TiO2 | LP11 | 14,800 |
Table 7.
RI parameters of normal and tumor cells.
Table 7.
RI parameters of normal and tumor cells.
| Tissue Type | Cell Type | Normal Cell RI | Tumor Cell RI |
|---|
| Skin [33] | Basal | 1.360 | 1.380 |
| Cervix [34] | HeLa | 1.368 | 1.392 |
| Blood [35] | Jurkat | 1.376 | 1.390 |
Table 8.
Wavelength sensitivity comparison with prior studies.
Table 8.
Wavelength sensitivity comparison with prior studies.
| [Ref.] | Tumor-Related Cells | Wavelength Sensitivity (nm/RIU) |
|---|
| [33] | Basal cell | 2500 |
| HeLa | 3750 |
| Jurkat | 4285 |
| [35] | Basal cell | 3150 |
| HeLa | 4333 |
| Jurkat | 4642 |
| [36] | Basal cell | 3800 |
| [37] | Basal cell | 4950 |
| This work | Basal cell | 6250 |
| HeLa | 8875 |
| Jurkat | 9428 |
