Article

Temperature-Dependent Fluorescent Properties of Single-Photon Emitters in 3C-SiC

1
State Key Laboratory of Precision Spectroscopy, East China Normal University, Shanghai 200241, China
2
Department of Physics and Shanghai Key Laboratory for Magnetic Resonance, East China Normal University, Shanghai 200241, China
3
Chongqing Key Laboratory of Precision Optics, Chongqing Institute of East China Normal University, Chongqing 401120, China
4
Collaborative Innovation Center of Extreme Optics, Shanxi University, Taiyuan 030006, China
*
Author to whom correspondence should be addressed.
Photonics 2025, 12(9), 920; https://doi.org/10.3390/photonics12090920
Submission received: 10 July 2025 / Revised: 10 September 2025 / Accepted: 12 September 2025 / Published: 15 September 2025
(This article belongs to the Special Issue Recent Progress in Single-Photon Generation and Detection)

Abstract

Silicon carbide (SiC) is a representative wideband-gap semiconductor with remarkable properties, such as high breakdown field strength, high thermal conductivity, and high carrier saturation mobility. Meanwhile, single-photon emitters (SPEs) in SiC have attracted considerable attention owing to their excellent fluorescence performances and promising applications in the quantum realm. Here, we conducted a systematic experimental investigation into the temperature-dependent characteristics of the SPEs in cubic silicon carbide (3C-SiC) crystal. Over a temperature span from 293 K to 373 K, the variations in fluorescence intensity, fluorescence lifetime, fluorescence spectra, polarization characteristics, and second-order autocorrelation function g2(τ) were examined. The fluorescence properties of defects showed extraordinary stabilization even when the temperature was raised to 373 K. Based on the above characteristics and combined with the excellent properties of SiC materials, this study provides strong evidence that SPEs in 3C-SiC can serve as information carriers capable of operating stably under high-temperature conditions.

1. Introduction

With the rapid development of quantum information and optical communication technologies, the demand for high-performance single-photon emitters (SPEs) in extreme environments has gradually increased. The SPEs in wideband-gap semiconductors show great potential in quantum precision applications owing to their unique physical and chemical properties [1,2,3,4,5,6]. They are compatible with well-matured semiconductor technologies, enabling sophisticated and intelligent optoelectronic integrated devices [7,8,9]. Among these, as an outstanding semiconductor material that has been widely used in plenty of electronic devices, silicon carbide (SiC) has been developed with sophisticated technologies for large-scale crystal growth and mature micro- and nano-fabrication processes [10,11]. The defects in SiC, such as divacancy and silicon vacancy color centers, are regarded as bright SPEs [12,13,14,15] and potential qubits [16,17] due to their stable and luminous characteristics at room temperature (RT).
Although SPEs can be used as independent information carriers in quantum computers and quantum key distribution [18,19], the highly localized heat flux leads to overheating in some optoelectronic devices and quantum information processing systems. The stable properties of the sensors under high temperatures are critical in the thermal management design of these devices because the increased temperature degrades their performance and reliability [20,21,22]. Moreover, in terms of fundamental basic physics research, it is important to understand the temperature-dependent fluorescence characteristics of SPEs. It will help to reveal the physical mechanisms of SPEs at different temperatures, which involves thermal excitation of charge carriers, recombination processes, and interaction with lattice vibration [23,24], and thus, in turn, improve the understanding of the interaction between photons and substances in semiconductors.
In recent years, the temperature dependence of the SPEs in SiC has been studied. Ref. [25] has reported the zero-field splitting of the PL6 divacancy as a function of temperature, which constructs a nanoscale high-sensitivity divacancy-based thermometer. The temperature dependence of spin properties of divacancy defects in implanted 4H-SiC in a temperature range from 5 to 300 K has been systematically studied [26]. Besides the previously mentioned SPEs that emit in the near-infrared region, a phenomenon more prevalent in defects of SiC, oxygen-related defects emitting in the visible region in bulk cubic silicon carbide (3C-SiC) crystal have been reported [27]. The fluorescence properties of the SPEs are comparable to those of NV centers in diamond. Meanwhile, under the condition of using a green laser as the excitation beam and a near-infrared laser as the suppression beam, the SPE in 3C-SiC has a higher fluorescence intensity suppression rate compared with the NV center in diamond, thus showing potential to become an optical switch [3]. The fluorescence lifetime of such SPEs is also much shorter than that of NV centers, which—given the higher fluorescence quantum efficiency—typically indicates a faster single-photon emission rate [28]. For the calculation process of the quantum efficiency of the target SPE, please refer to Appendix A. These optically active defects exhibit bright and stable fluorescence in the visible region at RT; however, the high-temperature dependence of their fluorescence characteristics and the associated physical mechanisms remain to be elucidated.
In this work, we report the temperature dependence of fluorescence intensity, fluorescence lifetime, fluorescence spectra, polarization characteristics, and second-order autocorrelation function g2(τ) of oxygen-related SPE in bulk 3C-SiC crystal in the range from 293 to 373 K. Remarkably, we observed that the major fluorescence properties of the SPE remained highly stable even when heated to 373 K. Our research significantly deepens the understanding of the temperature-dependent behavior of fluorescence properties within 3C-SiC spin systems and opens new avenues for the development and application of high-temperature viable quantum technologies.

2. Materials and Methods

A homemade confocal scanning microscope system integrated with a temperature-controlling device was used to measure the fluorescence characteristics of the defects at various temperatures. As depicted in Figure 1b, a piece of bulk 3C-SiC crystal sample was mounted on an Indium–Tin–Oxide (ITO) conductive glass plate. The temperature controller was designed to heat the electrodes located on either side of the ITO glass. Simultaneously, it provided real-time temperature feedback through a thermistor. This setup enabled temperature control from 293 K (room temperature, RT) to 373 K, with an accuracy of up to 0.1 K. To minimize thermal drift effects during measurements, the system was stabilized for 5 min at each target temperature before the experimental data acquisition. The fluorescence was collected via the same objective lens (×100, N.A. = 0.9, Olympus, Tokyo, Japan), as shown in Figure 1a. The fluorescence signal was split into two paths by a polarizing beam splitter after a long pass filter cutting off at 545 nm and was focused onto two Si-avalanche photo-diode single-photon detectors (APD, SPCM-AQR-14, PerkinElmer, Waltham, America). The two detection modules, combined with a time-correlated single-photon counter (TCSPC), constituted a Hanbury Brown and Twiss (HBT) interferometer, which was used for g2(τ) measurements of the emission. Meanwhile, by inserting a flipping mirror, the fluorescence was directed into a spectrograph (ANDOR, 500i, Belfast, UK) to obtain the fluorescence spectra of individual defects.
The 3C-SiC bulk crystal was annealed in air at 800 °C for 10 min [28], followed by scanning with the same confocal system, which revealed fluorescent spots. To date, the lattice structure of such color centers remains unreported. Figure 1c presents the confocal fluorescence mapping of defects in 3C-SiC within a 6 µm × 6 µm area at RT. The region was chosen arbitrarily due to the abundance of similar SPEs in the sample; the SPE marked in the figure was chosen as it is relatively isolated and less likely to be affected by other fluorescent spots, and is marked by the white circle. The density of SPEs in the sample is approximately 5.83 × 109 cm−2. The excitation source was a pulsed laser at 532 nm with a pulse duration of 12.5 ps and a repetition rate of 20 MHz. The excitation power was about 0.15 mW. To verify the non-classical photon statistics of the target emitter, we recorded g2(τ) over a short timescale (|τ| ≤ 20 ns) using the continuous-wave (CW) green laser at 532 nm, with a power of 0.4 mW. The inset of Figure 1c presents the g2(τ) of the emitter at RT, and the dip at zero-delay time after background correction is about 0.24. It is clearly demonstrated that the emission exhibits non-classical characteristics, and the emitter was a SPE.

3. Results and Discussion

Figure 2a shows the fluorescent intensity of the SPE as a function of temperature. At RT, a fluorescence intensity of 28 × 103 counts per second (cps) was recorded. As the temperature increased, the fluorescent intensity gradually decreased, which was consistent with the previous reports on SPEs in other semiconductor materials [4,29,30]. At 373 K, the fluorescence intensity dropped to 21.5 × 10³ cps, which was 76.8% of that at RT. The effect of competing non-radiative transition pathways and the energy transfer from the emitter to other neighboring defects might be the main reasons for the fluorescence intensity decrease [29,30,31,32]. Assuming one non-radiative pathway with activation energy ΔE, the drop in intensity at high temperature can be explained by a simple model involving competition between the radiative transition responsible for the fluorescence emission and the non-radiative transition [32]. The fluorescence intensity I on the temperature T can be described by the Arrhenius equation [33]:
I = Ip/(1 + Ap exp (−ΔE/kBT)),
where Ip is the fluorescence intensity at 0 K, Ap is a model-dependent specific parameter, and kB is the Boltzmann constant. By fitting with Equation (1), the results for ΔE and Ap under 0.15 mW excitation were 0.192 eV and 192.3, respectively. The Ap value in our experiment significantly exceeds the theoretical predictions of the three-level model system, where Ap hardly exceeds 1 [32]. Therefore, a four-level model involving shelving state |3⟩ and the fourth level |4⟩ may account for the quenching mechanism of this SPE, as shown in the right-upper inset of Figure 2a, including ground state |1⟩ and excited state |2⟩. The fourth level |4⟩ is placed at 0.192 eV above the excited state |2⟩ and radiatively connected with the shelving state |3⟩. In other words, during the fluorescence emission from the SPE, the radiative transition serves as the dominant pathway at RT. However, at high temperatures, thermal kinetic energy supplies energy equivalent to kBT, allowing some electrons to undergo non-radiative transitions back to the ground state [34]. This enhanced non-radiative transition rate accounts for the decrease in fluorescence intensity. In addition, the bottom-left inset of Figure 2a shows the power saturation curve of the fluorescence signal of the SPE at RT. Fitting is performed using
I = Is × P/(P + Ps),
where Is is the maximal emission counts and Ps is the saturation excitation laser power. Is = 39.5 × 10³ cps and Ps = 51.5 μW were obtained by fitting the experimental data with Equation (2). The bottom-left inset of Figure 2a shows the power saturation curve of the SPE’s fluorescence signal and its background at RT.
As shown in Figure 2b, the stability of the SPE at RT and high temperature was recorded. The APD detected the fluorescence intensity on the time scale of 200 s. Under pulsed laser excitation, the fluorescence intensity of the emitter exhibits good stability at RT and is consistent with the intensity in Figure 2b. While at high temperature, flickering and jittering in the fluorescence intensity can be observed. The fluorescence stability is evaluated with a coefficient of variation CV = σ/μ, where σ is the standard deviation and μ is the mean value of the intensity during the measurement [35]. For the target SPE, we obtained a CV of 0.04 at RT and 0.07 at 373 K, respectively. Compared to RT, the dispersion degree of the intensity stability at high temperature was slightly higher. But it was found that when the temperature was fixed at 373 K, the fluorescence intensity would recover once the SPE position was optimized after drifting. Therefore, the reason for the flickering may be the deviation of the SPE position during the long-term stability measurement, since the thermal expansion of the heating device or the ITO stage will cause a slight displacement of the sample during the temperature-rising period.
The fluorescence lifetimes, which were measured at RT and 373 K under pulsed laser excitation, are presented in Figure 3a. The results indicated discrepancies in the intensity index between the lifetime curves at the two temperatures. We also recorded the TCSPC photon counting histogram of the green pulsed laser, using the laser pulse synchronization signal as the trigger and the APD output as the stop signal. As shown by the green curve in Figure 3a, we obtained the FWHM of the curve at 477 ± 6.3 ps as the instrument response function (IRF), including the factors from the laser pulse duration, the trigger signal rising edge, the timing jitter of the APD, and the temporal resolution of the TCSPC. The red fitting curve presents the true lifetime curve obtained by convolving the measured data of the SPE’s fluorescence lifetime at room temperature with the instrument IRF. We convolved the curve at every temperature with the IRF to derive the fluorescence lifetime as a function of temperature (gray dots) in Figure 3b and its error bars. When the temperature is below 350 K, the fluorescence lifetime remains stable at around 1.5 ns. As the temperature further increases, the fluorescence lifetime shows a tendency to shorten that is consistent with previous research results [36]. This also further confirms an increase in the proportion of non-radiative channels [33].
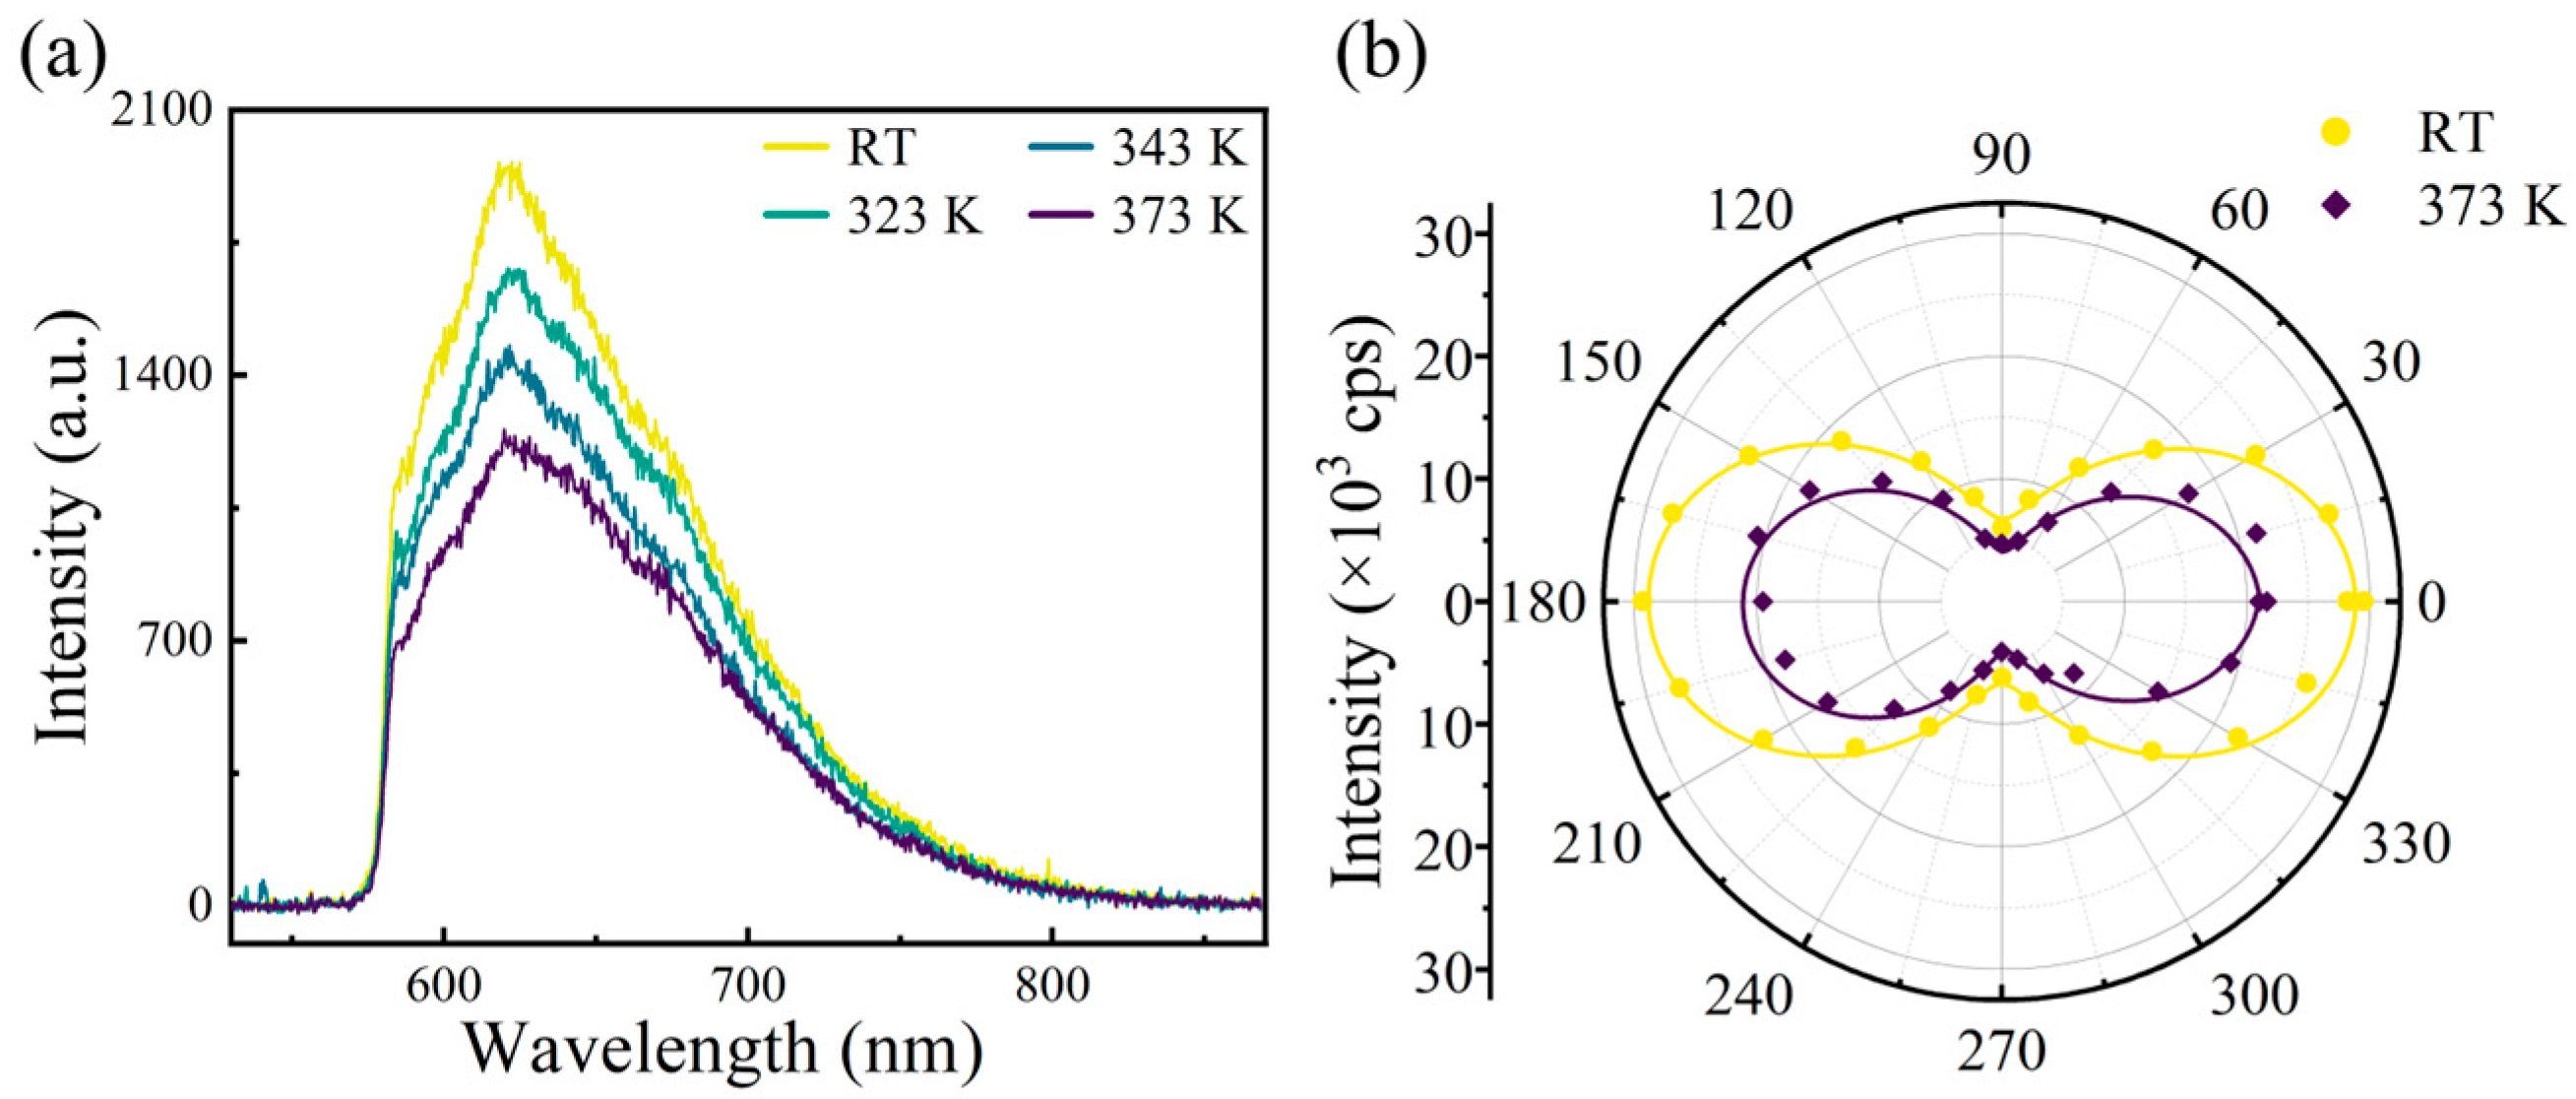
We monitored the evolution of the fluorescence spectra within a temperature range from RT to 373 K, as shown in Figure 4a. The characterization results indicate that the SPE exhibits a broad fluorescence spectrum at room temperature, with no discernible zero-phonon line (ZPL) observed. To date, no relevant studies have explained this phenomenon; however, the broadening of the phonon sidebands is mainly caused by electron–phonon coupling [37,38,39]. A dichroic mirror with a cutoff wavelength of 580 nm was used in the experiment to remove the sharp Raman characteristic peaks near 555 nm and 561 nm [40]. It can be directly observed that as the temperature increases, the fluorescence spectral profile stays the same with only changes in the intensity. There was no redshift or blueshift phenomenon in the spectra, though a temperature-dependent redshift of defects’ optical transition is common in semiconductors due to the bulk lattice constant with temperature increasing [41,42]. Perhaps the temperature studied here is insufficient to generate changes in the bulk lattice constant or coupling with the local lattice strain of other defects, and, thus, it does not cause a redshift. Additionally, based on the similar fluorescence spectrum and fluorescence lifetime reported in ref. [43], we hold the view that the target SPE in this study is an oxidation-associated defect in 3C-SiC, which was fabricated by annealing in an oxygen atmosphere. According to the results in ref. [43], annealing at a temperature above 550 °C can create similar defects. Since the annealing temperature (used in ref. [43]) is higher than the maximum temperature set in our experiments, it can further exclude the impact of lattice damage.
At the same time, we measured the emission polarization of the SPE at RT and 373 K, as shown in Figure 4b. The experimental data were fitted with a function I = I0 × (1 + Vcos θ), and the SPE exhibits an emission polarization visibility at both RT and high temperature. Notably, the maximum values of each profile were precisely aligned, which provides further compelling evidence for its stability. The linear polarization degree is calculated using
V = (ImaxImin)/(Imax + Imin),
where Imax and Imin are the maximum and minimum intensities in the orthogonal polarizations. The linear polarization degree of the SPE’s emission at RT and 373 K is 66% and 68%, respectively, indicating that even at high temperature, the SPE remains a linearly polarized emission. SPEs that exhibit stable polarization characteristics under high-temperature conditions are likely to be a crucial component for on-chip quantum communication founded on polarization-based protocols. Moreover, they can serve as a qubit source in linear optical quantum computing [30].
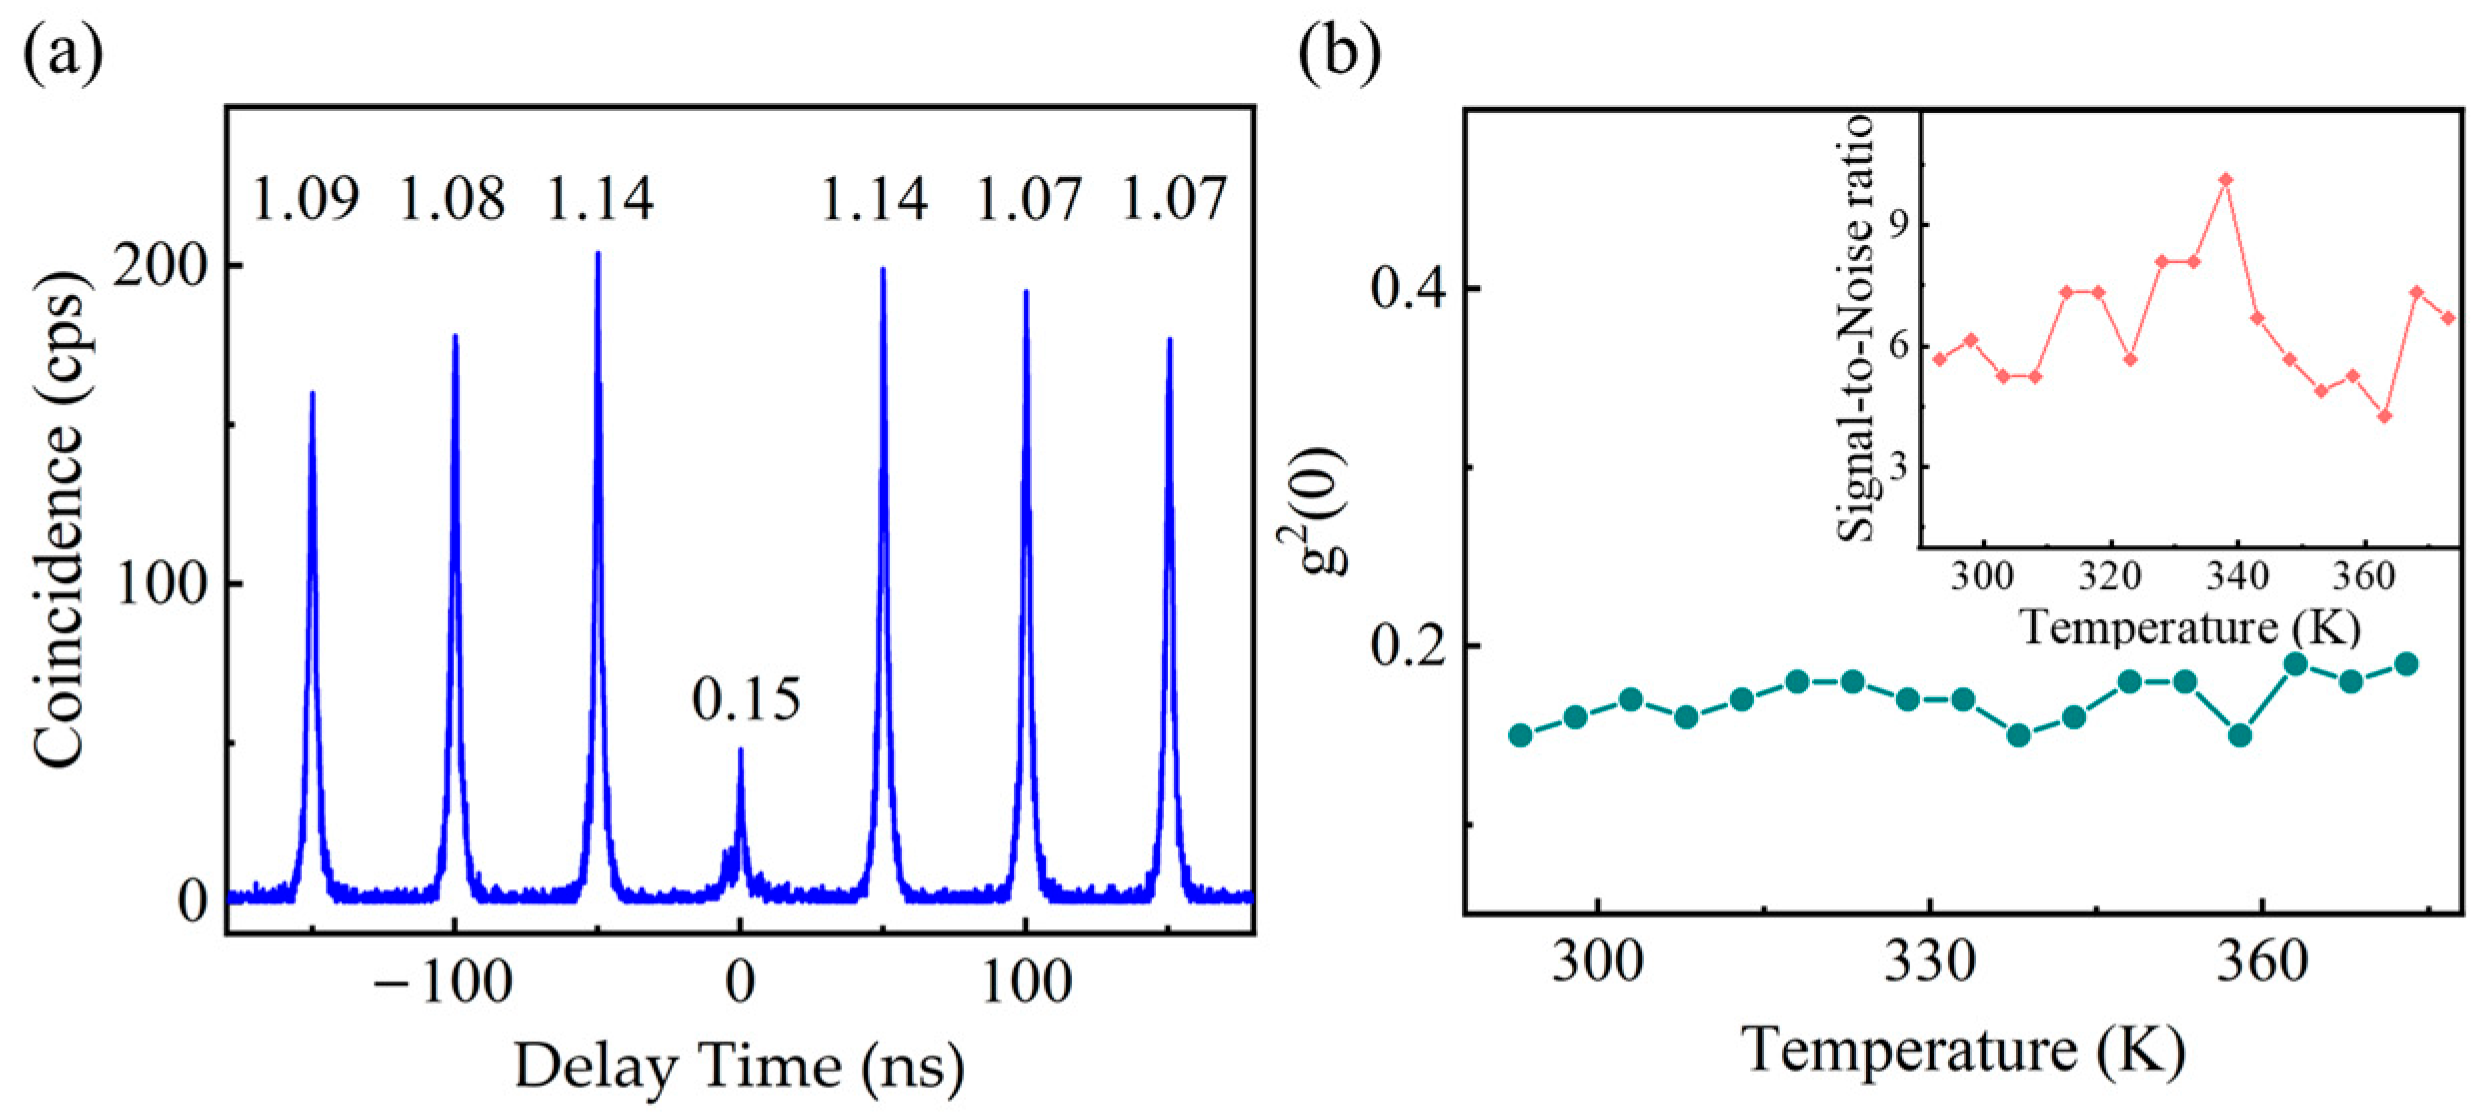
In addition, to analyze the emission purity, we evaluated the single-photon nature of the SPE through photon correlation measurements using the HBT setup at RT. The g2(τ) was measured under pulsed excitation, as depicted in Figure 5a. The pulse duration of the laser was 12 ps, which was much shorter than the radiative lifetime of the SPE, thus avoiding the secondary excitation of the SPE within a single excitation pulse. At an excitation power of 0.15 mW, the counts of the two detectors were 18.5 kcps and 18 kcps, respectively, with a background count rate of 3.5 kcps for both. Under pulsed laser excitation, the peak total coincidence counts c(m) measured within the measurement duration and pulse repetition period can be normalized by the following formula:
CN(m) = c(m)/N1N2θT,
Under a repetition period of θ = 50 ns and a measurement time of T = 200 s, we experimentally observed photon correlations under triggered emission. We normalized the coincidence of the peak areas marked at the top of each peak according to Equation (3), thereby verifying the single nature of the SPE. After normalization and background correction [44], the coincidence peak at zero delay time corresponds to g2(0) = 0.15, showing evidence of the antibunching emission from the single defect at RT. The difference between the g2(0) value expected for an ideal SPE arises from a reduced signal-to-background ratio under pulsed laser excitation, as compared to that measured under CW laser excitation. Meanwhile, the values of g2(0) are plotted as a function of temperature for the SPE in Figure 5b. The inset at the top-right corner of Figure 5b shows the variation in the signal-to-noise ratio over the entire temperature range. The g2(0) remains constant throughout the entire temperature range and stays below 0.5. This indicates that the photon purity remains invariant over the whole temperature span. Stable and high-purity fluorescence emission in high-temperature environments implies that this type of SPE, as an information carrier, can still maintain excellent optical activity in optoelectronic integrated devices regardless of temperature variations or high-density integration.
To further explore the universality of fluorescence properties of SPEs in 3C-SiC, Table 1 summarizes the comparison between other SPEs in the same sample and the primary research object of this experiment (SPE1). The table details the fluorescence characteristic parameters of each SPE (including fluorescence spectra, lifetime, and g2(τ), etc.) at RT and presents the activation energy values related to the temperature dependence of fluorescence intensity obtained via Arrhenius equation fitting. The results showed that although there were slight differences in the room-temperature fluorescence properties among different SPEs, their activation energies were all within a similar order of magnitude and comparable to that of the SPE focused on in this study (0.192 eV), indicating that the temperature response mechanism of SPEs in this system has inherent consistency. These supplementary data provide more comprehensive experimental support for the diversity of optical properties and temperature-dependent laws of SPEs in 3C-SiC.

4. Conclusions

In summary, our work explored the temperature-dependent fluorescence properties of a single SPE within 3C-SiC in the temperature range of 293 K to 373 K. We attributed the comparative decrease in the fluorescence intensity with increasing temperature to population transfer to a shelving state, enhanced by a transition channel with an activation energy of 0.192 eV. It might be worth exploring whether the SPEs have a temperature threshold at which non-radiative transition channels dominate, leading to an abrupt decay in fluorescence intensity. This requires further experimental verification and analysis. We discovered that the fluorescence spectra, fluorescence lifetimes, and the single-photon properties remained unaffected by temperature variations. This indicates that when operating at high temperatures, the fluorescence properties and photon purity of SPEs in 3C-SiC remain constant.
These results offer new possibilities for integrating 3C-SiC SPEs into large-scale on-chip quantum optoelectronic devices operating under high-temperature conditions, as well as high-spatial-resolution high-temperature quantum devices. In addition, among all SiC polytypes, 3C-SiC has the best thermal properties, with an extremely high isotropic thermal conductivity at room temperature, exceeding 500 W·m−1·K−1, and electrical properties (the highest channel mobility) [45,46,47]. This makes 3C-SiC materials with stable SPEs at high temperatures an ideal candidate for next-generation quantum sensors and optoelectronic applications. Our findings also provide crucial information on the photophysical properties of defects in 3C-SiC materials, strongly facilitating in-depth research in this field.

Author Contributions

Conceptualization, E.W., M.H. and Y.W.; methodology, E.W. and M.H.; software, J.L.; validation, M.H. and E.W.; formal analysis, M.H.; investigation, M.H.; resources, E.W.; data curation, M.H.; writing—original draft preparation, M.H.; writing—review and editing, M.H., Y.W., J.L., Y.C., B.W. and E.W.; supervision, B.W. and E.W. All authors have read and agreed to the published version of the manuscript.

Funding

This research was funded by the National Natural Science Foundation of China, grant number 12274137.

Data Availability Statement

The data that support the findings of this study are available from the corresponding authors upon reasonable request.

Conflicts of Interest

The authors declare no conflicts of interest.

Abbreviations

3C-SiCCubic silicon carbide
SPEsSingle-photon emitters
RTRoom temperature
ITOIndium–tin–oxide
APDAvalanche photo-diode single-photon detectors
HBTHanbury Brown and Twiss
TCSPCTime-correlated single-photon counter
CWContinuous wave
PZTPiezoelectric ceramic transducer
Obj.Objective
cpsCounts per second
IRFInstrument response function

Appendix A

Appendix A.1

To calculate the fluorescence quantum efficiency at RT, we modeled the three-level system of this SPE, which includes ground state |1⟩, excited state |2⟩, and metastable state |3⟩. These states are coupled by the transition rate coefficient r i j , where r i j (with i, j = 1, 2, and 3) indicates the transition rate from level |i〉 to level |j〉. In the three-level system, there is a clear difference in photon emission during the transition of excited particles: when transitioning from the excited state |2⟩ back to the ground state |1⟩, photon emission occurs, with a radiative decay coefficient of r 21 ; in contrast, no photon emission takes place when transitioning from the metastable state |3⟩ to the ground state |1⟩ via the non-radiative decay coefficient r 31 . Furthermore, r 23 acts as a non-radiative channel, and once particles are in the metastable state, no photon emission occurs. Therefore, an optical transition system involving at least one metastable state must exhibit power dependence. Based on this, we measured the g2(τ) data under different continuous-wave power conditions at room temperature.
In the short timescale ( τ 20 ns), the g2(τ) could be fitted using a three-level model according to
g 2 ( τ )   =   ( 1   +   α ) ( 1     e λ 1 τ ) .
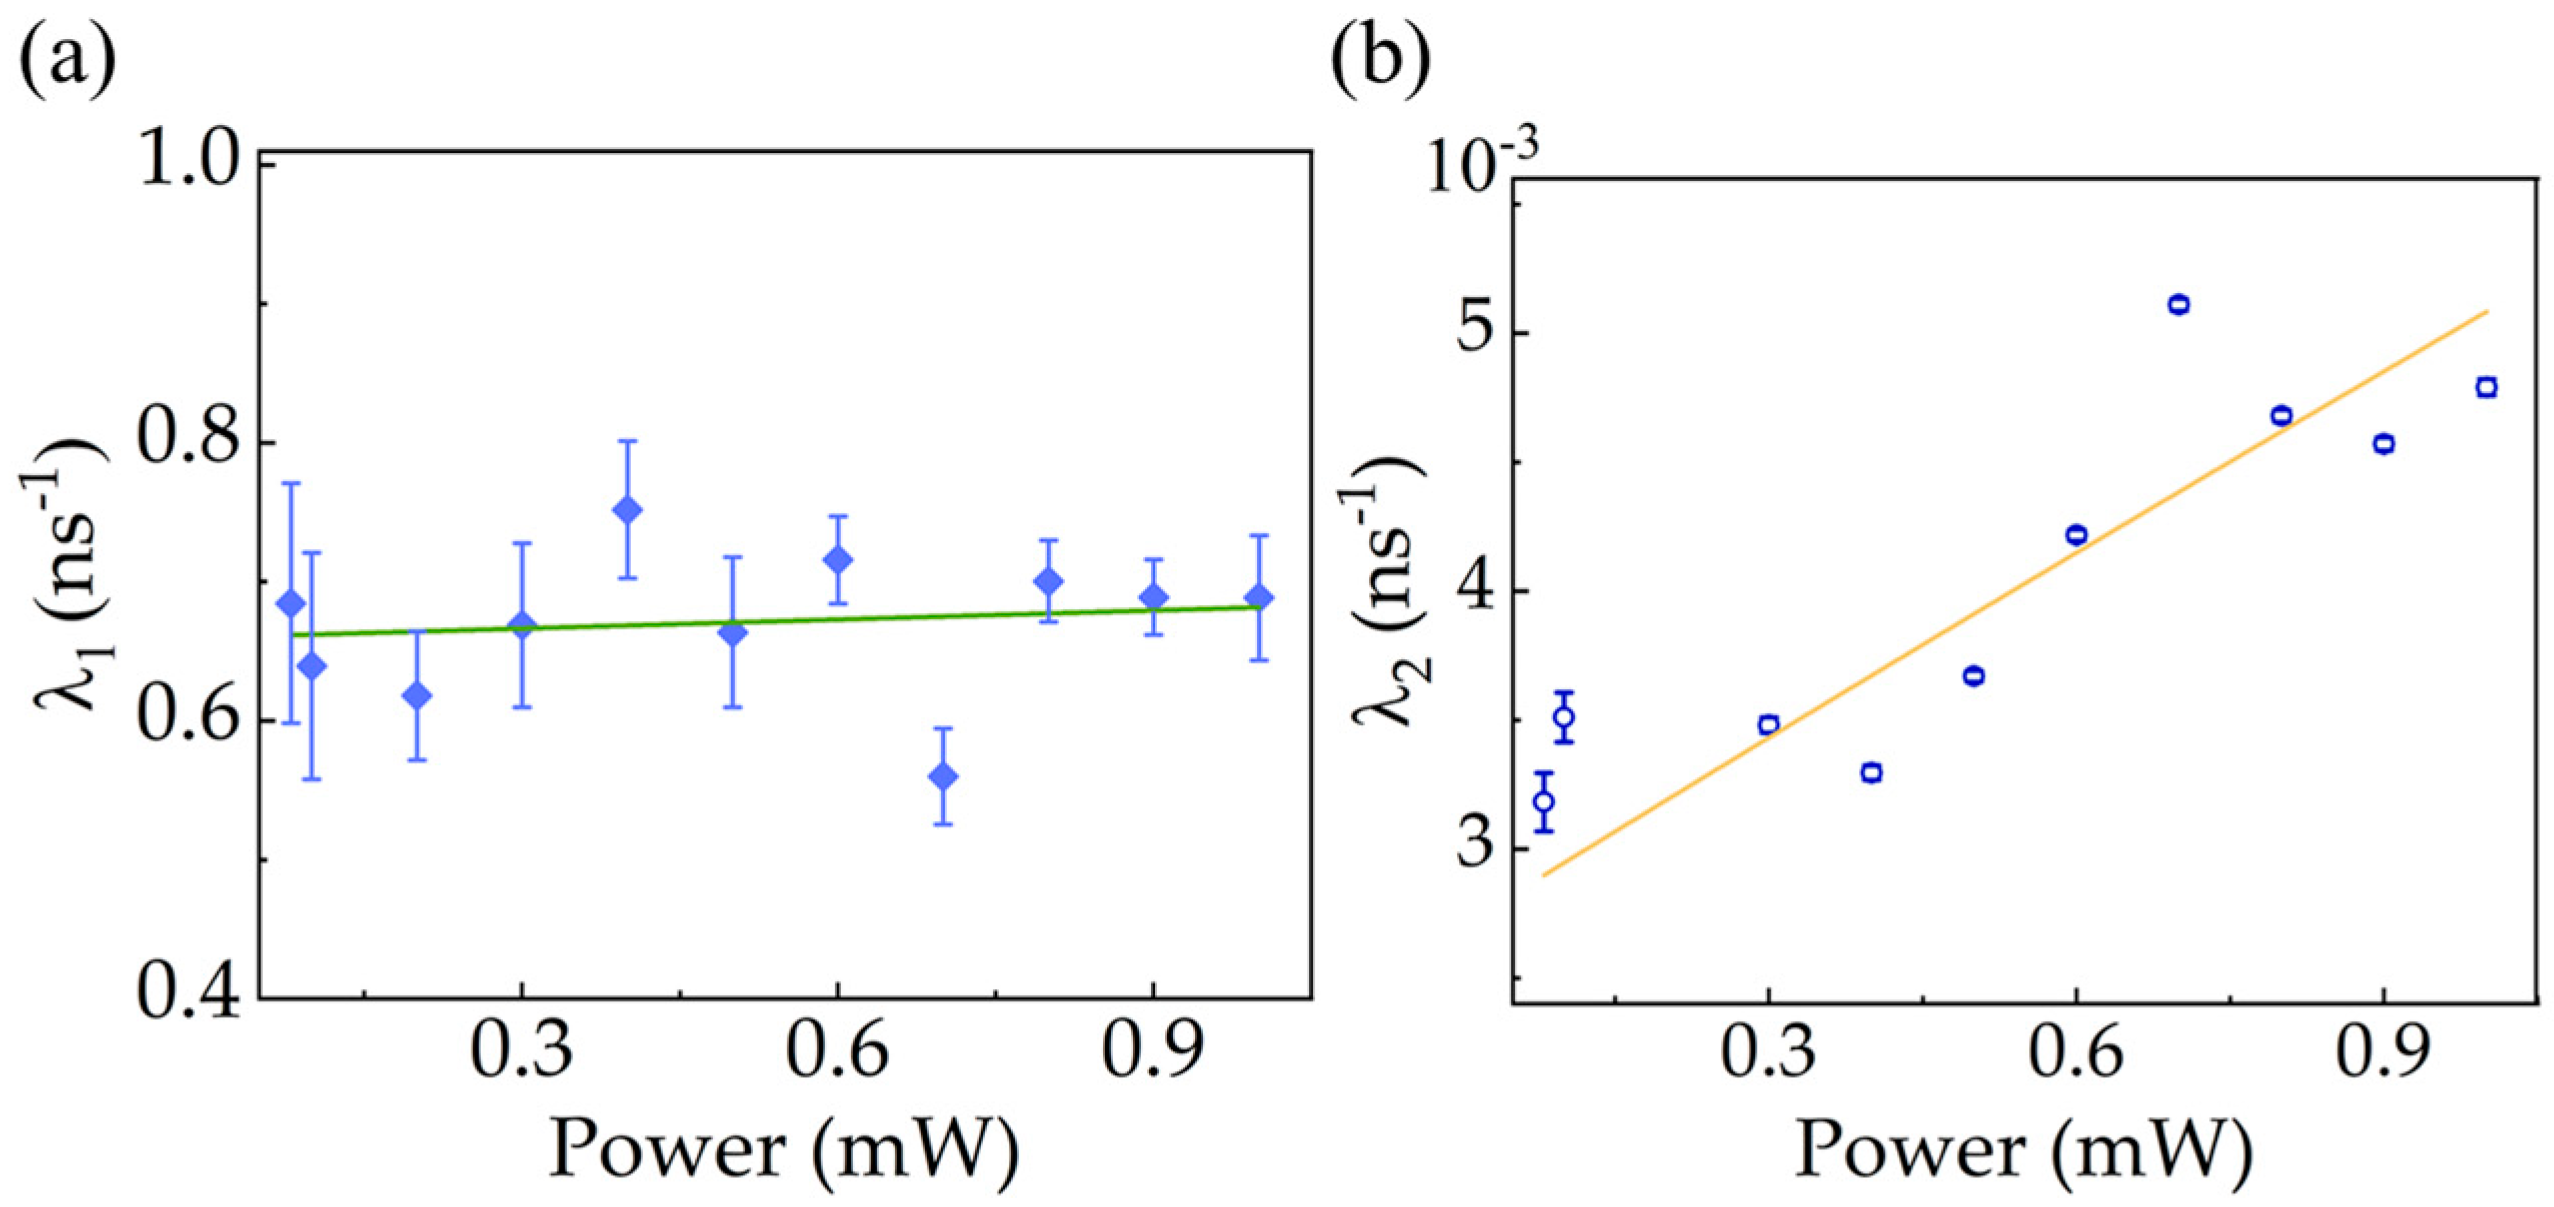
By linearly fitting the antibunching parameter λ1 as a function of the excitation power, as shown in Figure A1a, we can obtain the value of r 21 and r 12 . For the SPE studied in Figure A1a, we obtained r 21 = 0.66 ns−1 by extrapolating the linear fit to zero excitation power. Calculations show that the excited state lifetime is as short as 1.52 ns, which is consistent with the fluorescence lifetime measured under pulsed laser excitation. On the long timescale, the g2(τ) function was unperturbed by the bunching associated with the fluorescence of the SPE. The experimental data can be fit optimally according to
g 2 ( τ )   =   1   +   α e λ 2 τ ,
λ 2 = r 31 + r 23 r 12 / ( r 12 + r 21 ) ,
where λ2 is the bunching fit parameter. The g2(τ) value consistently exceeds its long-timescale counterpart, a result of the bunching effect arising from leakage into the metastable level within the three-level model. Figure A1b shows λ2 as a function of the excitation power and fitted according to Equation (A3). We have r 31 = 2.33 × 10⁻³ ns−1 and r 31 = 9.09 × 10⁻² ns−1. The results show that single-photon emitters increase the population of metastable states under high excitation power (a non-radiative process), confirming the involvement of metastable states in the transition dynamics at RT.
Figure A1. (a) Power dependence of the fitting parameters λ1 in the second-order autocorrelation functions and fitting (green curve). The error bars show the standard deviation obtained from multiple measurements; (b) power dependence of fitting parameters λ2 with fitting (yellow curve). The error bars show the standard deviation obtained from multiple measurements.
Photonics 12 00920 g0a1
The fluorescence quantum efficiency can be estimated using the following formula [48]:
R = ƞ det ƞ Q r 21 ( r 21 r 12 + r 23 r 31 + 1 ) ,
where R is the total count rate of the SPE under saturation excitation power, ƞdet and ƞQ imply the detection efficiency of the whole confocal microscope system and the fluorescence quantum efficiency, respectively. Taking the values of r 21 , r 12 , r 23 , r 31 , and R into Equation (A4), we obtained ƞdet × ƞQ = 5.68 × 10⁻² from this SPE. In our experimental setup, ƞdet is limited by the collection efficiency of the microscope objective ηObj, transmittance of the objective ηtrans, transmittance of the optics (lens, dichroic mirror, filter, half-wave plate, and polarized beam splitter) ηopt, and quantum efficiency of silicon avalanche photodiodes ηAPD at the wavelength of the visible range. The estimated detection efficiency is the product of ηObj, ηtrans, ηopt, and ηAPD, with a value of approximately 8.46 × 10⁻². The fluorescence quantum efficiency ηQ is roughly estimated to be approximately 67%.

References

  1. Hoang, T.M.; Ishiwata, H.; Masuyama, Y.; Yamazaki, Y.; Kojima, K.; Lee, S.Y.; Ohshima, T.; Iwasaki, T.; Hisamoto, D.; Hatano, M. Thermometric quantum sensor using excited state of silicon vacancy centers in 4H-SiC devices. Appl. Phys. Lett. 2021, 118, 044001. [Google Scholar] [CrossRef]
  2. Luo, Q.Y.; Li, Q.; Wang, J.F.; Guo, P.J.; Lin, W.X.; Zhao, S.; Hu, Q.C.; Zhu, Z.Q.; Xu, J.S.; Li, C.F.; et al. Fabrication and quantum sensing of spin defects in silicon carbide. Front. Phys. 2023, 11, 1270602. [Google Scholar] [CrossRef]
  3. He, M.T.; Cao, Y.J.; Lin, J.J.; Ju, Z.P.; Wu, B.T.; Wu, E. Ultrafast optical modulation of the fluorescence from a single-photon emitter in silicon carbide. Photon. Res. 2024, 12, 941–946. [Google Scholar] [CrossRef]
  4. Andrini, G.; Amanti, F.; Armani, F.; Bellani, V.; Bonaiuto, V.; Cammarata, S.; Campostrini, M.; Dao, T.H.; De Matteis, F.; Demontis, V.; et al. Solid-state color centers for single-photon generation. Photonics 2024, 11, 188. [Google Scholar] [CrossRef]
  5. Huang, X.Y.; Horder, J.; Yamamura, K.; Wong, W.W.; Aharonovich, I.; Wang, N.Y.; Jagadish, C.; Tan, H.H. Bottom-up single quantum dots in microring resonators for on-chip integrated single emitters. Nano Lett. 2025, 25, 6318–6324. [Google Scholar] [CrossRef]
  6. Yi, A.L.; Wang, C.L.; Zhou, L.P.; Zhu, Y.F.; Zhang, S.B.; You, T.G.; Zhang, J.X.; Ou, X. Silicon carbide for integrated photonics. Appl. Phys. Rev. 2022, 9, 031302. [Google Scholar] [CrossRef]
  7. Jing, B.; Wei, S.H.; Zhang, L.Y.; Zhou, D.L.; He, Y.X.; Zou, X.H.; Pan, W.; Song, H.Z.; Yan, L.S. Approaching scalable quantum memory with integrated atomic devices. Appl. Phys. Rev. 2024, 11, 031304. [Google Scholar] [CrossRef]
  8. Zhigulin, I.; Park, G.; Yamamura, K.; Watanabe, K.; Taniguchi, T.; Toth, M.; Kim, J.; Aharonovich, I. Electrical generation of color centers in hexagonal boron nitride. ACS Appl. Mater. 2025, 17, 24129–24136. [Google Scholar] [CrossRef]
  9. Sun, S.; Kim, H.; Luo, Z.C.; Solomon, G.S.; Waks, E. A single-photon switch and transistor enabled by a solid-state quantum memory. Science 2018, 361, 57–59. [Google Scholar] [CrossRef] [PubMed]
  10. Wang, G.B.; Sheng, D.; Yang, Y.F.; Li, H.; Chai, C.C.; Xie, Z.K.; Wang, W.J.; Guo, J.G.; Chen, X.L. High-quality and wafer-scale cubic silicon carbide single crystals. Energy Environ. Mater. 2024, 7, e12678. [Google Scholar] [CrossRef]
  11. Zhang, Q.N.; Wang, J.T.; Poon, A.W. Silicon carbide microring resonators for integrated nonlinear and quantum photonics based on optical nonlinearities. Photonics 2024, 11, 701. [Google Scholar] [CrossRef]
  12. He, Z.X.; Zhou, J.Y.; Li, Q.; Lin, W.X.; Liang, R.J.; Wang, J.F.; Wen, X.L.; Hao, Z.H.; Liu, W.; Ren, S.; et al. Robust single modified divacancy color centers in 4H-SiC under resonant excitation. Nat. Commun. 2024, 15, 10146. [Google Scholar] [CrossRef]
  13. Hao, Z.H.; Zhou, J.Y.; Li, Q.; Liu, W.; Lin, W.X.; He, Z.X.; Wang, X.X.; Ren, S.; Liang, R.J.; Li, H.; et al. Photon collection enhancement of shallow single spin defects in silicon carbide. ACS Photon. 2024, 11, 4725–4732. [Google Scholar] [CrossRef]
  14. Lienhard, B.; Schröder, T.; Mouradian, S.; Dolde, F.; Tran, T.T.; Aharonovich, I.; Englund, D. Bright and photostable single photon emitter in silicon carbide. Optica 2016, 3, 768–774. [Google Scholar] [CrossRef]
  15. Lohrmann, A.; Johnson, B.C.; McCallum, J.C.; Castelletto, S. A review on single photon sources in silicon carbide. Rep. Prog. Phys. 2017, 80, 034502. [Google Scholar] [CrossRef] [PubMed]
  16. Yan, F.F.; Yi, A.L.; Wang, J.F.; Li, Q.; Yu, P.; Zhang, J.X.; Gali, A.; Wang, Y.; Xu, J.S.; Ou, X.; et al. Room-temperature coherent control of implanted defect spins in silicon carbide. npj Quantum Inf. 2020, 6, 38. [Google Scholar] [CrossRef]
  17. Widmann, M.; Lee, S.Y.; Rendler, T.; Son, N.T.; Fedder, H.; Paik, S.; Yang, L.P.; Zhao, N.; Yang, S.; Booker, I.; et al. Coherent control of single spins in silicon carbide at room temperature. Nat. Mater. 2015, 14, 164–168. [Google Scholar] [CrossRef]
  18. Couteau, C.; Barz, S.; Durt, T.; Gerrits, T.; Huwer, J.; Prevedel, R.; Rarity, J.; Shields, A.; Weihs, G. Applications of single photons to quantum communication and computing. Nat. Rev. Phys. 2023, 5, 326–338. [Google Scholar] [CrossRef]
  19. Aharonovich, I.; Englund, D.; Toth, M. Solid-state single-photon emitters. Nat. Photon. 2016, 10, 631–641. [Google Scholar] [CrossRef]
  20. Kubota, K.; Hatano, Y.; Kainuma, Y.; Shin, J.; Nishitani, D.; Shinei, C.; Taniguchi, T.; Teraji, T.; Onoda, S.; Ohshima, T.; et al. Wide temperature operation of diamond quantum sensor for electric vehicle battery monitoring. Diam. Relat. Mater. 2023, 135, 109853. [Google Scholar] [CrossRef]
  21. Wei, B.; Zhang, X.T.; Li, W.; Li, J.L.; Li, Y.H.; Gao, Q.L.; Hong, J.W.; Nan, C.W.; Lin, Y.H. Optical phonons on thermal conduction in advanced materials. Appl Phys. Rev. 2025, 12, 100324. [Google Scholar] [CrossRef]
  22. Xue, X.M.; Chen, M.L.; Luo, Y.N.; Qin, T.L.; Tang, X.; Hao, Q. High-operating-temperature mid-infrared photodetectors via quantum dot gradient homojunction. Light-Sci. Appl. 2023, 12, 2. [Google Scholar] [CrossRef]
  23. Csóré, A.; Ivanov, I.G.; Son, N.T.; Gali, A. Fluorescence spectrum and charge state control of divacancy qubits via illumination at elevated temperatures in 4H silicon carbide. Phys. Rev. B 2022, 105, 165108. [Google Scholar] [CrossRef]
  24. Barbosa, I.C.; Gutsche, J.; Lönard, D.; Dix, S.; Widera, A. Temperature dependence of charge conversion during NV-center relaxometry in nanodiamond. Phys. Rev. Res. 2024, 6, 023078. [Google Scholar] [CrossRef]
  25. Luo, Q.Y.; Zhao, S.; Hu, Q.C.; Quan, W.K.; Zhu, Z.Q.; Li, J.J.; Wang, J.F. High-sensitivity silicon carbide divacancy-based temperature sensing. Nanoscale 2023, 15, 8432–8436. [Google Scholar] [CrossRef]
  26. Lin, W.X.; Yan, F.F.; Li, Q.; Wang, J.F.; Hao, Z.H.; Zhou, J.Y.; Li, H.; You, L.X.; Xu, J.S.; Li, C.F.; et al. Temperature dependence of divacancy spin coherence in implanted silicon carbide. Phys. Rev. B 2021, 104, 125305. [Google Scholar] [CrossRef]
  27. He, M.T.; Ju, Z.P.; Xue, Y.X.; Lin, J.J.; Cao, Y.J.; Wu, B.T.; Wu, E. Bright single-photon emitters in cubic silicon carbide. IEEE J. Quantum Electron. 2024, 30, 0100106. [Google Scholar] [CrossRef]
  28. Buckley, S.; Rivoire, K.; Vuckovic, J. Engineered quantum dot single-photon sources. Rep. Prog. Phys. 2012, 75, 126503. [Google Scholar] [CrossRef] [PubMed]
  29. Kianinia, M.; Regan, B.; Tawfik, S.A.; Tran, T.T.; Ford, M.J.; Aharonovich, I.; Toth, M. Robust Solid-State Quantum System Operating at 800 K. ACS Photon. 2017, 4, 768–773. [Google Scholar] [CrossRef]
  30. Wang, T.; Puchtler, T.J.; Zhu, T.; Jarman, J.C.; Nuttall, L.P.; Oliver, R.A.; Taylor, R.A. Polarisation-controlled single photon emission at high temperatures from InGaN quantum dots. Nanoscale 2017, 9, 9421–9427. [Google Scholar] [CrossRef]
  31. Sato, S.; Narahara, T.; Abe, Y.; Hijikata, Y.; Umeda, T.; Ohshima, T. Formation of nitrogen-vacancy centers in 4H-SiC and their near infrared photoluminescence properties. J. Appl. Phys. 2019, 126, 083105. [Google Scholar] [CrossRef]
  32. Lagomarsino, S.; Gorelli, F.; Santoro, M.; Fabbri, N.; Hajeb, A.; Sciortino, S.; Palla, L.; Czelusniak, C.; Massi, M.; Taccetti, F.; et al. Robust luminescence of the silicon-vacancy center in diamond at high temperatures. AIP Adv. 2015, 5, 127117. [Google Scholar] [CrossRef]
  33. Li, H.; Zhang, X.H. Temperature-dependent photoluminescence and time-resolved photoluminescence study of monolayer molybdenum disulfide. Opt. Mater. 2020, 107, 110150. [Google Scholar] [CrossRef]
  34. Lao, X.Z.; Yang, Z.; Su, Z.C.; Wang, Z.L.; Ye, H.G.; Wang, M.Q.; Yao, X.; Xu, S.J. Luminescence and thermal behaviors of free and trapped excitons in cesium lead halide perovskite nanosheets. Nanoscale 2018, 10, 9949–9956. [Google Scholar] [CrossRef]
  35. Senichev, A.; Peana, S.; Martin, Z.O.; Sychev, D.; Xu, X.H.; Kudyshev, Z.; Lagutchev, A.S.; Boltasseva, A.; Shalaev, V.M. Room-temperature single-photon emitters in silicon nitride. Sci. Adv. 2021, 7, eabj0627. [Google Scholar] [CrossRef]
  36. Li, Q.; Zhou, J.Y.; Liu, Z.H.; Xu, J.S.; Li, C.F.; Guo, G.C. Stable single photon sources in the near C-band range above 400 K. J. Semicond. 2019, 40, 072902. [Google Scholar] [CrossRef]
  37. Guo, R.A.; Wang, K.Y.; Tian, Y.M.; Wang, H.X. Nitrogen vacancy luminescence and their phonon sidebands characteristics in nitrogen-doped diamond. J. Alloys Compd. 2022, 924, 166507. [Google Scholar] [CrossRef]
  38. Zhao, H.Q.; Fujiwara, M.; Takeuchi, S. Suppression of fluorescence phonon sideband from nitrogen vacancy centers in diamond nanocrystals by substrate effect. Opt. Express 2012, 20, 15628–15635. [Google Scholar] [CrossRef]
  39. Khatri, P.; Luxmoore, I.J.; Ramsay, A.J. Phonon sidebands of color centers in hexagonal boron nitride. Phys. Rev. B 2019, 100, 125305. [Google Scholar] [CrossRef]
  40. Kim, S.K.; Jung, E.Y.; Lee, M.H. Purity evaluation of highly oriented cubic silicon carbide using micro-raman spectroscopy. Trans. Electr. Electron. Mater. 2022, 23, 318–325. [Google Scholar] [CrossRef]
  41. Muckel, F.; Lorenz, S.; Yang, J.; Nugraha, T.A.; Scalise, E.; Hyeon, T.; Wippermann, S.; Bacher, G. Exciton-driven change of phonon modes causes strong temperature dependent bandgap shift in nanoclusters. Nat. Commun. 2020, 11, 4127. [Google Scholar] [CrossRef] [PubMed]
  42. Ari, O.; Polat, N.; Firat, V.; Çakir, Ö.; Ates, S. Temperature-dependent spectral properties of hexagonal boron nitride color centers. ACS Photon. 2025, 12, 1676–1682. [Google Scholar] [CrossRef]
  43. Lohrmann, A.; Castelletto, S.; Klein, J.R.; Ohshima, T.; Bosi, M.; Negri, M.; Lau, D.W.M.; Gibson, B.C.; Prawer, S.; McCallum, J.C.; et al. Activation and control of visible single defects in 4H-, 6H-, and 3C-SiC by oxidation. Appl. Phys. Lett. 2016, 108, 021107. [Google Scholar] [CrossRef]
  44. Liu, Y.; Siyushev, P.; Rong, Y.Y.; Wu, B.T.; McGuinness, L.P.; Jelezko, F.; Tamura, S.; Tanii, T.; Teraji, T.; Onoda, S.; et al. Investigation of the silicon vacancy color center for quantum key distribution. Opt. Express 2015, 23, 32961–32967. [Google Scholar] [CrossRef]
  45. Cheng, Z.; Liang, J.B.; Kawamura, K.; Zhou, H.; Asamura, H.; Uratani, H.; Tiwari, J.; Graham, S.; Ohno, Y.; Nagai, Y.; et al. High thermal conductivity in wafer-scale cubic silicon carbide crystals. Nat. Commun. 2022, 13, 7201. [Google Scholar] [CrossRef]
  46. Daoud, S.; Bouarissa, N.; Rekab-Djabri, H.; Saini, P.K. Structural and Thermo-Physical Properties of 3C-SiC: High-Temperature and High-Pressure Effects. Silicon 2022, 14, 6299–6309. [Google Scholar] [CrossRef]
  47. Wang, Q.; Gui, N.; Huang, X.L.; Yang, X.T.; Tu, J.Y.; Jiang, S.Y. The effect of temperature and cascade collision on thermal conductivity of 3C-SiC: A molecular dynamics study. Int. J. Heat. Mass. Tran. 2021, 180, 121822. [Google Scholar] [CrossRef]
  48. Wu, E.; Jacques, V.; Zeng, H.P.; Grangier, P.; Treussart, F.; Roch, J.F. Narrow-band single-photon emission in the near infrared for quantum key distribution. Opt. Express 2006, 14, 1296–1303. [Google Scholar] [CrossRef] [PubMed]
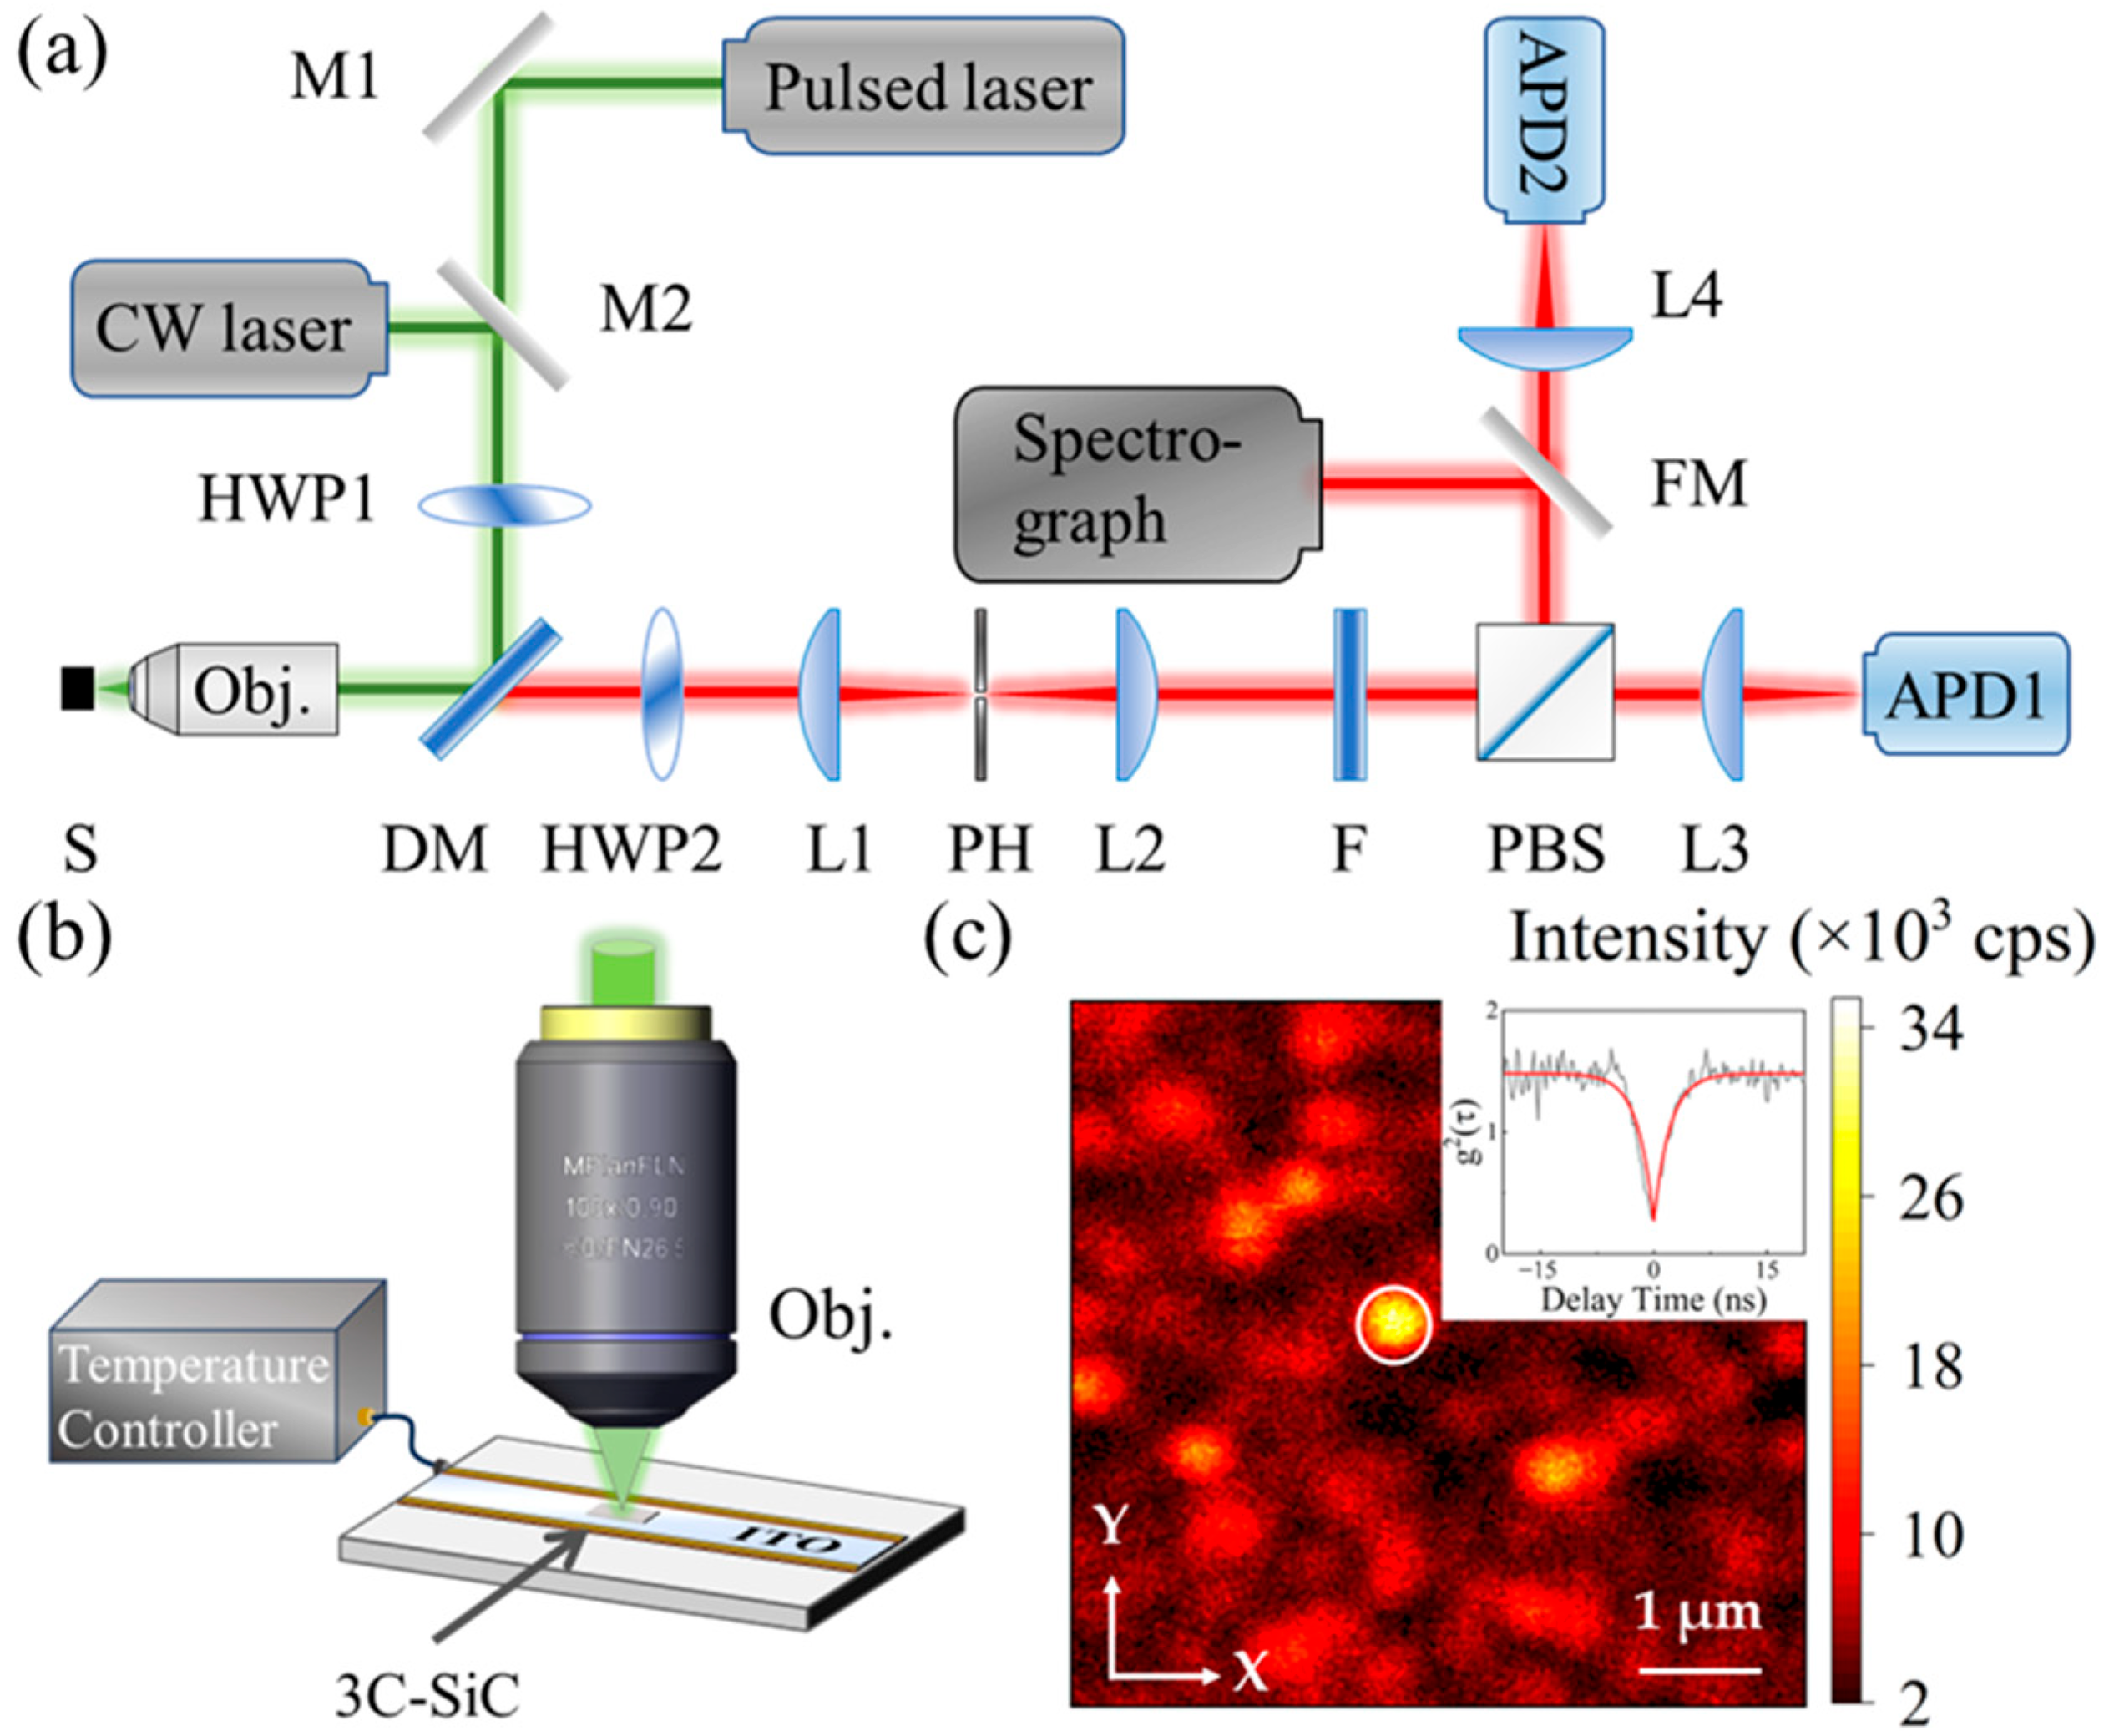
Figure 1. (a) Experimental setup. M1–2: mirrors; HWP1–2: half-wave plates; DM: dichroic mirror reflecting the laser of 532 nm and passing the fluorescence longer than 580 nm; Obj: microscope objective lens; S: sample; L1–4: focusing lenses; PH: pinhole; F: long-pass filter cutting off at 545 nm; PBS: polarized beam splitter; FM: flip mirror; APD1, 2: Si-avalanche photodiode single-photon detectors. (b) Part of the experimental setup. The 3C-SiC sample was set on ITO conductive glass and translated using a piezoelectric ceramic transducer (PZT). For z-axis scanning, the Obj was used to adjust the focal plane; (c) scanning confocal microscope image of the SPEs in the 3C-SiC sample. The target SPE was marked with a white circle. Inset: g2(τ) of the emitter at RT with the fitting curve (red line).
Photonics 12 00920 g001
Figure 2. (a) Temperature-dependent fluorescence intensity of the SPE under pulsed laser excitation. The error bars show the standard deviation obtained from multiple measurements. Blue line is the fitting result using Equation (1). The upper-right inset of (a) shows the four-level model adopted to explain the photophysics of the SPE at high temperatures. The bottom-left inset shows the pulsed-laser-power dependence of the fluorescence intensity at RT (blue dots) and the fitting curve (red line). Black squares are the background noise acquired by focusing the laser at the 3C-SiC sample without emitters and fitting curve (black line); (b) fluorescence stability of the SPE at RT (blue curve) and at 373 K (orange curve) under pulsed laser excitation.
Photonics 12 00920 g002
Figure 3. (a) Fluorescence lifetime of the SPE at RT (yellow curve) and at 373 K (purple curve) measured under the pulsed laser excitation. The true data obtained after convolution with the IRF is represented by a red curve, and the IRF curve is represented by a solid green line; (b) temperature-dependent fluorescence lifetime of the SPE in 3C-SiC. The error bars represent the error values of the fitted lifetimes.
Photonics 12 00920 g003
Figure 4. (a) Fluorescence spectra of SPE at four different temperatures: RT, 323 K, 353 K, and 373 K; (b) fluorescence intensity as a function of the polarization angles at RT (yellow spots) and 373 K (purple spots). Solid lines were the fitting result using a sine function.
Photonics 12 00920 g004
Figure 5. (a) g2(τ) function of the SPE at RT under pulsed laser excitation; (b) temperature-dependent measured g2(0) of the SPE. The inset at the top-right corner shows the signal-to-noise ratio at different temperatures.
Photonics 12 00920 g005
Table 1. Fluorescence properties of four SPEs in 3C-SiC at room temperature and activation energy of temperature dependence of fluorescence intensity.
Lifetime (ns)Spectra (nm)g2(τ)Activation Energy (eV)
SPE11.62580~8000.150.192
SPE21.70580~8000.210.329
SPE3\580~8000.240.294
SPE4\580~8000.210.152
Disclaimer/Publisher’s Note: The statements, opinions and data contained in all publications are solely those of the individual author(s) and contributor(s) and not of MDPI and/or the editor(s). MDPI and/or the editor(s) disclaim responsibility for any injury to people or property resulting from any ideas, methods, instructions or products referred to in the content.