Article

On the “Bi-Phase” of Fluorescence to Scattering with Single-Fiber Illumination and Detection: A Quasi-Analytical Photon-Transport Approach Operated with Center-Illuminated Area Detection

School of Electrical and Computer Engineering, Oklahoma State University, Stillwater, OK 74078, USA
Photonics 2025, 12(9), 904; https://doi.org/10.3390/photonics12090904
Submission received: 31 July 2025 / Revised: 25 August 2025 / Accepted: 3 September 2025 / Published: 9 September 2025
(This article belongs to the Section Biophotonics and Biomedical Optics)

Abstract

Bi-phasic (with a local minimum) response of fluorescence to scattering when probed by a single fiber (SF) was first observed in 2003. Subsequent experiments and Monte Carlo studies have shown the bi-phasic turning of SF fluorescence to occur at a dimensionless reduced scattering of ~1 and vary with absorption. The bi-phase of SF fluorescence received semi-empirical explanations; however, better understandings of the bi-phase and its dependence on absorption are necessary. This work demonstrates a quasi-analytical projection of a bi-phasic pattern comparable to that of SF fluorescence via photon-transport analyses of fluorescence in a center-illuminated-area-detection (CIAD) geometry. This model-approach is principled upon scaling of the diffuse fluorescence between CIAD and a SF of the same size of collection, which expands the scaling of diffuse reflectance between CIAD and a SF discovered for steady-state and time-domain cases. Analytical fluorescence for CIAD is then developed via radial-integration of radially resolved fluorescence. The radiance of excitation is decomposed to surface, collimated, and diffusive portions to account for the surface, near the point-of-entry, and diffuse portion of fluorescence associated with a centered illumination. Radiative or diffuse transport methods are then used to quasi-analytically deduce fluorescence excited by the three portions of radiance. The resulting model of fluorescence for CIAD, while limiting to iso-transport properties at the excitation and emission wavelengths, is compared against the semi-empirical model for SF, revealing bi-phasic turning [0.5~2.6] at various geometric sizes [0.2, 0.4, 0.6, 0.8, 1.0 mm] and a change of three orders of magnitude in the absorption of the background medium. This model projects a strong reduction in fluorescence versus strong absorption at high scattering, which differs from the semi-empirical SF model’s projection of a saturating pattern unresponsive to further increases in the absorption. This framework of modeling fluorescence may be useful to project frequency-domain and lifetime pattens of fluorescence in an SF and CIAD.

1. Introduction

Diffuse reflectance spectroscopy (DRS) is a simple technique adaptable to a wide range of applications such as biomedical diagnosis [1], semi-conductor bandgap characterization [2], pigment [3] and food quality assessment [4], etc. The modes of application or types of applicator probe could be categorized as non-contact [5], contact but non-invasive [6], and minimally invasive [7]. Regardless of the modes of application, the applicator probe needs to house a delivery channel to illuminate the target with light of the spectrum of interest and a collection channel to acquire light (within a numerical aperture) returned from the target after interacting with the target medium to cause diffuse reflectance that is modulated by it as the light carries information of the optical properties of the medium. The delivery channel and the collection channel can be configured via fiber-optical [8] or free-space [9] components. And placing the two channels to have a space in between is perhaps the simplest and most convenient configuration for contact application [10].
For DRS, a unique configuration of placing the two channels is to make the target level areas corresponding to the illumination and collection channels overlap with each other. Such a configuration is schematically illustrated in Figure 1A, where the circular region atop the medium of measurement is the area that is common to both illuminating light going into the medium and diffuse reflectance from the medium. Such geometry is implementable with different methods, including using a fiber to contact the target and bifurcating it at the instrument end to split to two channels, one connecting to the source of spectral light and the other connecting to the detector of spectral light. Such configuration of the probe has been called single fiber (SF) [11,12], and the use of it has facilitated reflectance spectroscopy in spaces difficult to reach without routing through an endoscopic instrument channel [13,14] or interstitial needle [15]. The small profile that single fiber renders takes the advantage of spot [16] or localized sampling [17] to improve the spatial resolution in assessing heterogeneity.
Through SF, different operating modes [18] of light–tissue interaction have been realized, including steady-state [19], time-domain [20], fluorescence [21], and multi-modality [22,23]. Each of those modes interrogate the medium uniquely, for example, the fluorescence mode probes specific molecules. Understanding the patterns of the signals of each mode guides how that mode may be utilized. In response to the increase in dimensionless scattering assessed by SF, the steady-state reflectance increases monotonically until reaching a saturating plateau [24] and the time-of-flight reflectance decreases monotonically [20]. For SF fluorescence, a weak bi-phasic pattern was first noticed in 2003 [25]. Studies followed have confirmed that SF fluorescence exhibits a clear bi-phasic pattern, as illustrated in the inset sketch of Figure 1A. The bi-phase of fluorescence appears as an initial decrease followed by a later increase [26] versus scattering. The bi-phasic turning was shown to occur at a dimensionless reduced scattering ~1, and vary with fiber diameter and absorption [27]. Robust SF assessment of intrinsic fluorescence [28,29] demands theorization of the salient patterns such as bi-phase.
As is common in DRS, the theorization of SF fluorescence tasks a geometry-specific model of light–tissue interaction that shall start with a set of tissue optical properties and size/dimensional parameters to forward-project the reflectance. SF fluorescence has received semi-empirical models for the case of without absorption [30] and with absorption [31]. These semi-empirical models for SF fluorescence followed the essence of the modified Beer–Lambert law that also facilitated semi-empirically modeling the steady-state [16] and time-domain [20] SF reflectance. For a fiber of a diameter of d f i b [mm], and the specific case of having the same reduced scattering of μ s [mm−1] at both excitation and emission wavelengths of the fluorophore with an absorptivity of μ a f l [mm−1], the fluorescence collected in the absence of background absorption was semi-empirically expressed as follows [30]:
F S F   r a t i o 0 = ζ 1 · d f i b · μ a f l · ζ 0 + μ s d f i b ζ 2 e x p 1 + ζ 3 1 + ζ 2 · μ s d f i b
where ζ 0 , ζ 1 , ζ 2 , ζ 3 are empirical parameters, among which ζ 0 accounts for a baseline and ζ 1 has absorbed the quantum efficiency and other environmental factors including numerical aperture (NA) that together govern the fluorescence yield that is collectable.
The first term at the R.H.S of Equation (1) that contains the dimensionless reduced scattering μ s d f i b reduces monotonically from a finite value of ζ 0 ζ 2 as μ s d f i b increases. The second term at the R.H.S of Equation (1) containing μ s d f i b is an exponential function that increases to approach unity as μ s d f i b increases. The multiplication of the two terms fits into a bi-phasic pattern, appearing as a decrease followed by an increase as μ s d f i b increases. The semi-empirical model of SF fluorescence with a background absorption of μ a [mm−1] has been expressed as a modification of F S F   r a t i o 0 , the SF fluorescence in the absence of background absorption [31,32], as follows:
F S F   r a t i o = F S F   r a t i o 0   e x p μ a L S F
where L S F is the effective sampling path length [27]. Implementing a semi-empirical effective path length [31] and Equation (1) into Equation (2) leads to a semi-empirical model of SF fluorescence acquired over an area of a diameter of d f i b , represented by I S F   f l u o d f i b for the specific case of iso-scattering between excitation and emission wavelengths, as follows:
I S F   f l u o μ a , μ s , d f i b = I S F   f l u o d f i b ζ 1 · μ a f l = d f i b · 0.00315 + μ s d f i b 0.31 e x p 2.61 1 + 0.31 μ s d f i b                                           · e x p μ a d f i b 1 + μ a d f i b · 1 + 1.81 μ s d f i b · 0.71 · μ s d f i b 0.36
Equation (3) has normalized the fluorescence against fluorophore parameters to relate to the medium’s properties of photon propagation.
Whereas convenient, semi-empirical models taking the form of modified Beer–Lambert expression could be bound by limitations of the modified Beer–Lambert form, regarding specifically the effect of scatter–absorption coupling. For example, the first bracket in the second exponential term of Equation (3) accounting for the absorption attenuation of the fluorescence projects a saturating level that does not respond to further increases in the absorption at the strong dimensionless absorption of μ a d f i b >> 1. This is inconsistent with an expectation straightforward to have for stronger absorption of the background medium—it must cause greater attenuation of photon counts over any length of propagation within the medium, which subsequently must correspond to a faster rate of reducing both the excitation radiance and the fluorescence at a given dimensionless scattering. The rate of attenuation of fluorescence shall not reduce to appear as saturated as the absorption of the background medium increases. Although applications of SF fluorescence to a background medium that has both strong absorption and strong scattering might not be common, improved theoretical understanding of the patterns of fluorescence in SF geometry beyond the semi-empirical model of 2014 [32] could benefit the overall design and utility of SF fluorescence.
The objective of this work is to develop an alternative photon-transport-originated understanding of salient patterns of fluorescence, like bi-phase, associated with a geometry like SF that involves an area of collection overlapping the area of illumination. SF geometry is unique in terms of the exact overlapping of the area of illumination with the area of collection. An idealized SF geometry may treat the illumination to be uniform over the area of the probe and the collection by the same area for illumination to be affected only by the NA of the probe. Whereas the latter assumption regarding the collection by SF probe could hold, the former assumption is an oversimplification of the output optical power distribution for fibers that could be affected by many factors, including diameter, number of mode, NA, and material [33,34,35,36], for applications including SF fluorescence. However, if one considers the power distribution over the SF probe to be increasingly concentrated toward the center, the limiting case of that is the illumination being localized at the center of the area of detection only. This limiting case is to be called a center-illuminated-area-detection (CIAD) geometry, as shown schematically in Figure 1B. Since CIAD geometry that has the same area of collection as SF can evolve from an ideal SF geometry with the illumination power concentrated to the center, the responses of the two geometries to the same medium must be correlative, that is to have similar sensitivities to the medium’s spectral properties. The correlation of responses between the two geometries dictates that if a salient feature, such as a limiting pattern of saturation, a pattern of phase-change, or a pattern of zeroing, is manifested in one geometry it must be observed in the other geometry. It is with such an understanding that this work develops an alternative theoretical perspective to the salient pattens of SF based on salient patterns quasi-analytically projected for CIAD.

2. Preliminary Remarks

2.1. Correspondence of the Patterns of Fluorescence Projected Between SF and CIAD

Better theoretical understanding could be rendered via more accurate analyses of the photon transport process. SF can be idealized as a top hat geometry having the area of unform illumination overlapping completely and exactly with the area of light collection, as shown in Figure 1A. This top hat geometry for SF can then be treated as having the model point source distributing total illumination uniformly over the circular area over which model point detector for light collection is also distributed uniformly [37]. The summation of all individual reflectance associated with each pair of model point source and model point detector then becomes the total reflectance of SF, sans the effect of NA. The reflectance between a pair of a model source and model detector can be referred to as radially (with respect to the source) resolved reflectance specific to the source–detector separation (SDS). Given an analytical radially resolved reflectance that could apply to all SDSs of the top hat geometry, analytical SF reflectance can be constructed with two nested integrations, one integrating over the independent model source and the other over the independent model detector. The nested integrations are appreciably complex to solve analytically.
A seminal improvement to reducing the complexity of analytical modeling of SF geometry was demonstrated via a novel approach [37] utilizing geometric-probability weighting (GPW) [38] that removes the need for the aforementioned nested integrations. The geometric probability stands for the observation that, for both model source and model detector distributed arbitrarily over the area of collection, the SDS between the source and detector has a geometry-specific probabilistic distribution. A weighted integration of the diffuse reflectance between a model source and a model detector over the area of interest expressed as follows thus analytically models SF diffuse reflectance:
I S F d f i b = η N A · π 4 d f i b 2 · 0 d f i b R ρ · P ρ , d f i b d ρ
where η N A accounts for NA, d f i b is again the diameter of the (fiber) probing geometry, R ρ represents diffuse reflectance for an SDS of ρ under a unitary illumination, and P ρ , d f i b is a GPW function corresponding to the probability of having the SDS of ρ over an area of a diameter of d f i b if both the model source and model detector have an equal chance to be at any point over the common circular area. With respect to a dimensionless SDS of x = ρ / d f i b that has a range of x 0 , 1 , the GPW function P x , d f i b is expressed as [39]:
P x , d f i b = 16 π 1 d f i b x · c o s 1 x x 2 · 1 x 2
The novel approach of Equation (4) allowed using a single viable analytical R ρ applicable to the fiber dimension of SF (which may demand non- or sub-diffusive treatment near the point-of-entry) to deduce SF reflectance. However, this procedure may not conveniently lead to an algebraic terminal form due to the multiplication of two radially dependent functions in the integrand that could be laborious to solve analytically [29,40,41].
Is there an alternative path to help model the patterns of SF geometry without employing GPW? It may be noted that it is the spectral variation in the diffuse reflectance that provides the most critical information in DRS. A spectral variation in diffuse reflectance that is scaled across-the-board by the same amount, or even varying slightly but smoothly, does not change the fundamental “pattern”. Therefore, a model of spectral reflectance for one geometry that gives across-the-board scaling of the spectral reflectance of another geometry could help model the patterns of the other geometry. Encouraged by this prospect, we previously explored steady-state reflectance between CIAD geometry [41] and SF geometry. Figure 1B shows an idealized CIAD geometry that has the same radial dimension of the area of light collection as the SF geometry of Figure 1A but has the illumination into the medium localized to the center of the area of light detection. The diffuse reflectance of this CIAD can be expressed as follows, given a realistic azimuthal symmetry:
I C I A D d f i b = η N A · 2 π · 0 d f i b / 2 R ρ · ρ · d ρ
where R ρ is the radially resolved diffuse reflectance as in Equation (4), assuming the total photon count over the circular area of Figure 1A is the same as that concentrated at the center point of Figure 1B.
We have discovered [39], via analytical proof for a limiting case and numerical investigation for broader conditions, a scalable relationship between I S F d f i b of Equation (4) for SF and I C I A D d f i b   of Equation (6) for CIAD [31]. The presence of a simple scalable relationship between the two can be appreciated by noticing that P ρ , d f i b contains the error function and decomposes to a power series of ρ , and that R ρ is generally a function of exponential dependence upon ρ that is divided by a low-order polynomial of ρ . A scaling of diffuse reflectance between SF and CIAD means that the spectral variation in diffuse reflectance in SF resembles that in CIAD, and vice versa. Given the same R ρ , Equation (6) is much easier than Equation (4) to reach an algebraic terminal form. Approaches based on Equation (6) in steady-states [42] and time-domains [43] for CIAD have helped underpin the patterns of steady-state and time-of-flight SF, providing analytically originated insights not readily available with semi-empirical models developed within the framework of modified Beer–Lambert Law.
Extending along this line of reasoning to fluorescence, we may assume the medium contains a uniform distribution of fluorophore which transforms the irradiance at the excitation wavelength to fluorescence emission. We then use R f l ρ to represent the fluorescence reflectance assessed between a model source and a model detector on the medium surface having an SDS of ρ , and from all fluorophores within the geometry of interest. R f l ρ is thus a “fluorescence” counterpart of R ρ in Equation (4). Since the distribution of the model source and model detector on the common area of illumination and detection takes the same GPW function P ρ , d f i b of Equation (5), SF fluorescence as the counterpart of Equation (4) can be expressed as follows:
I S F   f l d f i b = η N A · π 4 d f i b 2 · 0 d f i b R f l ρ · P ρ , d f i b d ρ
The fluorescence in CIAD geometry as the fluorescence counterpart of Equation (6) is then:
I C I A D   f l d f i b = η N A · 2 π · 0 d f i b / 2 ·   R f l ρ · ρ · d ρ
It is possible to demonstrate (see Appendix A using an algebraic terminal form of R f l ρ developed later in the analyses) that I S F   f l d f i b of Equation (7) for SF and I C I A D   f l d f i b   of Equation (8) for CIAD are also scalable, by virtue of an extension of the derivations applied to the parallel limiting cases of Equations (4) and (6). This would allow using fluorescence projectable for CIAD to understand patterns of SF fluorescence, or vice versa.

2.2. General Notations and Geometrical Considerations

We consider a turbid medium that is specified by bulk optical properties as follows: refractive index n , absorption coefficient μ a [ m m 1 ], scattering coefficient μ s [ m m 1 ], and anisotropy factor g . The scattering or turbidity of the medium affecting non-ballistic or diffusive traversing of photons may also be represented by reduced scattering coefficient μ s = μ s 1 g [ m m 1 ], diffusion coeficient D = 3 μ a + μ s 1 [ m m ], and effective attenuation coefficient k 0 = μ a / D   [ m m 1 ]. For notational conveniences, we assume that these properties of the host medium of the fluorescence do not differ between the excitation wavelength and the emission wavelength. Such an iso-diffusiveness condition has been considered as a special case in the semi-empirical model of SF [30], against which the projection for CIAD of this work is compared.
The following descriptions are referred to in Figure 2. A model point in the medium at which isotropic illumination at the excitation wavelength can be assumed is denoted as r , which may also be called the “source” position. A model point in the medium at which fluorescence can be induced by the photon irradiation at the excitation wavelength is denoted as r f l , which may also be called the “fluorophore” position. A model point in the medium at which photon fluence at either the excitation wavelength or the fluorescing wavelength is to be assessed is denoted as r , which may also be called the “detector” position. This work considers the illumination source to be unitary, that is to have a total intensity of one, regardless of being applied to a single model point for CIAD or distributed over a finite area for SF. The intensity of this source is denoted as S = 1   m m 3 , which represents the volume density of photon or photon counts resulted by normalizing the rate of energy irradiance over the energy of an individual photon. The absorption coefficient of the fluorophore at the excitation wavelength is denoted as μ a f l   m m 1 , which determines the strength of the fluorophore per unit volume to absorb the light of excitation. The quantum efficiency of the fluorophore converting the irradiation absorbed at the excitation wavelength λ to re-radiating at the emission wavelength λ f l is denoted as γ λ λ f l . A small dot prefixing the fluorophore position vector like r f l denotes a model point of fluorescence emission or a differential position of the fluorophore. A symbol of “ ” prefixing the fluorophore position vector like r f l denotes the assembly of all fluorophores in the medium of interest.
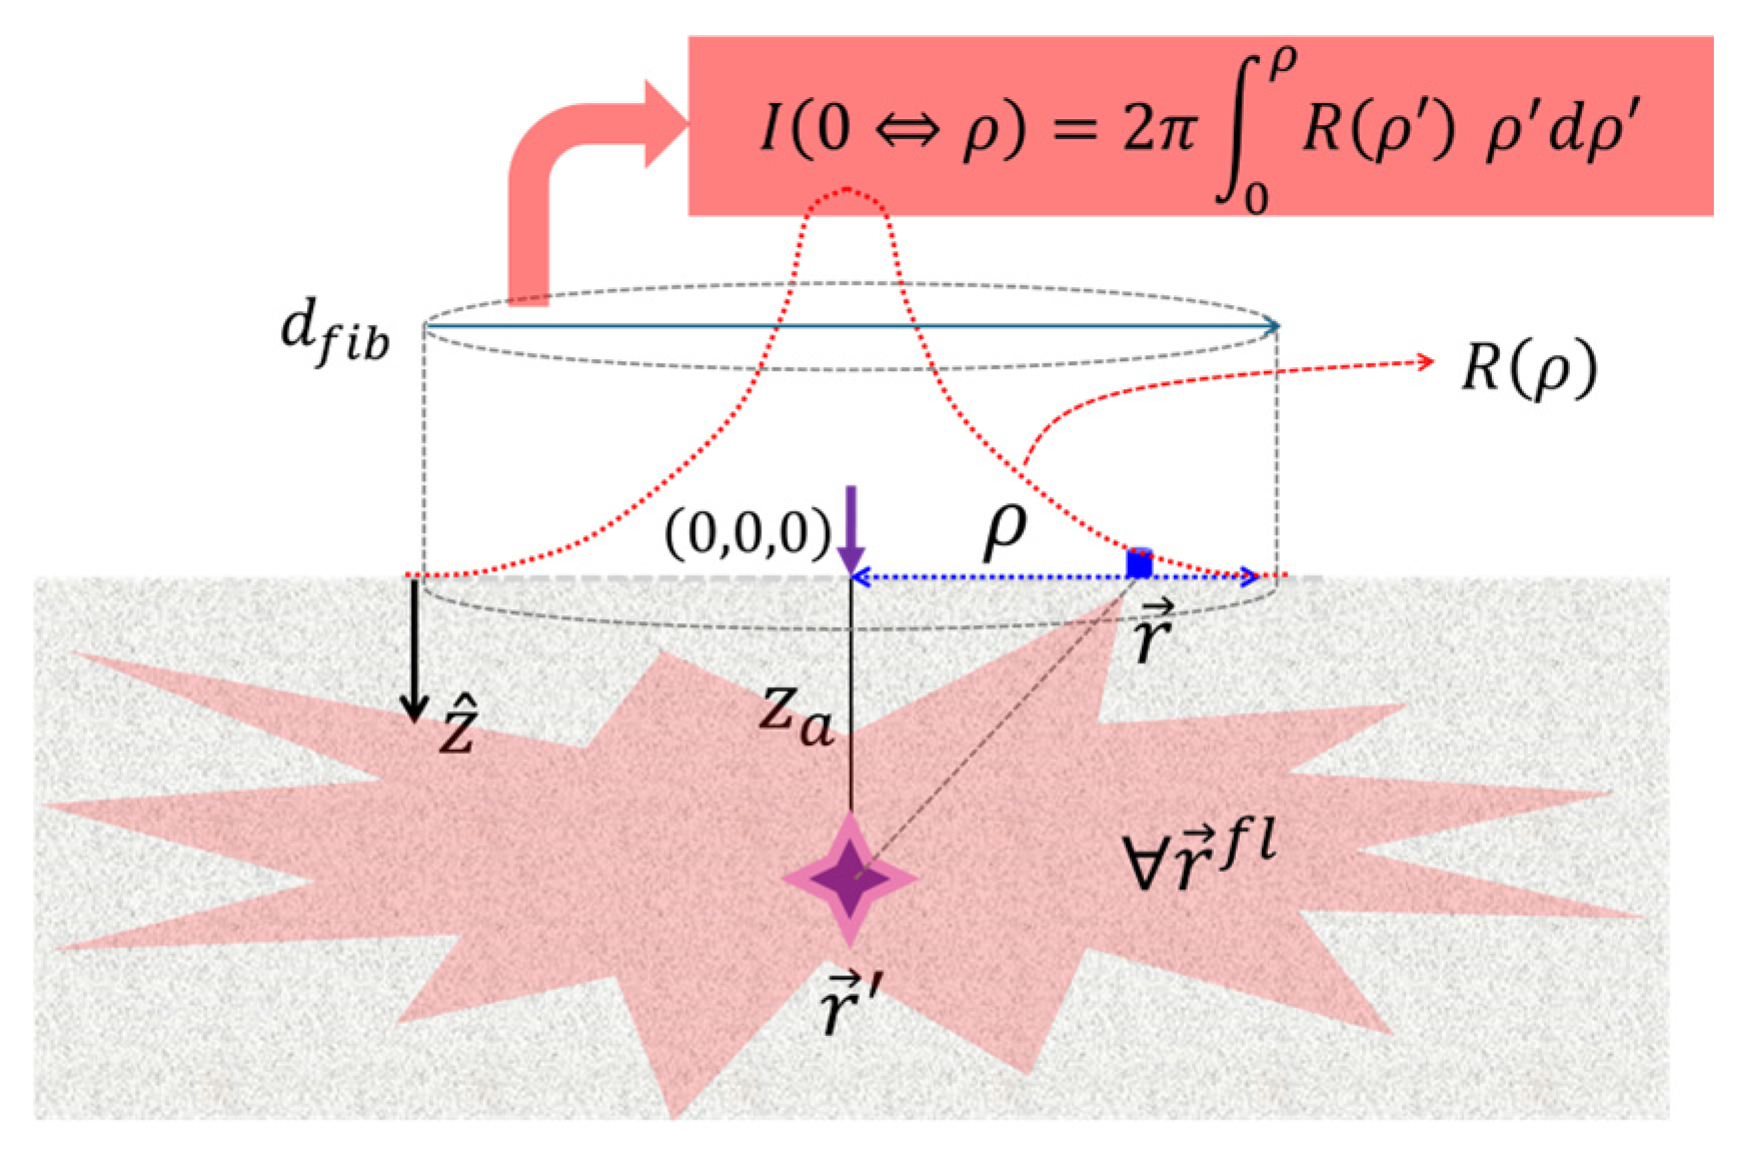
Figure 2 specifies a circular area of a diameter of d f i b . This circular area corresponds to the size of collection in CIAD geometry, which is also the area of top hat light illumination in the counterpart SF geometry. In CIAD geometry, the POI for light illumination into the medium is located at the center of this circular area that is also the area of illumination in the counterpart SF geometry. In CIAD geometry, the fluorescence reflectance excited by the centered illumination shall have intensity decreasing over the increase in the radial distance from the POI and be azimuthally symmetric, assuming that the fluorophore is uniformly distributed within the homogeneous medium over the geometric domain of interest. This will result in a bell-shaped curve, as shown in Figure 2, representing the radially resolved fluorescence reflectance associated with the centered illumination. If the centered illumination spreads out evenly to cover the area of a diameter of d f i b to make a top hat illumination but the area of collection remains unchanged, then the geometry becomes SF and the corresponding fluorescence reflectance will take a relatively flat bell-shape that tapers off quickly at the edge of the circular area of detection. That flat-topped bell shape is equivalent to the bell-shaped profile of a point illumination convolving with a top hat distribution of illumination. Thus, the pattern of the bell-shape profile of a point-illumination that serves the role of point spread function dictates the overall responses of the convolved profile to the medium’s dimensionless properties.

2.3. Decomposition of Radiance Exciting the Fluorescence in CIAD Geometry

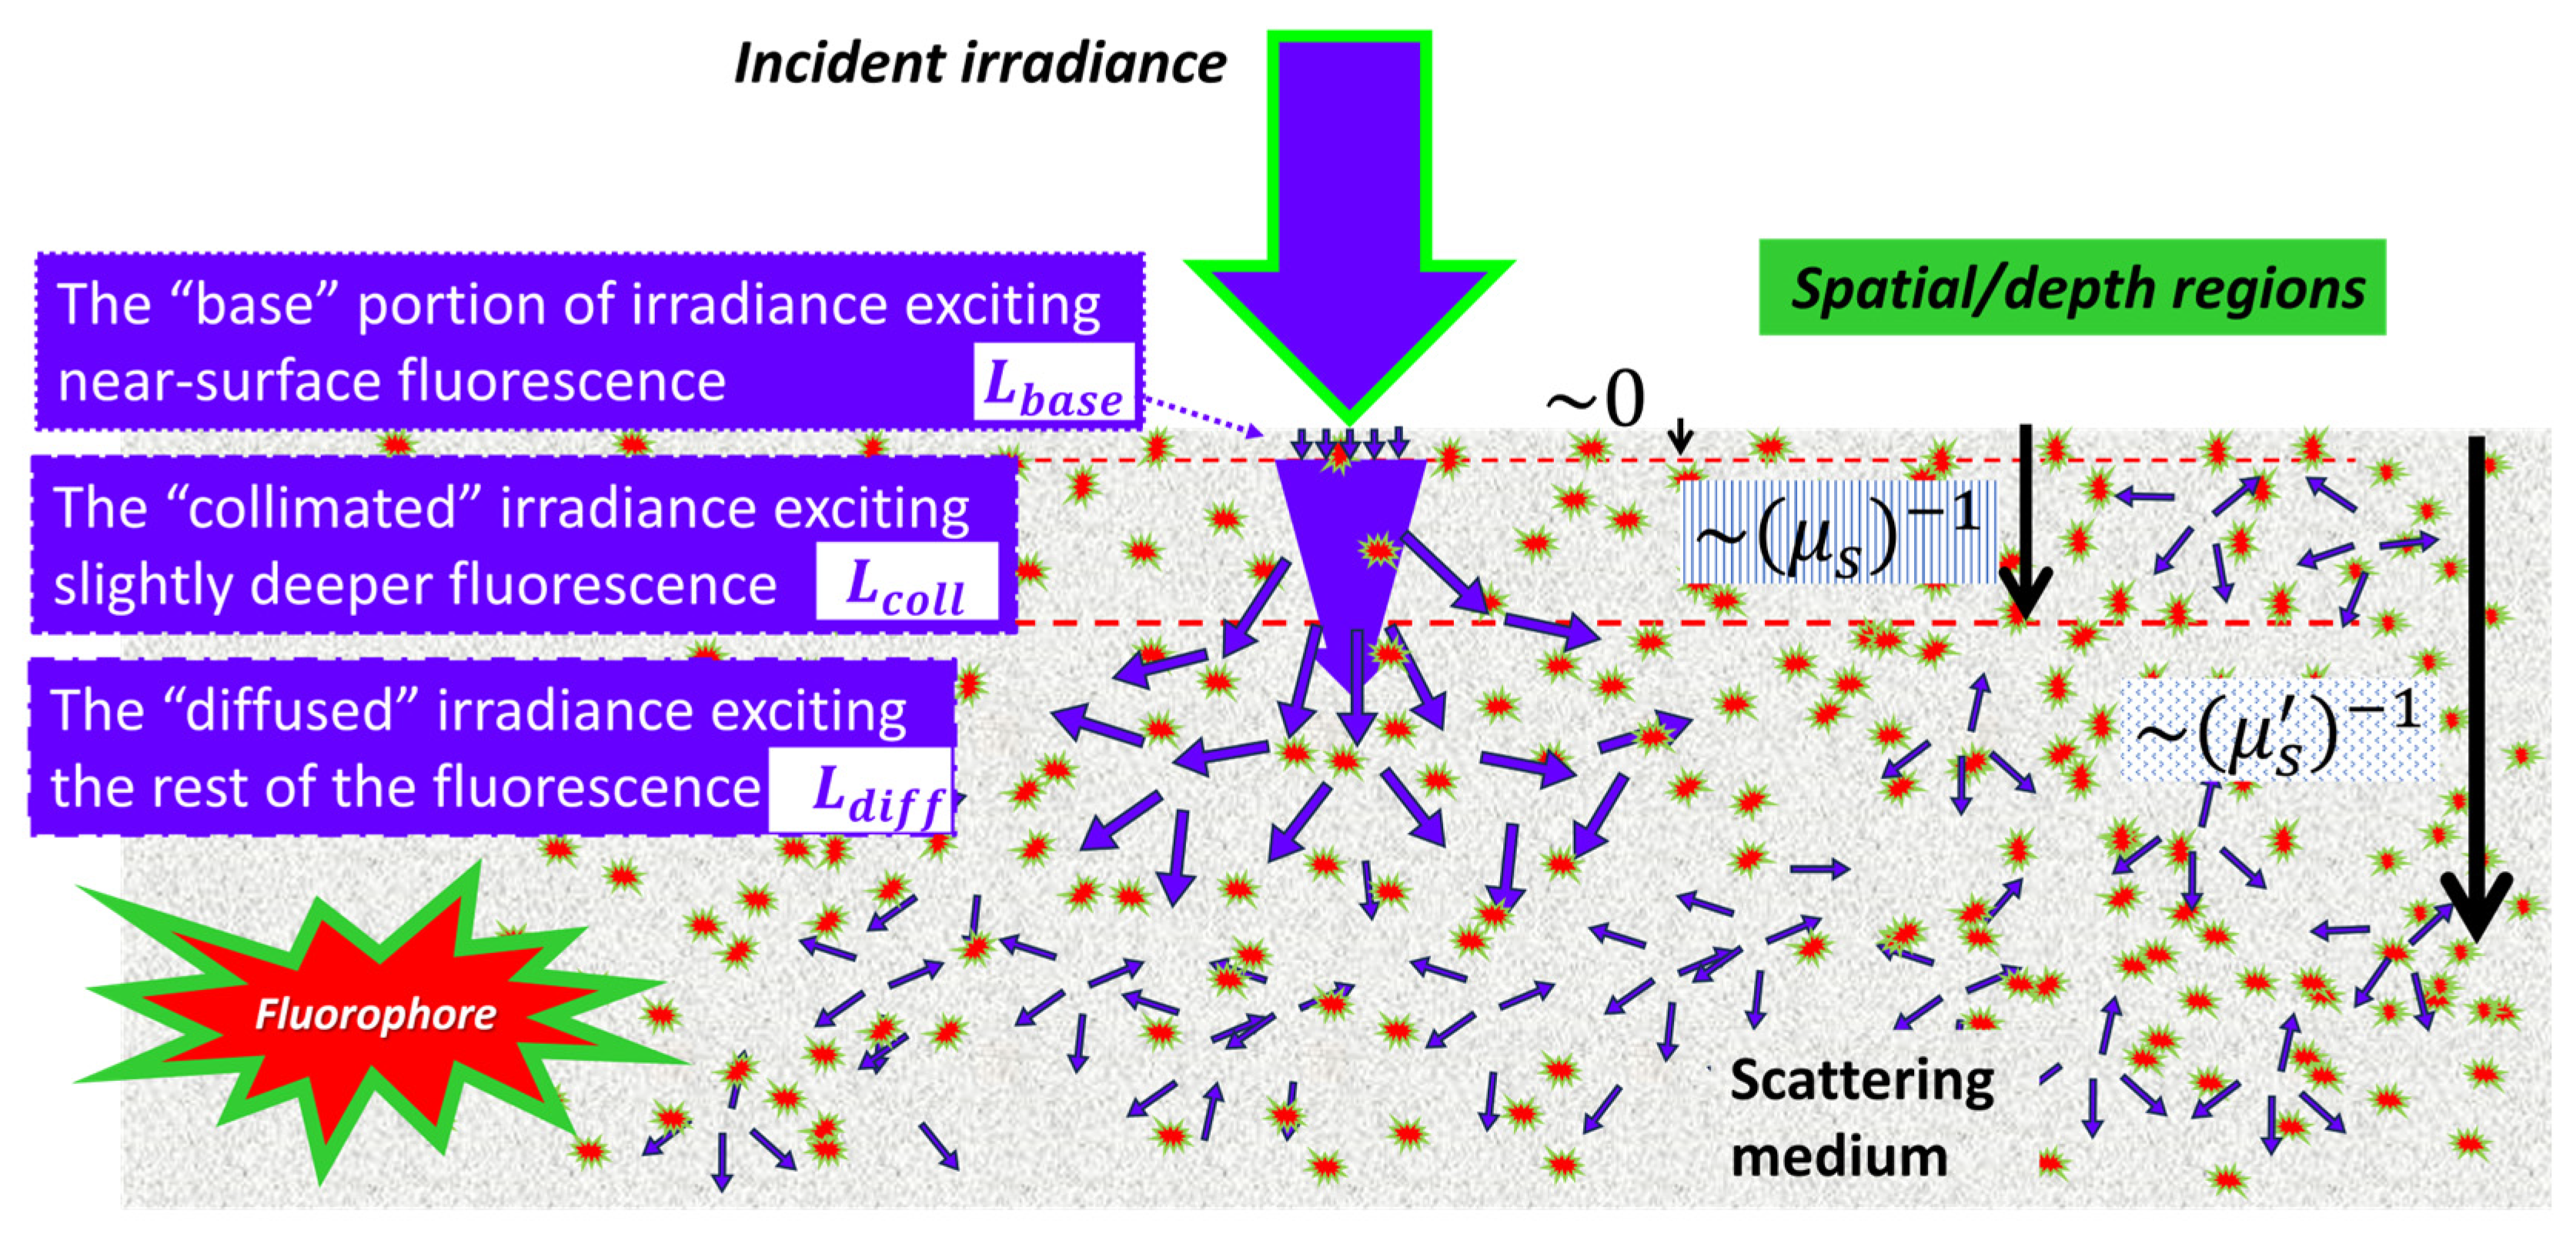
We limit the discussion to concern the collimated light directed onto a turbid medium at an angle normal to the medium’s surface. A collimated light directed normally onto any turbid medium from a different medium (air as with CIAD for non-contact use or fiber as with SF in contact mode) first experiences specular reflection at the interface between the two media due to the gross mismatch of the refractive indices. This specular reflection is the result of mass-scale interference of the light field at each individual wavelength after being elastically modulated by the extreme outer layer of the medium. The collimated radiance transmitting into the turbid medium must initially be aligned with the original direction being normal to the medium’s surface before hitting the first scatterer that re-directs the light propagation. And the amount of light keeping the original direction of propagating normally to the medium’s surface reduces quickly as the light is scattered and absorbed. The scattering of the light by any individual scattering event in a turbid medium is likely anisotropic and forward biased. However, after experiencing many consecutive forward-biased scattering events, the direction of light propagation eventually becomes randomized with respect to the original direction being normal to the medium surface. That randomization of the direction of scattered light with respect to the original collimated direction also marks the complete abatement of the collimated proportion of the radiance. Such understanding of the process of how the radiance in turbid media results from initially collimated injection changes is consistent with the principle introduced in [44] to assess diffuse reflectance near the POI. And each radiance at the excitation wavelength reaching a fluorophore will contribute to radiance at the emission wavelength. Therefore, we refer to Figure 3 to outline a possible decomposition of fluorescence excited by an initially collimated and point-localized irradiance introduced normally into a scattering medium of CIAD geometry.
The collimated irradiance first interacts with the extreme outer layer of the medium at the POI to cause a specular re-direction that may be compromised by diffusive re-direction. This “base” proportion of the irradiance into and lost at the extreme outer layer of the medium, with respect to the initial illumination directed into the medium, is denoted as L b a s e . The initially collimated irradiation, less the “base” proportion lost in the extreme outer layer of the medium, will continue to interact with the medium to eventually make a diffusive distribution of irradiance in the medium. During this process, the collimated proportion of irradiance will decrease over the depth of propagation [44], and the diffused proportion of the irradiance will increase over the depth of propagation and lateral distance from the POI. The collimated irradiance that reduces in proportion over the depth is denoted as L c o l l . And the diffusive irradiance that increases in proportion over the depth or lateral distance from the POI is denoted as L d i f f . The composite irradiance in the medium at position r along direction s ^ at the wavelength of excitation λ is then expressed as:
L e x r , s ^ , λ = L b a s e r , s ^ , λ + L c o l l r , s ^ , λ + L d i f f r , s ^ , λ
Each of the three proportions of the irradiance may contribute to exciting the fluorescence that returns to the side of the incoming irradiance being acquired. What L b a s e can cause is exclusively surface fluorescence [45], what L c o l l may cause is an increased depth of fluorescence along the direction of incident illumination, and what L d i f f can cause is an increasing spread of the volume of fluorescence. And the excitation of fluorophore at any location may be associated with primary or secondary (via additional scattering) absorption of any of the three portions of L b a s e , L c o l l , and L d i f f . The isotropy of fluorescence as a secondary illumination to the absorption of any of the three irradiances at the excitable wavelength will make the fluorescence return to the medium surface to peak at the POI and reduce over the radial distance from the POI along the surface. The center peaking of fluorescence may not be a matter of interest for the general spatially resolved acquisition of diffuse fluorescence at a detector spaced apart from the POI [46]. In comparison, the case of CIAD to be studied here has the area of acquiring/assessing the fluorescence containing the POI.
The isotropic fluorescence at the emission wavelenth λ f l excited by the irradiance of Equation (9) can be expressed with three components, as follows, by converting the irradiance to photon density equivalent to the spatially resolved term of R appearing in Equation (8):
R r , λ f l = R b a s e r , λ f l + R c o l l r , λ f l + R d i f f r , λ f l
where R b a s e   and R c o l l will require finding the corresponding radiance of excitation by radiative transfer means, whereas R d i f f may be developed via finding the radiance of excitation by means of diffusion transport. The subsequent section is dedicated to developing a viable route of deriving R d i f f and its area-integration for CIAD geometry.

2.4. Analytical Routes to a Terminal Form of the Diffuse Proportion of Fluorescence in CIAD Geometry

In this section, we outline the general analytical procedures necessary to derive the diffuse portion of fluorescence in CIAD, per Equation (8). There are two aspects of the “ordering” of analytical steps needed to develop the “diffuse” fluorescence, if we consider that modeling a terminal form concerns the fluorescence from everywhere in the medium excited by L d i f f and the collection of the fluorescence over the entire area of the diameter d f i b . One aspect of the ordering of the analytical approach thus deals with a three-dimensional integration with respect to the fluorophore in the medium and a two-dimensional integration over the area of collection that relaxes to one-dimensional integration due to the azimuthal uniformity. These two integrations, however, are nested with each other; therefore, the choice of the order of the integration affects the analytical solvability. The other aspect of the ordering concerns the implementation of the boundary condition applying to the medium–air interface. These two aspects of “ordering” of the analytics will arise in the process, as long as one starts with a base function of model point fluorescence as the building block and evolves towards a target form which accounts for the total diffuse fluorescence over the area of detection in association with all fluorophores in the medium-interfaced air.
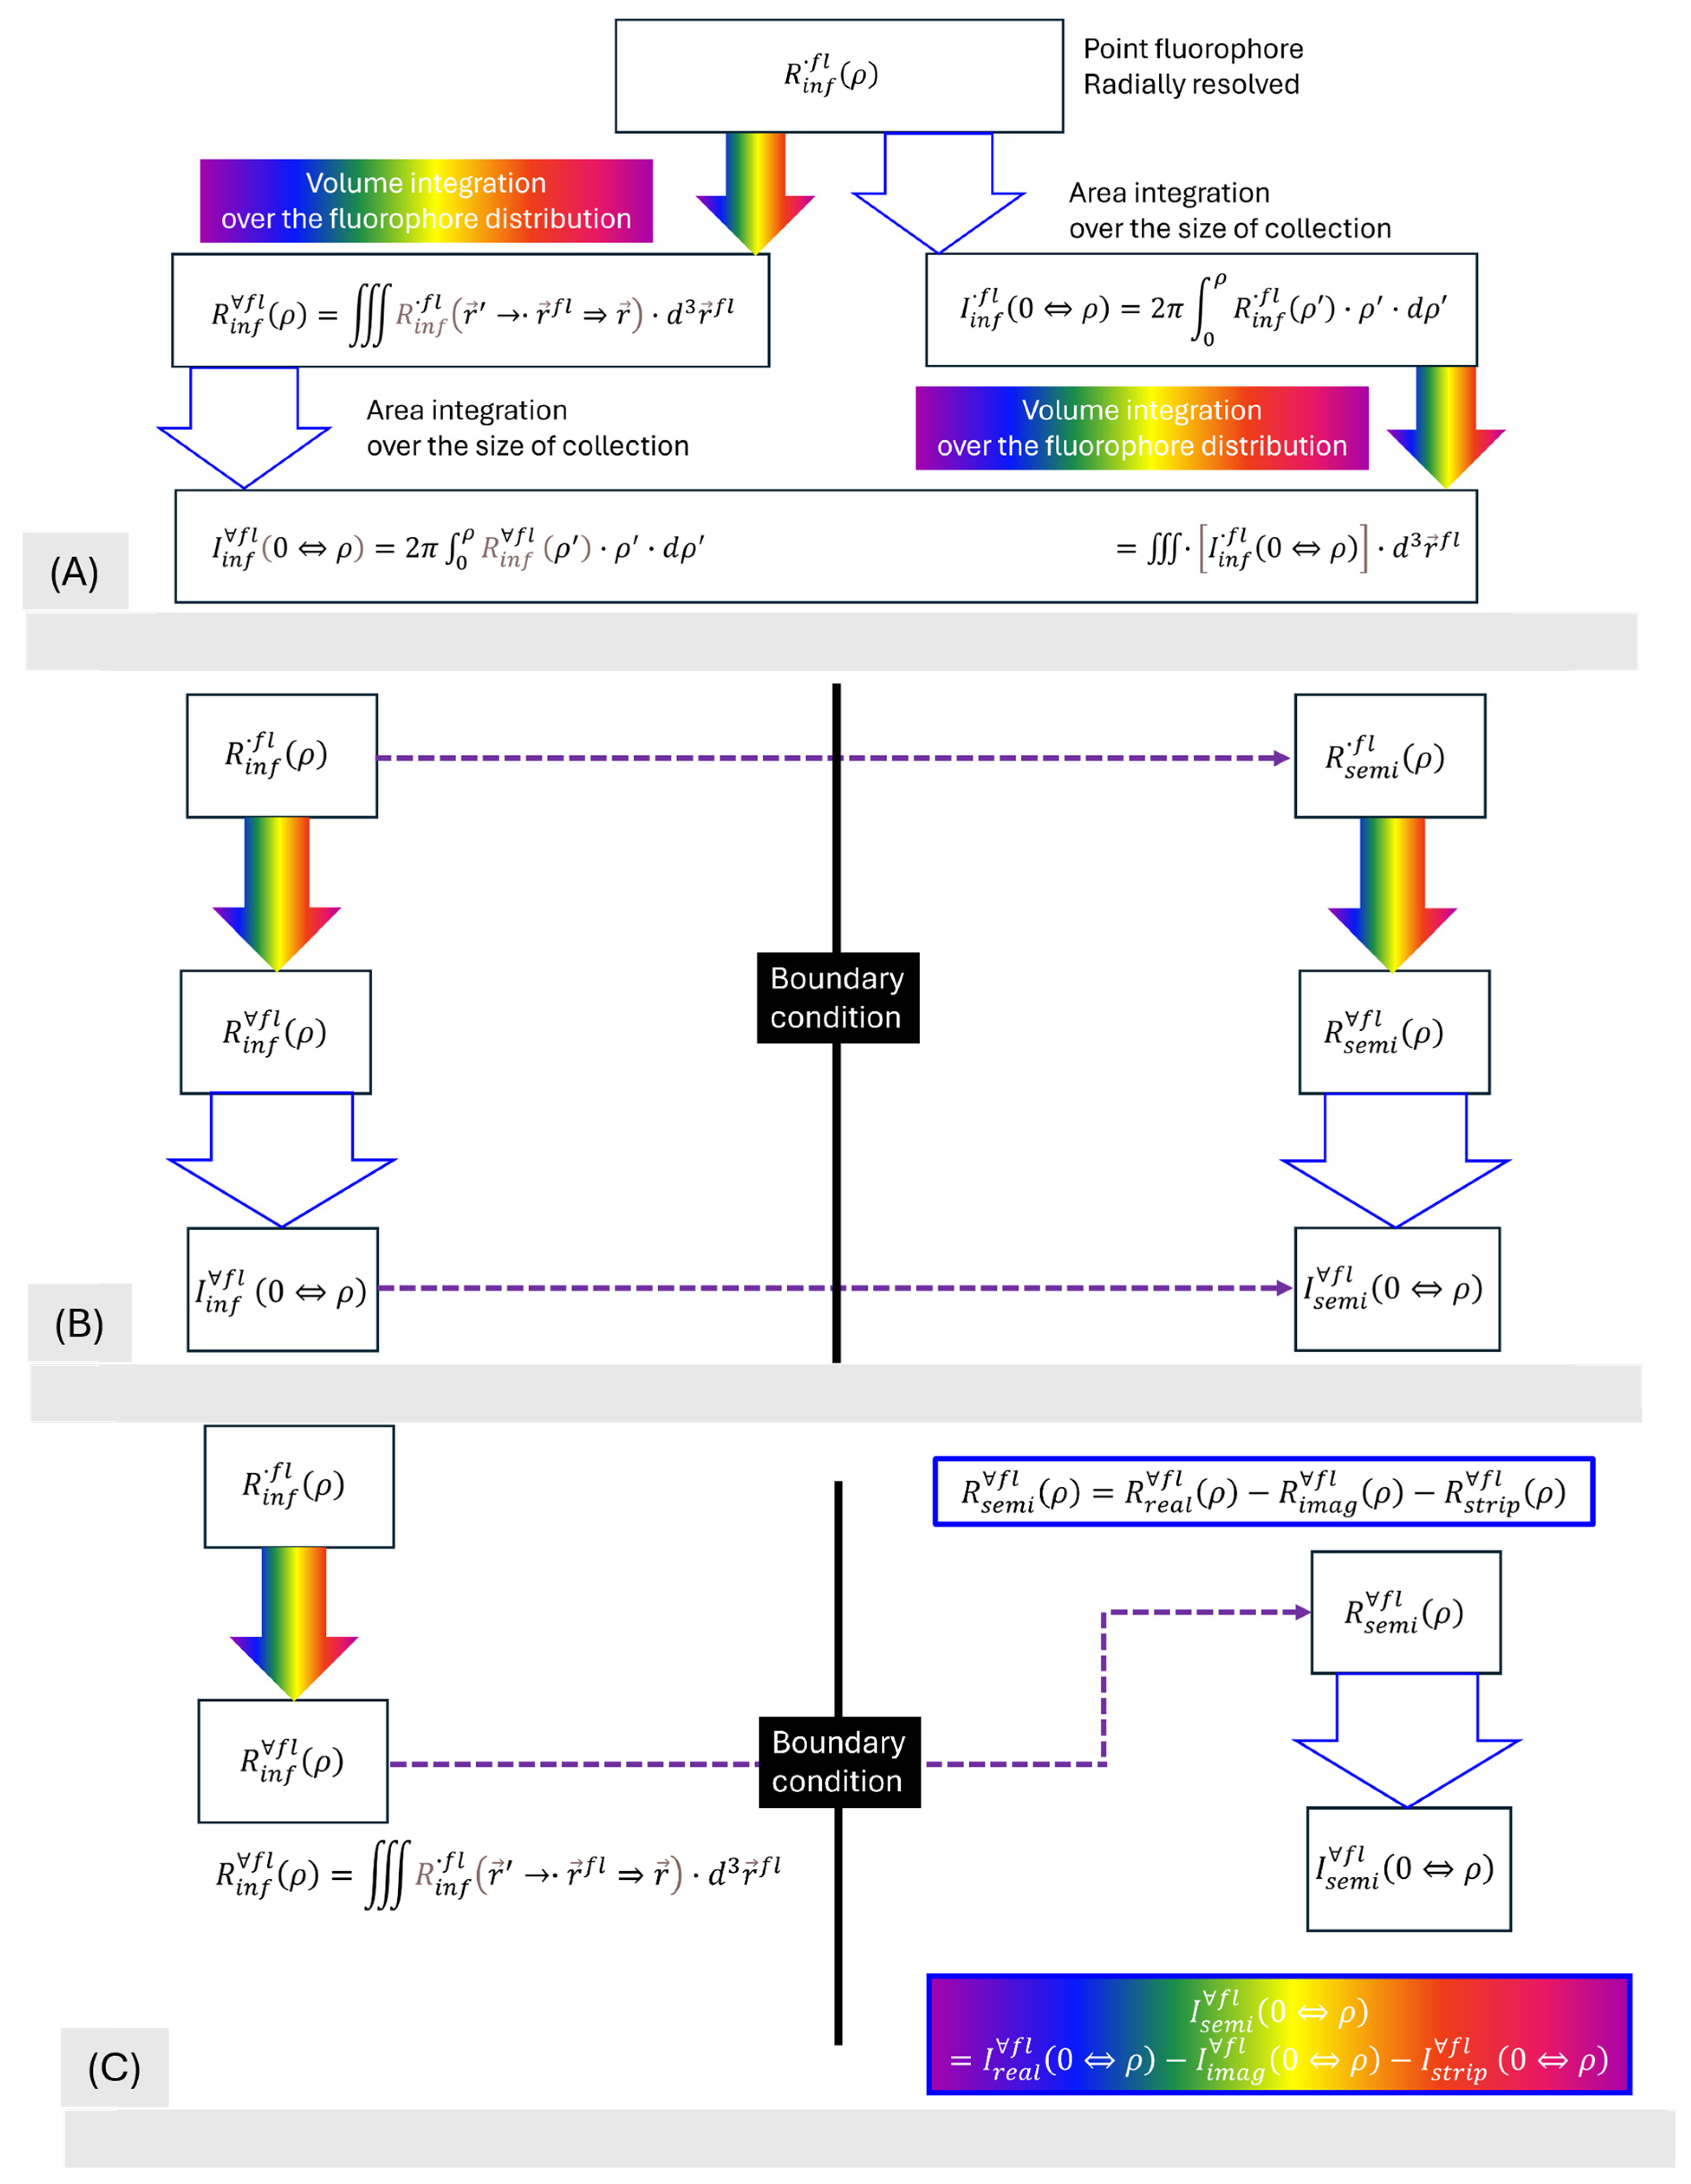
The different paths of analytics leading to the same terminal form is conceptualized in Figure 4A. The base function of the analytics shown here is the radially resolved diffuse fluorescence corresponding to an SDS of ρ in an unbounded medium. This radially resolved diffuse florescence is denoted as R i n f · f l ρ , corresponding to a point fluorophore in an infinite medium. The final form of fluorescence for the infinite geometry over an area of collection of a radius of ρ , which is denoted as I i n f f l 0 ρ , is the summation of all diffuse fluroescence over the area of interest (represented by 0 ρ ) caused by all (represented by ) fluorophore in the medium. Between a starting form of R i n f · f l ρ and a target form of I i n f f l 0 ρ , there are two paths to step-wisely evolve the analytics. One route starts with a volume integration accounting for all fluorophore distribution that is followed by an area integration taking care of the size of collection. The alternative route starts with an area integration to give the fluorescene collected over the area of a radius of ρ and from a model point fluorophore, which is followed by a volume integration to account for all fluorophores in the medium. Obviously, these two routes must lead to the same terminal form. Yet, the first path provides a mathematically more palatable approach than the second path because of the handling of intermediate analytics. We therefore chose the first path—applying volume integration over the fluorophore distribution followed by implementing area integration over the size of collection to arrive at a terminal form—for deriving the diffuse portion of the fluorescence.
A second aspect of the analytical process concerns the treatment of boundary conditions. The terminal form shall consider the fiber– or applicator–medium interface that is idealizable as a semi-infinite geometry [37,46]. The starting form can be the diffuse fluorescence of a boundless or infinite medium. From that basis function, there are two paths of reaching the terminal form that has the boundary condition implemented, as conceptualized in Figure 4B. One path is to treat the volumetric distribution of the fluorophore and the area collection of the fluorescence over the dimension of collection prior to treating the boundary of the medium. The other path is to treat the boundary of the medium first, prior to treating the volumetric distribution of the fluorophore and the area distribution of the fluorescence over the dimension of collection. Obviously, these two routes shall also lead to the same terminal form. We chose the first path of assuming a boundless medium followed by implementing the boundary condition to take advantage of a needed and available algebraic closed form.
If the path of choice for Figure 4A concerning the integrating processes and the path of choice for Figure 4B concerning the implementation of boundary conditions are combined, as in this work, then the approach explored for diffuse proportion of fluorescence can summarized as the path shown in Figure 4C. Specifically, we first develop diffuse fluorescence assessed between a model source and a model detector of an SDS of ρ that is associated with all fluorophores in an infinite medium. We then implement a type-III boundary condition [47] to the diffuse fluorescence assessed between a model source and a model detector of an SDS of ρ associated with all fluorophores in a semi-infinite medium. Finally, we deduce the diffuse fluorescence assessed over a collection area of a radius of ρ associated with all fluorophores in a semi-infinite medium. These developments form the “diffuse” contribution to the fluorescence. The “diffuse” fluorescence will need to be augmented with the “non-diffuse” contributions to the fluorescence, including the “base” and “collimated” proportions, to arrive at a quasi-analytical form of the total fluorescence of CIAD.
The rest of this work outlines a theoretical framework leading to quasi-analytical fluorescence in CIAD geometry, while assuming iso-transport properties at the exciting and fluorescing wavelengths. The analysis engages both radiative transfer and diffusion transport treatments to account for the radiance of excitation on the surface, near POI, and distant from POI. The radiative transfer-based projection of the radiance of exciting the “base” and “collimated” proportions of fluorescence are used to understand their basic patterns that are absorbed into semi-analytical forms of the two fluorescence components. The resulting quasi-analytical form of fluorescence in CIAD projects a bi-phasic pattern with a local minimum at dimensionless scattering [0.5, 2.6] as a function of the diameter of the area of collection that is equivalent to the fiber diameter in SF and the absorption of the medium, and it compares fairly against those given by the semi-empirical model of SF fluorescence. We note that the scope of this work is limited to the quasi-analytical treatment of fluorescence in CIAD geometry to project patterns and that they need to be verified by Monte Carlo simulations or experimental investigations in future studies. However, the patterns projected for CIAD geometry will be useful to compare against those given by the semi-empirical model of SF. For example, this quasi-analytical model for CIAD, as it accounts for the effect of absorption more realistically than a modified Beer–Lambert approach of the semi-empirical model for SF, projects patterns including stronger attenuation at high absorption and a triple-phase pattern and together these help us to further understand fluorescence applicable to SF geometry.

3. Analytical Approach

Equation (9) is rewritten with polar coordinates and referred to Figure 3, resulting in the following:
L e x ρ , z , , s ^ , λ = L b a s e ρ , z , , s ^ , λ + L c o l l ρ , z , , s ^ , λ + L d i f f ρ , z , , s ^ , λ
where z = 0 represents a reference plane upon which the collimated illumination is incident perpendicularly. And the model detector has been set on the plane of z = 0 . This reference plane of z = 0 is thus a virtual plane in an infinite domain of the medium and represents the medium–air interface in a semi-infinite domain of the medium.

3.1. The “Base” Proportion of Fluorescence Associated with Radiative Transfer Treatment of the Irradiation of Excitation on the Extreme Outer Part of the Medium

The “base” proportion of the irradiance that excites the fluorescence at the extremely outer part z z 0 0 can be obtained according to [48] as follows:
L b a s e ρ , z 0 , , s ^ = S 2 π μ a + μ s δ ρ · H z H z z 0
where δ ρ represents spatial Dirac impulse function, H z represents Heaviside function, and z 0 << 1 / μ s . The fluorescence excited by this localized proportion of the irradiance in the extremely outer part of the medium acts like a secondary source of isotropic emission at the wavelength of fluorescence with the following strength:
Q b a s e f l ρ , z 0 , , s ^ = ζ b a s e · γ λ λ f l · μ a f l · z 0 · S 2 π μ a + μ s δ ρ
where ζ b a s e is coefficient lumping necessary factors for unit conversion. The resulting radially resolved fluorescence photon assessed over the area of collection, by absorbing z 0 into ζ b a s e to become ζ b a s e , is as follows:
R b a s e f l ρ = Q b a s e f l ρ , z 0 , , s ^ S 4 π D ~ 1 ρ e x p μ a + μ s ρ   = ζ b a s e · γ λ λ f l · μ a f l · S 8 π 2 D ~ μ a + μ s 1 ρ e x p μ a + μ s ρ
where D ~ is a coefficient denoting the degree of photon dissipation that needs to relax to the diffusion coefficient upon reaching full diffusion. Counting all photons ascribing to Equation (14) gives the proportion of surface fluorescence as:
I b a s e f l 0 ρ = 2 π 0 ρ R b a s e f l ρ ρ d ρ                                                                         = 2 π ζ b a s e · γ λ λ f l · μ a f l · S 8 π 2 D ~ μ a + μ s 0 ρ e x p μ a + μ s ρ d ρ                                                           = ζ b a s e · γ λ λ f l · μ a f l · S 4 π D ~ μ a + μ s 2 1 e x p μ a + μ s ρ
Using power series expansion and considering that the upper limit of the radial dimension is one half of d f i b , Equation (15) becomes:
I b a s e f l 0 ρ = ζ b a s e · γ λ λ f l · μ a f l · S 4 π D ~ μ a + μ s 2 n = 1 1 n μ a + μ s d f i b n 2 n · n !
Consideration of boundary conditions can be expected to effectively change the weighting of the power series of Equation (16). Equation (16), as well as its boundary-condition modified version, should project that this base proportion of fluorescence shall increase as d f i b increases, increase as μ s increases, and decrease as μ a increases.

3.2. The “Collimated” Proportion of Fluorescence Associated with Radiative Transfer Treatment of the Irradiation of Excitation over Approximately One Scattering Path Length

The collimated proportion of the irradiance that excites the fluorescence at the shallow region of the medium can be obtained according to [44,48] as follows:
L c o l l ρ , z > 0 , , s ^ = S 2 π μ a + μ s δ ρ e x p μ a + μ s z H z z 0 H z z s
where z s = 1 / μ s . The fluorescence excited by this collimated proportion of the irradiance over a depth of approximately one scattering path length acts like a secondary source of isotropic emission at the wavelength of fluorescence with the following strength:
Q c o l l f l ρ , z > 0 , , s ^ = ζ c o l l · γ λ λ f l · μ a f l · S 2 π μ a + μ s δ ρ e x p μ a + μ s z
where ζ c o l l is a coefficient that could have unit conversion factors lumped within. The resulting fluorescence originating at a depth of z excited by the collimated radiance is:
R c o l l f l ρ , z , = Q c o l l f l ρ , z > 0 , , s ^ 1 4 π D ~ S ρ e x p μ a + μ s ρ = ζ c o l l · γ λ λ f l · μ a f l · S 8 π 2 D ~ μ a + μ s 1 ρ · e x p μ a + μ s ρ · e x p μ a + μ s z
The fluorescence counted at one radial position of ρ on the medium surface by the collimated radiance is then the integration of Equation (19) over the depth, which is as follows:
R c o l l f l ρ , 0 , = 0 U c o l l f l ρ , z , d z = ζ c o l l · γ λ λ f l · μ a f l · S 2 π μ a + μ s 1 4 π D ~ 1 ρ · e x p μ a + μ s ρ 0 e x p μ a + μ s z d z = ζ c o l l · γ λ λ f l · μ a f l · S 8 π 2 D ~ μ a + μ s 2 1 ρ · e x p μ a + μ s ρ
Counting all photons ascribed to Equation (20) then gives the proportion of fluorescence excited by the collimated portion of the radiance, which can also evolve to a form like Equation (15) by means of power series expansion, which is shown as follows:
I c o l l f l 0 ρ = 2 π 0 ρ R c o l l f l ρ ρ d ρ = 2 π ζ c o l l · γ λ λ f l · μ a f l · S 8 π 2 D ~ μ a + μ s 2 0 ρ e x p μ a + μ s ρ d ρ     = ζ c o l l · γ λ λ f l · μ a f l · S 4 π D ~ μ a + μ s 3 n = 1 1 n μ a + μ s d f i b n 2 n · n !
Consideration of boundary conditions can be expected to effectively change the weighting of the power series of Equation (21) to an extent close but not identical to the changes that can be brought to Equation (16) because it involves a greater volume of the medium over the lateral dimension for the “coll” proportion than the “base” proportion. Equation (21), as well as its boundary-condition-modified version, however, should still project that this “collimated” proportion of fluorescence shall increase as d f i b increases, increase as μ s increases, and decrease as μ a increases. Another observation that can be made is that Equation (21) differs from Equation (16) primarily with a factor of 1 / μ a + μ s , provided that the consistency of the units between the two equations has been addressed with the coefficient of ζ b a s e that has lumped in z 0 or a parameter having a dimension of length.

3.3. The “Diffuse” Proportion of Fluorescence Associate with the Diffuse Transport of the Irradiance of Excitation

The diffuse proportion of the irradiance exciting the fluorescence is viable for diffuse-photon-transport treatment, which can approximate diffuse radiance L d i f f with a primary isotropic photon fluence rate Ψ that proportionally determines the local photon density.

3.3.1. From Point Fluorophore to All Fluorophores

We refer to Figure 5 for the stepwise development of the diffuse component of fluorescence in CIAD. Figure 5A depicts a boundless diffusive medium of uniform optical properties in polar coordinates. A point r ’ represents an isotropic source and is set on the polar axis at a distance of z = z a z ^ from the origin of the coordinates along the unit vector z ^ . A point r represents a position for assessing photon fluence is set on the reference plane z = 0 , and has a radial distance of ρ from the origin of the coordinates. The resulting fluorescence assessed between r and r due to the point fluorophore r f l is expressed as [49].
    Ψ i n f · f l r r = Ψ i n f r · r f l r = ζ d i f f · γ λ λ f l · μ a f l · S 4 π D 2 e x p k 0 r r f l r r f l e x p k 0 r f l r r f l r
In the subsequent analyses, the arrow sign “ ” represents operating at the “excitation” wavelength and the arrow sign “ ” represents operating at the “emission” wavelength.
We now consider a geometry illustrated in Figure 5B, which differs from Figure 5A in that the medium contains uniformly distributed fluorophore. The radially resolved (with respect to the polar axis passing the point source at r ) fluorescence photon fluence rate associated with fluorophores distributed uniformly across an infinite homogeneous medium and illuminated by a point isotropic source on the axis may be expressed as the integration of the fluorescence caused by a model point fluorophore over the entire domain of fluorophore as follows:
Ψ i n f f l r ,   r = Ψ i n f r r f l r                   = Ψ i n f · f l r · r f l r d 3 r f l                                 = ζ d i f f · γ λ λ f l · μ a f l · S 4 π D 2 e x p k 0 r r f l r r f l e x p k 0 r f l r r f l r d 3 r f l
Taking advantage of a form of the integration of Equation (23) involving two functions of r f l [50,51], we have the following:
Ψ i n f f l r ,   r = ζ d i f f · γ λ λ f l · μ a f l · S 8 π k 0 D 2 e x p k 0 r r
Equation (24) changes to the following form by considering the specific positioning of the source and detector points shown in (B):
Ψ i n f f l ρ = ζ d i f f · γ λ λ f l · μ a f l · S 8 π k 0 D 2 e x p k 0 ρ 2 + z a 2  

3.3.2. From Point Detection to Area Detection

We further consider a medium-fluorophore geometry of (C) which differs from (B) in that the fluorescence photon is summed up over the circular area on the reference plane of z = 0 that has a radius of ( ρ = d f i b / 2 ). The azimuthal symmetry of the geometry of (C) leads to the following total fluorescence assessed over the circular region of a radius of ρ :
I C I A D f l 0 ρ = 2 π 0 ρ Ψ i n f f l ρ · ρ · d ρ = ζ d i f f · γ λ λ f l · μ a f l S 4 k 0 D 2 0 ρ e x p k 0 ρ 2 + z a 2 · ρ d ρ
The integration of Equation (26) has a solution of the following:
I C I A D f l 0 ρ = ζ d i f f · γ λ λ f l S 4 · μ a f l k 0 · 1 k 0 · D 2                                                                                   · 1 + k 0 · z a e k 0 · z a 1 + k 0 · ρ 2 + z a 2 e k 0 · ρ 2 + z a 2
At a limiting case of z a = 0 , Equations (25) and (27), respectively, relax to the following:
Ψ i n f f l ρ z a = 0 = ζ d i f f · γ λ λ f l · μ a f l S 8 π k 0 D 2 e x p k 0 ρ
I C I A D f l 0 ρ z a = 0 = ζ d i f f · γ λ λ f l · S 4 · μ a f l k 0 · 1 k 0 · D 2 1 1 + k 0 · ρ e k 0 · ρ
Applying Equation (28) in Equation (7) to be multiplied with the GPW function of Equation (5) leads to the following:
I T o p H f l d f i b z a = 0 = π 4 d f i b 2 ζ d i f f · γ λ λ f l · μ a f l S 8 π · k 0 · D 2 0 d f i b e x p k 0 · ρ · P ρ , d f i b d ρ
which could be used to develop an analytical form of the top hat illuminated fluorescence. An analytical demonstration of how Equation (30) for the top hat geometry and Equation (29) for the CIAD geometry may be scaled with respect to each other is given in Appendix A.

3.3.3. The Implementation of a Type-III Boundary Condition

The introduction of a boundary between air and a medium from which the diffuse reflectance is assessed causes a reduction in the diffuse reflectance in comparison to that of an unbounded medium. In treating boundary value problems for diffuse reflectance, three types of boundary conditions may be relevant [47,52]. Boundary conditions differ in the amount of reduction to the diffuse reflectance in comparison to the unbounded case by having different treatments of what aspects of photon counts shall vanish and where the photon counts shall vanish at a reference plane. The type-I boundary condition considers the photon count or photon fluence rate to vanish at the medium–air interface but also considers there to be non-zero photon flux produced at the medium–air interface. The type-II boundary condition considers the photon flux at a direction normal to the medium surface to vanish at the medium–air interface but considers that it produces a non-zero photon fluence rate at the medium–air interface. The type-III boundary condition, which can be seen as a combination of type-I and type-II conditions, considers the photon count to vanish at a position some distance away from the medium–air interface to give both a non-zero photon fluence rate and non-zero outgoing photon flux at the physical medium–air interface. Appreciably, the type-III boundary condition is a more realistic representation of the effect of the boundary since photons after diffuse propagation in the medium are measured at the medium–air interface and at an angle normal to the medium interface. And the type-III boundary condition can be practically implemented with the introduction of an image source to a model physical source that accounts for the far-field diffuse reflectance observed within the medium. The reference plane in the type-III boundary condition for setting the image source of the model physical source is the virtual “extrapolated” boundary plane at which the photon count is set to vanish. The vanishing of the photon count at the “extrapolated” boundary plan requires the image source to be the negative image of the model physical source.
To implement the type-III boundary condition, the following notations will be necessary:
l r e a l = ρ 2 + z a 2
l i m a g = ρ 2 + z a + 2 z b 2
where
z b = 2 A D
A = 1 + ξ 1 ξ
ξ = 1.44 n 2 + 0.710 n 1 + 0.668 + 0.0636 n
Equation (31) represents the distance between the model point of light collection on the medium surface and the model physical source, giving the far-field diffuse reflectance in the corresponding unbounded medium. Equation (32) represents the distance between the model point of light collection on the medium surface and the mirrored image of the former model physical source, with respect to the extrapolated boundary set at a distance of z b away from the medium–air interface. According to [49], the spatially revolved fluorescence in a semi-infinite medium, associated with an SDS formed by a point source at r and a point detector at r , for the entirety of the fluorophore distributed uniformly within the medium is expressed by the following:
Ψ s e m i f l r r f l r = Ψ r e a l f l Ψ i m a g f l Ψ s t r i p f l
where the three terms at the RHS of Equation (36) are, respectively, the following:
Ψ r e a l f l = γ λ λ f l · μ a f l S 4 π k 0 D 2 e x p k 0 l r e a l
Ψ i m a g f l = γ λ λ f l · μ a f l S 4 π k 0 D 2 e x p k 0 l i m a g
Ψ s t r i p f l = γ λ λ f l · μ a f l S 4 π k 0 D 2 e x p k 0 l r e a l l r e a l k 0 z b 2
where the term of Equation (37) corresponds to the fluorescence photon counts in a hypothetical infinite medium associated with an SDS formed by a point source at r , a point detector at r , and the entirety of the fluorophores distributed uniformly within the corresponding hypothetical unbounded medium. The term of Equation (38) corresponds to the fluorescence photon counts in a hypothetical infinite medium associated with an SDS formed by a point source which is the negative image of the point source at r with respect to the extrapolated zero-boundary, a point detector at r , and the entirety of the fluorophores distributed uniformly within the corresponding hypothetical unbounded medium. The term of Equation (39) corresponds to the fluorescence photon counts caused by a hypothetical distribution of fluorophores in an infinitely long strip of a width of 2 z b , in association with a point source at r and a point detector at r . The presence of z b in Equation (39) as a factor for multiplication means that this term is the outcome of an “extrapolated-zero” boundary away from the medium–air interface. This also means that Ψ s t r i p f l is zeroed under a type-I boundary condition, the image source is negative in type-III, and under a type-II boundary condition the image source is positive as opposed to that in type-III.
With the use of Equation (37), the corresponding fluorescence collected over the circular area of a radius of ρ of the semi-infinite medium is:
I s e m i f l 0 ρ = 2 π 0 ρ Ψ s e m i f l ρ · ρ · d ρ = 2 π 0 ρ · Ψ s e m i f l r r f l r · ρ · d ρ
Which splits to three terms of the following:
I s e m i f l 0 ρ = I r e a l f l 0 ρ I i m a g f l 0 ρ I s t r i p f l 0 ρ
The three terms at the RHS of Equation (41) are, respectively:
I r e a l f l 0 ρ = 2 π 0 ρ Ψ r e a l f l ρ · ρ · d ρ = ζ d i f f · γ λ λ f l · S 4 · μ a f l k 0 · 1 k 0 · D 2 1 + k 0 · z a e k 0 · z a 1 + k 0 · ρ 2 + z a 2 e k 0 · ρ 2 + z a 2
I i m a g f l 0 ρ = 2 π 0 ρ Ψ i m a g f l ρ · ρ · d ρ = ζ d i f f · γ λ λ f l · · S 4 · μ a f l k 0 · 1 k 0 · D 2 1 + k 0 · z a + 2 z b e k 0 · z a + 2 z b 1 + k 0 · ρ 2 + z a + 2 z b 2 e k 0 · ρ 2 + z a + 2 z b 2
I s t r i p f l 0 ρ = 2 π 0 ρ Ψ s t r i p f l ρ · ρ · d ρ = ζ d i f f · γ λ λ f l · S 4 μ a f l k 0 1 k 0 · D 2 2 k 0 · z b 2 · e x p k 0 z a e x p k 0 ρ 2 + z a 2
where the term of Equation (42) corresponds to the fluorescence photon count in the pertinent hypothetical infinite medium associated with a point source at r , an area of collection bounded by the radius of a point detector at r , and the entirety of the fluorophores distributed uniformly within the infinite medium. The term of Equation (43) corresponds to the fluorescence photon count in the pertinent hypothetical infinite medium associated with the image of a point source at r with respect to the extrapolated zero-boundary, an area of collection bounded by the radius of a point detector at r , and the entirety of the fluorophores distributed uniformly within the infinite medium. The term of Equation (44) corresponds to the fluorescence photon count caused by a hypothetical distribution of fluorophores in an infinitely long strip of a width of 2 z b , in association with a point at r and an area of collection bounded by the radius of the point detector at r . Equations (42)–(44) can convert to the following:
I r e a l f l 0 ρ = I r e a l f l 0 ρ ζ d i f f · γ λ λ f l · S 4 · μ a f l k 0 1 k 0 · D 2 = 1 + k 0 · z a e k 0 · z a 1 + k 0 · ρ 2 + z a 2 e k 0 · ρ 2 + z a 2
I i m a g f l 0 ρ = I i m a g f l 0 ρ ζ d i f f · γ λ λ f l · S 4 · μ a f l k 0 1 k 0 · D 2 = 1 + k 0 · z a + 2 z b e k 0 · z a + 2 z b 1 + k 0 · ρ 2 + z a + 2 z b 2 e k 0 · ρ 2 + z a + 2 z b 2
I s t r i p f l 0 ρ = I s t r i p f l 0 ρ ζ d i f f · γ λ λ f l · S 4 · μ a f l k 0 1 k 0 · D 2 = 2 k 0 · z b 2 · e x p k 0 z a e x p k 0 ρ 2 + z a 2
Equations (45)–(47) were based on diffusion treatment of the photon propagation that needs to be corrected at the sub-diffusive region as the area assessed contains the POI. A correction to the sub-diffusive portion has been given via an approach of master–slave source approach [53], which introduces a secondary contribution to the reflectance near the POI. This secondary contribution functions as a dependent source placed extremely close to the medium boundary. The implementation of this master–slave configuration to diffuse reflectance adds a secondary counterpart to the set of terms in the square bracket of Equations (45)–(47). This resulted in a total diffuse portion of fluorescence as follows:
I d i f f f l μ a , μ s , [ d f i b = 2 ρ ] = 1 + k 0 · z a e k 0 · z a 1 + k 0 · ρ 2 + z a 2 e k 0 · ρ 2 + z a 2 + 1 1 + k 0 · ρ e k 0 · ρ             1 + k 0 · z a + 2 z b e k 0 · z a + 2 z b 1 + k 0 · ρ 2 + z a + 2 z b 2 e k 0 · ρ 2 + z a + 2 z b 2 1 + k 0 · 2 z b e k 0 · 2 z b 1 + k 0 · ρ 2 + 2 z b 2 e k 0 · ρ 2 + 2 z b 2 2 3 π k 0 · z b 2 · e x p k 0 z a e x p k 0 ρ 2 + z a 2 2 3 π k 0 · z b 2 · 1 e x p k 0 ρ

3.4. The Terminal Combined Form of the Fluorescence of CIAD

As stated heretofore, both Equations (16) and (21) should project that the corresponding portion of fluorescence shall increase as d f i b increases, increase as μ s increases, and decrease as μ a increases. And a consideration of the boundary condition can be expected to effectively change the weighting of the power series of Equations (16) and (21). Based on the patterns indicated by and expected for Equations (16) and (21), and a difference of 1 / μ a + μ s between the terms of the two equations, the following forms have been developed for the respective “base” and “coll” proportions of fluorescence:
I b a s e f l μ a , μ s , d f i b = 0.01 d f i b 70 0.5 0.2 + 0.9 1 e x p 10 μ s μ a 0.5 e x p μ a 2 0.5
I c o l l f l μ a , μ s , d f i b = 0.04 d f i b 0.6 μ s 0.6 exp 0.1 + 4 μ a d f i b μ s 0.3 e x p μ a 2 0.5
And finally, the “base” and “coll” proportions represented, respectively, by Equations (49) and (50), and the “diff” proportion normalized as Equation (48), are combined in the following form to project fluorescence for the CIAD geometry:
I C I A D   f l u o μ a , μ s , d f i b = I b a s e μ a , μ s , d f i b + I c o l l μ a , μ s , d f i b + 2.5 I d i f f μ a , μ s , d f i b

4. Numerical Implementations to Compare Patterns Projected for CIAD and for SF

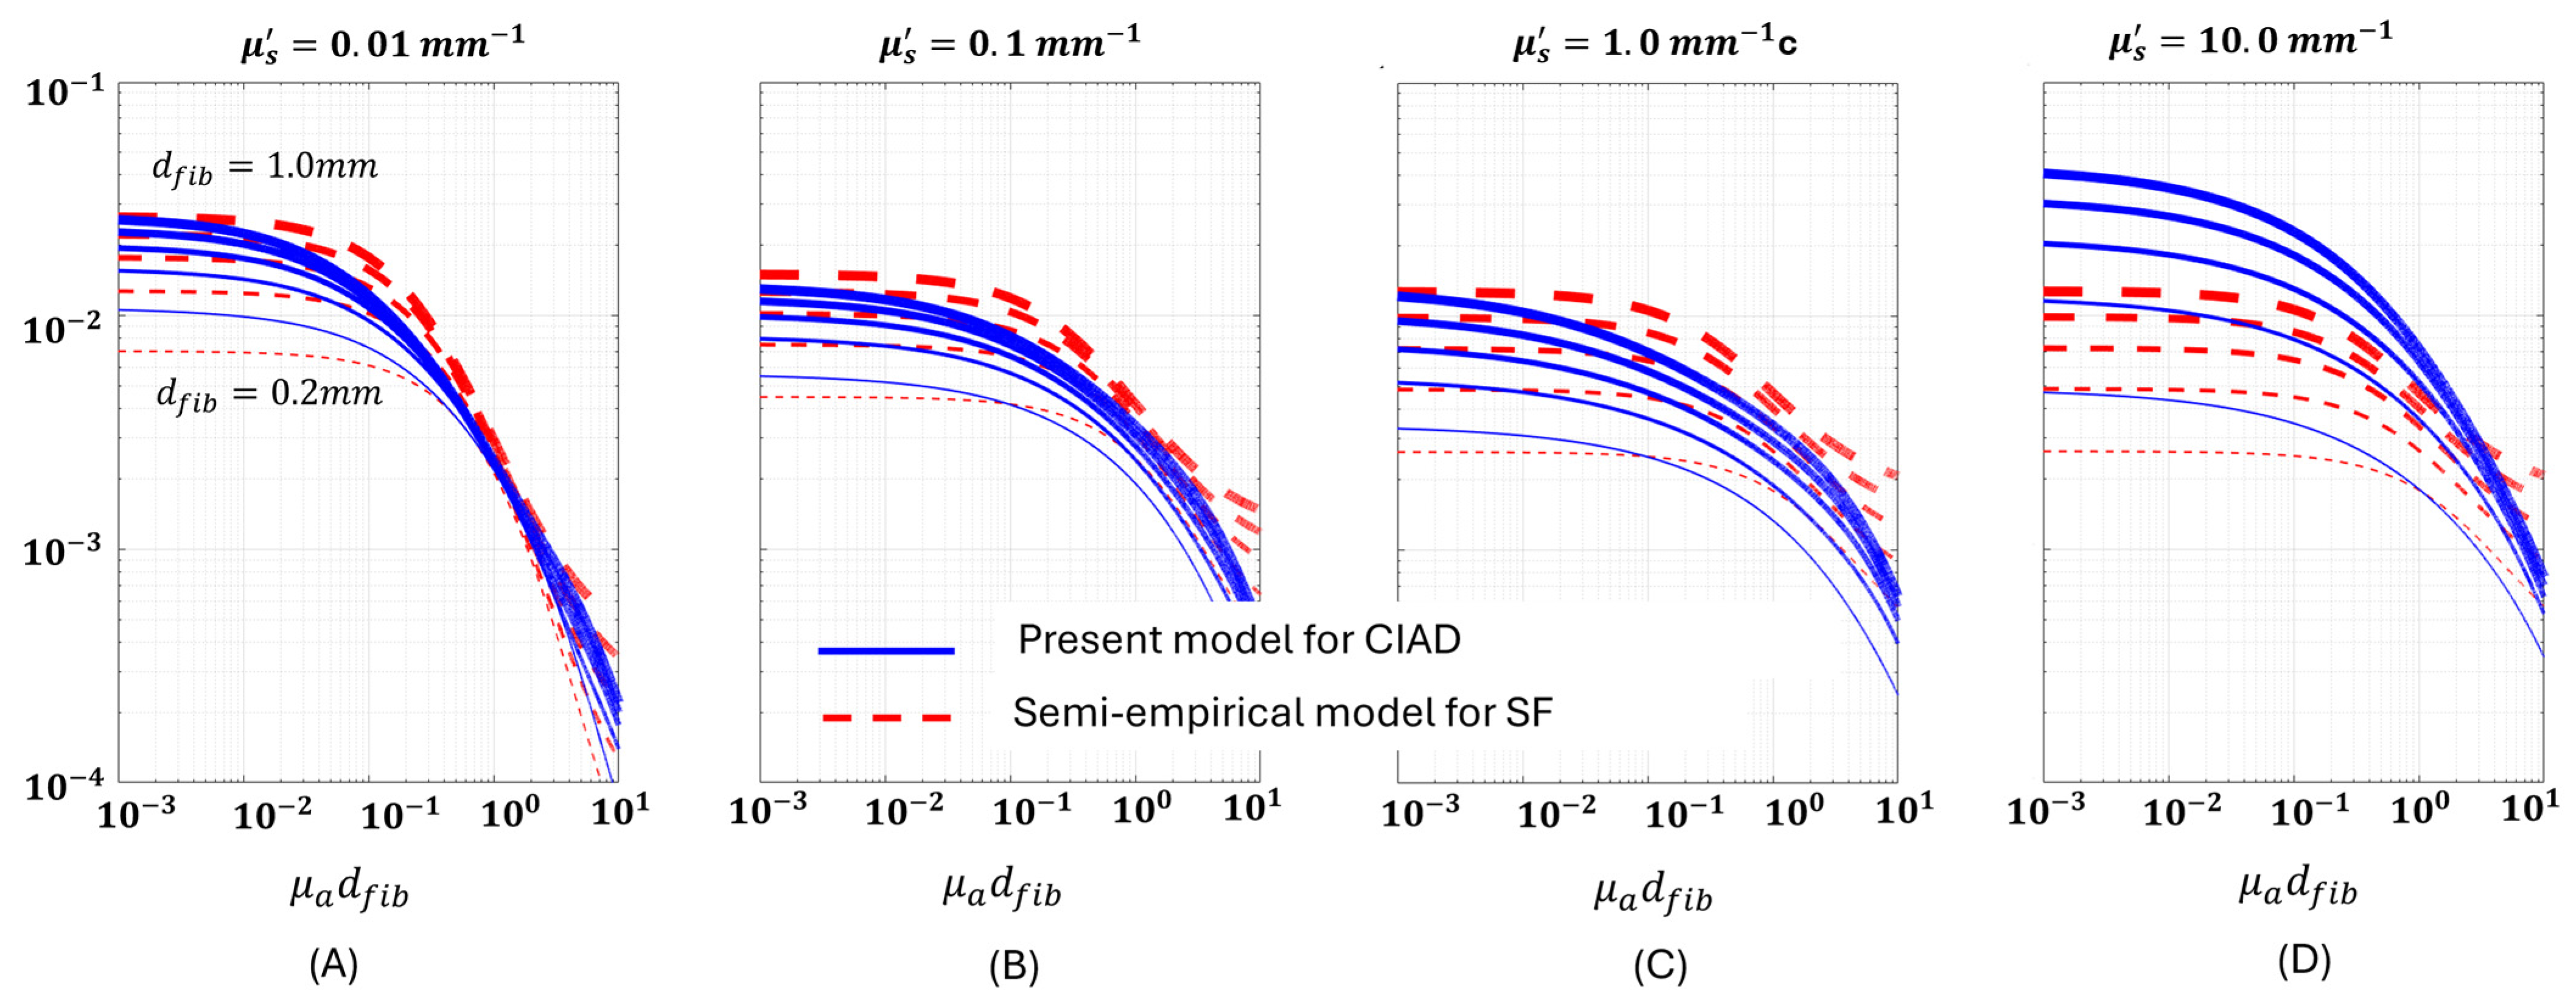
In the following section, the pattern of fluorescence projected by Equation (51) is compared against that projected by Equation (3) for SF by numerating the two equations that deliver results instantaneously if running on a complete set of parameters. The numerical implementation has been performed for the combination of the following parameters. The d f i b , or the diameters of the area of collection common to both CIAD and SF equations are 0.2, 0.4, 0.6, and 1.0 mm. This corresponds to the radius of CIAD to vary from 0.1 mm to 0.5 mm at a step of 0.1 mm. The μ s is set from 0.001 to 10 mm−1 at a step of 0.001 mm−1, covering four orders of magnitude. The μ a is set at four values including [0.001, 0.01, 0.1, 1.0] mm−1, covering three orders of magnitude. In the following, the predictions given by Equation (3) for SF are presented as dashed lines, and those by Equation (51) for CIAD are solid lines. For each set of dashed or solid lines, the increases in line thickness represent larger d f i b .

4.1. Fluorescence Versus Dimensionless Scattering Projected for CIAD in Comparison to That for SF

Figure 6A–D displays the fluorescence projected for CIAD as a function of dimensionless reduced scattering at four values of absorption. The increase in the absorption reduces the fluorescence across the board. An increase in the size of the collection generally increases the fluorescence collected at an absorption coefficient when it is less than 0.1 mm−1. A change in the phase of the response of fluorescence due to reduced scattering can be observed in all sub-figures. Within each sub-figure, the turning of the bi-phasic pattern shifts to smaller dimensionless reduced scattering as the size of collection increases. These patterns projected for CIAD are in overall agreement with those for SF geometry. Figure 6E displays the fluorescence projected for CIAD versus that for SF at the same setting of other parameters. The data corresponding to the four values of the absorption coefficient are marked with different types, sizes, and colors of the discrete markers. A diagonal line stretching the three orders of magnitude change in the fluorescence represents the ideally perfect match between the two projected values. The scattered points that correspond to smaller values of absorption coefficients aggregate in regions closer to the diagonal line, indicating that the values projected for CIAD are closer to those for SF in addition to the resemblance of the pattern itself between CIAD and SF. As the absorption coefficient increases, the deviation between projections for CIAD and SF increases.

4.2. The Bi-Phasic Turning Point

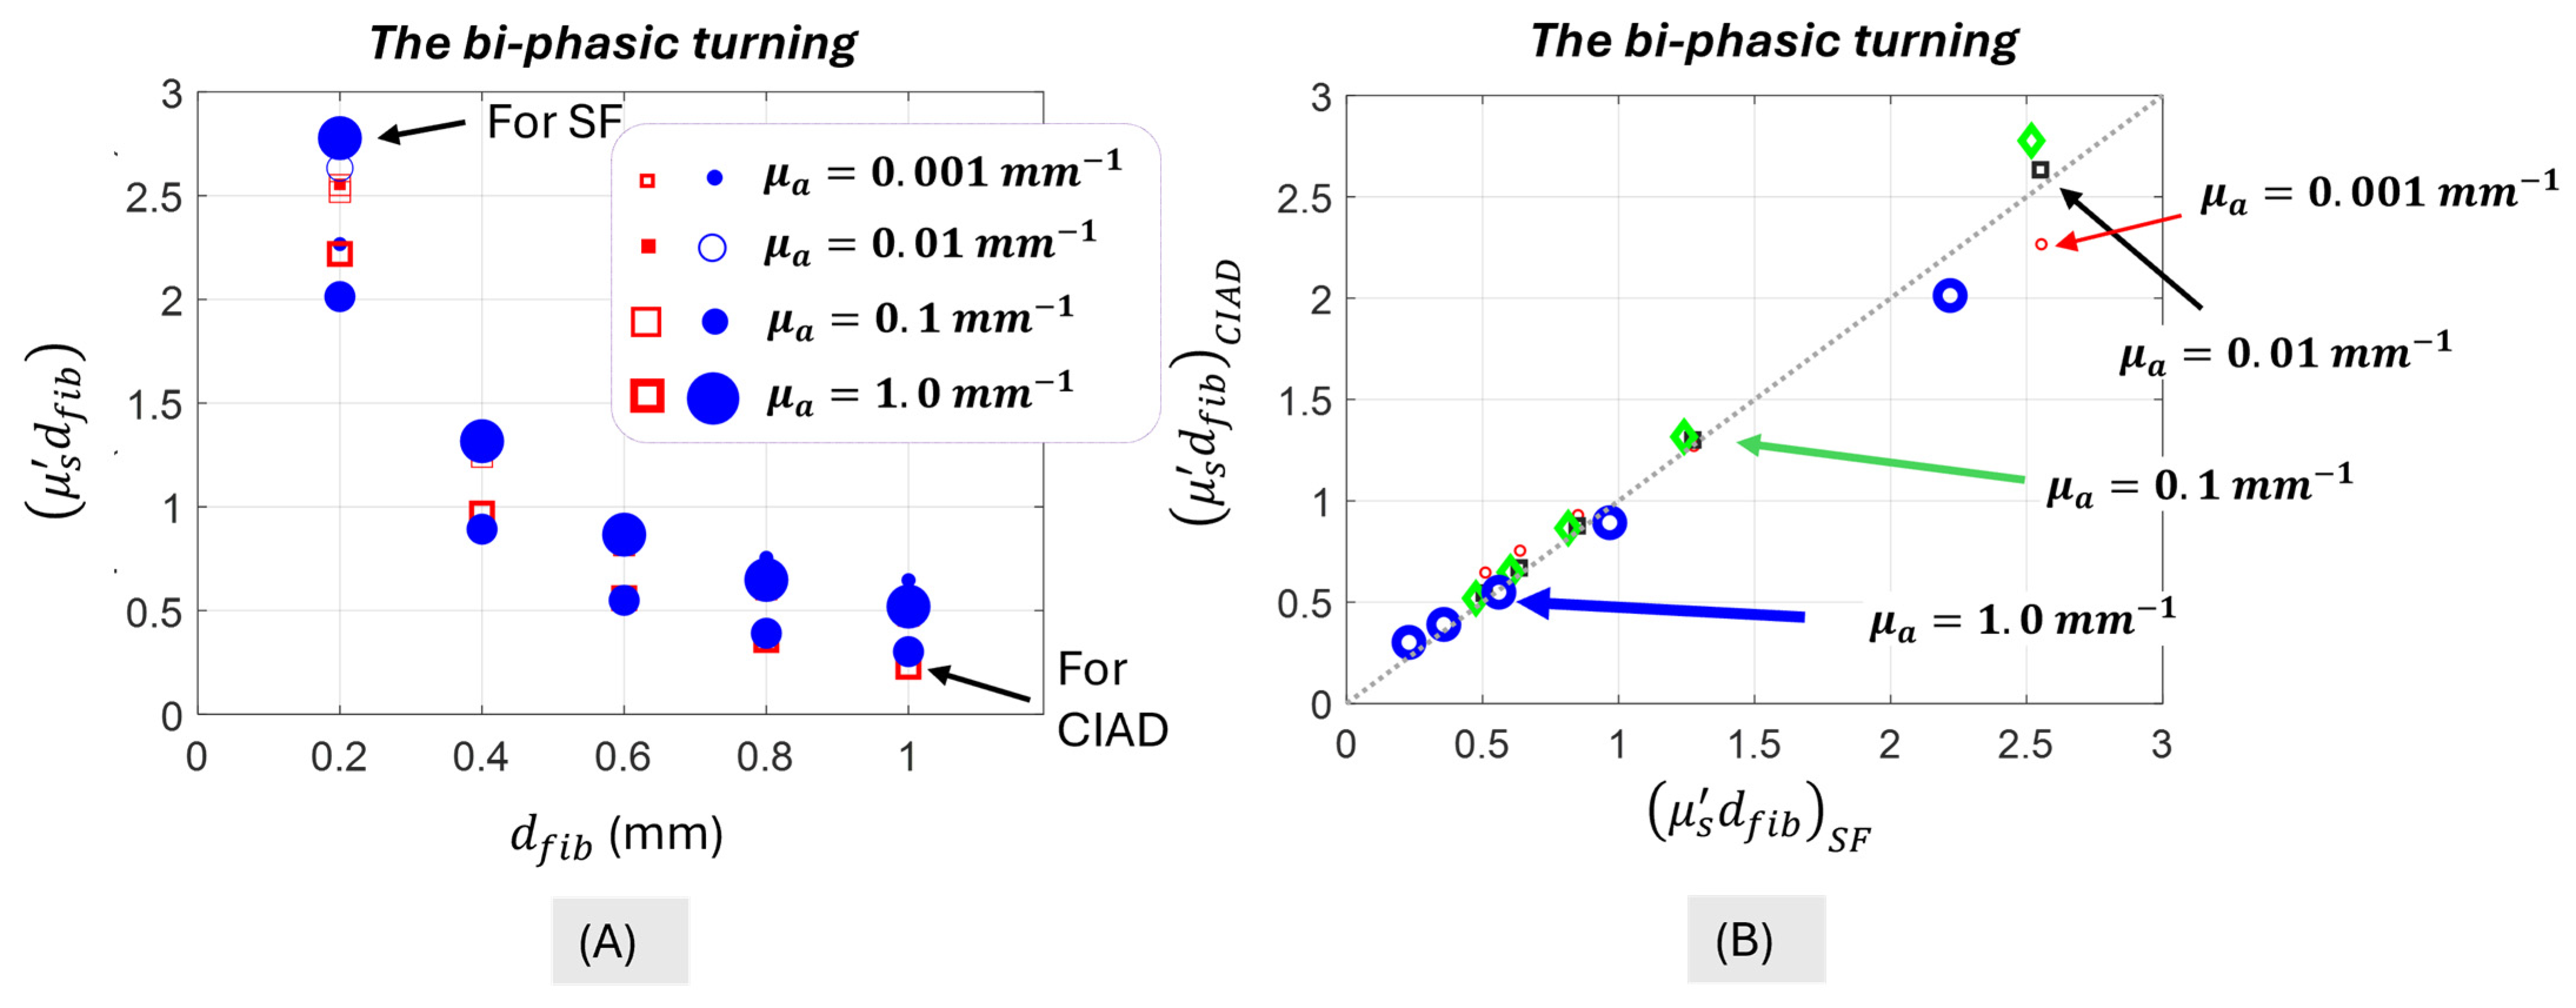
The point of the bi-phasic turning occurring around the dimensionless reduced scattering value of one has been numerically found with the plots of Figure 6. The resulting bi-phasic turning points for CIAD and SF are displayed in Figure 7A versus the five sizes of the area of collection common to CIAD and SF. The resulting bi-phasic turning points for CIAD are also scatter-plotted versus those for SF in Figure 7B, where the diagonal line represents the ideally perfect match. As the diameter of the area of collection increased from 0.2 mm to 1.0 mm or equivalently the area of collection in consideration has a radius of 0.1 mm to 0.5 mm, the bi-phasic turning points in both CIAD and SF reduced from a value greater than 2 to one less than 0.7. And there is a good match of the bi-phasic turning points projected between CIAD and SF.

4.3. Fluroescence Versus Absorption Projected for CIAD in Comparison to That for SF

Figure 8A–D display the fluorescence projected for CIAD as a function of dimensionless absorption at four values of the reduced scattering coefficient. An increase in the size of the area of collection increases the fluorescence collected. The increase in the absorption coefficient monotonically reduces fluorescence, and the rate of reduction in fluorescence increases at a greater value of absorption coefficient. A major discretion between the two patterns can be seen at strong absorption and strong reduced scattering in (D). At a strong reduced scattering coefficient of 10 mm−1, the fluorescence projected for SF exhibits a pattern of a reduced rate of reduction as the dimensionless absorption increases beyond a single digit. Assessing the gross pattern across the four values of reduced scattering coefficients also suggests that the increase in reduced scattering coefficients cause initially a reduction in fluorescence and then an increase in fluorescence. Such a gross pattern of changes is once again the manifestation of a bi-phasic response to scattering.

5. Discussions

Dimensionless reduced scattering used for models of SF or CIAD is numerically equivalent to scaling the size (diameter of the area of collection) over the reduced scattering path length. Therefore, for the same range of increasing the dimensionless reduced scattering as assessed in this work for CIAD there are two ways to implement it: one is to keep the reduced scattering constant but to increase the size of the area of collection and the other is to keep the size of the area of collection constant but to increase the reduced scattering coefficient. Whereas both ways can give the same range of increasing the dimensionless reduced scattering, the first way of increasing the size of collection at a constant scattering will only result in more fluorescence photons collected, which will make the fluorescence increase monotonically as the dimensionless reduced scattering increases. And the monotonical increase in the fluorescence photons in CIAD geometry can be expected to reach a saturation state as the area of collection extends to the region where the fluorescence excited by the illumination at the center of the area of collection falls to the noise level.
It is thus imperative to recognize that the bi-phase of fluorescence projected for CIAD, which could help us gain insights into the bi-phase of fluorescence in SF, is a phenomenon occurring with respect to the change in scattering that is expressed conventionally in a dimensionless term, as with SF. Given the same conditions of the medium other than the scattering, the upward turning of the phase of the fluorescence as the reduced scattering increases is projected to occur at a smaller dimensionless reduced scattering for a larger size of collection. This basically relates to the inequality between scaling the size of collection and the scattering of the medium in impacting the collectable photons. In other words, scaling up the reduced scattering combined with scaling down the size of collection over the same amount, which keeps the same dimensionless reduced scattering, results in different photon absorption over a reduced scattering path length due to the difference in the albedo in the two cases of equal dimensionless reduced scattering. This difference translates to different changes to the radiance of exciting fluorophores and the propagation of fluorescence. That comprehensive effect of scattering–absorption coupling is inadequately addressed by the semi-empirical model, such as Equation (3).
Although this work projects a similarity of the responses between CIAD and SF to cross-reference the salient patterns, it can be expected that the discrepancy between the patterns projected for CIAD and those for SF will become greater as the fiber diameter or size of area of collection increases. This can be explained by considering the case of a CIAD that has an area of collection many orders of magnitude greater than the reduced scattering path length. In such a case, the fluorophores near the edge of the area of collection that can be excited by the illumination at the distant centered POI are negligible, which corresponds to the geometry collecting all fluorescence that is excited by the full strength of the illumination. However, if the geometry is SF then the edge of the area of collection has its share of the illumination distributed over the entire area of collection. This will make both an increased illumination to excite fluorescence near the edge of the area of collection and an increase in fluorescence that falls outside of the area of collection. The assumption of scaling of the fluorescence between CIAD and SF could thus break down at an area of collection size substantially (for example, 2 orders of magnitude) greater than the reduced scattering path length. We note that there are applicator probes for DRS that are configured in a geometry not entirely CIAD but close to CIAD. For example, there are applicator probes which have a center fiber for collection surrounded by several fibers of illumination channels [54]. This geometry of one center-collection fiber surrounded by circularly arranged illumination fibers can be the reciprocal of a center-illumination fiber surrounded by circularly arranged collection fibers. The geometry of a center-illumination fiber surrounded by circularly arranged collection fibers can be modeled as a CIAD geometry utilizing a partial area of the collection. The patterns of such partial CIAD geometries could become a good estimator of the pattern of the original center-circular geometry.
The fluorescence reaching the surface which is being collected undergoes two processes of photon propagation: the propagation of the photon at the excitation wavelength to reach a fluorophore and the propagation of the secondary photon at the emission wavelength to reach a point within the zone of collection. If the photon counts at the end positions of both processes of photon propagation change at the same phase (decreasing or increasing), the fluorescence collected will change at the same phase as well. However, if the photon counts at the end positions of both processes of photon propagation change at opposite phases, the phase with the stronger change will dominate the phase of change in the fluorescence collected. It will then be interesting to reason why the bi-phase of fluorescence could occur in CIAD as observed in SF at any fixed size of collection. At very low scattering the diffusive photon at the excitation wavelength does not develop adequately to excite the isotopically emitting fluorescence within the medium. At low scattering, therefore, the fluorescence is excited in a greater proportion by the collimated proportion of the illuminating light. As the scattering increases, the proportion of the collimated irradiance reduces to cause a reduction in the fluorescence excited by the collimated irradiance. This causes a reduction in the fluorescence acquired at the surface within the area centered at the POI. As the scattering continues to increase, the diffusive irradiance increases to reach an increased volume of the fluorophore, which makes the diffusive proportion of fluorescence increase. The combined effect is then an initial faster reduction in fluorescence followed by a reversing pattern that slowly increases as the reduced scattering increases, manifesting as a bi-phasic turning versus an increase in scattering. And because the picking up of the fluorescence cannot happen without a reasonably developed field of diffusive photon propagation, the change shall occur at a dimension of the area of collection comparable to the path length over which the photon propagation becomes randomized to be “sensed” as diffusive. Such a “threshold” condition manifesting as a local minimum corresponds intuitively to a dimensionless reduced scattering of approximately 1.
Taking a closer look at the fluorescence at low scattering at stronger absorption, the model of this work projected for CIAD and the semi-empirical model experimentally tested for SF suggest another phase-change in the fluorescence as the scattering increases, in addition to the afore-analyzed bi-phase. The occurrence of a third phase may be called the tri-phase. This tri-phase is projected to occur at a very small dimensionless reduced scattering, less than 1/100th of the value of the pronounced bi-phase. The occurrence of this tri-phase may as well be explained by the change in the “base” and “collimated” proportions of the excitation irradiance as the scattering started to build up, long before the diffusive field develops. At zero scattering, the collimated excitation light reaches only fluorophores located within the narrow-collimated pathway, and only the isotropic fluorescence propagating towards the POI and within the collimated pathway is to be collected. Then, increased scattering should cause more interactions of the light with fluorophores within the extreme outer layer to cause the fluorescence to increase initially. This increase in fluorescence, however, can be quickly counteracted by the rapid reduction in fluorescence excited by the rapidly declining collimated irradiance prior to the building up of diffusive field of excitation irradiance. At higher absorption, this tri-phase pattern seems to become intensified over a dimensionless reduced scattering of 1/100 to 1/10th of the primary bi-phasic turn. This is because the same change in scattering causes a greater difference in the photon propagation at a stronger absorption. The presence of such a tri-phase, which may be challenging to validate experimentally, needs not to be overlooked when interpreting the fluorescence from a weakly scattering material that may have strong absorption when probed using either SF or CIAD geometry.
A major deviation of the patterns projected for CIAD and SFD is the rate of the reduction in fluorescence as the absorption increases. An increase in absorption over any length of propagation will cause an exponential rate of reduction in the photons that survive the propagation. Therefore, an increase in absorption must cause a reduction in the propagation of both the radiance of excitation and radiance of emission. Therefore, the rate of reduction in fluorescence versus the increase in absorption must be single-phasic; that is not to have the rate of the change in fluorescence change from becoming greater to becoming smaller, or reversely from getting smaller to getting greater, over the same scalable change in dimensionless absorption. The discrepancy of this pattern of absorption-affected fluorescence between that projected for CIAD and that projected for SF at strong absorption infers the need for better treatment of how the absorption may couple with scattering for a model projection of fluorescence in a geometry like CIAD or SF.
The scope of this work has been restricted to quasi-analytical treatments that could lead to projecting the pattern of fluorescence in CIAD geometry. The previous demonstration of the resemblance of steady-state and time-domain diffuse reflectance in CIAD to those of SF substantiates that critical patterns of the same mode of measurements, such as fluorescence, must have close resemblance between CIAD and SF geometries. There are, however, many limitations of this work that shall be lifted with future work. The limitations include but are not limited to the following: (1) What will the bi-phasic response be like if the transport properties differ between the excitation and emission wavelengths? (2) How robust is the bi-phasic behavior across varying anisotropy factors or in media with more complex optical properties such as layered tissues? To answer such questions, it will be necessary to first compare the quasi-analytical results with full Monte Carlo simulations under similar geometric and optical conditions to this work. On the other hand, the model approach demonstrated in this work presents an analytical algebraic form as the terminal model for steady-state fluorescence, as the semi-empirical model of SF does. Because the model is an algebraic one, computational cost is not much of an issue. Ideally, comparing the CIAD fluorescence model to experimental measurements will be required to assess the validity of this model approach and assess how accurate the model is.
Despite these limitations, it may be worthwhile noting that the model framework demonstrated that it related the pattens between two geometries with analytical means, and could be extended to frequency-domain and time-domain analyses of fluorescence in CIAD or SF. In both cases associated with CIAD geometry, the analytical model can be developed by radial integration of the radially resolved frequency-domain and time-domain fluorescence. And the radially resolved frequency-domain or time-domain fluorescence are the result of cascading two treatments, either a frequency-domain or time-domain treatment of the photon transfer at the excitation wavelength followed by a frequency-domain or time-domain treatment of the photon transfer at the emission wavelength. For the frequency-domain approach, the analytics could be envisioned by replacing the effective attenuation coefficient with a modulation-frequency-dependent complex effective attenuation coefficient. That will certainly increase the complexity of the analytics compared to the steady-state, as a frequency-dependent part will evolve in parallel to a frequency-independent part. For time-domain analysis, however, the significant difference in the time-domain analytics of the photon transport compared to steady-state or frequency-domain photon transport may make the combined analytics even more laborious to finalize. With adequate care, however, the same model approach or methodology as that demonstrated in this work can lead to a terminal frequency-domain or time-of-flight form of fluorescence which can facilitate analytical predictions of salient features at limiting cases. Efforts along those directions may provide valuable initial prediction of frequency-domain and life-time patterns of CIAD or SF in those unexplored modes.

Funding

This research received no external funding.

Institutional Review Board Statement

Not applicable.

Informed Consent Statement

Not applicable.

Data Availability Statement

The raw data supporting the conclusions of this article will be made available by the authors upon reasonable request.

Conflicts of Interest

The author declares no conflict of interest.

Appendix A. The Scalability Between Equation (30) and Equation (29)

Equation (29) is reprinted as follows by combining some fixed parameters into X :
I C I A D f l r r f l ,   0 ρ = X · μ a f l k 0 · 1 k 0 · D 2 1 1 k 0 · ρ · e k 0 · ρ
Expressing the exponential term of Equation (A1) using power series expansion and taking into account ρ = d f i b / 2 make the following:
I C I A D f l r r f l ,   0 ρ = X · μ a f l k 0 · 1 k 0 · D 2 1 2 k 0 · d f i b n = 0 1 n k 0 · d f i b n 2 n + 1 n !
Equation (30) for the top hat geometry is rewritten as follows by absorbing some fixed parameters into Y which also becomes Y by absorbing more constants and acounting for ρ = d f i b · x :
I T o p H d f i b = Y μ a f l k 0 · D 2 0 d f i b e x p k 0 · ρ · 16 π 1 d f i b x · c o s 1 x x 2 · 1 x 2 d ρ = Y μ a f l k 0 · D 2 0 1 x · c o s 1 x x 2 · 1 x 2 · e x p k 0 · d f i b · x · d x
Taking the power series expansion of the exponential term of Equation (A3) leads to:
I T o p H d f i b = Y μ a f l k 0 · D 2 0 1 x · c o s 1 x x 2 · 1 x 2 · n = 0 k 0 · d f i b n 1 n x n n ! · d x                                           = Y μ a f l k 0 · D 2 n = 0 1 n n ! k 0 · d f i b n 0 1 x n + 1 · c o s 1 x x n + 2 · 1 x 2 · d x
Let us evaluate the term 1 in the bracket of the integrand of Equation (A4). According to 2.832 on page 242 [55]:
x n + 1 · c o s 1 x d x = x n + 2 n + 2 c o s 1 x + 1 n + 2 x n + 2 1 x 2 · d x
Therefore:
0 1 x n + 1 · c o s 1 x d x = 1 n + 2 0 1 x n + 2 1 x 2 · d x
According to 2.263 on page 95 of [55], we can have a few rounds of cascading expressions of the integral at the right-hand side of Equation (A6) as:
0 1 x n + 2 1 x 2 · d x = n + 1 n + 2 · 0 1 x n 1 x 2 · d x = n + 1 n + 2 · n 1 n · 0 1 x n 2 1 x 2 · d x = n + 1 n + 2 · n 1 n · n 3 n 2 · 0 1 x n 4 1 x 2 · d x = n + 1 n + 2 · n 1 n · n 3 n 2 · n 5 n 4 · 0 1 x n 6 1 x 2 · d x
Then Equation (A6) becomes:
0 1 x n + 1 · c o s 1 x d x = 1 n + 2 · n + 1 n + 2 · n 1 n · n 3 n 2 · n 5 n 4 · 0 1 x n 6 1 x 2 · d x
Let’s us evaluate the term 2 in the bracket of the integrand of Equation (A4). According to 2.260 on page 94 of [55], we can have a few rounds of cascading expressions such as:
0 1 x n + 2 · 1 x 2 · d x = n + 1 n + 4 · 0 1 x n · 1 x 2 · d x = n + 1 n + 4 · n 1 n + 2 · 0 1 x n 2 · 1 x 2 · d x = n + 1 n + 4 · n 1 n + 2 · n 3 n · 0 1 x n 4 · 1 x 2 · d x = n + 1 n + 4 · n 1 n + 2 · n 3 n · n 5 n 2 0 1 x n 6 · 1 x 2 · d x
A comparison between Equations (A8) and (A9) shows that the two definitive integrals following the respective series of multiplications contain the same order of x ( n 6 ) that will terminate as either x 0 or x 1 , depending upon using an even integer or odd interger as the largest value of n . If n is an even integer, the terminal forms of the definitive integrals of (A8) and (A9) have the following values:
0 1 1 1 x 2 · d x = π 2
0 1 1 x 2 · d x = π 4
If n is an odd integer, the terminal forms of the definitive integrals of (A8) and (A9) have the following values:
0 1 x 1 x 2 · d x = 1
0 1 x 1 x 2 · d x = 1 3
Whichever case it is, the integral of Equation (A4) becomes a positive numerical value denoted as F n determined by the integer n. Then we have:
I T o p H f l r r f l ,   0 ρ = Y μ a f l k 0 · D 2 n = 0 1 n k 0 · d f i b n n ! F n
Rearranging (A2) as follows:
I C I A D f l r r f l ,   0 ρ = X · μ a f l k 0 · 1 k 0 · D 2 1 + n = 0 1 n k 0 · d f i b n 2 n + 1 n ! k 0 · d f i b 2
The infinite summation of Equation (A14) and the bracket term of Equation (A15) containing the infinite summation must be scalable. Therefore I T o p H f l r r f l ,   0 ρ and I C I A D f l r r f l ,   0 ρ are scalable with respect to each other (the latter one is greater).

References

  1. Voulgarelis, S.; Fathi, F.; Stucke, A.G.; Daley, K.D.; Kim, J.; Zimmerman, M.A.; Hong, J.C.; Starkey, N.; Allen, K.P.; Yu, B. Evaluation of visible diffuse reflectance spectroscopy in liver tissue: Validation of tissue saturations using extracorporeal circulation. J. Biomed. Opt. 2021, 26, 055002. [Google Scholar] [CrossRef] [PubMed]
  2. Makuła, P.; Pacia, M.; Macyk, W. How To Correctly Determine the Band Gap Energy of Modified Semiconductor Photocatalysts Based on UV–Vis Spectra. J. Phys. Chem. Lett. 2018, 9, 6814–6817. [Google Scholar] [CrossRef] [PubMed]
  3. Dupuis, G.; Elias, M.; Simonot, L. Pigment Identification by Fiber-Optics Diffuse Reflectance Spectroscopy. Appl. Spectrosc. 2002, 56, 1329–1336. [Google Scholar] [CrossRef]
  4. Reeves, J.B.; Zapf, C.M. Mid-infrared Diffuse Reflectance Spectroscopy for Discriminant Analysis of Food Ingredients. J. Agric. Food Chem. 1998, 46, 3614–3622. [Google Scholar] [CrossRef]
  5. Hasan, M.Z.; Saha, P.S.; Korfhage, M.O.; Zhu, C. Non-contact optical spectroscopy for tumor-sensitive diffuse reflectance and fluorescence measurements on murine subcutaneous tissue models: Monte Carlo modeling and experimental validations. Biomed. Opt. Express 2023, 14, 5418–5439. [Google Scholar] [CrossRef]
  6. Piao, D.; Borron, H.; Hawxby, A.; Wright, H.; Rubin, E.M. Effects of capsule on surface diffuse reflectance spectroscopy of the subcapsular parenchyma of a solid organ. J. Biomed. Opt. 2018, 23, 121602. [Google Scholar] [CrossRef]
  7. De Boer, L.L.; Bydlon, T.M.; Van Duijnhoven, F.; Vranken Peeters, M.-J.T.F.D.; Loo, C.E.; Winter-Warnars, G.A.O.; Sanders, J.; Sterenborg, H.J.C.M.; Hendriks, B.H.W.; Ruers, T.J.M. Towards the use of diffuse reflectance spectroscopy for real-time in vivo detection of breast cancer during surgery. J. Transl. Med. 2018, 16, 367. [Google Scholar] [CrossRef]
  8. Yu, B.; Fu, H.L.; Ramanujam, N. Instrument independent diffuse reflectance spectroscopy. J. Biomed. Opt. 2011, 16, 011010. [Google Scholar] [CrossRef]
  9. Piao, D.; O’Hara, J.; Bukkapatnam, S.; Ekin, S. Towards Non-Contact Glucose Sensing in Aqueous Turbid Medium at ∼1.1 Meters Distance. IEEE Photonics J. 2020, 12, 1–23. [Google Scholar] [CrossRef]
  10. Utzinger, U.; Richards-Kortum, R.R. Fiber optic probes for biomedical optical spectroscopy. J. Biomed. Opt. 2003, 8, 121–147. [Google Scholar] [CrossRef]
  11. Prahl, S.A. A Semi-Analytic Model for Fiber-Based Fluorescence Measurements. In Proceedings of the Biomedical Topical Meeting, Miami, FL, USA, 7–10 April 2002; OSA: Miami Beach, FL, USA; p. WD8. [Google Scholar]
  12. Pfefer, T.J.; Schomacker, K.T.; Ediger, M.N.; Nishioka, N.S. Light propagation in tissue during fluorescence spectroscopy with single-fiber probes. IEEE J. Sel. Top. Quantum Electron. 2001, 7, 1004–1012. [Google Scholar] [CrossRef]
  13. Kanick, S.C.; Van Der Leest, C.; Aerts, J.G.J.V.; Hoogsteden, H.C.; Kaščáková, S.; Sterenborg, H.J.C.M.; Amelink, A. Integration of single-fiber reflectance spectroscopy into ultrasound-guided endoscopic lung cancer staging of mediastinal lymph nodes. J. Biomed. Opt. 2010, 15, 017004. [Google Scholar] [CrossRef] [PubMed]
  14. De Roode, L.M.; De Boer, L.L.; Sterenborg, H.J.C.M.; Ruers, T.J.M. Tissue-probe contact assessment during robotic surgery using single-fiber reflectance spectroscopy. Biomed. Opt. Express 2024, 15, 6756. [Google Scholar] [CrossRef] [PubMed]
  15. Piao, D.; McKeirnan, K.L.; Sultana, N.; Breshears, M.A.; Zhang, A.; Bartels, K.E. Percutaneous single-fiber reflectance spectroscopy of canine intervertebral disc: Is there a potential for in situ probing of mineral degeneration? Lasers Surg. Med. 2014, 46, 508–519. [Google Scholar] [CrossRef] [PubMed]
  16. Kanick, S.C.; Robinson, D.J.; Sterenborg, H.J.C.M.; Amelink, A. Monte Carlo analysis of single fiber reflectance spectroscopy: Photon path length and sampling depth. Phys. Med. Biol. 2009, 54, 6991–7008. [Google Scholar] [CrossRef]
  17. Denzer, M.L.; Piao, D.; Pfeiffer, M.; Mafi, G.; Ramanathan, R. Novel needle-probe single-fiber reflectance spectroscopy to quantify sub-surface myoglobin forms in beef psoas major steaks during retail display. Meat Sci. 2024, 210, 109439. [Google Scholar] [CrossRef]
  18. Pogue, B.; Testorf, M.; McBride, T.; Osterberg, U.; Paulsen, K. Instrumentation and design of a frequency-domain diffuse optical tomography imager for breast cancer detection. Opt. Express 1997, 1, 391. [Google Scholar] [CrossRef]
  19. Hariri Tabrizi, S.; Mahmoud Reza Aghamiri, S.; Farzaneh, F.; Amelink, A.; Sterenborg, H.J.C.M. Single fiber reflectance spectroscopy on cervical premalignancies: The potential for reduction of the number of unnecessary biopsies. J. Biomed. Opt. 2013, 18, 017002. [Google Scholar] [CrossRef]
  20. Alerstam, E.; Svensson, T.; Andersson-Engels, S.; Spinelli, L.; Contini, D.; Mora, A.D.; Tosi, A.; Zappa, F.; Pifferi, A. Single-fiber diffuse optical time-of-flight spectroscopy. Opt. Lett. 2012, 37, 2877–2879. [Google Scholar] [CrossRef]
  21. Chang, Y.-C.; Ken, C.-F.; Hsu, C.-W.; Liu, Y.-G. Real time in vivo investigation of superoxide dynamics in zebrafish liver using a single-fiber fluorescent probe. Biomed. Opt. Express 2013, 4, 1702–1709. [Google Scholar] [CrossRef]
  22. Zlobina, N.V.; Budylin, G.S.; Tseregorodtseva, P.S.; Andreeva, V.A.; Sorokin, N.I.; Kamalov, D.M.; Strigunov, A.A.; Armaganov, A.G.; Kamalov, A.A.; Shirshin, E.A. In vivo assessment of bladder cancer with diffuse reflectance and fluorescence spectroscopy: A comparative study. Lasers Surg. Med. 2024, 56, 496–507. [Google Scholar] [CrossRef] [PubMed]
  23. Gabriëls, R.Y.; Van Heijst, L.E.; Hooghiemstra, W.T.R.; Van Der Waaij, A.M.; Kats-Ugurlu, G.; Karrenbeld, A.; Robinson, D.J.; Tenditnaya, A.; Ntziachristos, V.; Gorpas, D.; et al. Detection of Early Esophageal Neoplastic Barrett Lesions with Quantified Fluorescence Molecular Endoscopy Using Cetuximab-800CW. J. Nucl. Med. 2023, 64, 803–808. [Google Scholar] [CrossRef] [PubMed]
  24. Kanick, S.C.; Sterenborg, H.J.C.M.; Amelink, A. Empirical model of the photon path length for a single fiber reflectance spectroscopy device. Opt. Express 2009, 17, 860–871. [Google Scholar] [CrossRef] [PubMed]
  25. Diamond, K.R.; Patterson, M.S.; Farrell, T.J. Quantification of fluorophore concentration in tissue-simulating media by fluorescence measurements with a single optical fiber. Appl. Opt. 2003, 42, 2436–2442. [Google Scholar] [CrossRef]
  26. Stepp, H.; Beck, T.; Beyer, W.; Pfaller, C.; Schuppler, M.; Sroka, R.; Baumgartner, R. Measurement of fluorophore concentration in turbid media by a single optical fiber. Med. Laser Appl. 2007, 22, 23–34. [Google Scholar] [CrossRef]
  27. Hoy, C.L.; Gamm, U.A.; Sterenborg, H.J.C.M.; Robinson, D.J.; Amelink, A. Method for rapid multidiameter single-fiber reflectance and fluorescence spectroscopy through a fiber bundle. J. Biomed. Opt. 2013, 18, 107005. [Google Scholar] [CrossRef]
  28. Van Leeuwen-van Zaane, F.; Gamm, U.A.; Van Driel, P.B.A.A.; Snoeks, T.J.; De Bruijn, H.S.; Van Der Ploeg-van Den Heuvel, A.; Sterenborg, H.J.C.M.; Löwik, C.W.; Amelink, A.; Robinson, D.J. Intrinsic photosensitizer fluorescence measured using multi-diameter single-fiber spectroscopy in vivo. J. Biomed. Opt. 2014, 19, 015010. [Google Scholar] [CrossRef]
  29. Dablouk, M.O.; Buckley, K.; Eustace, D.; Jansen, M.; Bermingham, N.; Lim, C.; Kamel, M.; Mohammed, W.; O’Sullivan, M.G.J. Use of a Single-Fiber Optical Probe for the Detection of Tumor Fluorescence in High-Grade Glioma. Oper. Neurosurg. 2025, 29, 34–40. [Google Scholar] [CrossRef]
  30. Kanick, S.C.; Robinson, D.J.; Sterenborg, H.J.C.M.; Amelink, A. Semi-empirical model of the effect of scattering on single fiber fluorescence intensity measured on a turbid medium. Biomed. Opt. Express 2012, 3, 137–152. [Google Scholar] [CrossRef]
  31. Kanick, S.C.; Robinson, D.J.; Sterenborg, H.J.C.M.; Amelink, A. Extraction of intrinsic fluorescence from single fiber fluorescence measurements on a turbid medium. Opt. Lett. 2012, 37, 948–950. [Google Scholar] [CrossRef]
  32. Gamm, U.A.; Hoy, C.L.; Van Leeuwen–Van Zaane, F.; Sterenborg, H.J.C.M.; Kanick, S.C.; Robinson, D.J.; Amelink, A. Extraction of intrinsic fluorescence from single fiber fluorescence measurements on a turbid medium: Experimental validation. Biomed. Opt. Express 2014, 5, 1913–1925. [Google Scholar] [CrossRef]
  33. Savović, S.; Djordjevich, A. Calculation of the coupling coefficient in strained step index plastic optical fibers. Appl. Opt. 2008, 47, 4935–4939. [Google Scholar] [CrossRef] [PubMed]
  34. Mateo, J.; Losada, M.A.; Garcés, I.; Zubia, J. Global characterization of optical power propagation in step-index plastic optical fibers. Opt. Express 2006, 14, 9028–9035. [Google Scholar] [CrossRef] [PubMed]
  35. Simović, A.; Savović, S.; Drljača, B.; Djordjevich, A. Influence of intermediate layer on transmission characteristics of W-type optical fibers. Opt. Laser Technol. 2014, 57, 209–215. [Google Scholar] [CrossRef]
  36. Hurand, S.; Chauny, L.-A.; El-Rabii, H.; Joshi, S.; Yalin, A.P. Mode coupling and output beam quality of 100–400 μm core silica fibers. Appl. Opt. 2011, 50, 492–499. [Google Scholar] [CrossRef]
  37. Faber, D.J.; Post, A.L.; Sterenborg, H.J.C.M.; Van Leeuwen, T.G. Analytical model for diffuse reflectance in single fiber reflectance spectroscopy. Opt. Lett. 2020, 45, 2078–2081. [Google Scholar] [CrossRef]
  38. Piao, D. A new model-perspective on the threshold radius of lasing of a spherical random medium. Waves Random Complex Media 2024, 1–33. [Google Scholar] [CrossRef]
  39. Sun, T.; Piao, D.; Yu, L.; Murari, K. Diffuse photon-remission associated with single-fiber geometry may be a simple scaling of that collected over the same area when under centered-illumination. Opt. Lett. 2021, 46, 4817–4820. [Google Scholar] [CrossRef]
  40. Post, A.L.; Faber, D.J.; Sterenborg, H.J.C.M.; Van Leeuwen, T.G. Subdiffuse scattering and absorption model for single fiber reflectance spectroscopy. Biomed. Opt. Express 2020, 11, 6620–6633. [Google Scholar] [CrossRef]
  41. Post, A.L.; Faber, D.J.; Sterenborg, H.J.C.M.; Van Leeuwen, T.G. Experimental validation of a recently developed model for single-fiber reflectance spectroscopy. J. Biomed. Opt. 2021, 26, 025004. [Google Scholar] [CrossRef]
  42. Sun, T.; Piao, D. Diffuse photon remission associated with the center-illuminated-area-detection geometry: Part I, an approach to the steady-state model. Appl. Opt. 2022, 61, 9143–9153. [Google Scholar] [CrossRef]
  43. Sun, T.; Piao, D. Diffuse photon remission associated with the center-illuminated–area-detection geometry. II. Approach to the time-domain model. Appl. Opt. 2023, 62, 3880–3891. [Google Scholar] [CrossRef] [PubMed]
  44. Vitkin, E.; Turzhitsky, V.; Qiu, L.; Guo, L.; Itzkan, I.; Hanlon, E.B.; Perelman, L.T. Photon diffusion near the point-of-entry in anisotropically scattering turbid media. Nat. Commun. 2011, 2, 587. [Google Scholar] [CrossRef] [PubMed]
  45. Axelrod, D. Selective imaging of surface fluorescence with very high aperture microscope objectives. J. Biomed. Opt. 2001, 6, 6–13. [Google Scholar] [CrossRef] [PubMed]
  46. Hyde, D.E.; Farrell, T.J.; Patterson, M.S.; Wilson, B.C. A diffusion theory model of spatially resolved fluorescence from depth-dependent fluorophore concentrations. Phys. Med. Biol. 2001, 46, 369–383. [Google Scholar] [CrossRef]
  47. Haskell, R.C.; Svaasand, L.O.; Tsay, T.-T.; Feng, T.-C.; Tromberg, B.J.; McAdams, M.S. Boundary conditions for the diffusion equation in radiative transfer. J. Opt. Soc. Am. A 1994, 11, 2727–2741. [Google Scholar] [CrossRef]
  48. Sun, T.; Piao, D. Simple analytical total diffuse reflectance over a reduced-scattering-pathlength scaled dimension of [10−5, 10−1 ] from a medium with HG scattering anisotropy. Appl. Opt. 2019, 58, 9279–9289. [Google Scholar] [CrossRef]
  49. Piao, D.; Zhang, A.; Xu, G. Photon diffusion in a homogeneous medium bounded externally or internally by an infinitely long circular cylindrical applicator V Steady-state fluorescence. J. Opt. Soc. Am. A 2013, 30, 791–805. [Google Scholar] [CrossRef]
  50. Li, X.D.; O’Leary, M.A.; Boas, D.A.; Chance, B.; Yodh, A.G. Fluorescent diffuse photon density waves in homogeneous and heterogeneous turbid media: Analytic solutions and applications. Appl. Opt. 1996, 35, 3746–3758. [Google Scholar] [CrossRef]
  51. Soubret, A.; Ntziachristos, V. Fluorescence molecular tomography in the presence of background fluorescence. Phys. Med. Biol. 2006, 51, 3983–4001. [Google Scholar] [CrossRef]
  52. Aronson, R. Boundary conditions for diffusion of light. J. Opt. Soc. Am. A 1995, 12, 2532–2539. [Google Scholar] [CrossRef]
  53. Piao, D.; Patel, S. Simple empirical master–slave dual-source configuration within the diffusion approximation enhances modeling of spatially resolved diffuse reflectance at short-path and with low scattering from a semi-infinite homogeneous medium. Appl. Opt. 2017, 56, 1447–1452. [Google Scholar] [CrossRef]
  54. Abookasis, D.; Shemesh, D.; Litwin, A.; Siegelmann, H.T.; Didkovsky, E.; Ad-El, D.D. Single probe light reflectance spectroscopy and parameter spectrum feature extraction in experimental skin cancer detection and classification. J. Biophotonics 2023, 16, e202300001. [Google Scholar] [CrossRef]
  55. Gradshteyn, I.S.; Ryzhik, I.M. Table of Integrals, Series, and Products, Seventh; Academic Press: Burlington, MA, USA; ISBN 0-12-373637-4.
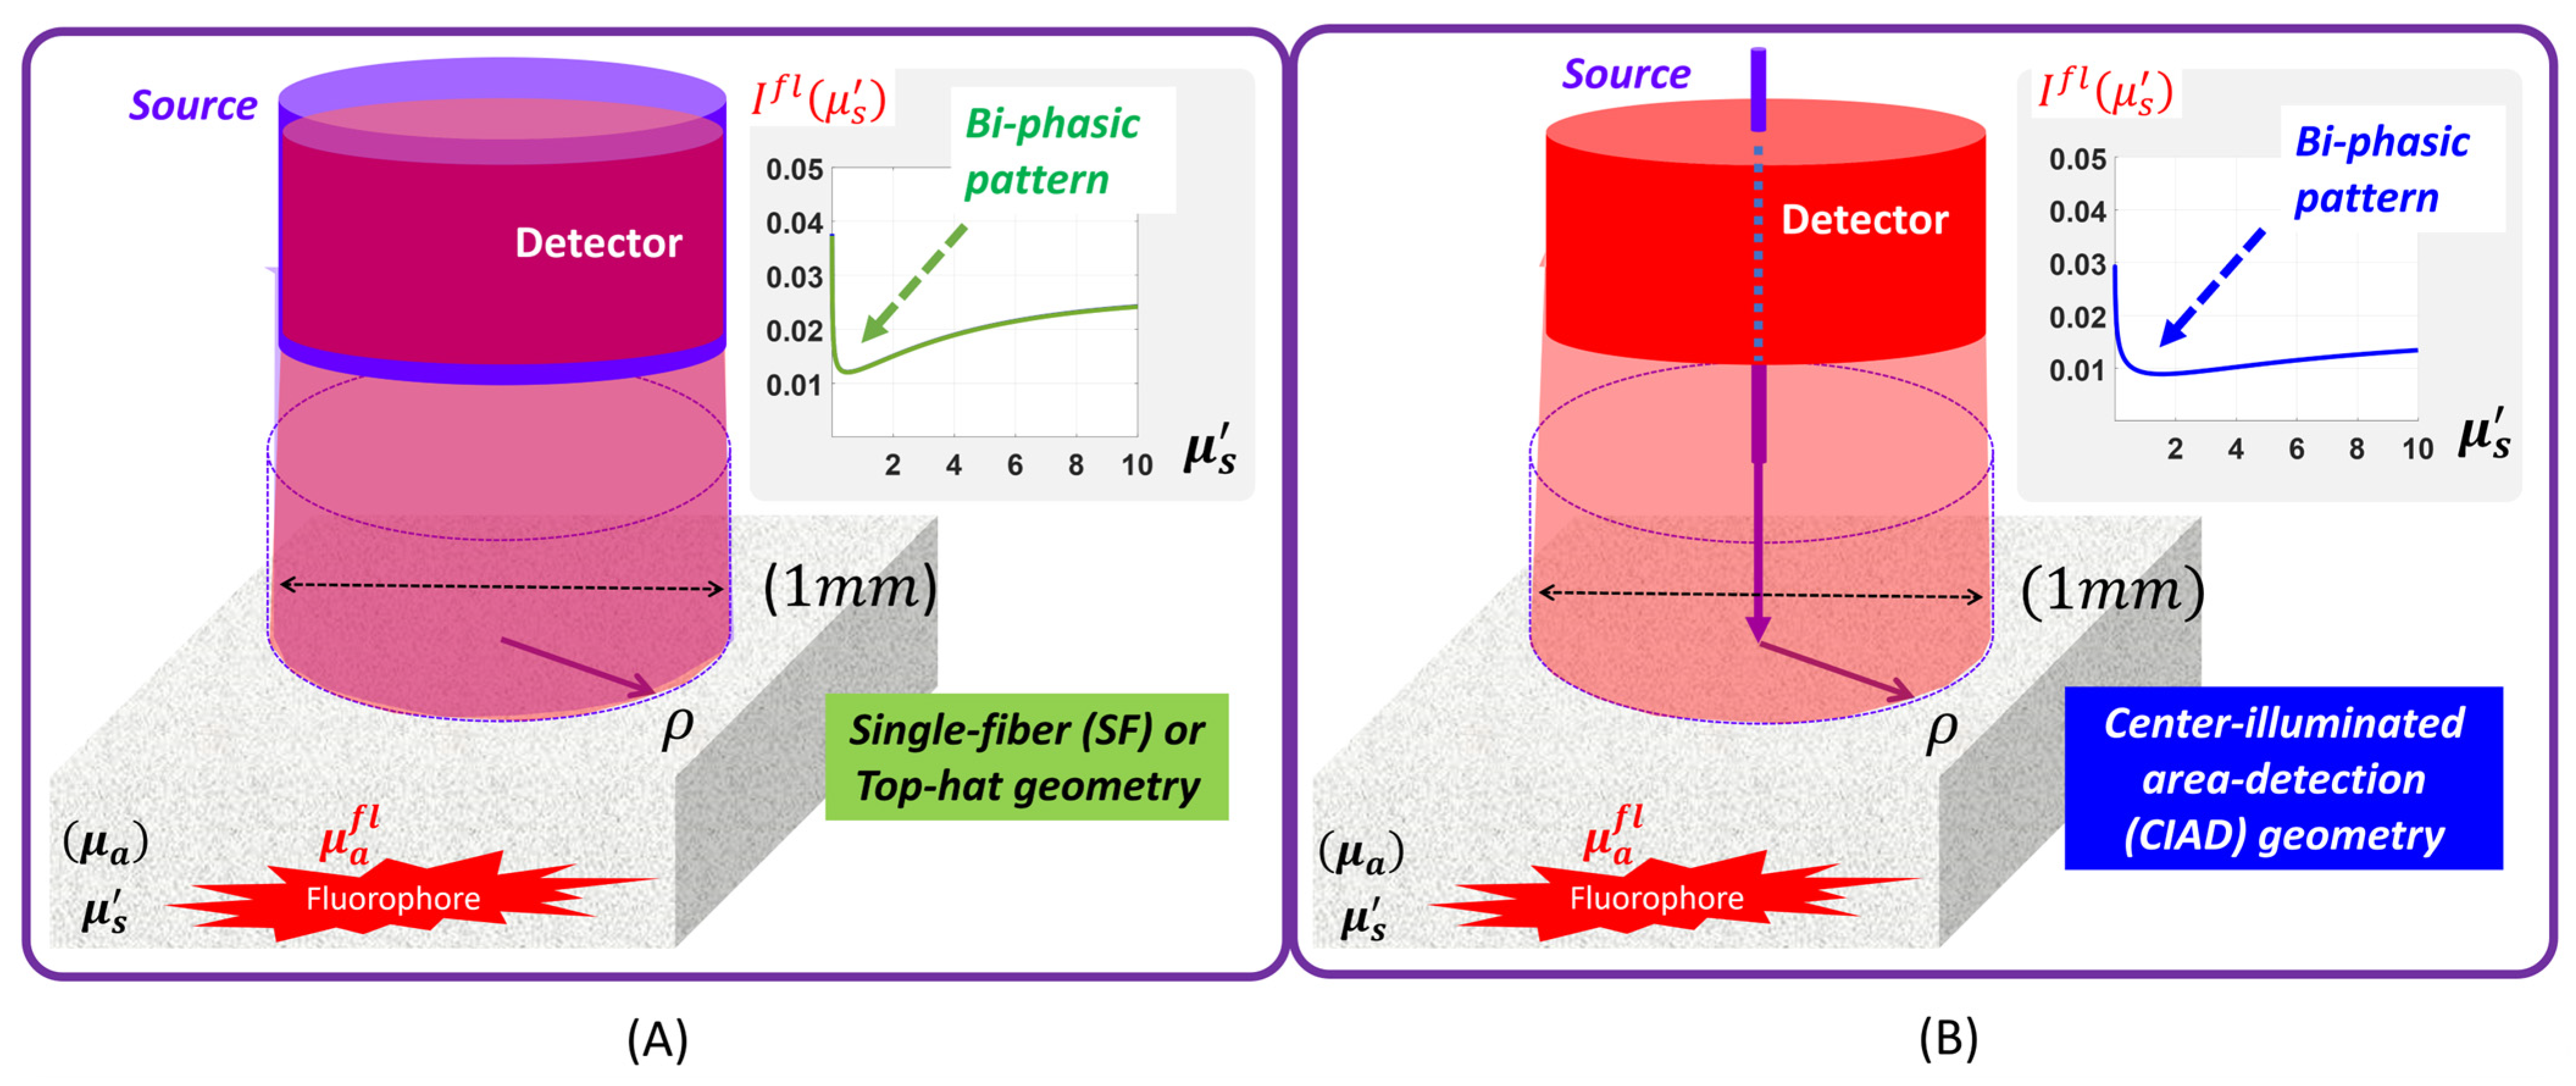
Figure 1. Difference and similarity between single-fiber (SF) geometry (A) and center-illuminated-area-detection (CIAD) geometry, given the same size for the light collection. (A) SF geometry is idealized as having the light illuminating uniformly onto the medium over the same circular area as the is collected of the diffusely reflected light. (B) CIAD geometry idealizes the case of having the light illuminating onto the medium at the center of the circular area where the diffusely reflected light is collected. In both geometries, what is detected is the fluorescence of the medium, and the insets plot a bi-phasic pattern of change in the fluorescence intensity with respect to the increase in the reduced scattering of the medium. The inset plots were plotted with the respective models.
Photonics 12 00904 g001
Figure 2. A general schematic of the geometry in polar coordinates for use in the rest of the model development. The axial direction of z ^ points downward. The model point of detection where the photon fluence rate is to be assessed is marked as r , which is positioned on an azimuthal plane crossing the origin of the polar coordinates. The model point of a fluorophore is marked as r f l . The model point of source where an isotropic illumination of light at the excitation wavelength is located is marked as r , which is aligned on the z-axis of the polar coordinates and placed at a distance of z a at the positive direction of the z-axis. A symbol of “ ” prefixing the fluorophore position vector like r f l denotes the assembly of all fluophores in the medium of interest.
Photonics 12 00904 g002
Figure 3. Decomposition of the irradiance that contributes to the fluorescence leaving the medium. The proportion of the initial irradiance interacting with fluorophores at the extreme outer layer of the medium is denoted as L b a s e . The proportion of the initial collimated irradiance that continues to propagate along the original direction and interact with fluorophores is denoted as L c o l l . The proportion of the irradiance that becomes increasingly diffused over longer transversing in the medium that interacts with fluorophores of the medium is denoted as L d i f f . The medium is sectioned to three depths: (1) the extremely outer section of a depth substantially smaller than the path length of one scattering event; (2) a deeper section than (1) that has a depth comparable to the path length of a single scattering event; (3) an even deeper section than (2) that has a depth much greater than the path length of a single scattering event and reaches the path length the photon takes to completely randomize the direction of propagation. Then, L b a s e , L c o l l , and L d i f f may be treated as corresponding to the irradiance occurring in the depth regions (1), (2), and (3).
Photonics 12 00904 g003
Figure 4. (A) Two routes to start with the same differential radially resolved fluorescence and to end at the same CIAD fluorescence. The rainbow-colored arrow represents an integration over the volumetric distribution of the fluorophore. The plain framed arrow represents an integration over the two-dimensional area distribution of the diffuse reflectance over the area of collection. (B) Two routes to start with the same differential radially resolved fluorescence to reach the same CIAD fluorescence that has considered the boundary condition. The forms to the left of the vertically aligned solid bar are associated with a boundless medium. The forms to the right of the vertically aligned solid bar are associated with a medium interfacing with air as an idealized geometry for CIAD. (C) The analytical process that combines the path of integration of (A) and the path of boundary treatment of (B).
Photonics 12 00904 g004
Figure 5. (A) A general schematic of the geometry in polar coordinates for the medium having a point fluorophore. (B) The medium differs from that of (A) in that there is a uniform distribution of the fluorophores over the entire domain, rather than at a model point. (C) The medium represented here is the same as that of (B), but the fluorescence will be counted over a circular area versus that over a point in (B). (D) The medium is semi-infinite compared to the infinite one of (C).
Photonics 12 00904 g005
Figure 6. The patterns of fluorescence in response to dimensionless scattering, projected for the CIAD geometry (solid lines) in comparison to that for the SF geometry (dashed lines). (AD) correspond to the absorption coefficients of, respectively, 0.001, 0.01, 0.1, and 1.0 mm−1. The dimensionless scattering as the abscissa covers a range of 4 orders of magnitude from 0.001 to 10. The dashed and solid lines of equal thickness correspond to the same diameter of the area of collection. The diameters of collection are 0.2 to 1.0 mm at an increment of 0.2 mm, corresponding to the lines of the thinnest to the thickest. (E) is a scatter plot of the projection for the CIAD geometry versus that for the SF geometry, with the diagonal line indicating a perfect match. The plots corresponding to four different values of the absorption coefficients are displayed in different colors and marker sizes.
Photonics 12 00904 g006
Figure 7. The bi-phasic turning points of fluorescence projected for CIAD and SF. (A) The bi-phasic turning points reduce as the size of collection increases. Greater marker size represents greater absorption coefficient, among the 4 values evaluated spanning three orders of magnitude. (B) Scatter plot of the projection for the CIAD geometry versus that for the SF geometry, with the diagonal line indicating a perfect match. The plots corresponding to four different values of the absorption coefficients are displayed in different colors and marker sizes.
Photonics 12 00904 g007
Figure 8. The patterns of fluorescence in response to dimensionless absorption, projected for the CIAD geometry (solid lines) in comparison to that for the SF geometry (dashed lines). (AD) correspond to the reduced scattering coefficients of, respectively, 0.01, 0.1, 1.0, and 10.0 mm−1. The dimensionless absorption as the abscissa covers a range of 4 orders of magnitude from 0.001 to 10. The dashed and solid lines of equal thickness correspond to the same diameter of the area of collection. The diameters of collection are 0.2 to 1.0 mm at an increment of 0.2 mm, corresponding to the thinnest to thickest lines.
Photonics 12 00904 g008
Disclaimer/Publisher’s Note: The statements, opinions and data contained in all publications are solely those of the individual author(s) and contributor(s) and not of MDPI and/or the editor(s). MDPI and/or the editor(s) disclaim responsibility for any injury to people or property resulting from any ideas, methods, instructions or products referred to in the content.