1. Introduction
Circular Airy beams (CABs)—radially symmetric optical fields characterized by Airy intensity profiles—have garnered substantial research attention due to their “abrupt auto-focusing property”, which enables intensity concentration by several orders of magnitude immediately before reaching the focal point [
1,
2,
3,
4,
5,
6]. This unique characteristic makes CABs valuable for biomedical interventions [
7] and nonlinear optical processes [
5]. CABs further facilitate microparticle trapping or guidance [
8,
9] and generate specialized beams including optical “bottles”, “needles”, “cages”, “dark channels” [
10], and spatiotemporal “bullets” [
5]. CABs carrying optical vortices (OVs), termed circular Airy vortex beams (CAVBs), combine the “abrupt autofocusing” property with the characteristic of vortex beams carrying orbital angular momentum (OAM). They have also attracted considerable attention in recent years. Following Davis’s [
11] pioneering theoretical and experimental CAVB investigation, Lu et al. [
12] demonstrated that OVs significantly enhance the abrupt autofocusing intensity while creating hollow-core distributions. Deng et al. [
13] established tunability of focal length and intensity through distribution factors, topological charge, and beam dimensions. Our recent work confirms that left-circularly polarized CABs with on-axis OVs generate both left- and right-handed circularly polarized vortex components in crystals [
14]. In 2022, Liu Qiang and colleagues proposed and generated a type of structured light that is based on CAVBs and satisfies the mathematical form of SU(2) coherent states. This structured light exhibits strong auto-focusing ability, along with radial and angular self-acceleration, and 3D inhomogeneous rotation characteristics [
15]. Recently, by applying a cubic phase to traditional skyrmion lattices, Yijie Shen et al. experimentally demonstrated, for the first time, accelerating skyrmion lattices conveyed by Airy structured light, which are characterized by topologically stable skyrmion textures that self-accelerate along parabolic trajectories [
16].
Uniaxial crystals, as anisotropic optical media, play a pivotal role in theoretical investigations and light-field modulation. Their capacity to regulate light intensity distributions and polarization states enables diverse novel optical phenomena. Ciattoni et al. established a paraxial propagation model for uniaxial crystals using Fourier transforms (FT), demonstrating that specific circularly polarized beams propagating along the crystal’s optical axis generate optical vortices with reversed circular polarization and a topological charge shift of +2 [
17,
18,
19]. Subsequent studies extended this framework to explore propagation characteristics of Airy beams [
20], Airy vortex beams [
21], Airy-Gaussian beams [
22], Airy-Gaussian vortex beams [
23], and CABs [
24]. Zhu et al. [
25] and Liu et al. [
26] demonstrated pronounced photonic spin Hall effects in uniaxial crystals, while Liu et al. [
27] further showed their ability to tailor the OAM spectrum of quadratic-power-exponent-phase vortex beams, achieving flat-superimposed OAM states. Earlier research primarily focused on interactions between left- and right-handed circularly polarized components (LHCP/RHCP), analyzing their coupling and interconversion during propagation. In a paradigm shift, Liu et al. in 2023 investigated the evolution of R-pol and A-pol components [
28]. They observed that CAVBs propagating along the optical axis undergo polarization separation, forming distinct focal points; however, this mechanism lacked dynamic adjustability.
On the other hand, the linear EO effect represents a powerful mechanism for optical field modulation, with significant applications spanning traditional optical communication, optical micromanipulation, and quantum information processing. In 2012, Zhu et al. demonstrated a method for generating and controlling multi-ring vector modes with LHCP and RHCP using the linear EO effect in a single SBN crystal [
29]. Our prior research theoretically and numerically confirmed that EO coupling effectively manipulates the abrupt autofocusing in CABs, and generates OAM states with topological charge
l = 2 [
30]. In 2024, Zhu et al. [
31] reported a novel optical Stern–Gerlach effect in EO crystals, enabling high-speed, EO-tunable polarizing beam splitters (PBSs) compatible with arbitrary orthogonal polarization states. Subsequently, Zhu et al. (2025) revealed a photonic spin Hall effect mediated by spatially engineered Pancharatnam–Berry (PB) phases in X-cut LiTaO
3 crystals, where voltage-reconfigurable PB phases induce dynamically tunable spin-dependent momentum–space separations [
32]. In this work, we utilize the linear EO effect in SBN crystals to achieve rapid and precise control over R-pol and A-pol components of CAVBs.
2. Theory
To initiate our analysis, consider a monochromatic paraxial field
propagating along the optical axis of a uniaxial crystal. Starting from Maxwell’s equations and incorporating the second-order nonlinear polarization intensity induced by the linear EO effect, we derive the wave equation for the complex amplitude as follows:
where
is the wavenumber in vacuum,
is the angular frequency of light,
is the relative dielectric tensor,
is the magnetic susceptibility,
denotes the nonlinear polarization associated with the LEO effect,
is the external electric field, and
is the second-order susceptibility tensor of the linear EO effect. For uniaxial electro-optic SBN crystals, the non-vanishing electro-optic coefficients are
,
, and
(in pm/V), and the refractive indices are
and
at λ = 632.8 nm [
33]. To utilize the largest electro-optic coefficient, we apply the external electric field along the z-axis of the crystal.
When an external electric field
is applied along the z-axis, the linear EO effect in the SBN crystal modulates the refractive index ellipsoid through the EO coefficients
and
. The SBN crystal has a symmetry of 4 mm, and its EO coefficients are in the following form:
Now, considering the case when the external electric field
is along the c-axis of the crystal (z-axis), the refractive index ellipsoid equation can be rewritten as follows:
From Equation (3), one can see that the coefficients in the x and y directions change equally due to
,while the coefficient in the z direction changes independently due to
. The absence of mixed terms in the equation indicates that the principal axis directions of the refractive index ellipsoid remain consistent with the original coordinate axes, thus preserving the uniaxial symmetry of the crystal. Incorporating the electro-optic effect into the dielectric tensor, the modified dielectric tensor remains a symmetric matrix:
where
and
Therefore, the birefringence of the uniaxial crystal under linear EO effect becomes the following:
As can be seen from Equation (7), when a positive electric field is applied, , the crystal remains a negative crystal, and its birefringence (anisotropy) increases with the magnitude of the electric field. When a negative electric field is applied, the birefringence of the crystal decreases. Specifically, when , we have , and under this condition, the crystal becomes an isotropic medium. However, if the magnitude of the negative electric field continues to increase, it will cause , and the crystal will transform into a positive crystal.
With the modified dielectric tensor
, Equation (1) can be rewritten accordingly:
To analyze circularly polarized (CP) incident fields, we introduce two complex unit vectors,
and
corresponding to LHCP and RHCP. Following the same approach as in [
17], the two circular polarization components in a uniaxial crystal can be obtained as follows:
where
Here,
,
, and
represents the two-dimensional (2D) FT of the initial transverse field distribution
. Equations (10) and (11) can be understood from the angular spectrum theory of plane wave, where
and
are the propagation functions of
and
, respectively. Notably, the propagation function of
contains
, indicating the presence of vortices with a topological charge number of ±2 here. This result is consistent with previous reports [
19]. From Equations (5) to (11), the transverse field distribution at any plane can be determined using the FT of the incident field
, i.e.,
. For a crystal with length L, the two circularly polarized components that propagate in free space after exiting the crystal can be expressed as follows [
34]:
where
with
. Through coordinate transformation, the R-pol component
and A-pol component
can be easily obtained [
28]:
Combining Equations (9)–(14), we can obtain the R-pol and A-pol field distributions inside and outside the crystal.
3. Numerical Results
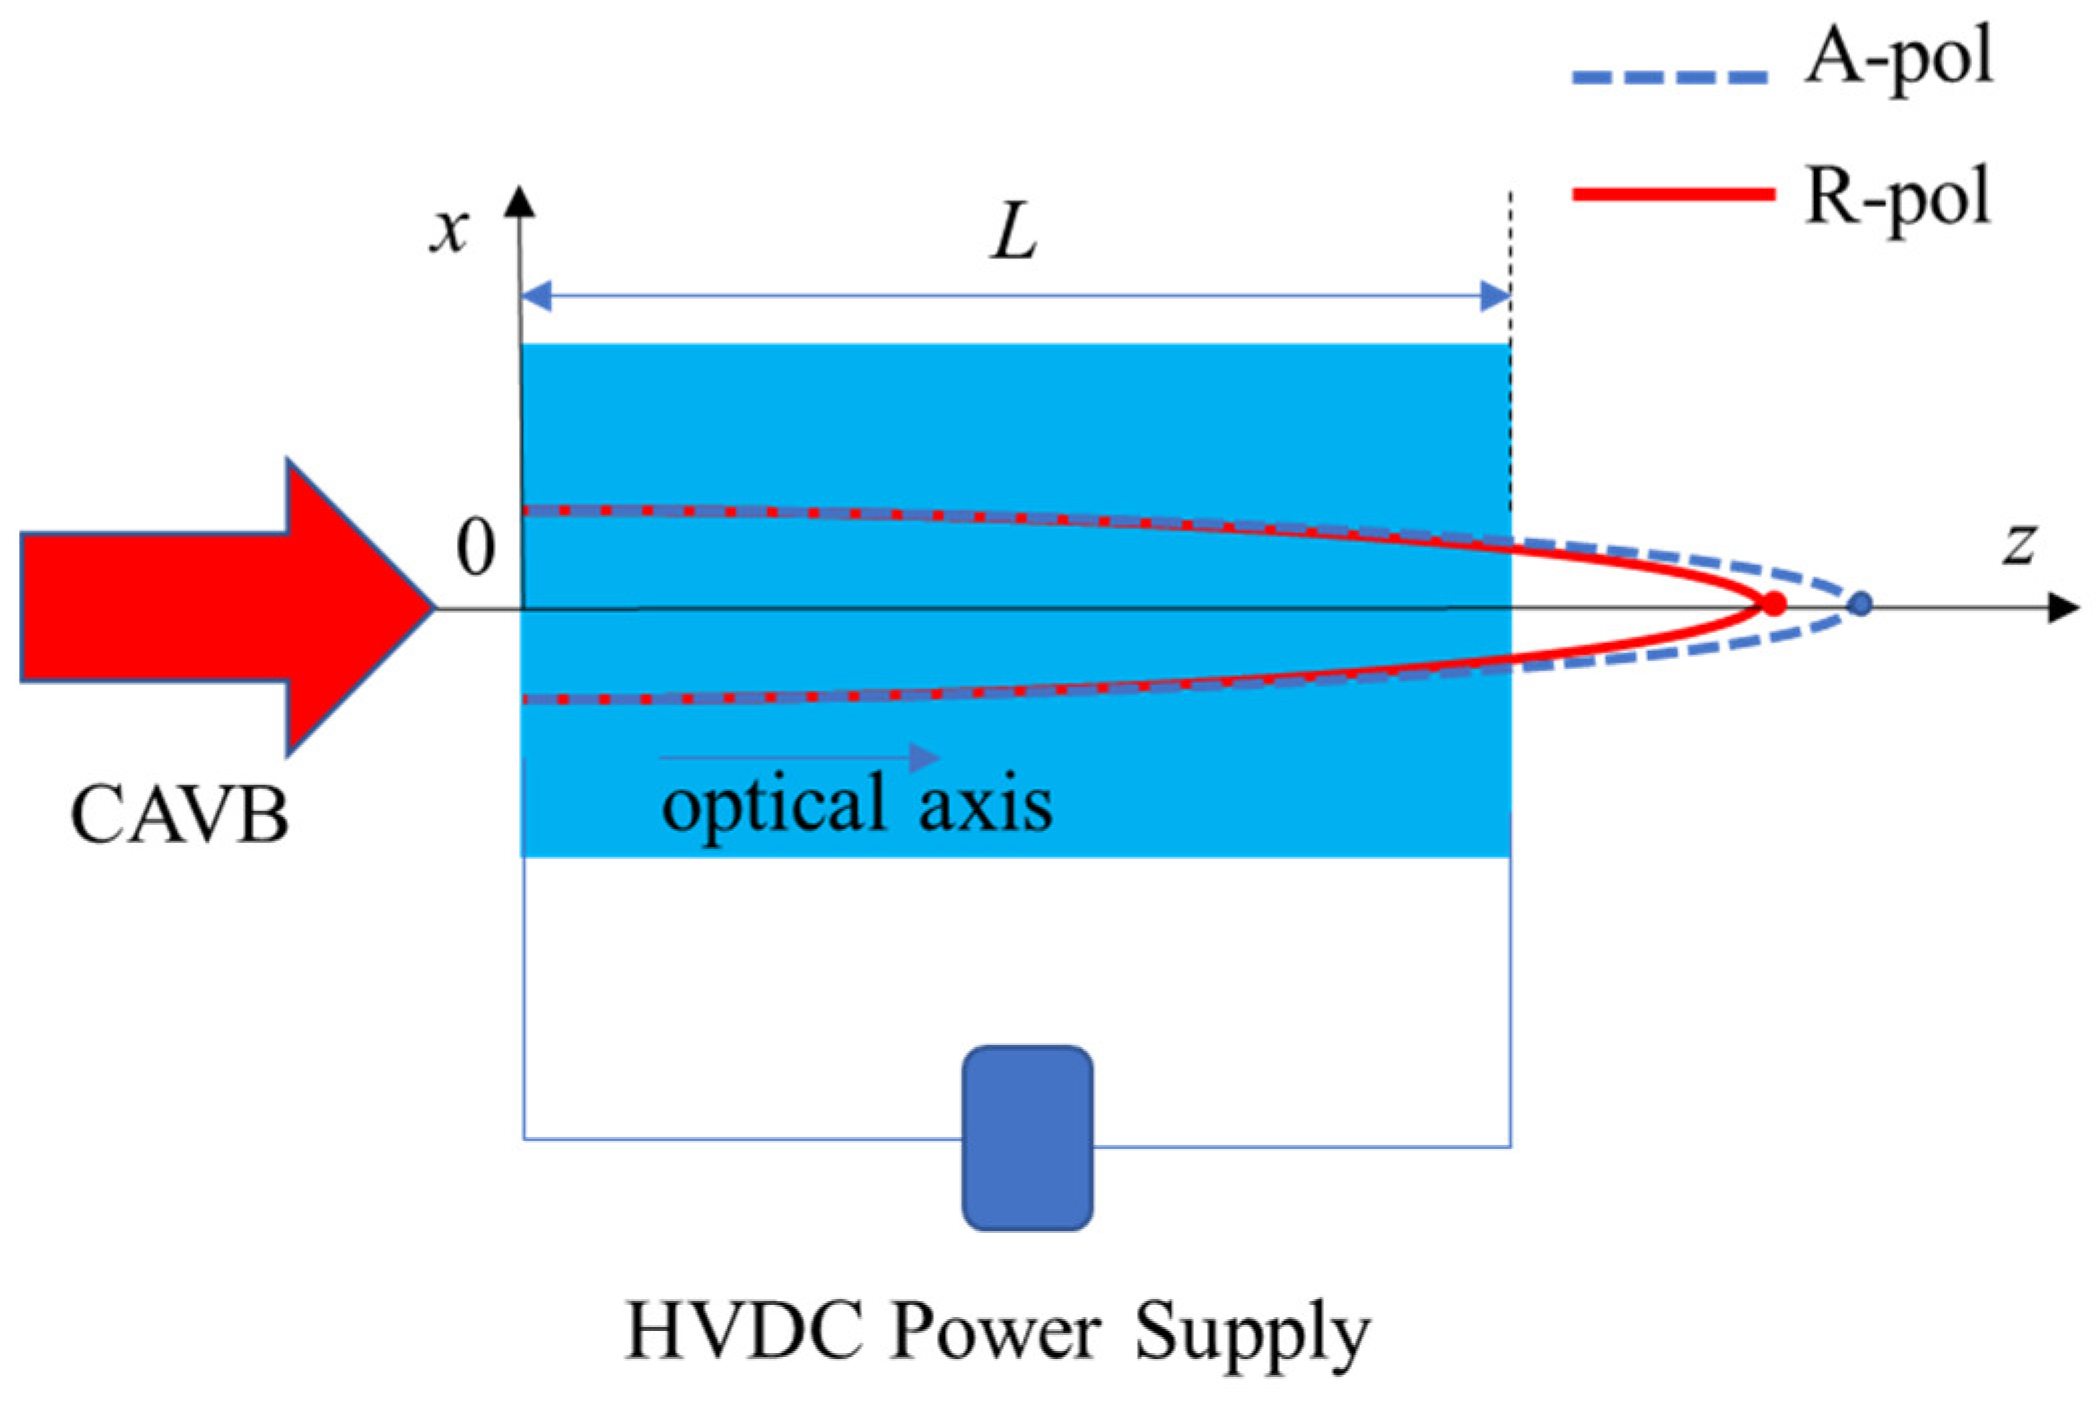
A schematic diagram of controlling separation of R-pol and A-pol components is shown in
Figure 1, in which the blue areas represent uniaxial crystals of length
L = 30 mm, a High-Voltage Direct Current (HVDC) power supply is applied along z-axis of the crystal, and the red lines and the blue dotted lines represent the propagation trajectory of the R-pol component and the A-pol component, respectively.
The CAVB used in this study is an LHCP vortex beam with topological charge
, described by the following:
where
is a constant, while
,
,
and
stand for the Airy function, radial distance, radially scaled coefficient, and decay parameter, respectively. Since the incident beam has only the LHCP component, its Fourier spectrum distribution only includes
; i.e.,
. Equation (9) then becomes
It can be seen from Equations (10), (11), and (16) that the LHCP component in the crystal carries the same vortex as the incident light beam, while the RHCP component has a vortex with a topological charge number of 2 superimposed on it. In our numerical study, we choose , ,, , and the crystal length is .
Unlike Reference 28, numerical calculation methods are employed herein to conduct simulations. The following is a description of the simulation methodology: First, the Fourier spectral distribution of the incident light, , is obtained by directly performing a 2D FT on Equation (15). Subsequently, according to Equations (10) and (11), the functions and can be obtained by multiplying by the corresponding propagation function and then performing an 2D inverse FT (IFT). Finally, the complex amplitude distributions of the LHCP and RHCP components within the crystal are obtained from Equation (16). For the free space propagation stage, simulations are carried out in line with Equations (12) and (13), using a methodology analogous to that applied to the crystal. Specifically, we first perform a 2D FT on the optical field at the exit face of the crystal to obtain . Then, by multiplying by the propagation function in free space and performing an inverse 2D FT, we can obtain . Finally, the complex amplitude distributions of the LHCP and RHCP components in free space are derived from Equation (12). Furthermore, whether in the crystal or in free space, we can obtain the complex amplitude distributions of the R-pol component and A-pol component through Equation (14). MATLAB R2023a is used for the simulations, where 2D FT and 2D IFT are implemented utilizing the fast Fourier algorithms built into the software.
According to the quantum theory of solids, the optical dielectric impermeability tensor depends on the charge distribution within a crystal [
33]. The application of an electric field causes the redistribution of bond charges and may lead to slight deformation of the ionic lattice. The net effect of these changes is a variation in the optical dielectric impermeability tensor, which is known as the electro-optic effect [
33]. Jiang et al. calculated the electro-optic coefficients of two ferroelectric oxides, Pb(Zr,Ti)O
3 and BaTiO
3, at the atomic scale using first-principles methods [
35]. They investigated the electro-optic effects of these two materials by varying the applied electric field (ranging from 0 to 10
8 V/m), fitted the linear and quadratic electro-optic coefficients, and found that these electro-optic coefficients do not change with the magnitude of the electric field. Therefore, in our simulations, the EO coefficients
and
of the SBN crystal are set as constant values. The introduction of additives can significantly enhance the breakdown strength of SBN. For example, Liu et al. studied MgO-modified SBN, whose breakdown strength can reach 22.6 kV/mm [
36]. Therefore, in our simulations, the applied electric field is set within the safe range of −15 kV/mm to 15 kV/mm.
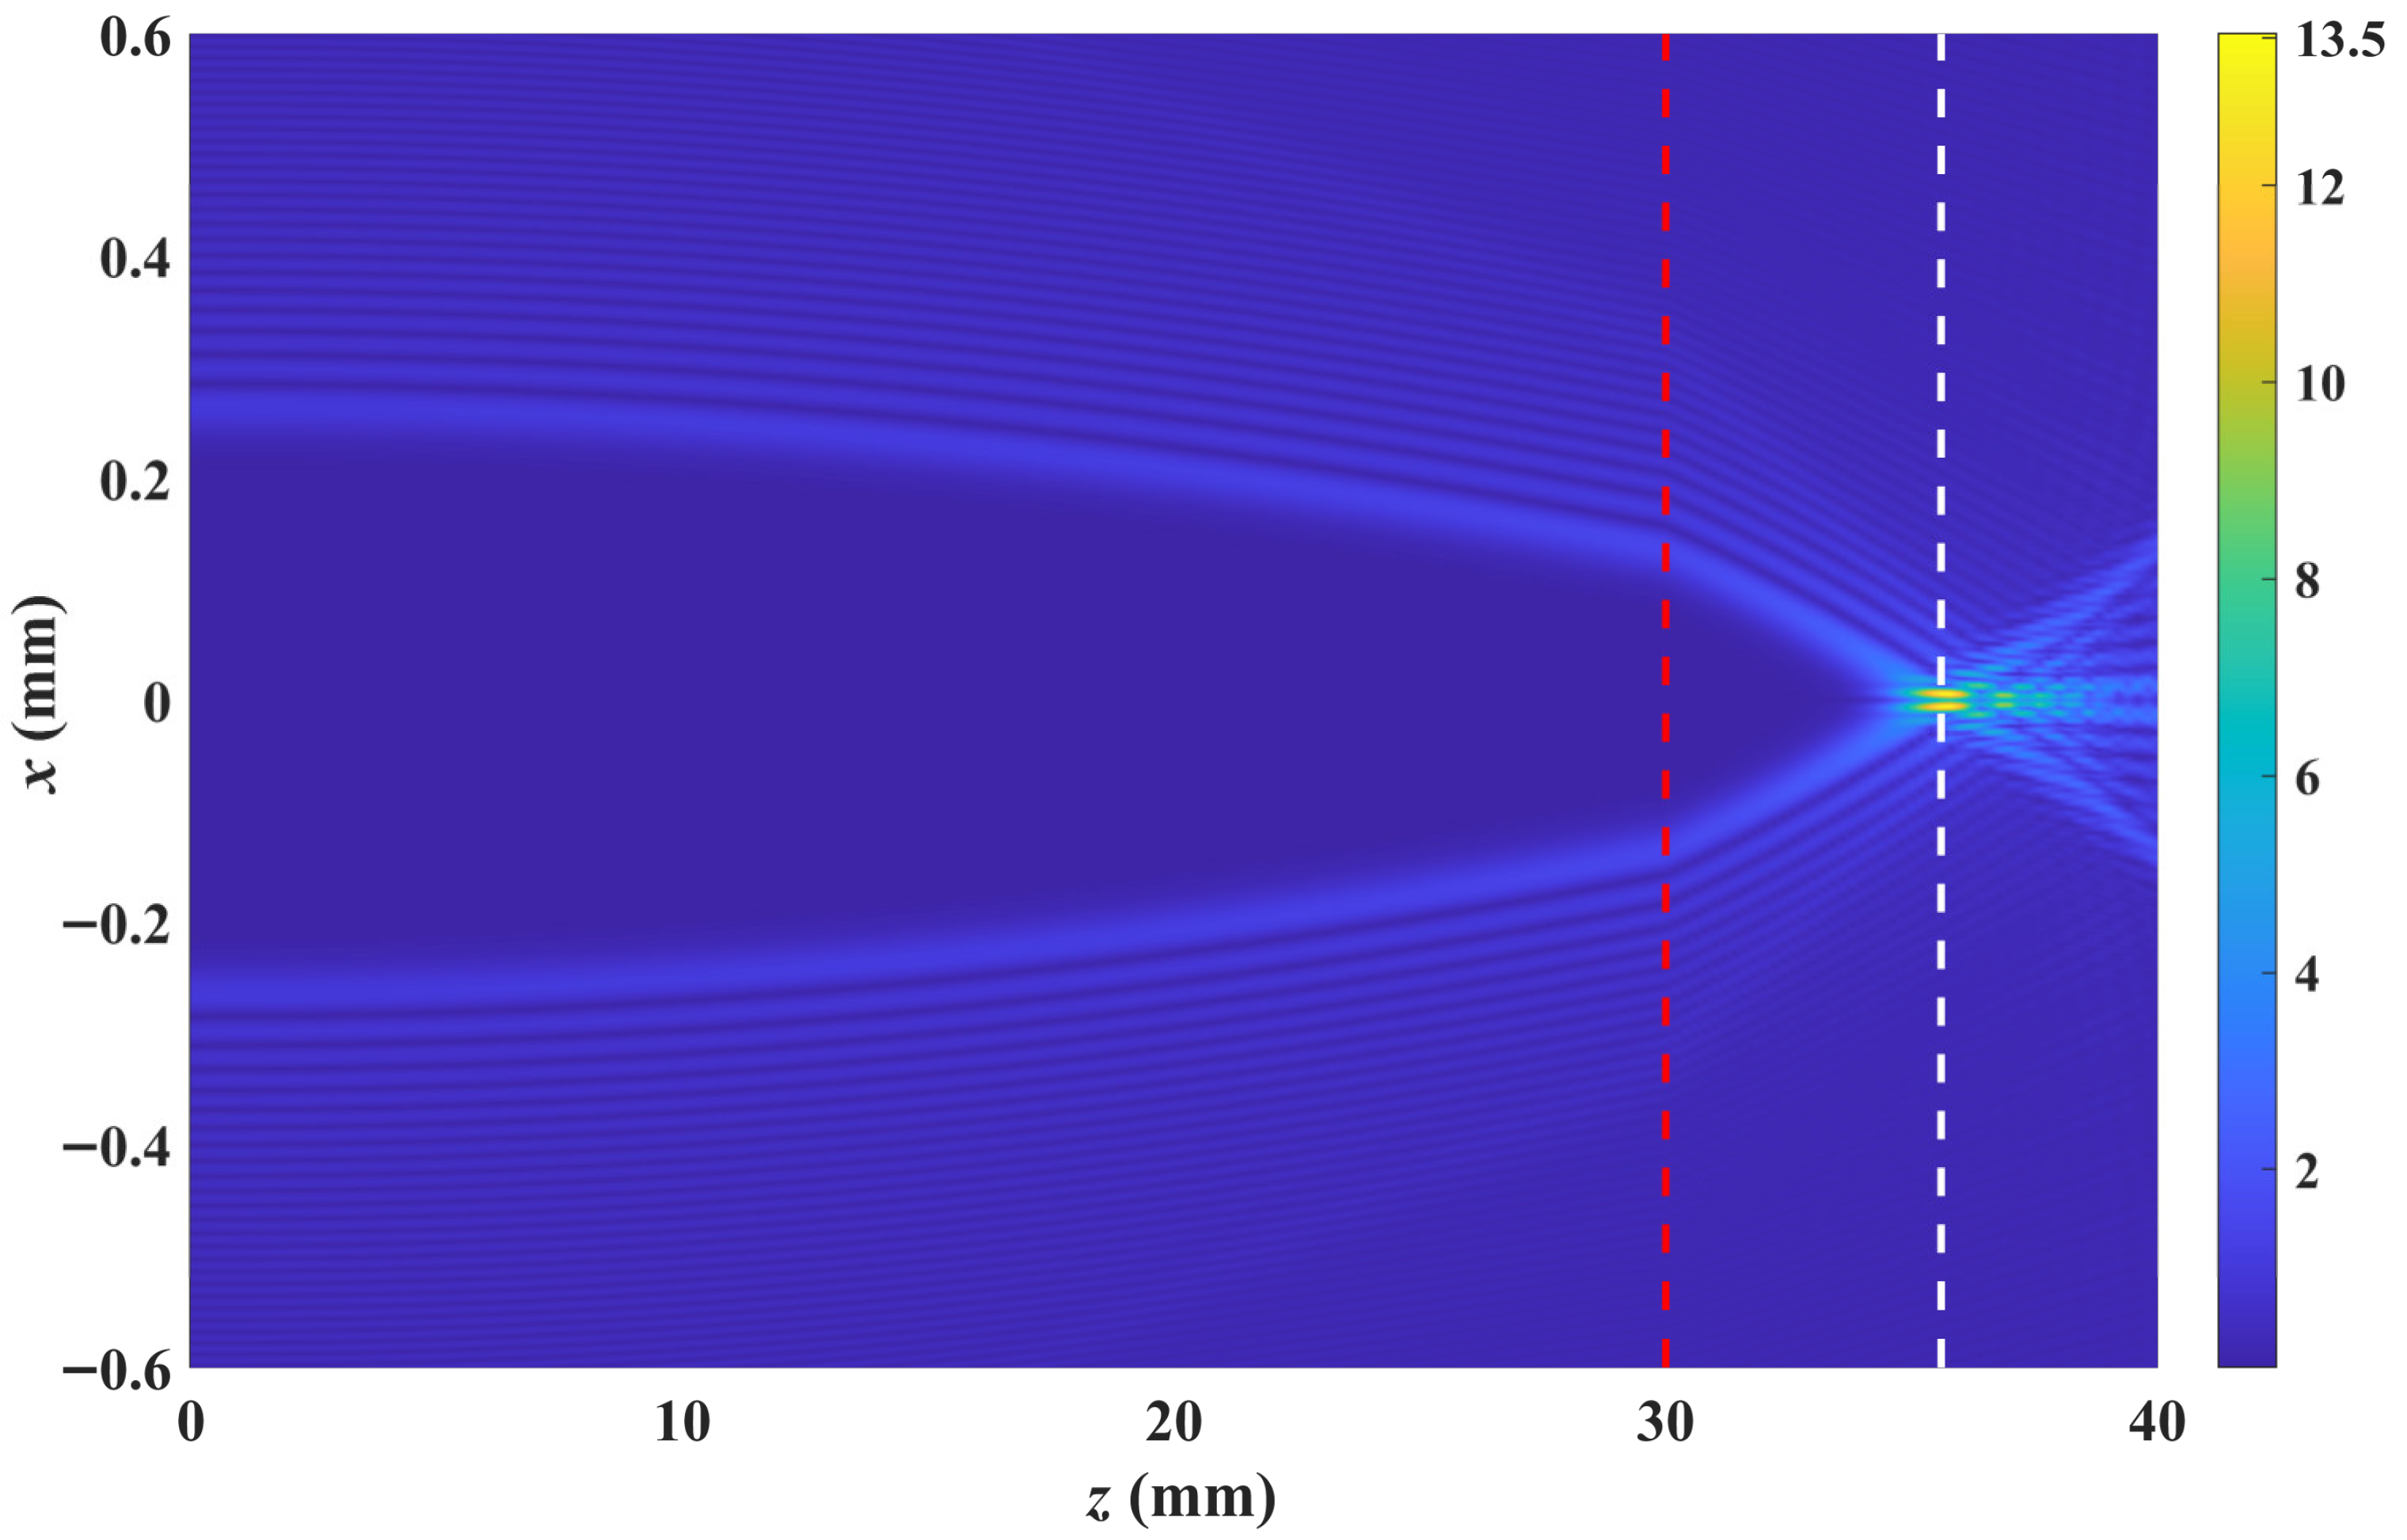
First, we investigate the evolution of the light beam in the absence of an applied electric field; the result is shown in
Figure 2. To observe the changes in intensity during propagation, we use the normalized intensity
, which is defined as
, where
is the maximum intensity of the incident light field distribution, and
is the intensity at any position. Since the light field before the focus is extremely weak, we plot the square root of the normalized intensity distribution in
Figure 2 so that the light field can be seen clearly during the whole propagation. Similarly, we also adopt this plotting method in the following same cases. The figure shows that light in both polarization states focuses around
without spatial separation, owing to SBN’s relatively low birefringence (
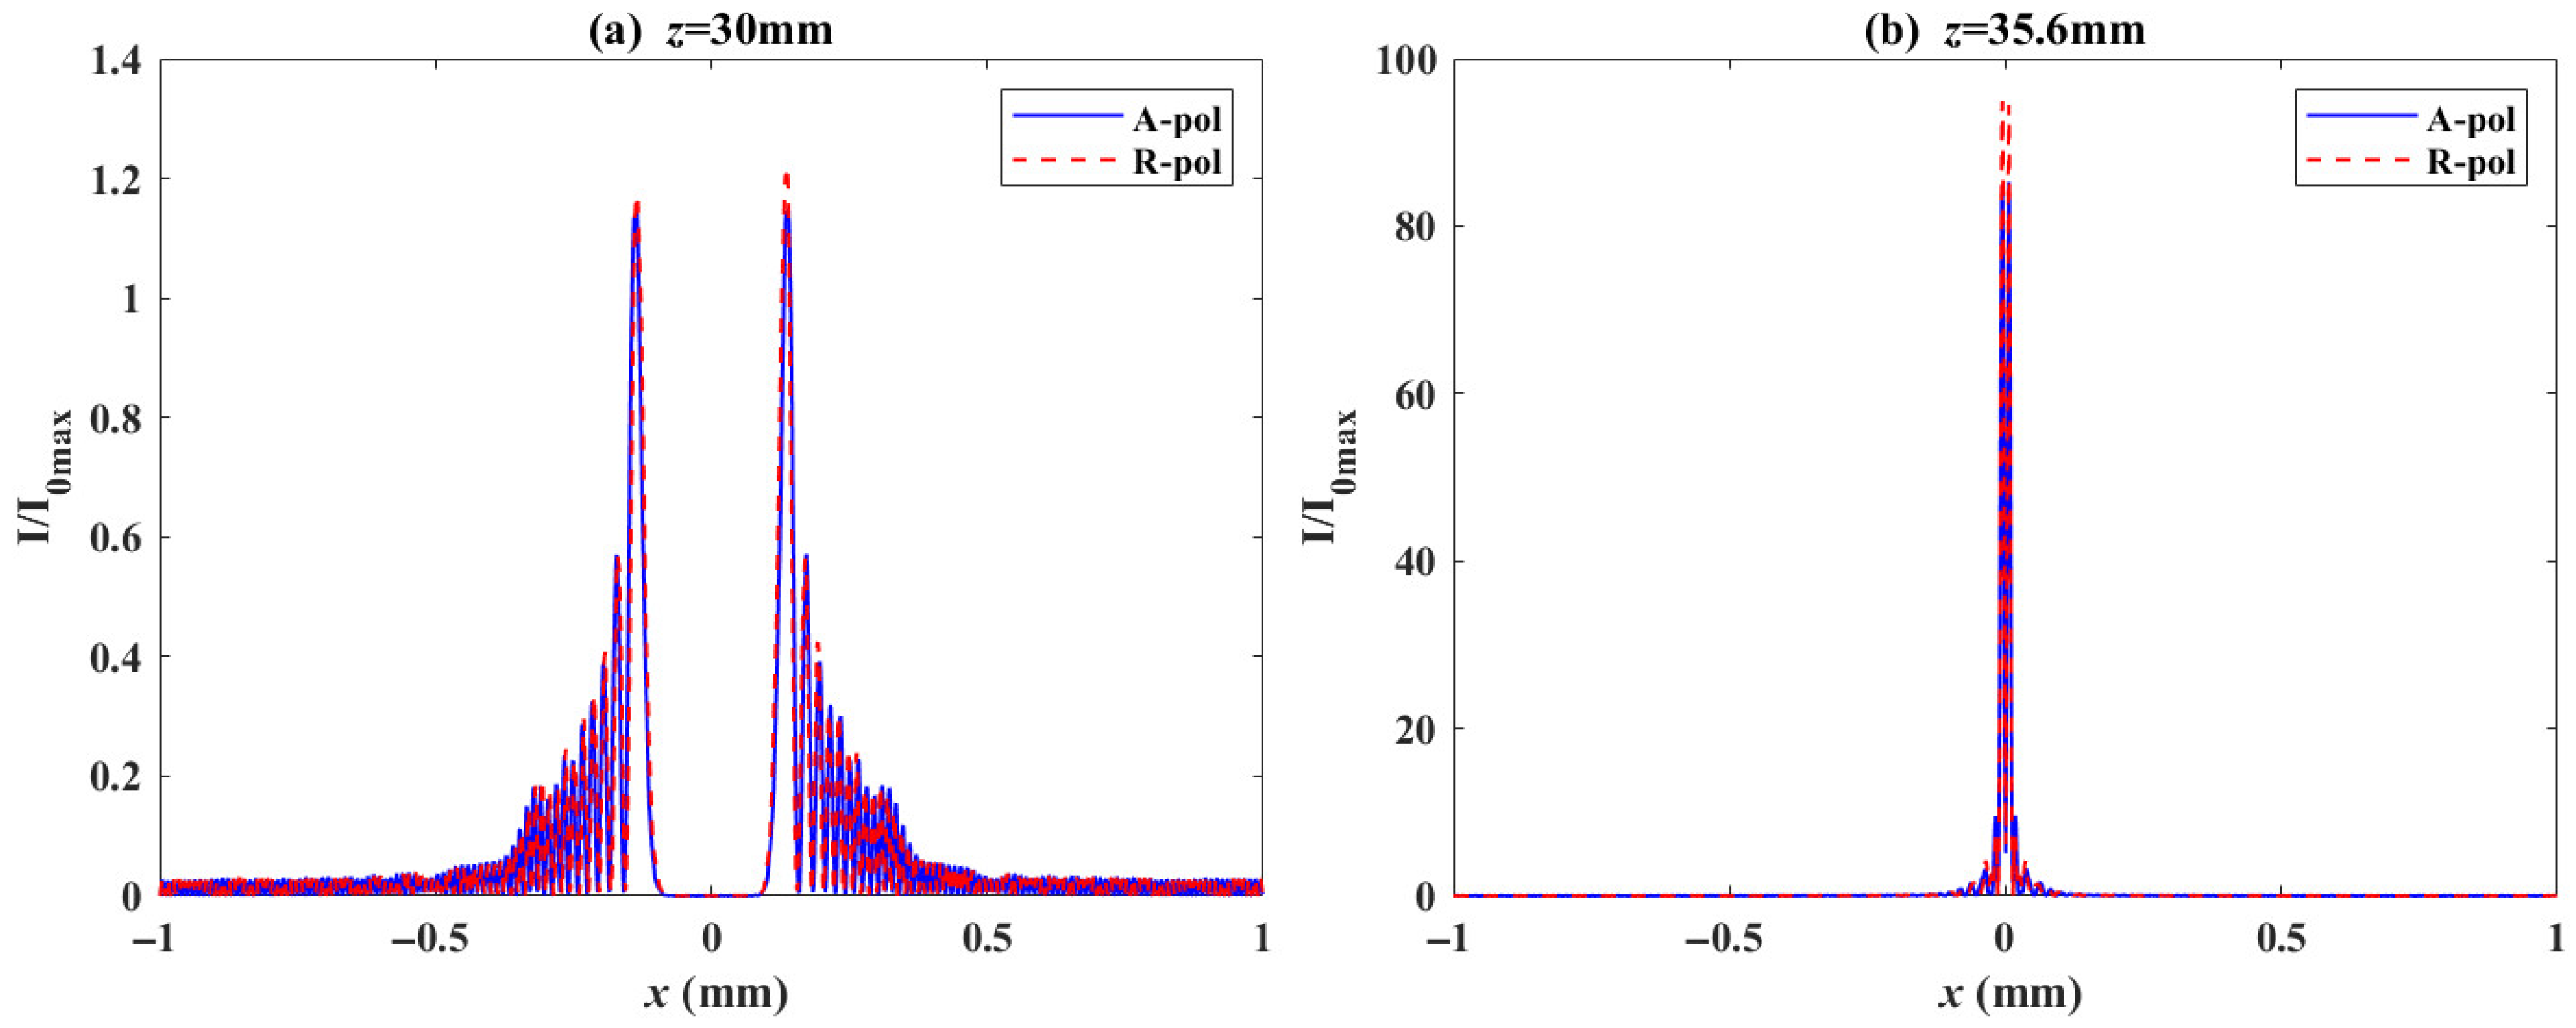
). To observe the proportion of the R-pol and A-pol components, we plotted the normalized intensity distributions of these two components at the exit face of the crystal (
) and the focal point (
), as shown in
Figure 3. As can be seen from
Figure 3, the two components account for a comparable proportion, whether at the crystal’s exit face or the focal point. Further, we plotted the intensity distributions and polarization distributions of the light at the exit face of the crystal and near the focal point, as shown in
Figure 4. As can be seen from
Figure 3b, the light field at the focal point exhibits non-uniform elliptical polarization due to the overlap of the two components.
Next, we apply an external electric field of
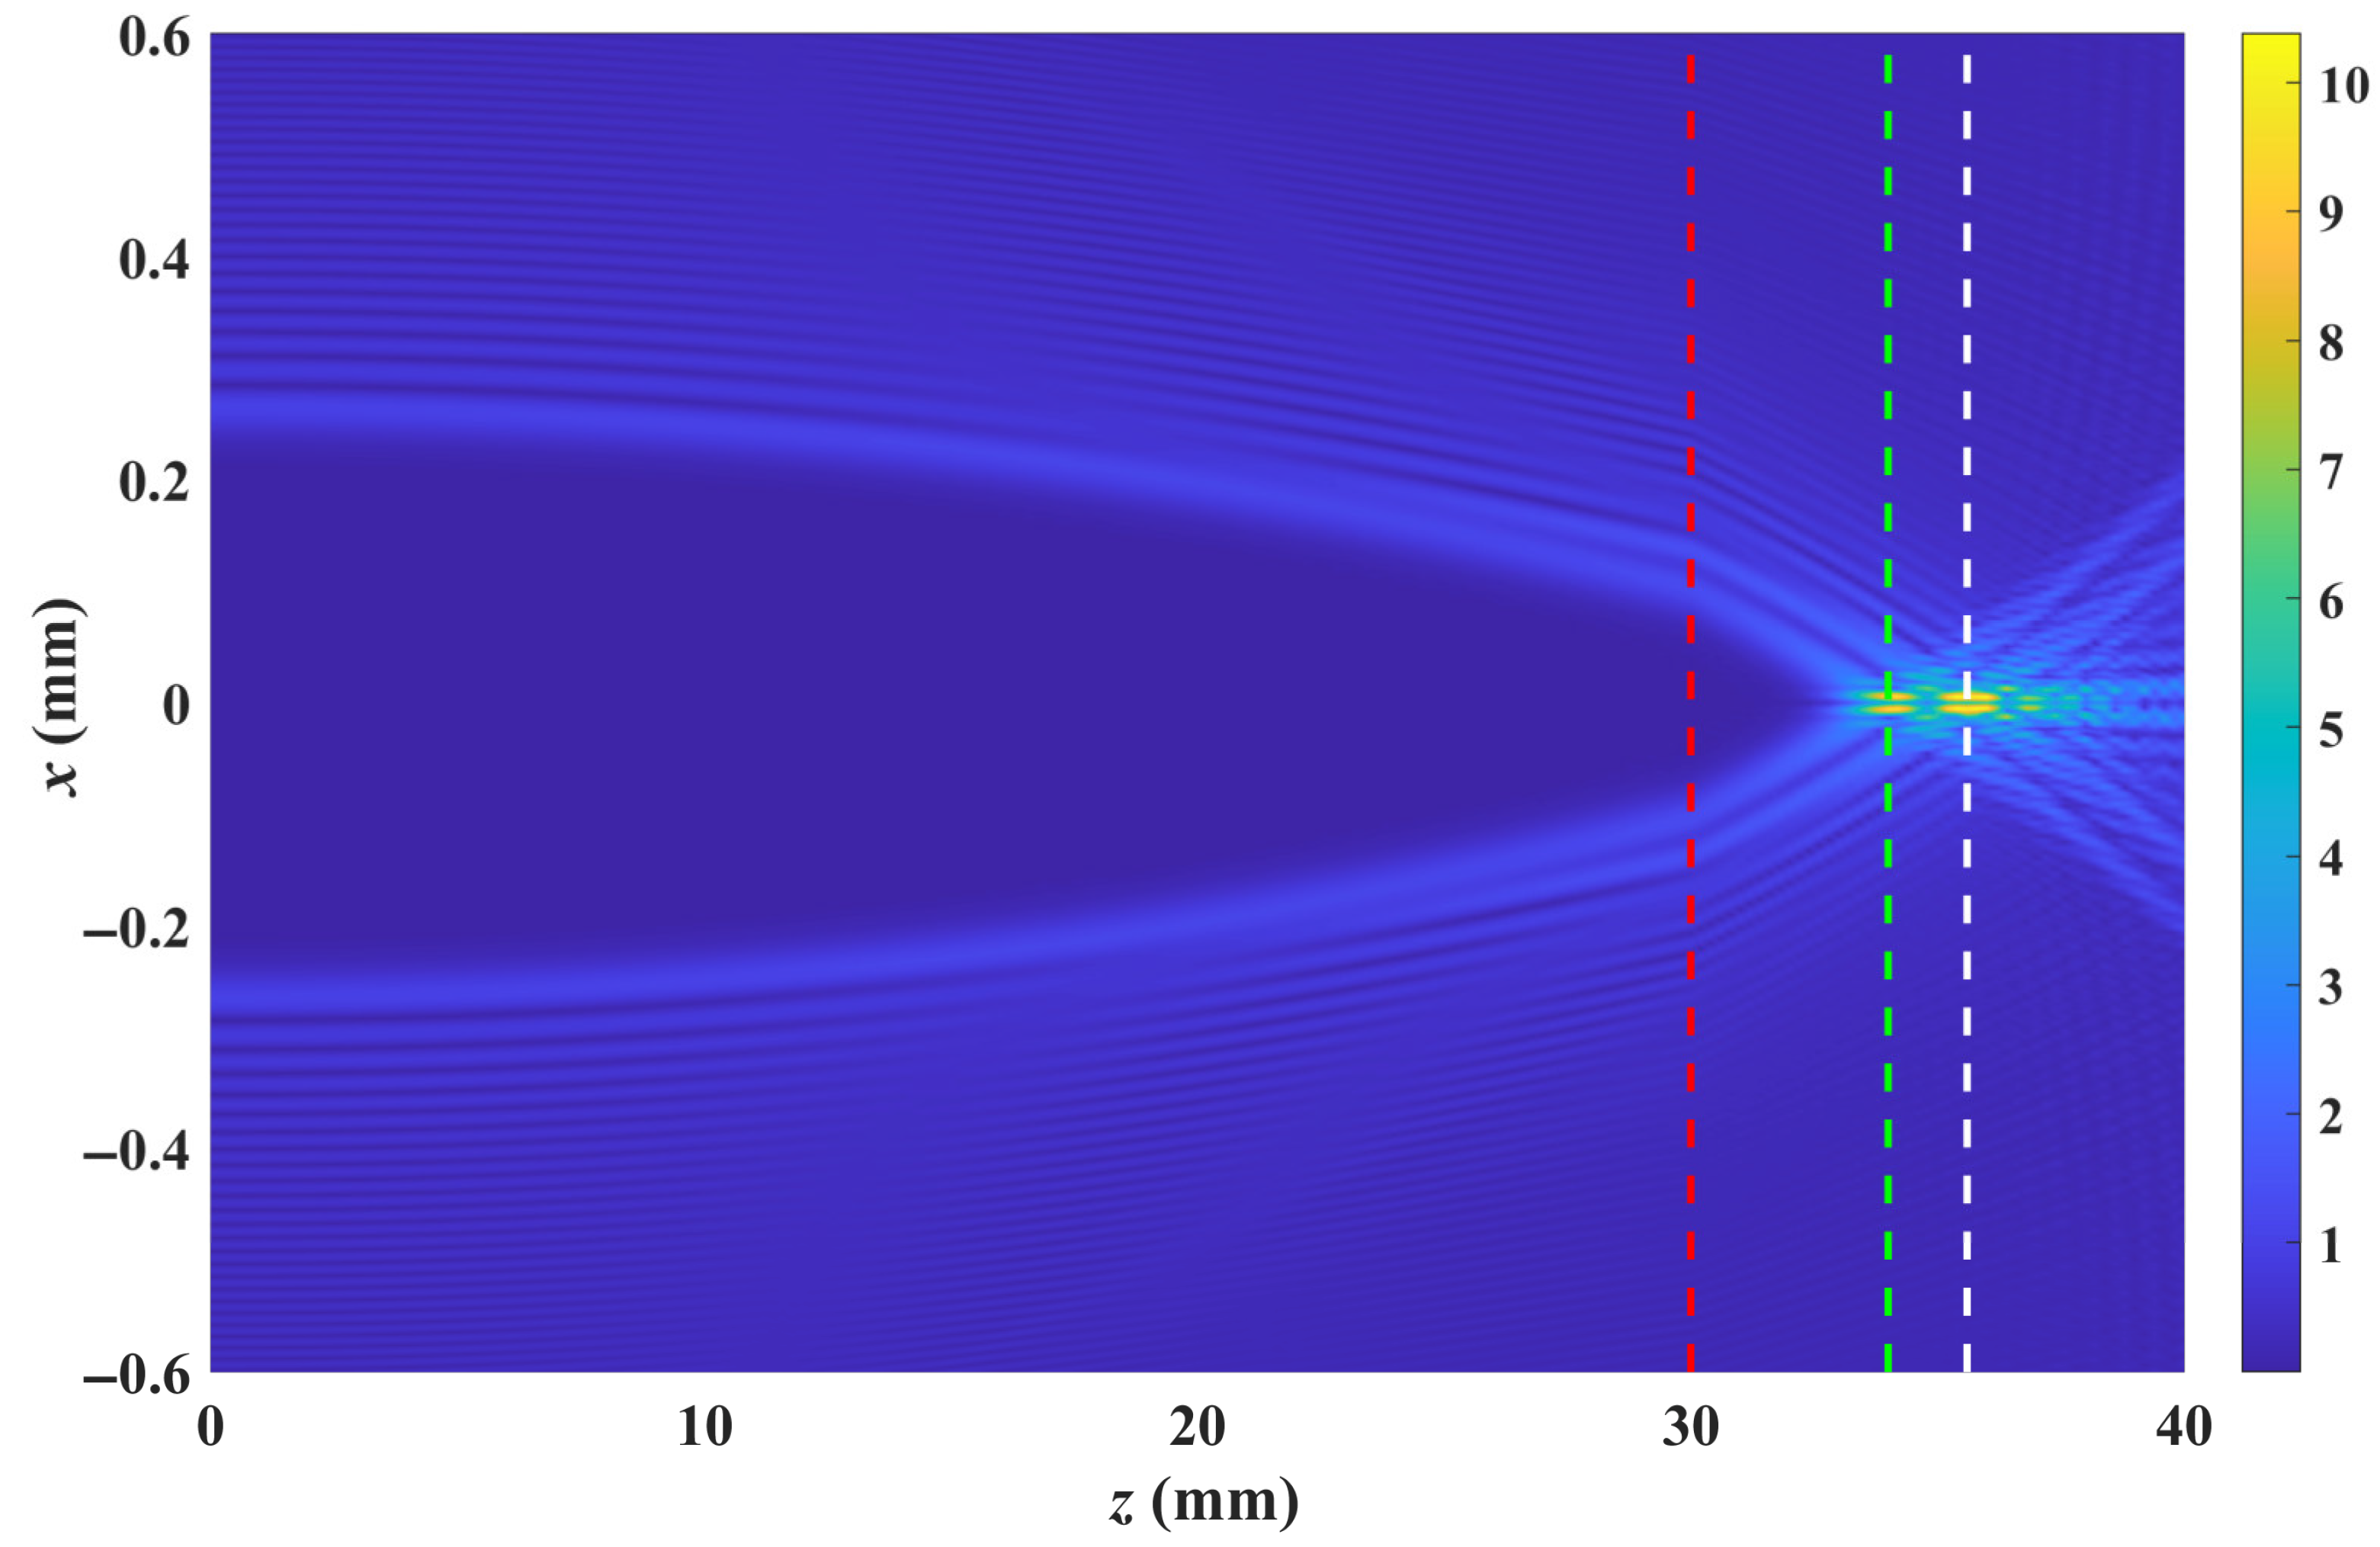
along the z-axis of the crystal. The evolution of the light beam is shown in
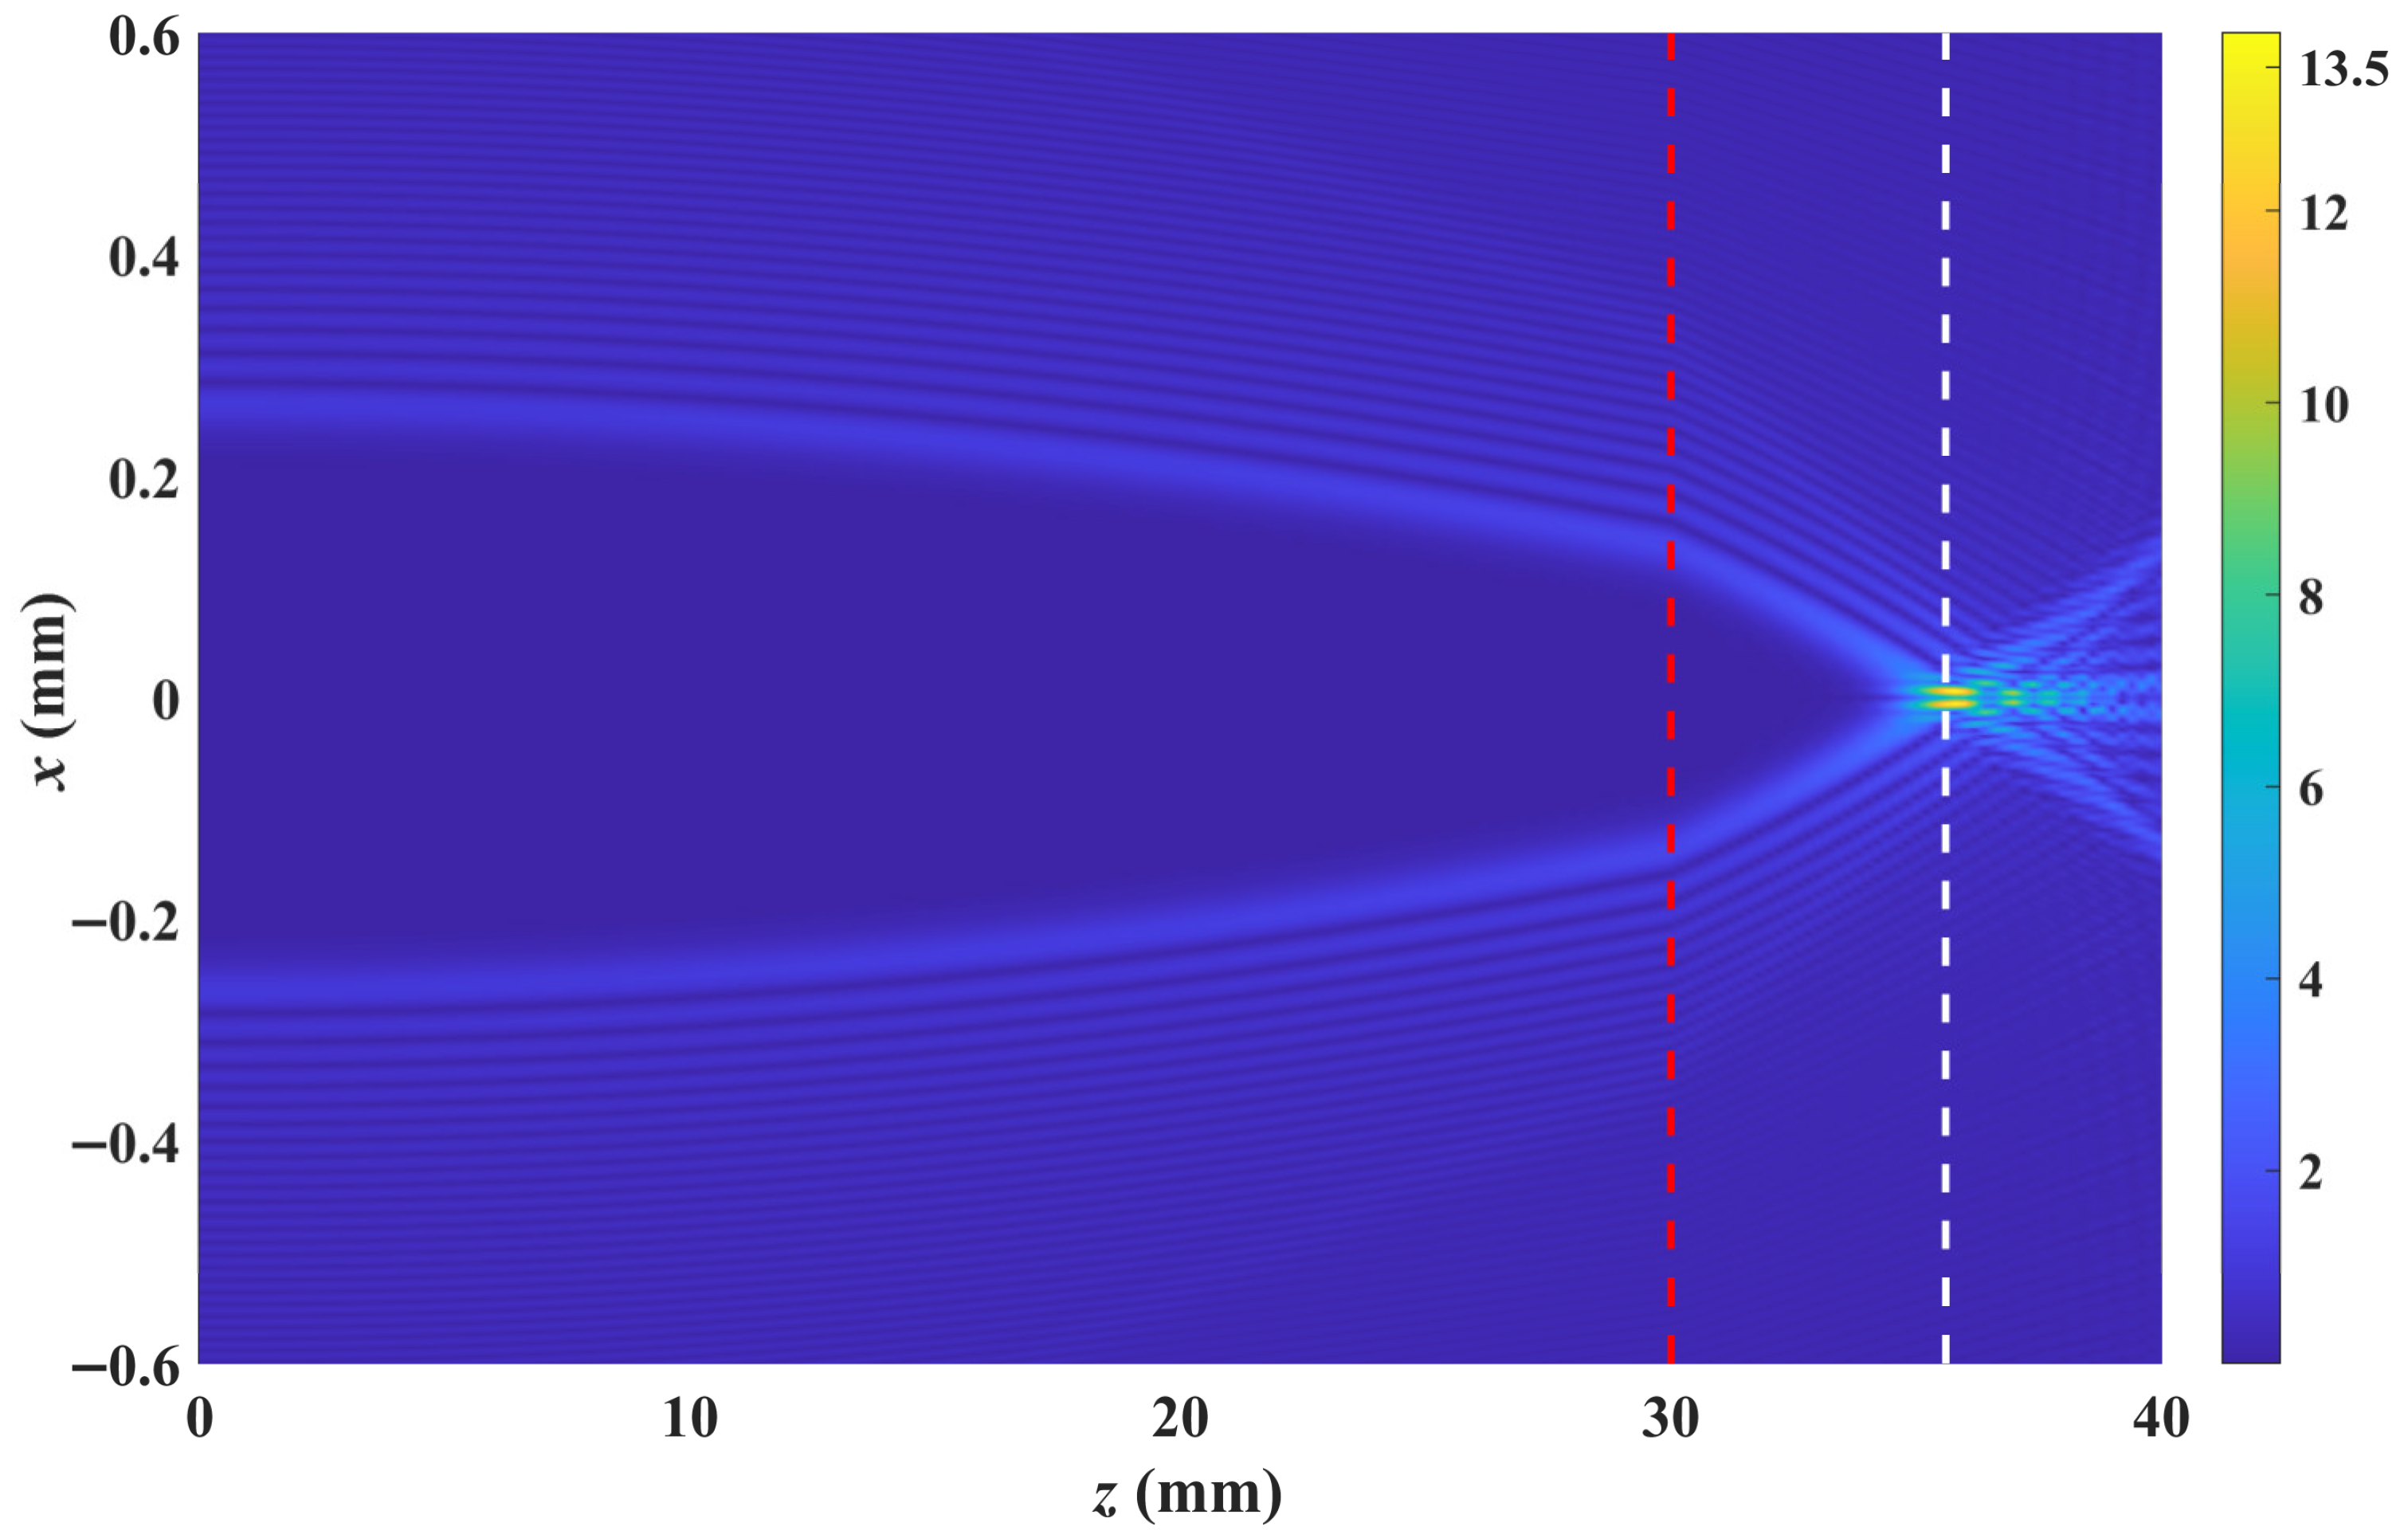
Figure 5. As clearly shown in
Figure 5, after the light beam exits the crystal, it focuses at two positions of 34.0 mm and 35.6 mm, achieving a focal separation of 1.4 mm. These two focusing actions are completed by the R-pol and A-pol components of the beam, respectively. We plotted the normalized intensity distributions of the two components at the exit face of the crystal (
), and the first focal point
and the second focal point
, as shown in
Figure 6. As can be seen from
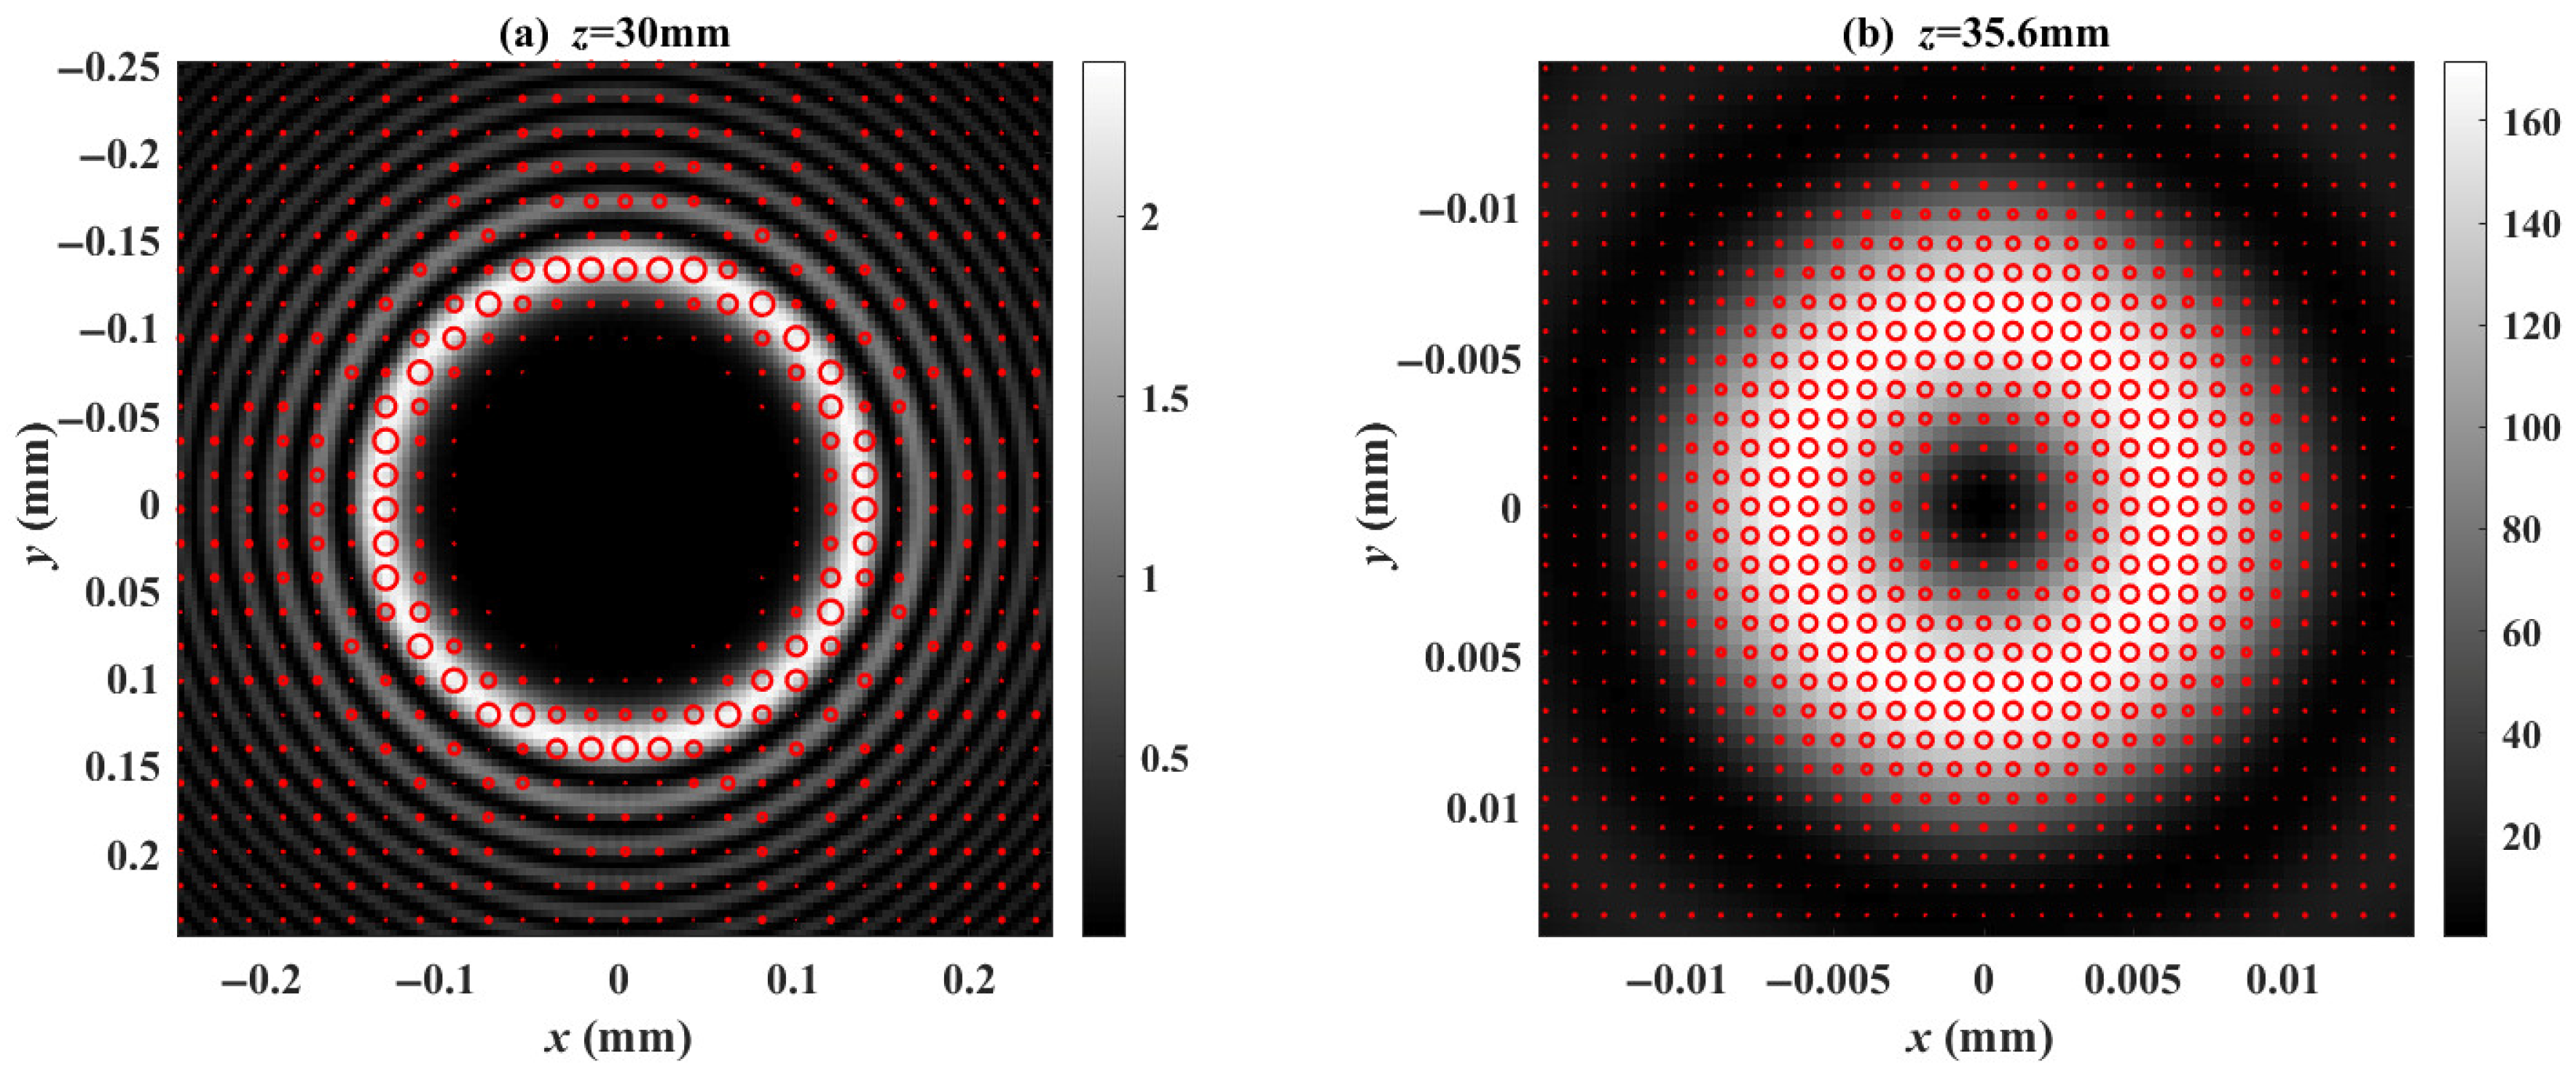
Figure 6, no separation for the two components is achieved at the exit surface. Near the first focal point, the intensity of the R-pol is significantly stronger than that of the A-pol. More importantly, since the A-pol has not yet focused, a high-purity R-pol light beam can be obtained within a finite transverse region. We plotted the intensity distribution and polarization distribution at
,
and
, which are shown in
Figure 7. From
Figure 7a, it can be observed that the beam distribution exhibits a ring-like pattern. As the R-pol component focuses earlier, the inner ring corresponds to an R-pol component, while the outer ring exhibits an elliptical polarization distribution. The outer ring exhibits elliptical polarization because it has both R-pol and A-pol components simultaneously, and there is a phase difference between these two components. At the focal point, we confined the observation area to a 30-micron window.
Figure 7b clearly demonstrates that the focal spot corresponds to the R-pol component. However, as seen in
Figure 7c, at the second focal point, the focal spot is not entirely formed by the A-pol component due to the slight influence of the R-pol component.
As mentioned in
Section 2, when the applied electric field is
, the crystal becomes an isotropic medium.
Figure 8 and
Figure 9 illustrate beam evolution behavior and the polarization distributions at the crystal exit surface and focal point under this condition. As shown in
Figure 8, the beam exhibits only one focal point.
Figure 9 reveals that both at the crystal exit surface and the focal point, the polarization state of the beam remains identical to the incident light, maintaining a uniform left-handed circularly polarized light.
Finally, we increase the magnitude of the applied electric field to
, where the principal refractive index of the extraordinary light (e-light) exceeds that of the ordinary light (o-light), i.e.,
, transforming the crystal into a positive uniaxial medium. Similarly, we investigate the beam evolution, as well as the intensity and polarization distributions at the crystal exit surface and the two focal points. The results are depicted in
Figure 10,
Figure 11 and
Figure 12. As shown in
Figure 10, two focal points emerge during beam propagation at 35.6 mm and 37.0 mm, respectively. Similarly to the case of
, the two focal points are also separated by 1.4 mm.
Figure 11 indicates that the first focal point is formed by the A-pol component, while the second focal point originates from the R-pol component—this is the exact inverse of the results in
Figure 6. Notably,
Figure 12b clearly demonstrates that the polarization distribution at the first focal point is dominated by the A-pol component.
