Article

Comparative Study of Raman Laser Generation Techniques in Cold Atomic Gravimeters

1
College of Electrical Engineering, Naval University of Engineering, Wuhan 430033, China
2
College of Ordnance Engineering, Naval University of Engineering, Wuhan 430033, China
*
Authors to whom correspondence should be addressed.
Photonics 2025, 12(8), 807; https://doi.org/10.3390/photonics12080807
Submission received: 17 June 2025 / Revised: 30 July 2025 / Accepted: 9 August 2025 / Published: 11 August 2025

Abstract

In the measurement process of cold atomic gravimeters, Raman laser plays an important role both in the state preparation stage and in the atomic interference stage. This paper discusses Raman laser generation techniques. The optical phase-locked loop (OPLL) method and the electro-optical modulation (EOM) method are compared from a theoretical point of view. An OPLL system and an EOM system were constructed separately. The two schemes were tested in terms of linewidth, phase noise and long-term stability. The experimental results were analyzed and discussed. Based on the results, recommendations are given for the selection of Raman laser schemes under different scenarios.

1. Introduction

Cold atomic gravimeters have developed rapidly in recent years. They have been widely applied in marine gravity measurements [1,2], gravity field mapping [3,4] and fundamental physics research [5,6]. The measurement process of atomic gravimeters can be divided into four main stages: cold atom preparation, state preparation, atom interference and detection state. Raman lasers play a crucial role in both the state preparation and atomic interference stages. In the state preparation stage, Raman pulses are used to invert the atomic states. A π pulse is applied to achieve this inversion. Subsequently, a blow-off laser is used to prepare a pure, magnetically insensitive atomic state. In the interference stage, a π/2-π-π/2 pulse sequence is applied to split, reflect and recombine the atoms. During this process, the atoms accumulate phase information related to gravity. This occurs because of differences in their evolutionary trajectories. By analyzing the resulting interference fringes, the gravity measurement can be obtained [7].
Several methods have been developed to generate Raman lasers. Acousto-optical modulators (AOMs) are commonly used in related studies to generate Raman lasers. However, AOMs have limitations. They have diffraction angles that make combining Raman beams difficult. In addition, their frequency shifting capability is limited at frequencies above gigahertz due to restrictions on diffraction efficiency. Typically, they are suitable for frequency shifts in the hundreds of megahertz range. This limitation makes it difficult for AOMs to meet the requirements for Raman laser generation in experiments [8,9]. Additionally, acousto-optic modulators for high-frequency shifts tend to be expensive. As a result, they are primarily employed for small frequency shifts in Raman laser generation schemes.
Electro-optic modulation (EOM) techniques have now been demonstrated by several research institutions for application in atomic gravimeters. This approach simplifies the optical setup by allowing a single laser to generate all the frequencies required for the gravimeter’s operation. In 2022, Yingpeng Zhao et. al. proposed a frequency control scheme based on artificial intelligence. They used a free-space electro-optic modulator in their design. This scheme achieved a compact laser system for an 87Rb atomic interferometer. The resulting atomic interference fringes exhibited a contrast of 20.7% [10]. This work provides a promising direction for the development of future compact laser systems powered by artificial intelligence. In the same year, Guochao Wang et. al. achieved single-sideband modulation using rectangular Bragg gratings combined with electro-optic modulators. By integrating optical filtering and frequency doubling techniques, they developed a Raman laser system suitable for portable atomic gravimeters [11]. In 2023, Himangi J. Pandit et. al. investigated the performance of different types of electro-optic modulators. Through simulation experiments, they demonstrated that more compact, stable and user-friendly phase modulators can be effectively used in 87Rb atomic interferometers, potentially improving their performance and operational simplicity [12]. In the same year, Alejandra López-Vázquez et. al. used a fiber electro-optic modulator, an acousto-optic modulator and an amplifier to generate all the laser frequencies required for an 87Rb atomic gravimeter. This compact optical setup enhances its suitability for field-deployable, dynamic measurements using cold atomic gravimeters [13]. However, fiber electro-optical modulators inherently introduce some insertion loss, resulting in a waste of optical power. In addition, the sidebands generated by electro-optic modulation spatially overlap with the master laser frequency, which can lead to measurement errors caused by side-band effects during experiments [14]. Fortunately, recent research has successfully mitigated the impact of these sideband effects, minimizing their contribution to the overall sensitivity of the gravimeter to the lowest achievable level [15].
Optical phase-locked loop (OPLL) systems are also commonly used in gravimeters. This approach offers high tuning accuracy and low noise introduction. However, the optical setup tends to be complex, typically requiring two or more lasers to form the complete optical system. In 2022, Bo-Nan Jiang used OPLL technology to design a low-noise laser system for atomic interferometry measurements. Gravimeters equipped with this system have achieved sensitivities and resolutions in the μGal range [16]. In 2024, Haoran Zhu et. al. combined a dual-fiber laser system with OPLL technology. They mounted miniature optical components onto suitable glass substrates. This setup enabled the generation of all the laser frequencies required for atomic gravimeters. This approach significantly reduces the size of the optical system, greatly improving its portability and making it more suitable for field applications [17]. In the same year, Dekai Mao and colleagues developed Raman lasers for atomic gravimeters by integrating OPLL and frequency-hopping techniques. This method combines the rapid tuning capabilities of frequency hopping with the low-noise characteristics of OPLL. The result is a highly efficient and stable laser source. It is well-suited for precise atomic gravimetry [18]. The performance of the OPLL directly affects the phase noise of the Raman laser, which in turn affects the contrast of the interference fringes during the detection phase. Ultimately, this affects the measurement accuracy of atomic gravimeters. To date, several studies have measured this effect. These investigations have enhanced our understanding of how OPLL performance impacts the accuracy of gravimeters [19]. However, compared to AOM and EOM, OPLL typically requires a more complex optical setup. This leads to a more complex and potentially bulkier system architecture. Currently, the OPLL and EOM schemes are the most commonly reported methods for generating Raman laser. However, a detailed comparative analysis of these two approaches has yet to be presented. Expanding research to include a thorough comparison of these schemes is important, as it can provide clearer insights into their respective advantages, limitations and practical applicability in Raman laser generation. Such a comparison would help guide the selection of the most suitable technique for specific applications and foster further advancements in the field.
In this paper, the most commonly used EOM method and the OPLL scheme are specifically analyzed and compared. Section 1 of this paper discusses the current status of Raman laser generation schemes. Section 2 discusses the implementation principles of the two schemes. Section 3 describes the design of the hardware systems of the two experimental schemes. Section 4 compares the experimental results of the two schemes with the specific performance indexes and discusses the advantages and disadvantages of them. Section 5 summarizes the two Raman laser techniques and gives recommendations on the Raman laser schemes in different scenarios.

2. Theory

2.1. Principle of the OPLL Method

For the 87Rb atomic gravimeter, the frequency difference of the Raman laser is about 6.834 GHz. When an OPLL is used to release the Raman laser, the master and slave lasers are usually locked to the D2 line-leap energy level of the 87Rb atoms [20]. Since the operating range of the discriminator usually does not cover this frequency, down-conversion is necessary to bring the signal within the discriminator’s operational bandwidth. The master and slave lasers are combined and connected to a photodetector, which converts the combined optical signal into an electrical signal. This signal is connected to a phase-locked servo to obtain the error signal. The error signal is connected to the current modulation or PZT modulation port of the laser to form a modulation feedback loop to complete the phase lock [21].
Once the loop is locked, the frequency of the slave laser can be precisely tuned by modifying the amplitude of the reference signal. The use of OPLLs to precisely adjust the frequency of the slave laser eliminates the need to repeatedly adjust the frequency of the master laser. As a result, the Raman laser produced by the OPLL system is more stable and has less phase noise.

2.2. Principle of the EOM Method

The Raman laser produced by the electro-optical modulator consists of the fundamental frequency laser and sidebands of several frequency components. Its laser electric field can be written as follows [10]:
E   =   n   =   + E n c o s ω L   +   n ω ( t     z / c )
Here, n represents the order number. En is the electric field strength of the n-th order sideband. ωL denotes the fundamental frequency of the laser. Δω is the modulation frequency of the electro-optic modulator. t represents the laser emission time. z indicates the relative position along the laser’s propagation path. Finally, c is the speed of light. The modulated laser is directed into the vacuum cavity. A reflector is used to coincide the incident laser with the reflected laser. As a result, the opposite direction of the incident laser in the 0 level sidebands and the reflected laser in the +1 level sidebands form a Raman laser pair. Similarly, the −1 level in the incident laser and the 0 level in the reflected laser will also form a Raman laser pair. The extra Raman laser is the extra sideband effect introduced by the electro-optic modulation. The modulated sideband can be changed by adjusting the level of the modulation signal. The effect of Raman sidebands can be minimized by optimizing parameters such as the Raman sideband ratio, the interference time, the position of the Raman laser reflector to the center of the cold atom cluster and the detuning of the Raman laser [22,23].

3. Design of Experiments

3.1. Design of the OPLL Scheme

The OPLL consists mainly of three parts: frequency beating, frequency mixing and feedback modulation. The modulation transfer spectrum is used to stabilize the frequency of the master laser. By controlling the temperature, current and piezoelectric (PZT) bias voltage, the master laser is locked to the jump frequency of the F   =   1 F =   0 transition of 87Rb atom, which is 384,234.454 GHz. The slave laser’s frequency is then similarly adjusted to lock onto the jump frequency of the F   =   2 F =   0 transition, at 384,227.620 GHz. The frequency difference is 6.834 GHz.
Figure 1 shows the block diagram of the OPLL. The portion of Figure 1(1) in green is the frequency beating module. The lasers are combined and connected to the photodetector to complete the frequency beat. The frequency beating signal can be observed by the spectrometer. The portion of Figure 1(2) in blue is the frequency mixing module. The output of the photodetector is connected sequentially to a mixer, bandpass filter, low-noise amplifier and power amplifier. This setup achieves frequency down-conversion of the beat signal from the GHz range to the MHz range, making it suitable for observation with an oscilloscope. The portion of Figure 1(3) in pink is the feedback modulation module. The mixed signal is connected to the phase-locked servo. By comparing it with reference signal, the error signal is obtained. This error signal is used to adjust the PZT, forming a feedback loop that stabilizes the phase and achieves phase locking of the laser system.
Once phase locking is achieved, the frequency of the master laser can be tuned to follow the frequency of the slave laser by adjusting the frequency of the reference signal. In this way, lasers of different frequencies can be generated without the need to re-lock the master laser’s frequency. The advantage of this approach lies in its wide frequency tuning range and low phase noise, ensuring stable laser operation that is suitable for precise measurements.

3.2. Design of the EOM Scheme

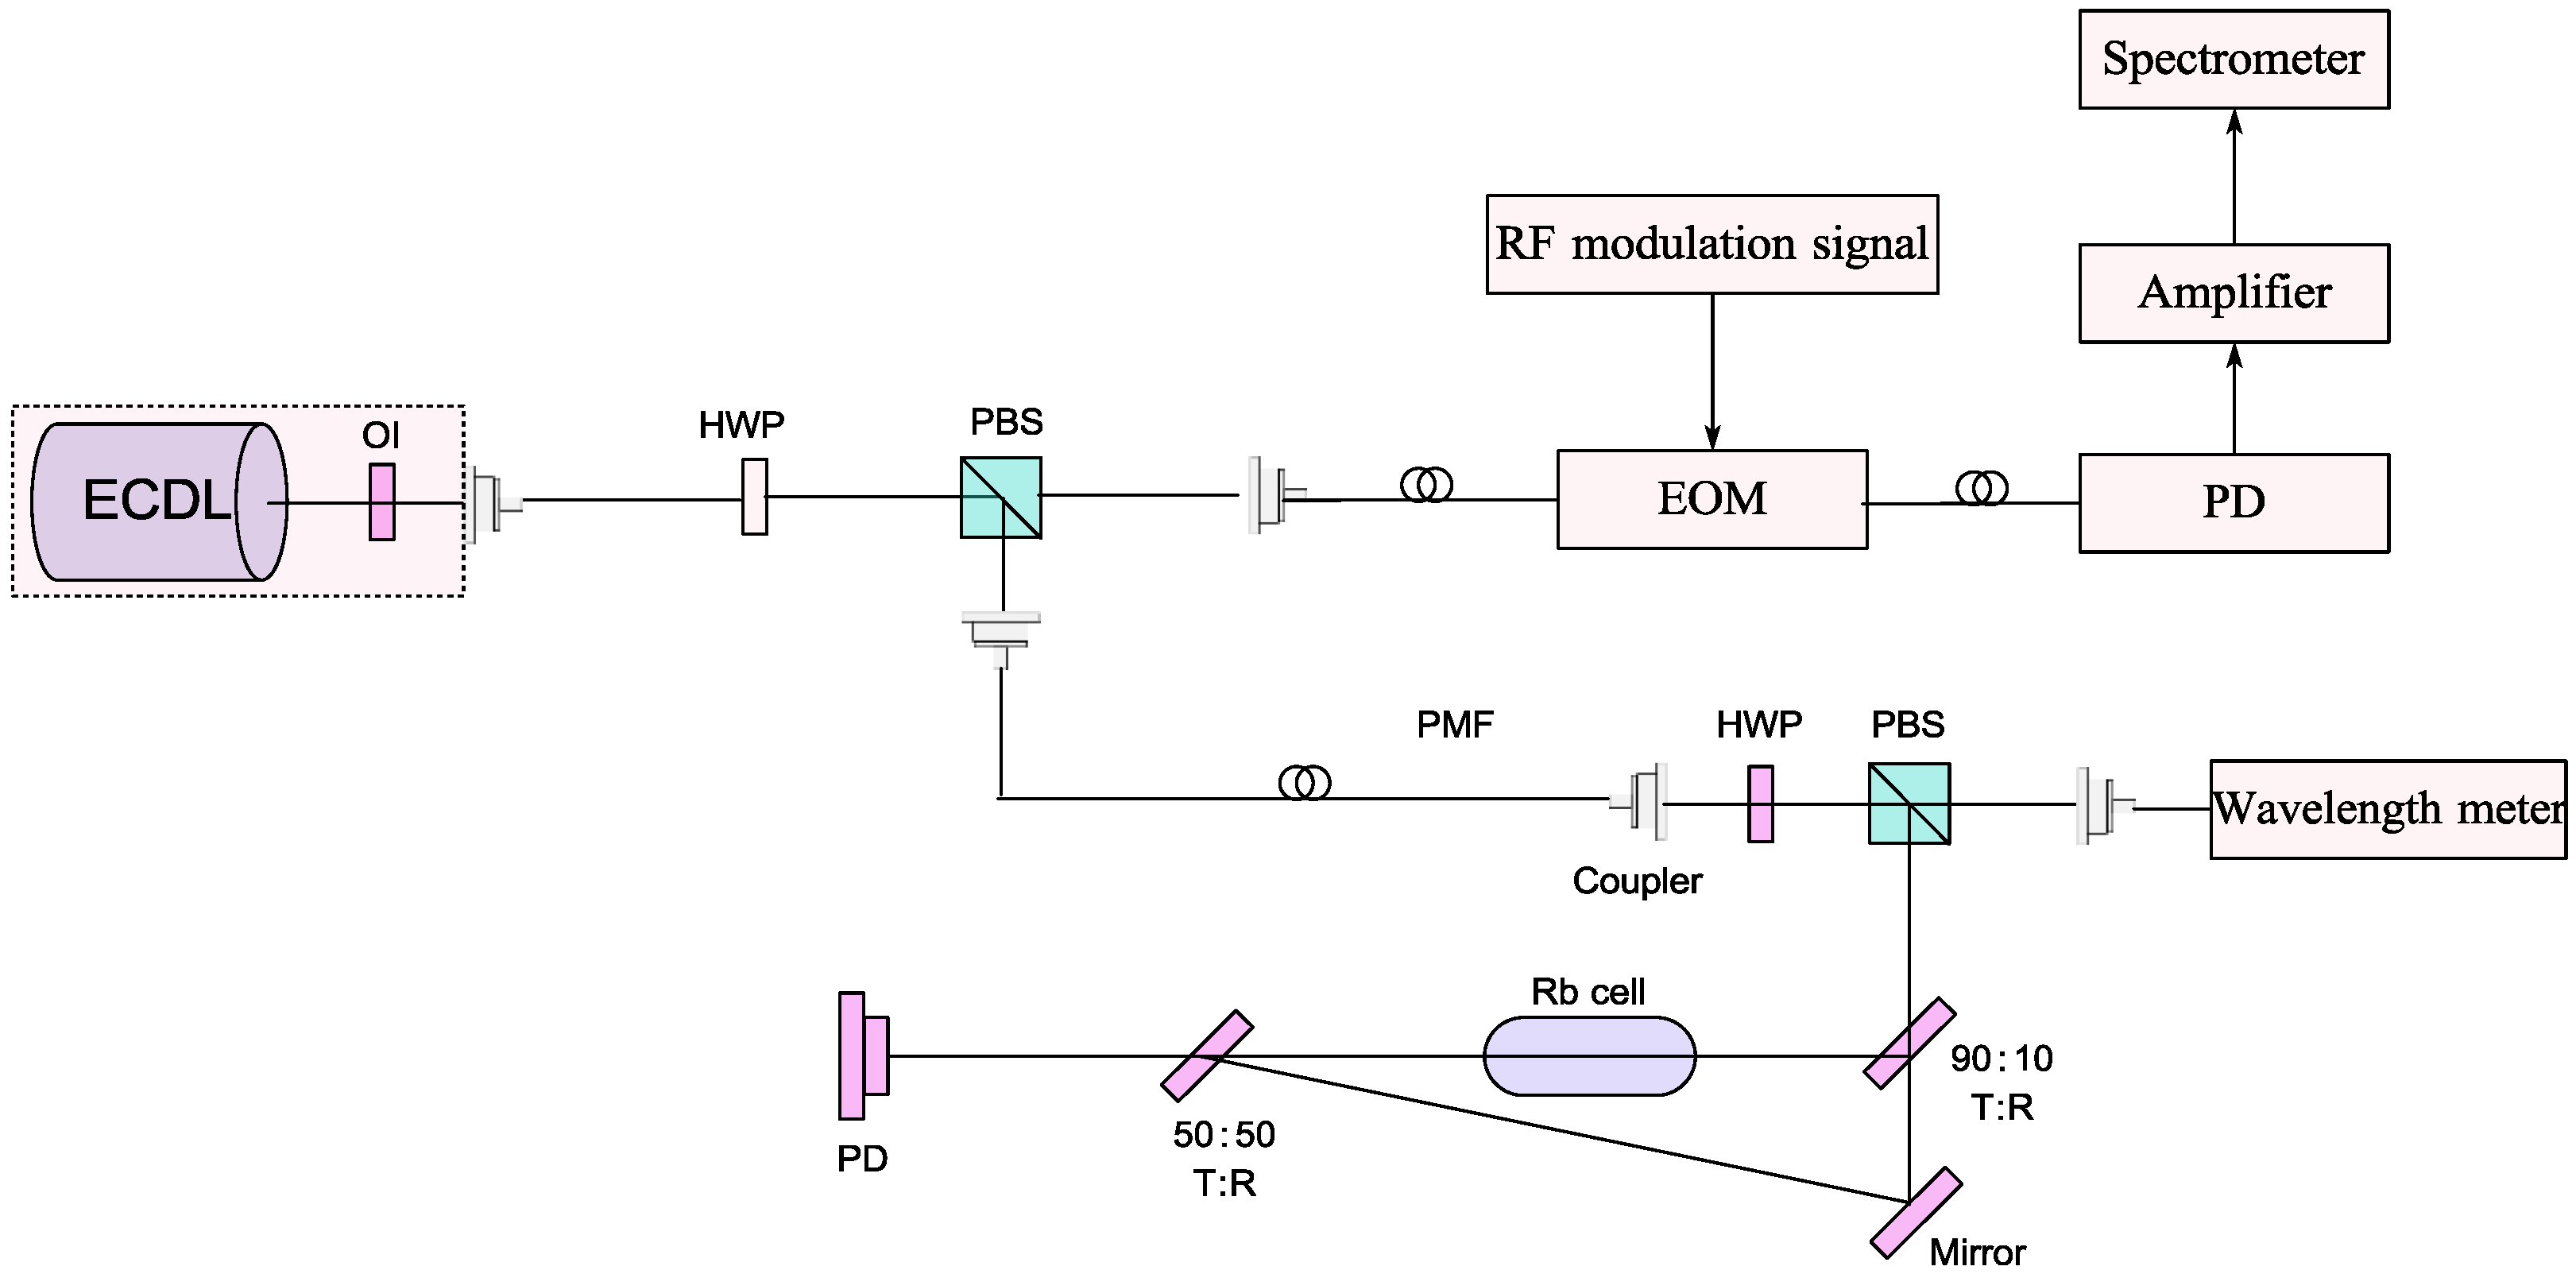
The EOM Raman laser method has a simpler optical path than the OPLL. Its block diagram is shown in Figure 2. The laser output is split into two beams after passing through a polarizing beam splitter. One beam is connected to the saturated absorption spectrum module for laser frequency stabilization, and the other laser beam passes through the coupling head and is spatially filtered using the optical fiber. The laser passes through a half-wave plate, a reflector and a linear polarizer.
These components ensure that the laser’s polarization direction is parallel to the slow axis of the fiber EOM. Then, the beam is coupled into the fiber EOM through a coupler. The system’s block diagram is shown in Figure 3. Both the OPLL and EOM approaches have been tested using the same high-quality RF reference source to minimize phase noise. When the DSG3136B RF signal generator outputs a modulation frequency of 6.834 GHz, the signal passes through an amplifier before being connected to the EOM’s modulation port. The output of the fiber EOM is connected to the photodetector. The photodetector’s output is then fed into the spectrometer to observe the beat frequency signal. The EOM we used here is EXAIL-NIR-MPX800-LN. The amplifier we used here is ZRON-8G+.
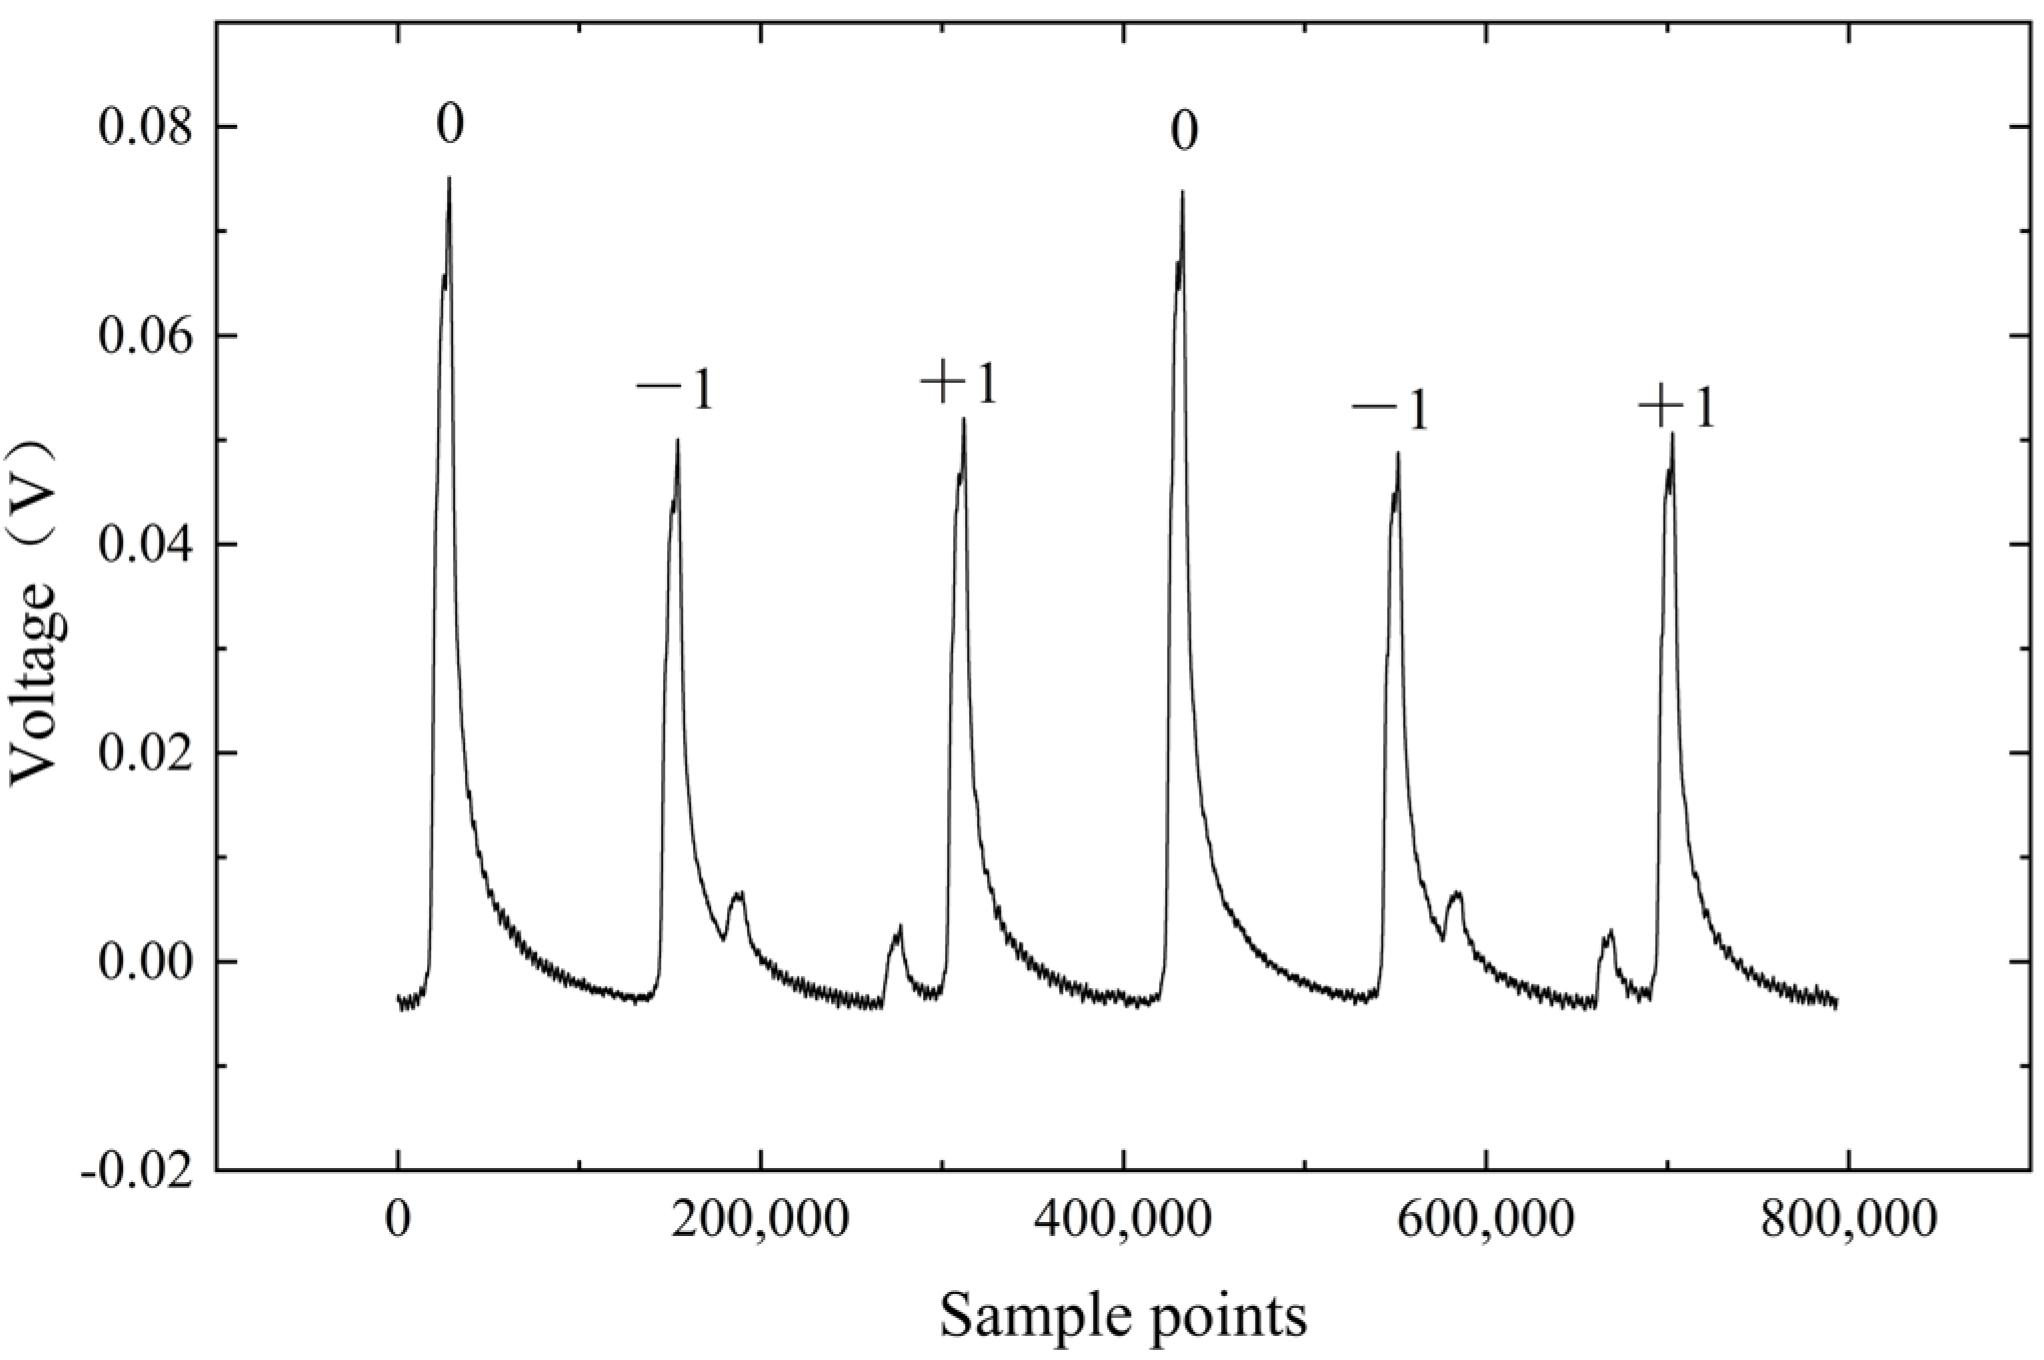
The output signal after EOM modulation is connected to the SA210-5B FP interferometer. The gain of the FP interferometer controller is set to 10 times, and the scan amplitude is adjusted to 20 V. Under these conditions, the modulation results can be observed on an oscilloscope, as shown in Figure 4.
There is one complete cycle between two identical peaks, with a frequency interval of 10 GHz. In Figure 4, the highest peak represents the level 0 sideband, while the next highest peak corresponds to the level +1 sideband. By changing the value of the modulation voltage, the sideband ratio changes accordingly. Using this method, the corresponding modulation power is determined to be 15.07 dBm when the ratio of the level 0 sideband to the level +1 sideband is 1:1.

4. Comparison of Experimental Results

4.1. Comparison of Beat Frequency Linewidths

4.1.1. OPLL Beat Frequency Linewidth

The linewidth provides information about the spectral purity and coherence properties of the laser. It primarily reflects short-term phase noise. Reducing the linewidth reduces the measurement error in gravity detection. A spectrometer can be used to measure the linewidth of the laser. The output of the photodetector is connected to a spectrometer to observe the amplitude of the beat frequency signal. The results of the beat frequency linewidth of the OPLL Raman laser scheme are shown in Figure 5.
The frequency of the OPLL mixing signal is 488 MHz. The spectrometer settings are as follows: resolution bandwidth (RBW) is set to 300 kHz, video bandwidth (VBW) is set to 300 kHz and span is set to 50 MHz. Under these conditions, the linewidth measured at the −3 dB point is 91.761 kHz.

4.1.2. EOM Beat Frequency Linewidth

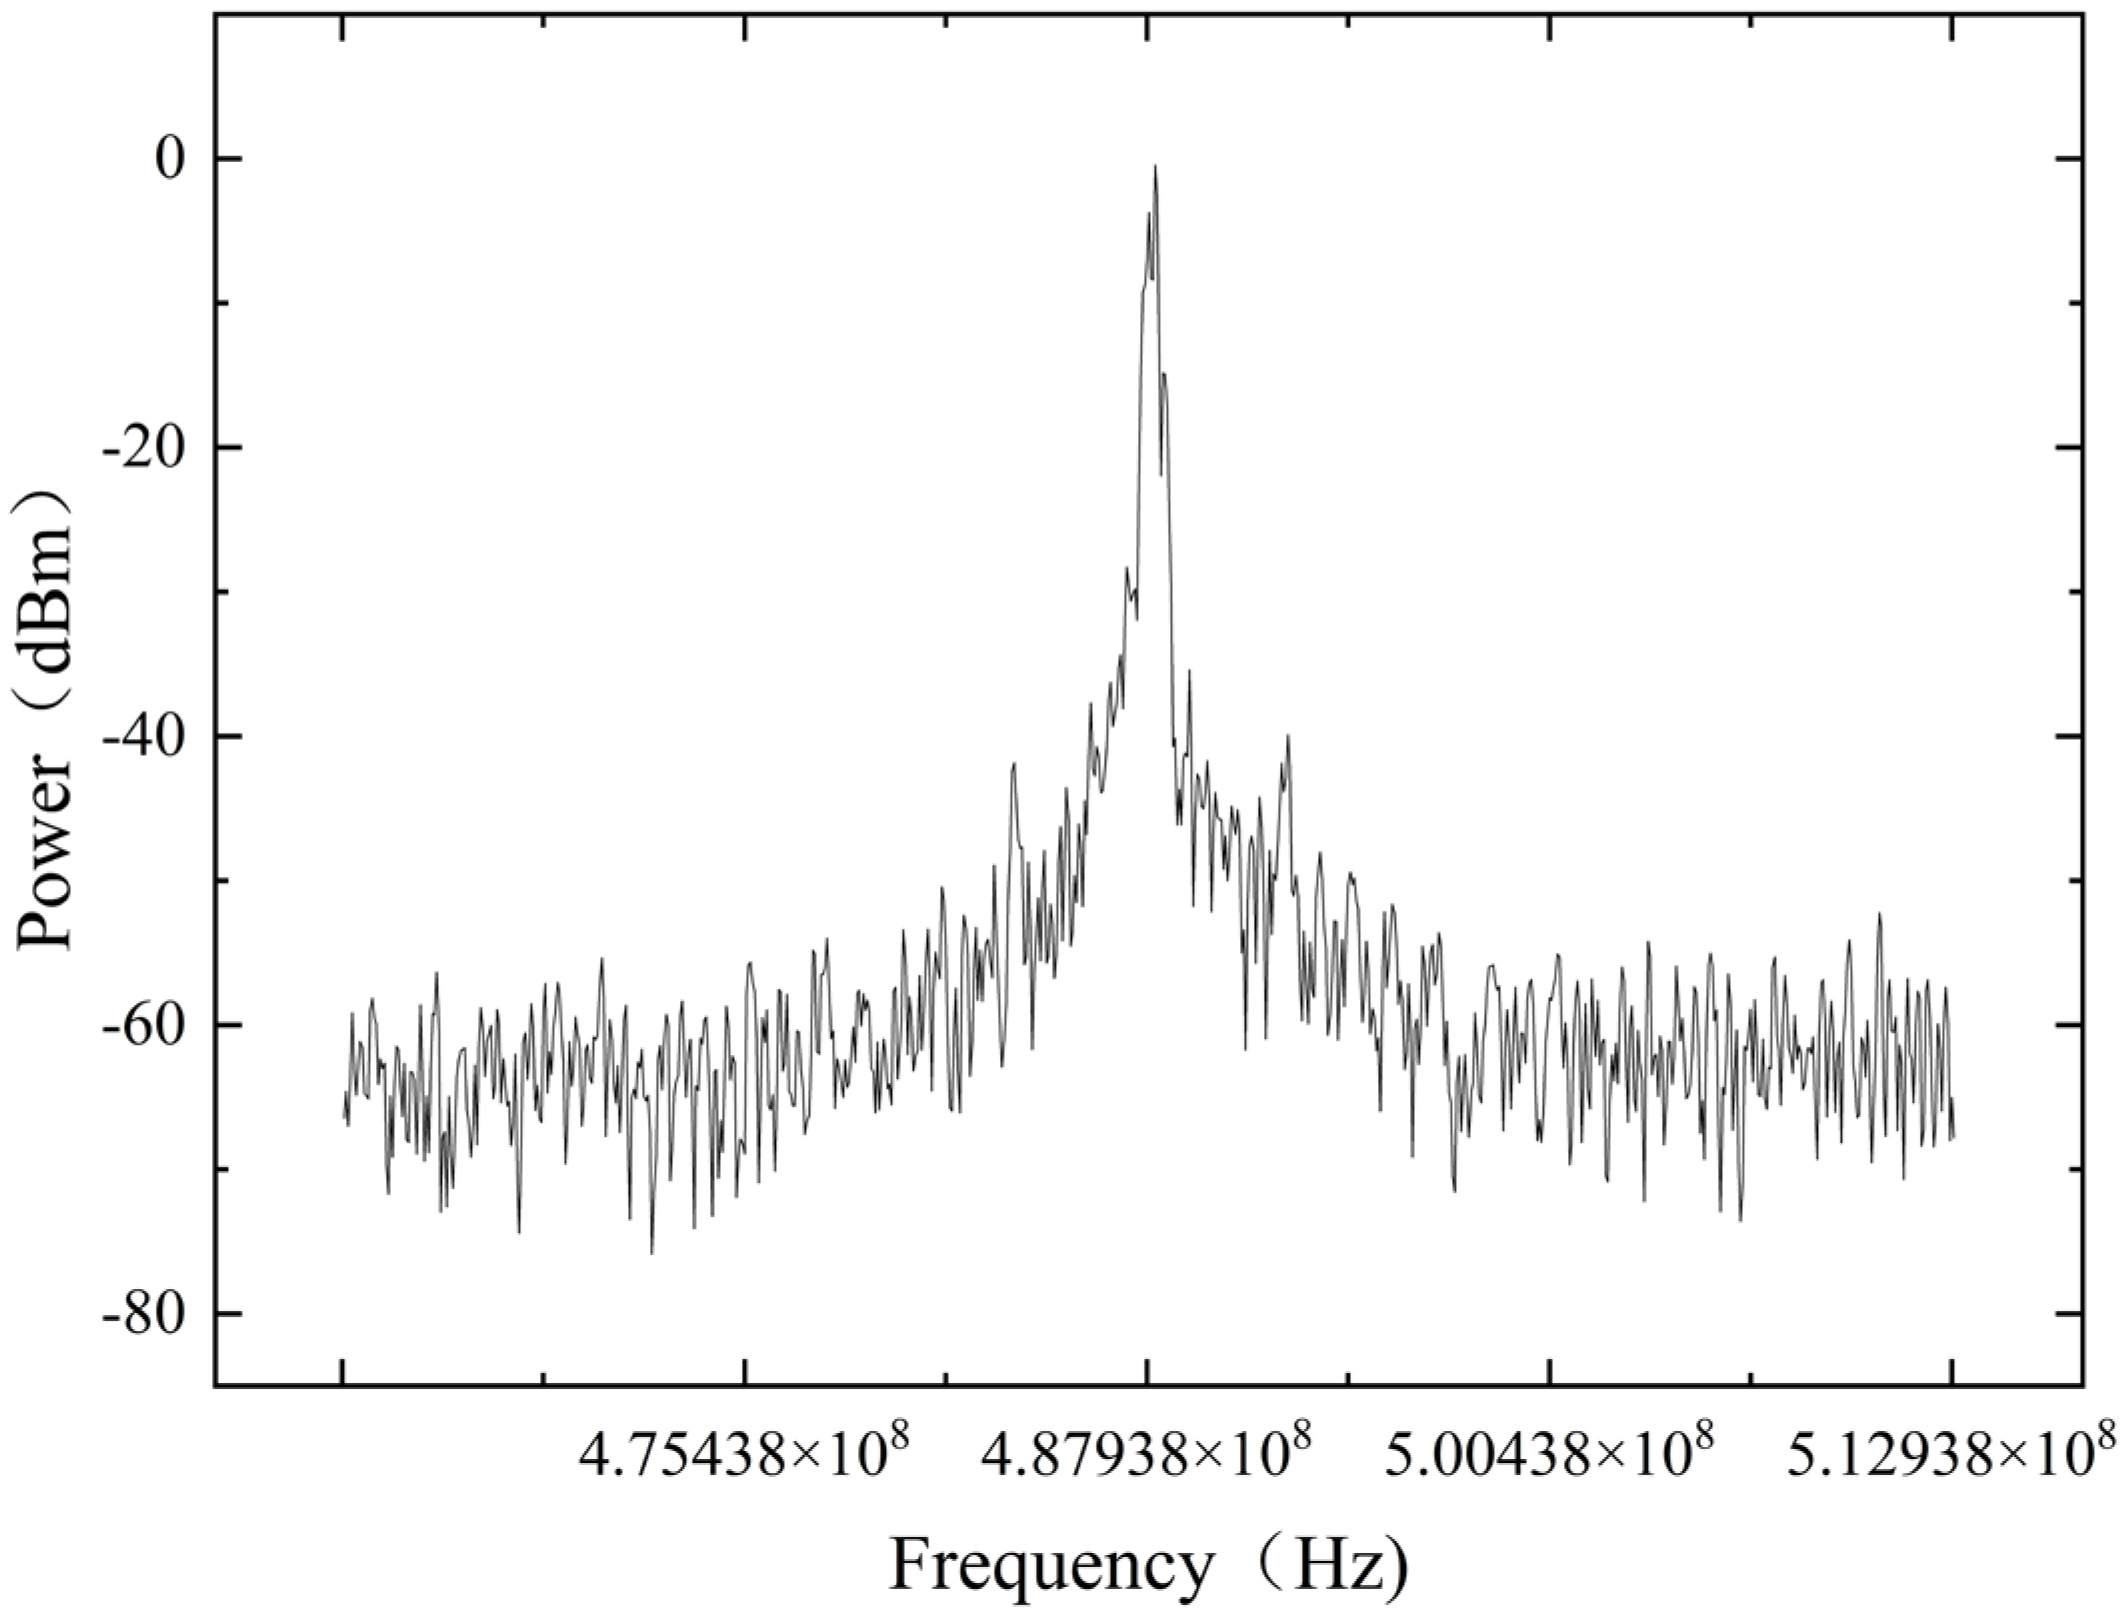
The modulated frequency of the EOM Raman optical scheme is 6.834 GHz, with a modulation power level of 15 dBm. The RBW of the spectrometer is set to 100 kHz, the VBW is set to 100 kHz and the span is set to 100 MHz. The beat frequency signal is shown in Figure 6. The linewidth measured at the −3 dB point is 125.94 kHz.
The beat frequency linewidth of the OPLL is generally narrower than that of the EOM Raman scheme. This difference arises because the EOM method lacks an effective feedback modulation loop, making it more vulnerable to noise. However, the laser used in the OPLL Raman scheme developed in this study has only one single feedback loop via PZT modulation. As a result, the linewidth narrowing is limited because the laser does not have a current modulation port, preventing the addition of a current feedback loop. A wider lock bandwidth allows a higher response speed, but the system noise will increase. Theoretically, if a current feedback loop was implemented, the beat frequency linewidth could be further reduced to the Hz level [24].

4.2. Comparison of Phase Noise

4.2.1. OPLL Phase Noise

The phase noise level of the OPLL directly impacts the measurement accuracy of the gravimeter by influencing the contrast of the interference fringes during the detection phase. The value of the phase noise can usually be observed and calculated using a spectrometer. The smaller the phase fluctuation of the beat signal, the lower the phase noise of the OPLL system. This leads to a more stable system. Phase noise curves are measured in reference [21]. The phase noise of the OPLL in the mid-frequency band is about −106 dBc/Hz.

4.2.2. EOM Phase Noise

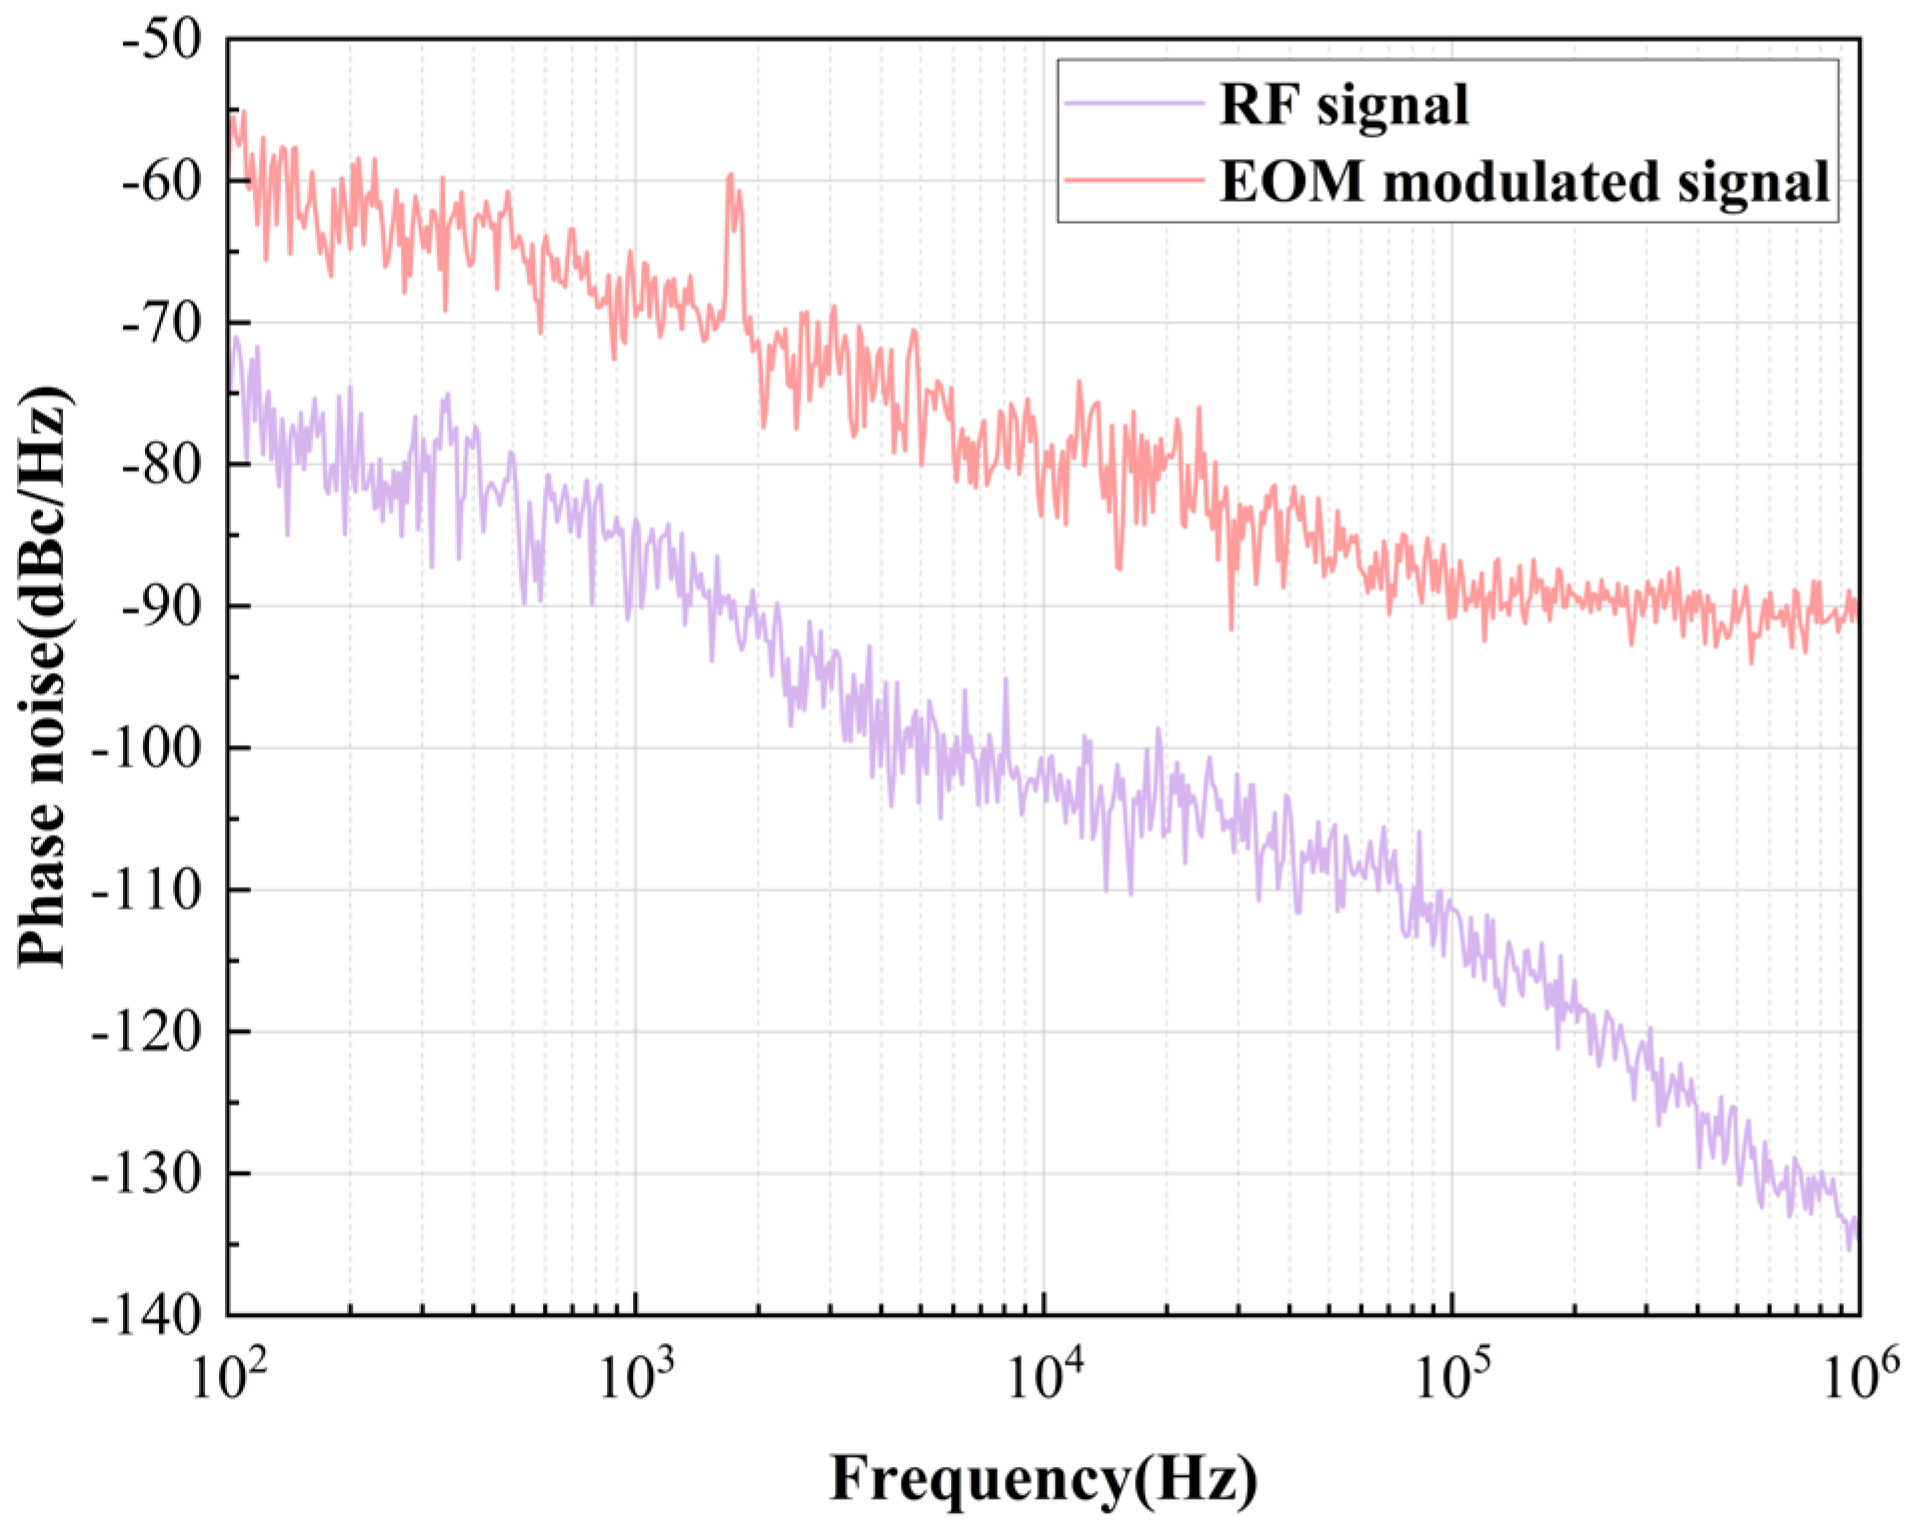
The phase noise of the EOM Raman laser scheme is shown in Figure 7. The purple curve is the phase noise of the RF signal. The red curve is the phase noise of the signal after EOM modulation. The RF source contributes phase noise that directly maps onto the optical carrier during modulation. While the EOM modulator ideally acts as a linear phase modulator without adding significant intrinsic noise. Thermal fluctuations can introduce minor additional noise. However, these contributions are typically much smaller compared to the phase noise originating from the RF source. Figure 7 shows that the modulated noise level is higher than the phase noise of the RF signal. This occurs because the modulation loop lacks signal feedback. In the mid-frequency band, the phase noise of the modulated signal is around −90 dBc/Hz. This level is relatively high compared to the noise level of the OPLL Raman laser scheme.

4.3. Long Term Stability

4.3.1. Long-Term Stability of the OPLL Scheme

By connecting the beat signal to the frequency counter, its stability can be monitored and analyzed. During the 12 h locking period, the frequency counter recorded the beat signal. The Allan variance of its long-term stability was calculated in reference [21]. The relative Allan variance is calculated to be 1.6 × 10⁻¹¹ at an integration time of 1 s. It reaches a minimum value of 4.159 × 10⁻¹³ at 1638 s.

4.3.2. Long-Term Stability of the EOM Scheme

The long-term stability of the EOM Raman laser scheme is mainly influenced by the long-term stability of the master laser and the RF signal. Figure 8 shows the free-running frequency of the master laser. Over a period of 6000 s, the frequency drifts by 3.5 MHz.
Figure 9 shows the frequency of the master laser after locking. Over a period of 6500 s, the frequency fluctuates closely around the locked value, with the frequency drift significantly reduced. The Raman laser for the EOM scheme in this paper is generated by a single laser modulated after beam splitting by a polarizing beam splitter. To further improve the long-term stability of the EOM method, an additional laser beam is used for frequency stabilization by saturation absorption spectroscopy (SAS). This improved frequency stability of the master laser effectively reduces the long-term drift of the sideband frequencies produced by EOM modulation.
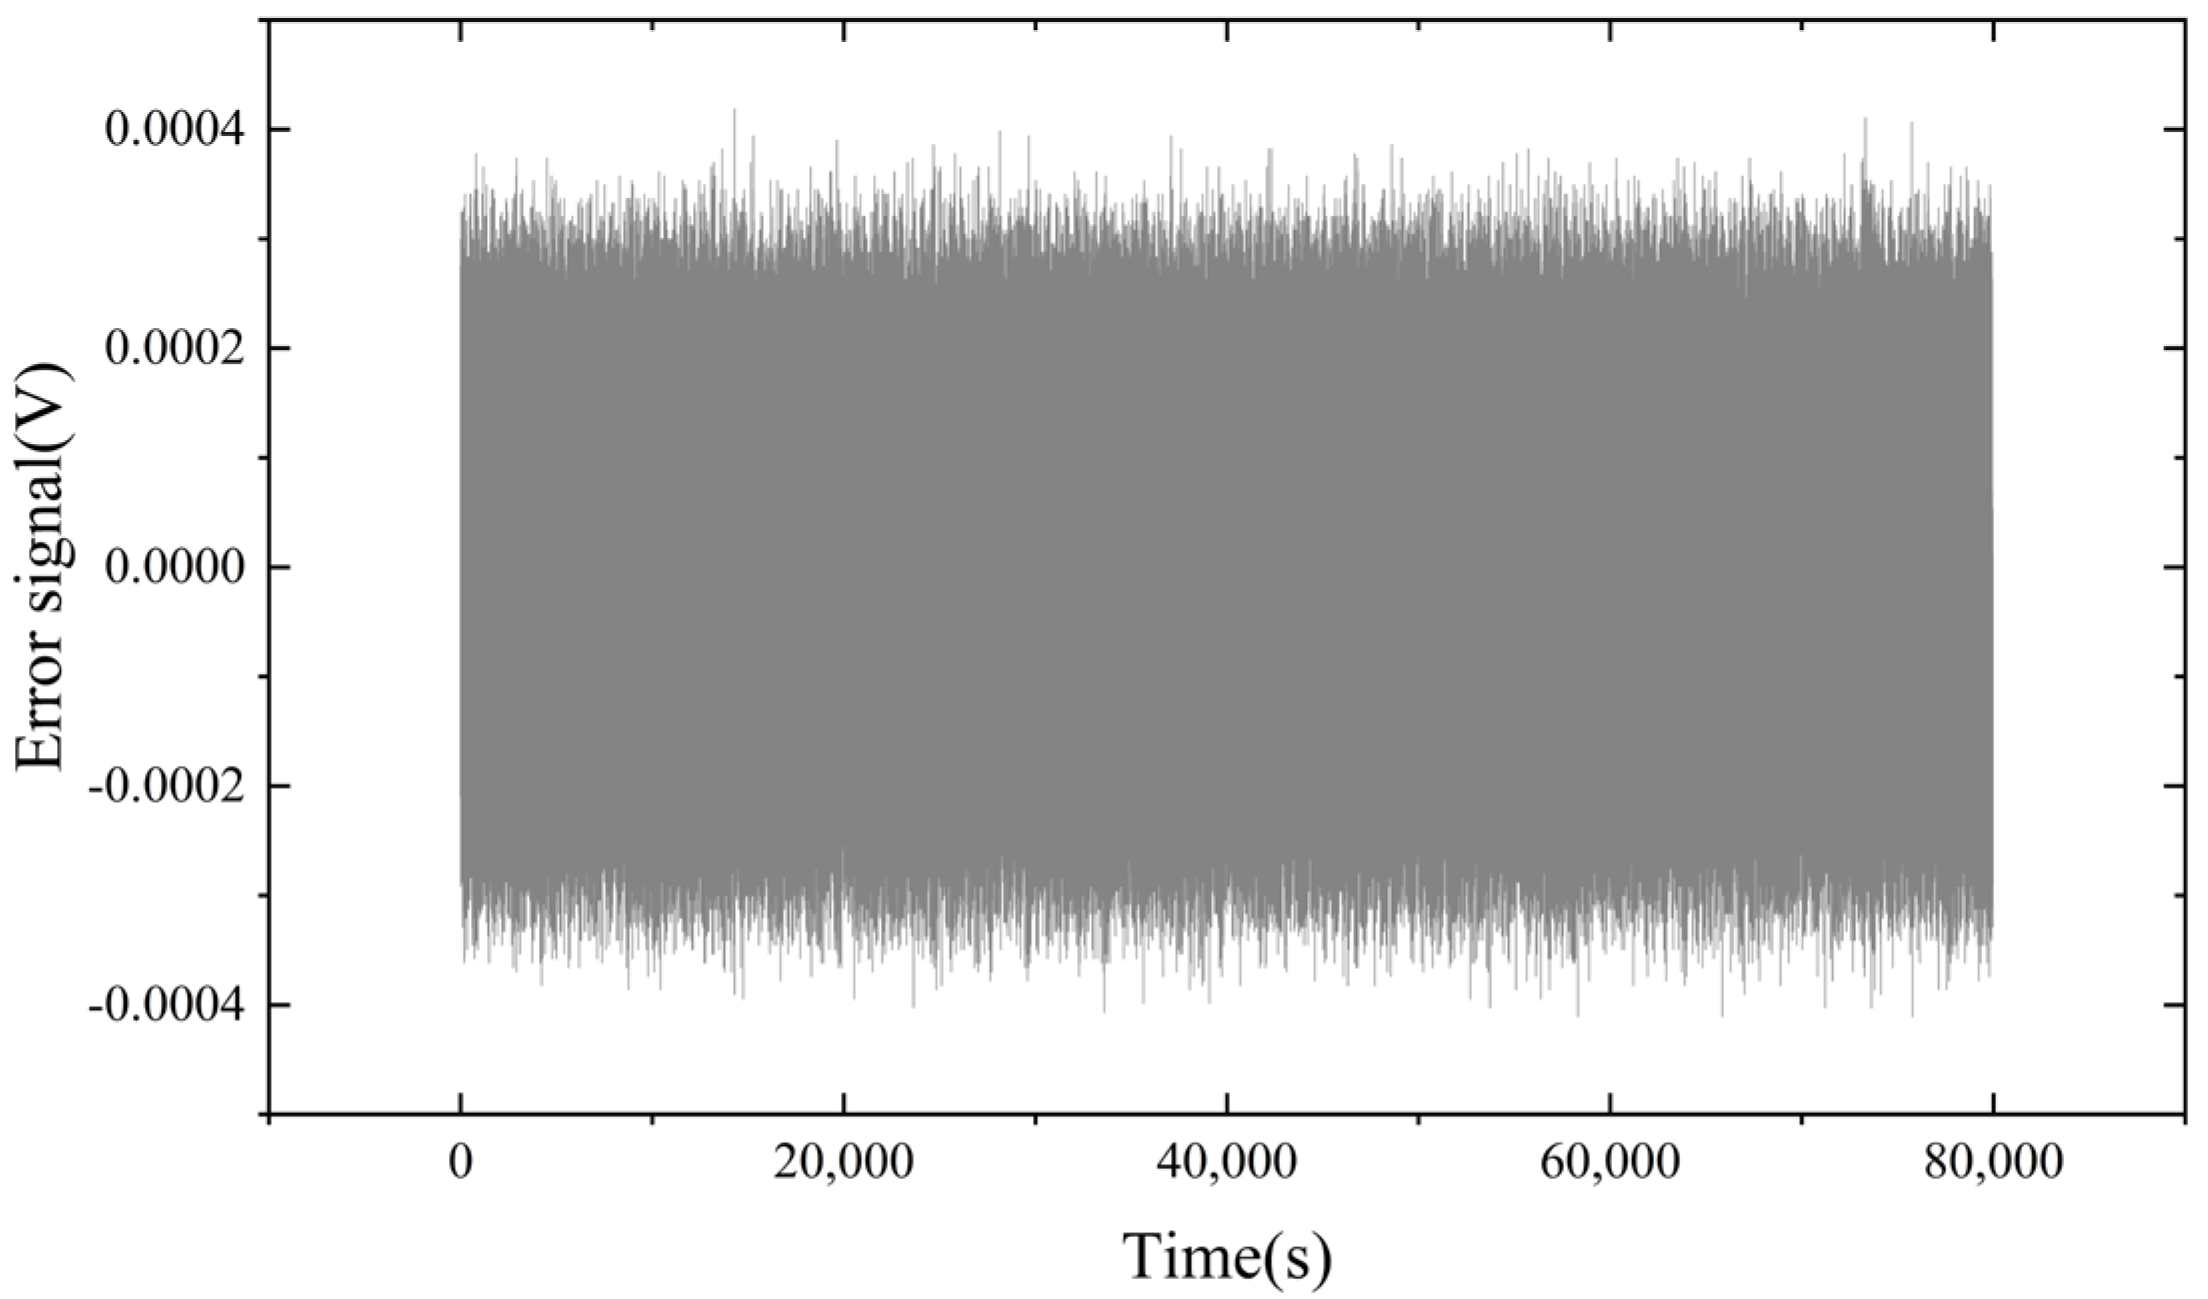
Figure 10 presents the long-term stability of the master laser frequency after implementing SAS frequency stabilization. The corresponding Allan variance is shown in Figure 11. At an integration time of 1 s, the relative Allan variance is calculated to be 4.687 × 10⁻⁶. It reaches its minimum value of 3.792 × 10⁻⁷ at 1638 s.

5. Discussion

The results of the above experiments show that the OPLL Raman laser scheme has a narrower beat frequency linewidth than the EOM Raman laser scheme. This advantage comes from the presence of a modulation feedback loop. Regarding phase noise, the OPLL scheme reduces it effectively through feedback loop. This feature makes it suitable for high-precision interferometric experiments, as it can correct phase drift in real time. On the other hand, the phase noise of the EOM scheme is mainly due to the phase noise of the RF signal and the non-linear effects of the amplifier. As a result, the EOM scheme has a relatively higher noise level compared to the OPLL scheme.
In terms of long-term stability, the OPLL method provides high frequency stability. This is due to its feedback loop. Therefore, it is suitable for long-time experiments. In contrast, the frequency stability of the EOM method is limited by the RF signal. It usually requires additional external frequency stabilization. An external atomic clock for the RF signal generator can improve the stability of the modulated signal. In addition, a SAS frequency stabilization for the master laser can also improve the stability of the EOM Raman laser method.
In terms of optical path control, the OPLL scheme divides laser into different frequencies that can be managed using a polarizing beam splitter. This allows for flexible separation and modulation of the laser. In contrast, the EOM scheme produces a laser beam where different frequency components are fused together. As a result, these components cannot be separated or independently switched off.
Regarding system complexity, the OPLL scheme requires at least two lasers, leading to a more complex system. However, the EOM scheme mainly involves an EOM and an RF signal generator. This makes it simpler and easier to implement. When considering experimental cost, the OPLL scheme requires multiple optoelectronic components, which can be expensive. The EOM scheme is relatively inexpensive.
In terms of flexibility, the frequency adjustment range of the OPLL is limited by the bandwidth of the feedback loop, but the EOM scheme can rapidly generate Raman lasers at different frequencies by adjusting the frequency of the RF signal. This makes the EOM scheme highly flexible.
In terms of experimental accuracy, the OPLL is suitable for high-precision interferometry due to its high frequency and phase stability. However, the EOM scheme is limited by phase noise and frequency stability. Consequently, its experimental accuracy is generally slightly lower than that of the OPLL scheme. A detailed comparison of the two Raman laser schemes, OPLL and EOM, is provided in Table 1.

6. Conclusions

The OPLL scheme and the EOM scheme are the two most commonly used methods for generating Raman lasers in atomic gravimeters. The main advantage of the OPLL scheme is its high precision and excellent long-term stability. In contrast, the EOM scheme stands out for its high flexibility and low cost. In this paper, we first analyze the basic principles of both systems. Then, we build experimental setups for the OPLL and EOM Raman lasers separately. Finally, we conduct detailed comparative analyses focusing on beat frequency linewidths, phase noise, long-term stability etc.
The choice between the EOM and OPLL Raman laser schemes should depend on the specific application and system design requirements. For high-precision measurements, such as gravitational wave detection and seismic monitoring, the OPLL scheme is generally the better option. The frequency stability and low phase noise significantly enhance interference fringe contrast, enabling high measurement accuracy. Additionally, the feedback loop effectively compensates for laser frequency drift, ensuring stable operation over extended periods.
For flexible situations, such as marine gravity measurement, the EOM Raman laser solution is more suitable. It can rapidly generate Raman lasers at different frequencies simply by adjusting the RF signal. Moreover, by adding auxiliary frequency stabilization circuits, the performance of the EOM scheme can be enhanced to a certain degree, allowing it to meet more experimental requirements.
In the future, with the development of integrated optics and digital phase-locked loop, the performance of EOM is expected to further improved. As a result, EOM-based systems may gradually expand to cover some of the application areas currently dominated by OPLL. Furthermore, the development of integrated miniature EOM and OPLL devices is anticipated to accelerate the realization of portable quantum sensors and quantum communication technologies. When combined with optimized control strategies driven by artificial intelligence algorithms, the stability and controllability of Raman laser sources are expected to be further enhanced, enabling expanded applications in cold atom experiments and quantum precision measurements.

Author Contributions

R.X. wrote the paper and designed the experiments; F.Q. and A.L. provided financial support; Z.D. and H.C. provided advices and helpful theoretical discussion. D.L. and H.Z. reviewed the paper; J.S. and C.G. proofread the paper. All authors have read and agreed to the published version of the manuscript.

Funding

This research was funded by the National Natural Science Foundation of China (Grant. No. 42274013 and 62205375).

Data Availability Statement

The datasets used and/or analyzed during the current study are available from the corresponding author on reasonable request.

Conflicts of Interest

The authors declare no conflicts of interest.

Abbreviations

The following abbreviations are used in this manuscript:
OPLLOptical phase-locked loop
EOMElectro-optical modulation
SASSaturation absorption spectroscopy
AOMAcousto-optical modulation
PZTPiezoelectric

References

  1. Bidel, Y.; Zahzam, N.; Blanchard, C.; Bonnin, A.; Cadoret, M.; Bresson, A.; Rouxel, D.; Lequentrec-Lalancette, M.F. Absolute marine gravimetry with matter-wave interferometry. Nat. Commun. 2018, 9, 627. [Google Scholar] [CrossRef]
  2. Gong, W.B.; Li, A.; Liao, A.; Che, H.; Huang, C.F.; Qin, F.J. A Vibration Signal Denoising Method of Marine Atomic Gravimeter Based on Improved Variational Mode Decomposition. Wirel. Commun. Mob. Com. 2022, 2022, 1744689. [Google Scholar] [CrossRef]
  3. Peters, A.; Chung, K.Y.; Chu, S. High-precision gravity measurements using atom interferometry. Metrologia 2001, 38, 25. [Google Scholar] [CrossRef]
  4. Bidel, Y.; Zahzam, N.; Bresson, A.; Blanchard, C.; Cadoret, M.; Olesen, A.V.; Forsberg, R. Absolute airborne gravimetry with a cold atom sensor. J. Geod. 2020, 94, 20. [Google Scholar] [CrossRef]
  5. He, M.; Chen, X.; Fang, J.; Chen, Q.; Sun, H.; Wang, Y.; Zhong, J.; Zhou, L.; He, C.; Li, J.; et al. The space cold atom interferometer for testing the equivalence principle in the China Space Station. npj Microgravity 2023, 9, 58. [Google Scholar] [CrossRef] [PubMed]
  6. Rosi, G.; D’aMico, G.; Cacciapuoti, L.; Sorrentino, F.; Prevedelli, M.; Zych, M.; Brukner, Č.; Tino, G.M. Quantum test of the equivalence principle for atoms in coherent superposition of internal energy states. Nat. Commun. 2017, 8, 15529. [Google Scholar] [CrossRef]
  7. Xu, R.; Li, A.; Li, D.; Yan, J. Magneto-Optical Traps for Cold Atomic Gravimetry: Research Status and Development Trends. Appl. Sci. 2023, 13, 6076. [Google Scholar] [CrossRef]
  8. Luo, Q.; Zhang, H.; Zhang, K.; Duan, X.C.; Hu, Z.K.; Chen, L.L.; Zhou, M.K. A compact laser system for a portable atom interferometry gravimeter. Rev. Sci. Instrum. 2019, 90, 43104. [Google Scholar] [CrossRef]
  9. Fang, J.; Hu, J.; Chen, X.; Zhu, H.; Zhou, L.; Zhong, J.; Wang, J.; Zhan, M. Realization of a compact one-seed laser system for atom interferometer-based gravimeters. Opt. Express 2018, 26, 1586–1596. [Google Scholar] [CrossRef]
  10. Wu, B.; Zhao, Y.; Cheng, B.; Zhang, C.; Li, D.; Zhu, D.; Yue, Y.; Li, J.; Zhang, K.; Lin, Q.; et al. A Simplified Laser System for Atom Interferometry Based on a Free-Space EOM. Photonics 2022, 9, 301. [Google Scholar] [CrossRef]
  11. Wang, G.; Wang, Y.; Ying, K.; Zhang, H.; Zhang, X.; Li, Q.; Li, X.; Wang, E.; Yu, X.; Jia, A.; et al. Robust single-sideband-modulated Raman light generation for atom interferometry by FBG-based optical rectangular filtration. Opt. Express 2022, 30, 28658–28667. [Google Scholar] [CrossRef] [PubMed]
  12. Pandit, H.; Tyagi, A.; Vaid, H.; Dhawan, R.; Choudhary, A. Single sideband modulation formats for quantum atom interferometry with Rb atoms. Appl. Phys. B 2023, 129, 24. [Google Scholar] [CrossRef]
  13. López-Vázquez, A.; Maldonado, M.A.; Gomez, E.; Corzo, N.V.; de Carlos-López, E.; Franco Villafañe, J.A.; Jiménez-García, K.; Jiménez-Mier, J.; López-González, J.L.; López-Monjaraz, C.J.; et al. Compact laser modulation system for a transportable atomic gravimeter. Opt. Express 2023, 31, 3504–3519. [Google Scholar] [CrossRef] [PubMed]
  14. Cundiff, S.T.; Ye, J.; Hall, J.L. Optical frequency synthesis based on mode-locked lasers. Rev. Sci. Instrum. 2001, 72, 3749–3771. [Google Scholar] [CrossRef]
  15. Charrière, R.; Cadoret, M.; Zahzam, N.; Bidel, Y.; Bresson, A.; Carraz, O. Phase shift in an atom interferometer induced by the additional laser lines of a Raman laser generated by modulation. Phys. Rev. A 2012, 86, 33605. [Google Scholar] [CrossRef]
  16. Jiang, B. Low noise phase-locked laser system for atom interferometry. Appl. Phys. B 2022, 128, 033605. [Google Scholar] [CrossRef]
  17. Zhu, H.; Huang, P.; Gao, B.; Tang, B.; Chen, X.; Zhong, J.; Wang, J.; Zhan, M. Miniaturized optical system for high-precision mobile atomic gravimeters. Opt. Express 2024, 32, 26157–26166. [Google Scholar] [CrossRef]
  18. Mao, D.; Shui, H.; Yin, G.; Peng, P.; Wang, C.; Zhou, X. Gigahertz frequency hopping in an optical phase-locked loop for Raman lasers. Chin. Phys. B 2024, 33, 24209. [Google Scholar] [CrossRef]
  19. Bai, J.H.; Hu, D.; Gong, H.; Wang, Y. Optical phase-locked loop system for atomic interferometer. Meas. Technol. 2020, 40, 26–30. [Google Scholar]
  20. Steck, D.A. Rubidium 87 D Line Data [EB/OL]. Available online: https://steck.us/alkalidata/rubidium87numbers.1.6.pdf (accessed on 1 March 2024).
  21. Xu, R.; Qin, F.; Ding, Z.; Chen, H.; Li, A.; Li, D.; Sun, J.; Zhang, H.; Ge, C. An optimized optical phase-locked loop with high bandwidth and stability for Raman laser generation. Phys. Scr. 2025, 100, 65014. [Google Scholar] [CrossRef]
  22. Gillot, P.; Merlet, S.; Pereira Dos Santos, F.; Cheng, B. Influence of chirping the Raman lasers in an atom gravimeter: Phase shifts due to the Raman light shift and to the finite speed of light. Phys. Rev. A 2015, 92, 63617. [Google Scholar] [CrossRef]
  23. Hauden, J.; Cheiney, P.; Napolitano, F.; Porte, H.; Bouyer, P.; Barrett, B.; Battelier, B.; Templier, S. Carrier-Suppressed Multiple-Single-Sideband Laser Source for Atom Cooling and Interferometry. Phys. Rev. Appl. 2021, 16, 44018. [Google Scholar] [CrossRef]
  24. Marino, A.M.; Stroud, C.R. Phase-locked laser system for use in atomic coherence experiments. Rev. Sci. Instrum. 2008, 79, 13104. [Google Scholar] [CrossRef] [PubMed]
Figure 1. Block diagram of OPLL: (1) The frequency beating module is in green; the lasers are combined and connected to the photodetector to complete the frequency beat. (2) The frequency mixing module is in blue; it achieves frequency down-conversion of the beat signal from the GHz range to the MHz range, making it suitable for observation with an oscilloscope. (3) The feedback modulation module is in pink; the error signal is used to adjust the PZT, forming a feedback loop to achieve phase locking of the laser system.
Photonics 12 00807 g001
Figure 2. Block diagram of the EOM program structure for the generation of Raman laser. The laser output is split into two beams after passing through a coupler, an optical isolator (OI), a half-wave plate (HWP) and a polarizing beam splitter (PBS). One beam is connected to the saturated absorption spectrum module via a polarization-maintaining fiber (PMF) for laser frequency stabilization, and the other laser beam is used to generate the Raman laser by a fiber EOM and a radio frequency (RF) signal generator. The modulated signal is tested by a photodetector (PD).
Photonics 12 00807 g002
Figure 3. Experimental system for the EOM program for the generation of Raman laser. The laser passes through a quarter-wave plate, a mirror and a half-wave plate, then on to the PD via a coupler. The modulated signal is observed by the FP. The EOM we used here is EXAIL-NIR-MPX800-LN, and the amplifier we used here is ZRON-8G+. The FP interferometer is SA210-5B, and the PD is RXM1010CF.
Photonics 12 00807 g003
Figure 4. Results of EOM modulation: two identical peaks with a frequency interval of 10 GHz.
Photonics 12 00807 g004
Figure 5. The linewidth of the beat frequency for the OPLL at the −3 dB point is 91.761 kHz, where RBW is set to 300 kHz, VBW is set to 300 kHz and the span is 50 MHz.
Photonics 12 00807 g005
Figure 6. The linewidth of the beat frequency for the EOM at the −3 dB point is 125.94 kHz, RBW is set to 100 kHz, VBW is set to 100 kHz, and the span is 100 MHz.
Photonics 12 00807 g006
Figure 7. Phase noise results: the red curve shows the phase noise of the RF signal, and the purple curve shows the phase noise of the signal after EOM modulation.
Photonics 12 00807 g007
Figure 8. The master laser drift result shows a frequency drift of 3.5 MHz over a period of 6000 s.
Photonics 12 00807 g008
Figure 9. The master laser locked result over a period of 6500 s.
Photonics 12 00807 g009
Figure 10. Long-term stability of the EOM Raman laser scheme was tested over a period of 80,000 s with SAS frequency stabilization.
Photonics 12 00807 g010
Figure 11. Allan variance of the long-term stability of the EOM Raman laser scheme.
Photonics 12 00807 g011
Table 1. Comparison results between the OPLL and the EOM Raman laser schemes.
ParametersOPLL MethodEOM MethodBetter Choice
Linewidth91.761 kHz125.94 kHzOPLL
Phase noise−106 dmc/Hz−90 dBc/HzOPLL
Long-term stabilityGoodModerateOPLL
Laser controlGoodBadOPLL
System complexityHighLowEOM
CostsHighLowEOM
FlexibilityBadGoodEOM
AccuracyHighModerateOPLL
Disclaimer/Publisher’s Note: The statements, opinions and data contained in all publications are solely those of the individual author(s) and contributor(s) and not of MDPI and/or the editor(s). MDPI and/or the editor(s) disclaim responsibility for any injury to people or property resulting from any ideas, methods, instructions or products referred to in the content.