Article

Beam Profile Prediction of High-Repetition-Rate SBS Pulse Compression Using Convolutional Neural Networks

1
School of Information and Communication Engineering, North University of China, Taiyuan 030051, China
2
Shanxi Province Key Laboratory of Intelligent Detection Technology and Equipment, North University of China, Taiyuan 030051, China
3
School of Mechanical and Electrical Engineering, North University of China, Taiyuan 030051, China
*
Author to whom correspondence should be addressed.
Photonics 2025, 12(8), 784; https://doi.org/10.3390/photonics12080784 (registering DOI)
Submission received: 21 June 2025 / Revised: 25 July 2025 / Accepted: 28 July 2025 / Published: 4 August 2025

Abstract

Fast prediction of beam quality in SBS pulse compression for high-repetition-rate operation is urgently important for SBS experimental parameter acquisition. In this study, a fast computational prediction model for SBS beam profiles is developed using a convolutional neural network (CNN) method, which is trained and validated using experimental data from SBS pulse compression experiments. The CNN method can predict beam spot images for experimental conditions in the range of 100–500 Hz repetition rates and 5–40 mJ injection energy. The proposed CNN-based SBS beam profile prediction model has a fast convergence of the loss function and an average error of 15% with respect to the experimental results, indicating a high accuracy of the model. The CNN-based prediction model achieves an average error of 11.8% for beam profile prediction across various experimental conditions, demonstrating its potential for SBS beam profile characterization. The CNN method could provide a fast means for predicting the characteristic law of the beam intensity distribution in high-repetition-rate SBS pulse compression systems.

1. Introduction

Stimulated Brillouin Scattering (SBS) pulse compression is an ultrashort pulse generation method based on nonlinear optical effects, and it efficiently compresses nanosecond-long pulses to the picosecond scale through acousto–optic interactions in the medium [1,2]. The phase coupling between the pump pulse and the Stokes light to form a periodic phonon grating in the Brillouin gain medium [3,4]. SBS pulse compression achieves spectral narrowing and time-domain compression through backscattering. High-repetition-rate, single-longitudinal-mode laser with a narrow-pulse width by the SBS technique has important and wide applications in the fields of Doppler wind radar [5], space debris detection [6], Thomson scattering diagnosis [7], and medical laser esthetics [8].
In the high-repetition-rate SBS pulse compression systems operating above 100 Hz, the continuous pulse laser focusing within the liquid medium leads to significant heat accumulation due to the inherent laser absorption effect [9,10]. This effect induces a nonuniform temperature distribution, thereby creating a refractive index gradient in the liquid medium. Under these conditions, thermally induced scattering, hot spotting, and convective flows can emerge, degrading SBS pulse performance—particularly the quality of the output beam spots [11,12]. To address thermal accumulation at the focal spot in high-repetition-rate SBS systems, our previous work proposed a mitigation strategy using a rotating off-centered lens, which demonstrates effective aberration suppression at intermediate repetition rates [13].
The output energy and energy efficiency of SBS pulse compression were experimentally measured as functions of injected energy at various repetition rates [13,14]. Results indicated that at an injection energy of 20 mJ, the reflected beam spot quality begins to degrade noticeably at repetition rates exceeding 200 Hz. At 400 Hz, the reflected beam spot shows an obvious distortion phenomenon. At an injected energy of 40 mJ and a repetition rate of 200 Hz, the reflected beam spot exhibits pronounced aberrations. A distinct trend is observed where both beam spot distortion and hot spot effects become increasingly severe with higher injection energies and repetition rates. This demonstrates a clear correlation between the input parameters (injected energy and repetition rate) and the reflected beam spot quality.
Understanding the relationship between the input parameters and beam spot quality during SBS pulse compression will be of great interest [10,15]. The pulse compression dynamics in high-repetition-rate SBS systems encompass intricate Multiphysics coupling for optical–thermal–fluid interactions, notably thermal convection, optical breakdown, and thermal distortion. Any SBS computational model that neglects to incorporate these essential Multiphysics coupling mechanisms would be fundamentally inadequate for predictive simulations. However, generating numerically simulated SBS beam profiles that fully incorporate these coupled phenomena presents significant computational challenges.
In this regard, we propose a convolutional neural network (CNN) approach for predicting SBS-compressed beam profiles at varying repetition rates. Leveraging limited experimental data, this method enables reliable prediction of beam spot characteristics across a defined range of operational conditions, with primary focus on injection energy and laser pulse repetition rate. The method provides experimental design references for the application of SBS pulse compression technology in high-repetition-rate, high-power laser systems.

2. SBS Experimental Setup

The SBS pulse compression experimental setup with a double-cell structure used for the experiment is shown in Figure 1. The pump beam is at a wavelength of 1064 nm with an energy of 50 mJ. The pulse width of the laser is 8 ns and it can be operated in the range of 100 to 500 Hz repetition rate. The pump beam diameter is 5 mm. A half-wave plate (HWP) and polarizing beam splitter (PBS) combination is intended for controlling the input beam energy. The pump enters the amplifier cell through a quarter-wave plate (QWP). The beam is focused into a 20 cm long generator cell by rotating off-centered lens L1, which was used to mitigate heat accumulation at the focal spot. The SBS cell was filled with perfluoropolyether liquid HT110. The reflected beam was separated by a system consisting of the QWP and PBS. The reflected beam pattern was imaged near the beam profile camera by a relay imaging system consisting of L2 and L3 and collected by a camera (WinCamD-LCM) made by DataRay Inc. (Monterey, CA, USA).
Using the double-cell SBS compressor shown in Figure 1, we systematically characterized the compressed beam spots across pump energies ranging from 5 to 40 mJ at repetition rates varying between 100 Hz and 500 Hz. The resulting 16 spot profiles at different parameter combinations served as the machine learning training set.

3. Machine Learning for Predicting Beam Spots

3.1. Framework for Machine Learning Model

Figure 2 shows the overall framework of a CNN-based SBS beam profile prediction process. First, the dataset of the neural network is constructed. The parameters of laser repetition rate and injection energy are taken as the input of the neural network. The beam profile data is taken as the output of the neural network. The dataset of the neural network is obtained by combining the input data with the output data. Next, the dataset is fed into the neural network architecture for training. During the training process, the features of the dataset information are extracted through the neural network. After the training is completed, the CNN-based prediction model is obtained. Finally, the laser repetition rate to be measured and the injected energy are input into the model, and then the corresponding beam spot data can be predicted. The CNN-based SBS beam profile prediction function is defined as f M , F , where M and F are the experimental injection energy and laser pulse repetition rate, respectively.

3.2. CNN Model

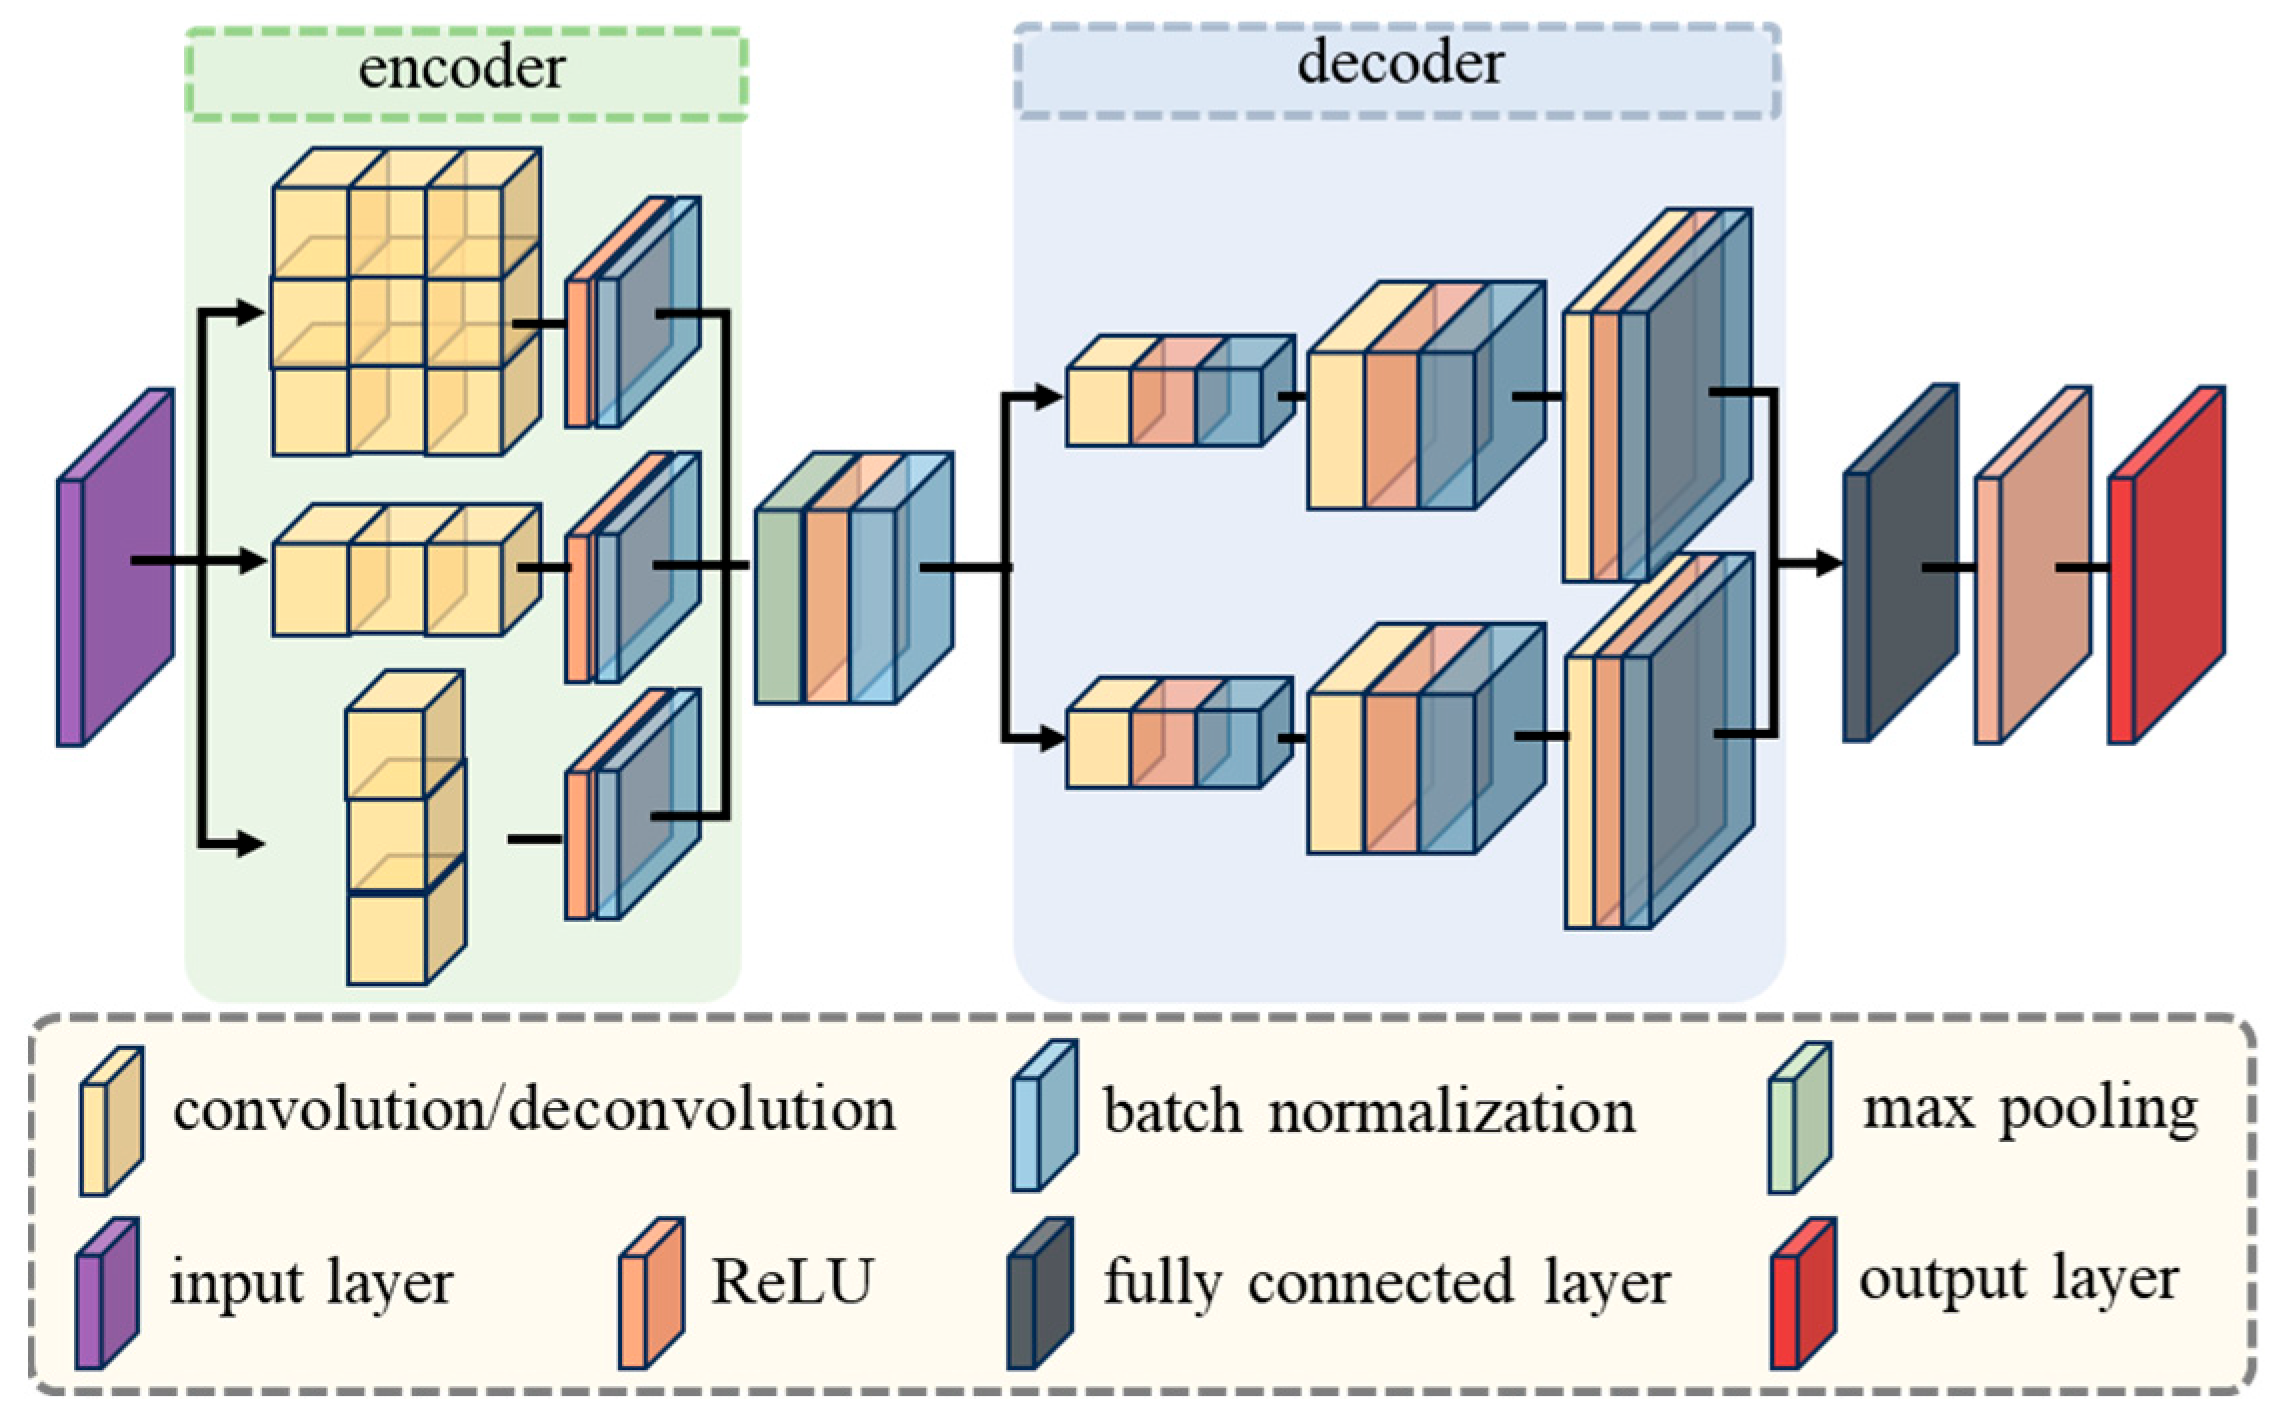
This study proposes an encoder–decoder CNN architecture for beam profile prediction, establishing an intelligent agent model for optical field characterization. The mapping relationship between experimental conditions and beam spot images is established. The surrogate model architecture comprises an experimental condition encoder and two parallel beam profile decoders, with the overall structure illustrated in Figure 3. Among them, the experimental information encoder consists of three parallel convolutional blocks, each of which includes a convolutional layer, a ReLU activation layer, and a batch normalization layer. The spot contour decoder consists of three concatenated deconvolution blocks, each of which includes a deconvolution layer, a ReLU activation layer, and a batch normalization layer. In the experimental condition information encoder, an asymmetric convolutional block is first used to process the input information, and then the output of the encoder is fused by a combination layer. The input of the encoder is the experimental conditional information matrix, and the feature map obtained by convolution is output. In the beam profile decoder, the beam profile matrix data is reconstructed through a parallel inverse convolutional layer and the reduced data is output. The data is then integrated by a fully connected layer to obtain the beam profile data.
In the convolution process, the convolution operation is realized by sliding the convolution kernel over the input data to capture the local features of the input data. It is essentially a matrix transformation with the experimental condition matrix M as the input and the corresponding output feature map can be represented as follows:
X = M F
where ∗ is the two-dimensional convolution operator, F denotes the convolution kernel, and X represents the output feature map. The ReLu activation function is a nonlinear function that can effectively solve the network gradient disappearance during training due to negative outliers, and it can be expressed as follows can be expressed as follows:
R ( X ) = X ,   X 0 0   ,   X < 0
where R is the output matrix of the activation function. Batch normalization (BN) is widely used in the CNN structure. It is based on the principle of normalization operation on the dimensions of each small-batch data channel, which is mainly used to correct the expected value and variance magnitude of each layer of input data. It can make its mean close to 0 and variance close to 1 to reduce overfitting to speed up the training process. The feature map after batch normalization is represented as follows:
Y = R μ γ σ + β
where μ and σ are the mean and variance of the feature channel. γ and β are the scaling factor and offset. The asymmetric convolutional network is designed with reference to the ACNet structure in Ref. [16]. The feature maps extracted by the encoder are fed into parallel light spot image decoders [17]. Each decoder consists of three anti-convolutional blocks for the operation of up-sampling the feature map layer by layer, which zooms in to input the feature map, and reconstructs the detail information of the data. The setup of the deconvolution kernels is performed using a bottleneck structure that is based on the Network in Network approach in the Inception Net architecture [18]. In this case, a 1 × 1 convolution kernel is used to perform a dimensionality reduction followed by dimensionality restoration operation on the input data, and a 3 × 1 convolution kernel is used to reduce the number of channels. This deepens and widens the network while keeping the parameters the same and serves to reduce the computational effort of the neural network.
The fully connected layer converts the spatial information of the feature maps recovered by the decoder into vector form and then performs the final data reconstruction by learning the weights and biases to obtain the output of the model, which is defined as follows:
H = w Y + b
where H is the output of the whole model, w is the weight matrix, and b denotes the bias matrix.

3.3. Definition of Loss Function

Iteration and weight are optimized during network training. In this study, the loss function is computed by forward propagation. The gradient is computed by back propagation and the weights and bias are updated using gradient descent to minimize the loss gradually. The root mean square error (RMSE) was adopted as the loss function to directly optimize pixel-level errors [19,20], enabling more precise quantification of pixel-wise accuracy. RMSE’s functional expression is given as follows:
L = 1 N u = 1 N H i , u H j , u 2
where L is the root mean square error of the neural network, i is the experimentally obtained beam intensity distribution data, j is the beam intensity distribution data calculated by the CNN method, N is the number of grid points, and u is the grid point. The correction process of weights and bias constants is as follows [21]:
w   ( k + 1 ) = w   ( k ) η   L   w
b   ( k + 1 ) = b   ( k ) η   L   b
where k represents the number of corrections and η represents the learning rate, which determines the convergence time of the network.
In this study, Adam’s algorithm [22] is introduced to adapt to the variation in different features and parameters. This method improves training efficiency, speeds up the convergence rate, and improves the accuracy of the prediction of beam spot images.

3.4. Data Preprocessing and Error Evaluation

A total of 16 sets of beam spot images at different frequency rates and energies were sampled at 100–500 Hz repetition rates. The ratio of the number of training sets to the number of test sets is 7:3. To ensure uniform spot image dimensions, the spot images are first cropped into data of the same size through a size cropping process. Secondly, the image is transformed into a grayscale image. Finally, the parameter values are normalized to transform the image into a tensor format suitable for the input of the convolutional neural network. As shown in Figure 4, the preprocessing process consists of size normalization, color space conversion, and pixel normalization.
In the size normalization process, a dynamic scaling strategy that maintains the aspect ratio is used to ensure that the geometric features of the image are not distorted. For the original images I i i = 1 , , 20 , the scaling factor is calculated for each image according to the target size ( H t , W t ) :
s i = max ( H t h i , W t w i )
where si denotes the scaling factor, Ht denotes the target height, hi denotes the original image height, Wt denotes the target width, and wi denotes the original image width. The sample images involved in training are generated by scaling according to the scaling coefficient. The starting point of cropping is determined by the coordinates of the center of the image, and the effective region is retained according to the principle of center cropping. This maximizes the retention of the morphological features of the spot and yields a beam spot image of the same size.
In the color space conversion, the RGB image is converted to grayscale space considering the beam spot distribution as the core feature:
G i = 0.299 R + 0.547 G + 0.114 B
This coefficient complies with the ITU-R BT.601 standard and can accurately reflect the image feature discrimination requirements.
Sample-level normalization needs to be performed for brightness differences due to different acquisition devices:
G ¯ i = G i min ( G i ) max ( G i ) min ( G i ) + ϵ
where G ¯ i denotes the normalized pixel value, G i denotes the current pixel value, and ϵ = 1 0 8 is employed to prevent division by zero error. The pixel values of each image are unified to the [0, 1] interval after normalization. This preserves the within-sample contrast features and eliminates the absolute luminance bias across samples.

3.5. Error Metrics and Loss Function Selection

It should be noted that the experimental data contains significant dark regions where pixel intensity values approach zero. Under such conditions, traditional error evaluation methods suffer from numerical instability—minor absolute errors become dramatically amplified when normalized by near-zero reference values, leading to order-of-magnitude distortions in error metrics. This fundamentally compromises the reliability and physical interpretability of the assessment. Therefore, the regression coefficient (R2), normalized mean absolute error (MAPE) [23], and root mean square error (RMSE) were used as evaluation metrics to comprehensively evaluate the accuracy of the CNN-based prediction model.
MAPE = 1 N u = 1 N H j , u H i , u / mean H
RMSE = 1 N u = 1 N H j , u H i , u 2
R 2 = 1 u = 1 N H j , u H i , u 2 / u = 1 N H ¯ j , u H j , u 2
The CNN-based SBS beam profile prediction model exhibits high predictive accuracy when the following conditions are satisfied: the regression coefficient approaches unity, and both normalized mean absolute error (NMAE) and root mean square error (RMSE) asymptotically approach zero.

4. Results and Discussions

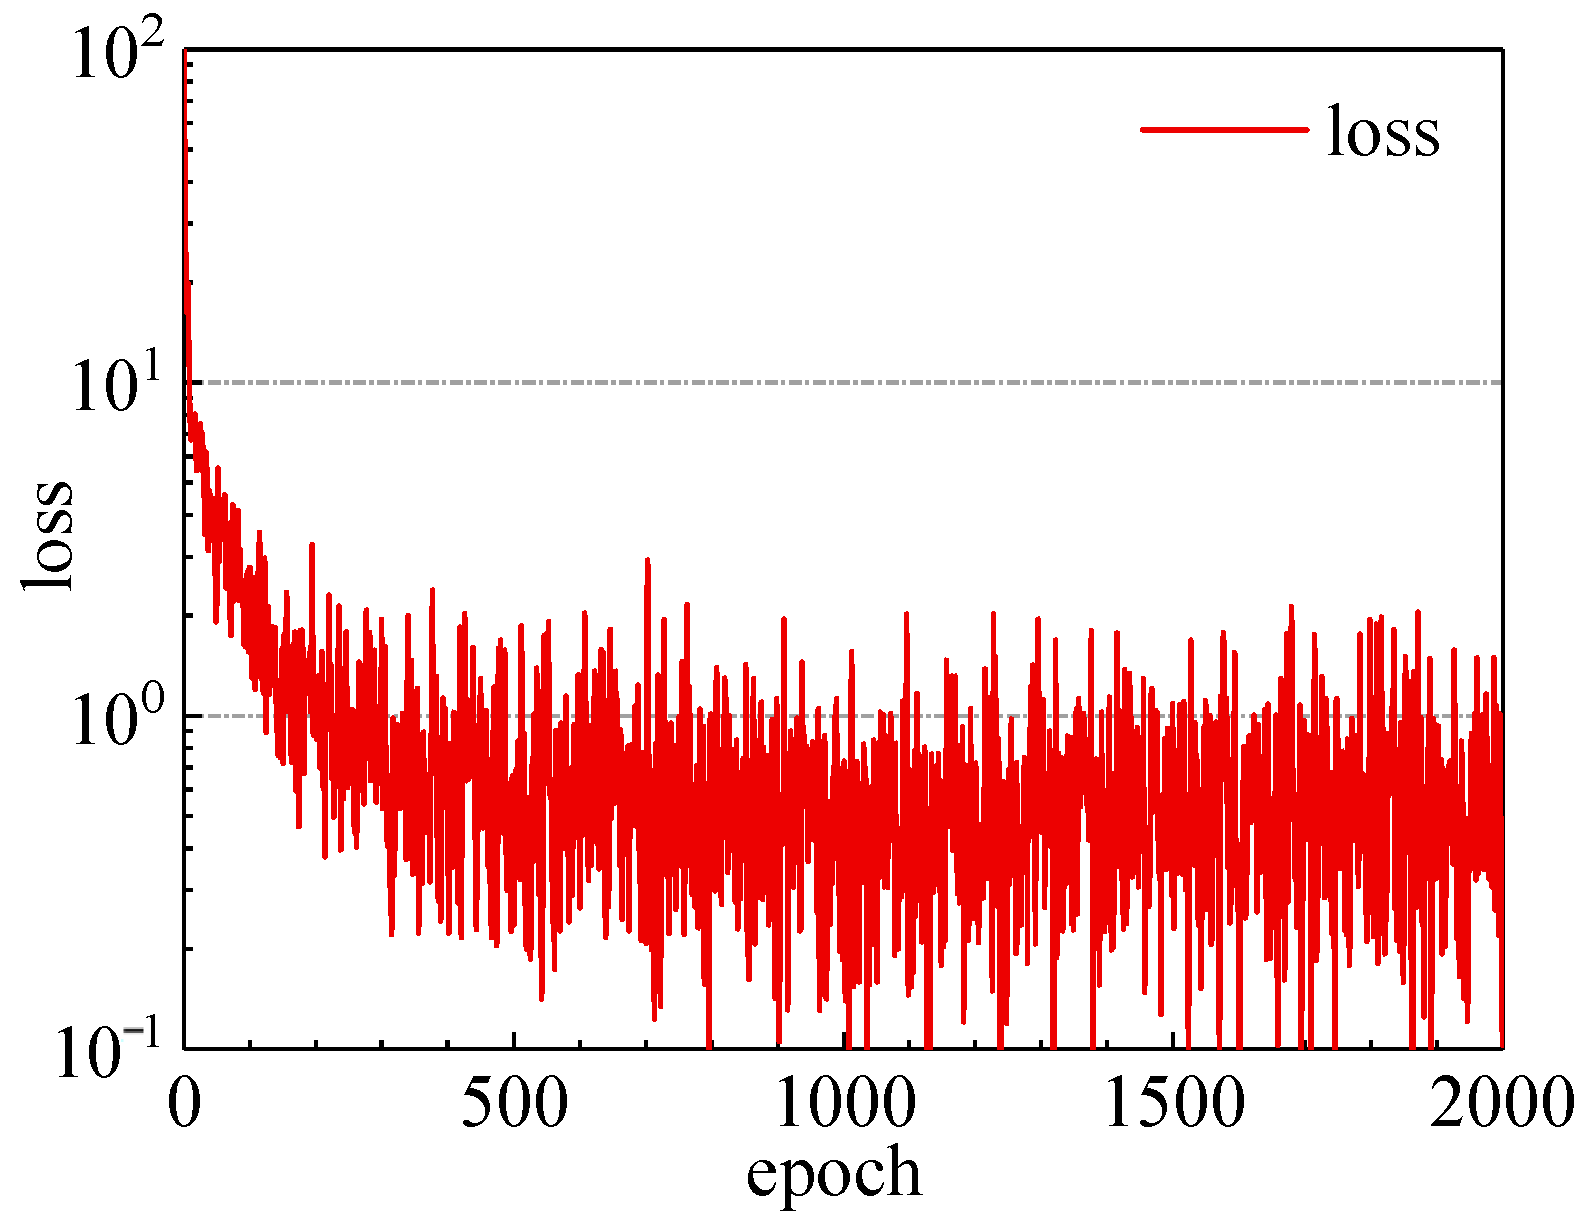
In this study, a small-batch stochastic gradient descent method is used. The learning rate of the training hyperparameters is 0.005, the batch size is 8, the number of training rounds is 2000, and the number of iterations is 2000. Figure 5 demonstrates the loss function convergence curve of the light spot image during the training process. Figure 5 demonstrates that the CNN-based prediction model exhibits significant training oscillations during the initial 2000 iterations before achieving stable convergence. The loss function curve tends to flatten, which indicates that the model converges better.
The model accuracy was calibrated and evaluated using the test set data. The results show that the CNN method predicts results with an average error of 15% and a regression coefficient greater than 0.98, indicating that the model has a high prediction accuracy.
During beam spot prediction validation, the CNN model’s predictive capability is evaluated across four working conditions selected from the test set. The four working experimental conditions are shown in Table 1.
Figure 6 provides a quantitative comparison between experimentally measured and CNN-predicted beam profiles across the test dataset. Figure 6a,b represents the comparative results between the CNN-based prediction results and experimentally measured beam profiles, respectively. It is obvious from the figures that the prediction results of the CNN-based model match well with the intensity distribution of experimental beam spots. The more accurate prediction results are presented in the core region, whereas the errors mostly appear in the background region. This phenomenon is especially obvious in case 4, where the background predicted value is larger than the real value of brightness. The CNN-based prediction model demonstrates accurate beam profile reconstruction in core regions under sparse sampling conditions across varying operational parameters (5–40 mJ, 100–500 Hz).
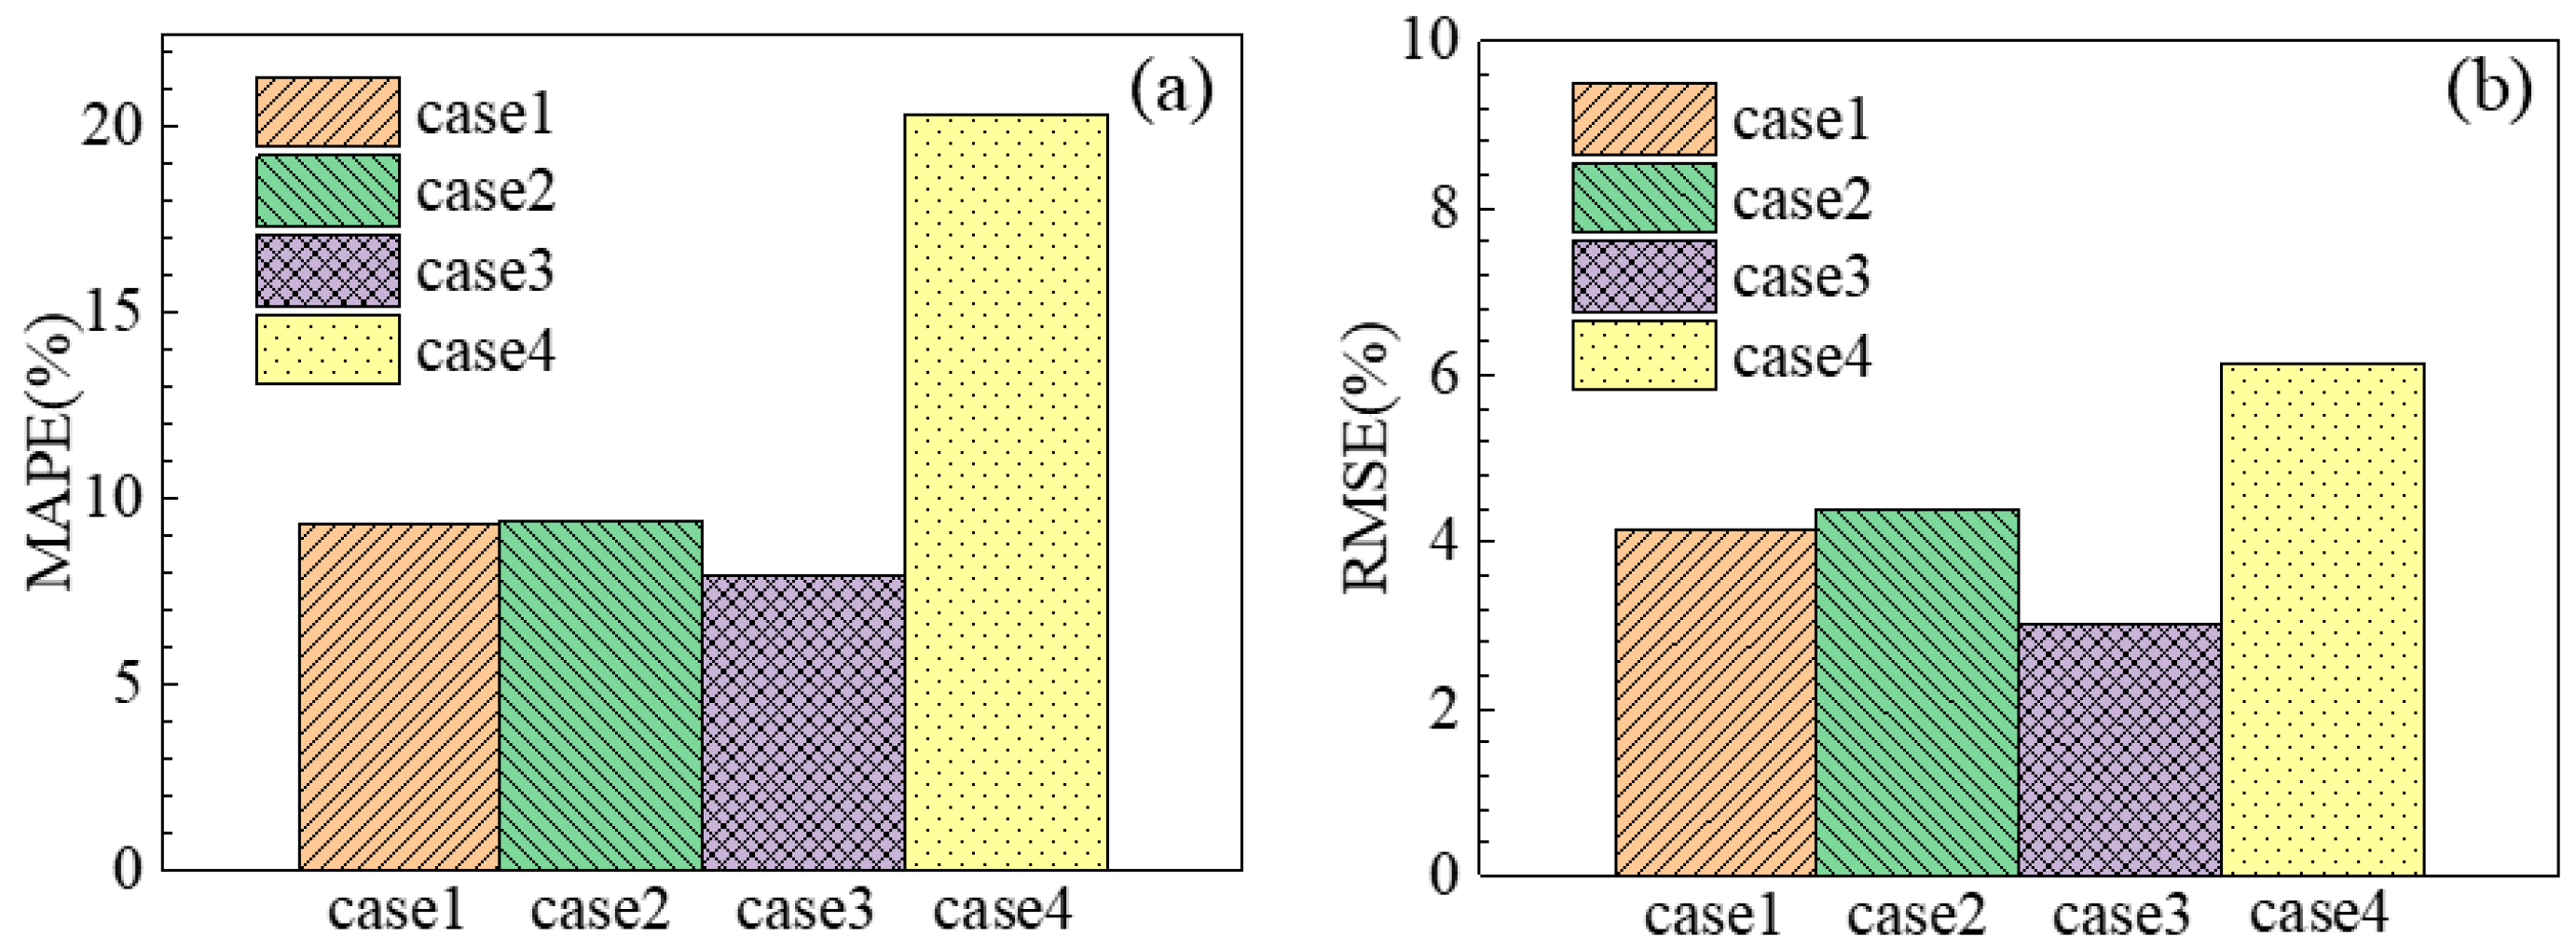
Figure 7 presents a comparative analysis of prediction errors, showing (a) MAPE and (b) RMSE distributions between experimental measurements and CNN-predicted beam profiles across all test conditions. It can be seen from the figure that the minimum error between the predicted and true values is 7.98% and 3.02% under the case 3 working condition, and the maximum error is 20.32% and 6.13% under the case 4working condition. The average errors for the four cases are 11.8% and 4.4%. The experimental results demonstrate that the CNN model accurately predicts beam spot profiles in double-cell SBS pulse compression systems across operational parameters of 5–40 mJ injection energy and 100–500 Hz repetition rates. However, model performance degrades under extreme operational conditions (case 4: 40 mJ at 400 Hz), where thermal distortion effects become predominant.
Under 400 Hz/40 mJ conditions, the predicted results demonstrate systematic underprediction compared to experimental measurements. This is due to insufficient high-frequency/high-energy samples in the training dataset limiting the model’s capacity to learn nonlinear thermal distortion features under extreme operating conditions. The current CNN-based prediction model lacks sufficient ability to recognize severe thermal distortion and struggles to learn the complex thermal–optical coupling rules under extreme conditions. Notably, the model reproduces the ring-like structure and intensity distribution characteristics of the spot, indicating that its ability to capture the core physical mechanism remains effective. For application scenarios where spot contour matching is prioritized, the predictions of the current model still have reference value.

5. Conclusions

In this study, a CNN-based SBS beam profile prediction model is developed for fast prediction of SBS beam spot contours at high repetition rates. The proposed CNN model could accurately predict the beam profiles across the operational parameter space of 100–500 repetition rates and 5–40 mJ injection energy.
The proposed CNN model demonstrates rapid loss function convergence, achieving training stability within 2000 iterations. Quantitative evaluation shows excellent predictive performance, with a mean absolute error of 15% relative to experimental measurements and a near-unity regression coefficient, confirming both high accuracy and robust stability.
The CNN model effectively predicts the SBS pulse compression beam profiles across combined operational parameters of laser repetition rate and laser injected energy. The average error of the beam spot images predicted by the CNN model under different experimental conditions is 11.8%. The results indicate that the model demonstrates satisfactory prediction performance under low-frequency conditions but exhibits reduced capability in capturing beam profile characteristics within high-energy/high-frequency ranges, with an approximate error rate of 20% (case 4: 40 mJ at 400 Hz).
This study pioneers the application of CNN for SBS beam profile prediction, demonstrating the method’s potential value for spot pattern forecasting even with limited datasets. This approach provides an effective tool for investigating characteristic intensity distribution patterns across various SBS experimental operating conditions.

Author Contributions

Conceptualization, Q.N. and H.W.; Methodology, H.W.; Software, Q.N.; Validation, P.Y.; Formal analysis, P.Y. and C.L.; Investigation, P.Y.; Resources, H.W.; Data curation, C.L. and H.W.; Writing—original draft, P.Y. and C.L.; Writing—review & editing, C.L. and H.W.; Visualization, P.Y.; Supervision, Q.N.; Project administration, H.W.; Funding acquisition, H.W. All authors have read and agreed to the published version of the manuscript.

Funding

This research was funded by National Natural Science Foundation of China grant number 62105303.

Institutional Review Board Statement

Not applicable.

Informed Consent Statement

Not applicable.

Data Availability Statement

The data presented in this study are available on request from the corresponding author.

Conflicts of Interest

The authors declare no conflict of interest.

References

  1. Feng, C.; Xu, X.; Diels, J.-C. High-energy sub-phonon lifetime pulse compression by stimulated Brillouin scattering in liquids. Opt. Express 2017, 25, 12421. [Google Scholar] [CrossRef] [PubMed]
  2. Qiu, J.; Tang, X.; Fan, Z.; Wang, H. 200 Hz repetition frequency joule-level high beam quality Nd:YAG nanosecond laser. Opt. Commun. 2016, 368, 68–72. [Google Scholar] [CrossRef]
  3. Liu, F.; Wang, Y.; Cao, C.; Meng, Z.; Man, Z.; Bai, Z.; Lü, Z. Characterization of sub-nanosecond pulse compression based on frequency-detuning SBS. Opt. Express 2023, 32, 2281. [Google Scholar] [CrossRef]
  4. Li, H.; Zhao, B.; Jin, L.; Wang, D.; Gao, W. Flat gain over arbitrary orbital angular momentum modes in Brillouin amplification. Photon Res. 2019, 7, 748–753. [Google Scholar] [CrossRef]
  5. Zhang, X.; Dai, J.; He, T.; Zhao, C.; Huang, J.; Li, X.; Huang, G.; Cao, H. Overview of the Chinese lidar satellite development. In Proceedings of the LIDAR Imaging Detection and Target Recognition 2017, Changchun, China, 23–25 July 2017; SPIE: Washington, DC, USA, 2017. [Google Scholar] [CrossRef]
  6. Fan, Z.; Qiu, J.; Tang, X.; Bai, Z.; Kang, Z.; Ge, W.; Wang, H.; Liu, H.; Liu, Y. A 100 Hz 3.31 J all-solid-state high beam quality Nd:YAG laser for space debris detecting. Chin. J. Phys. 2017, 66, 054205. [Google Scholar]
  7. Hatae, T.; Naito, O.; Nakatsuka, M.; Yoshida, H. Applications of Phase Conjugate Mirror to Thomson Scattering Diagnostics. Rev. Sci. Instrum. 2006, 77, 191–210. [Google Scholar] [CrossRef]
  8. Baumler, W.; Weiss, K. Laser Assisted Tattoo Removal-State of the Art and New Developments. Photochem. Pho Tobiol. Sci. 2019, 18, 349–358. [Google Scholar] [CrossRef] [PubMed]
  9. Kang, Z.; Fan, Z.; Huang, Y.; Zhang, H.; Ge, W.; Li, M.; Yan, X.; Zhang, G. High-repetition-rate, high-pulse-energy, and high-beam-quality laser system using an ultraclean closed-type SBS-PCM. Opt. Express 2018, 26, 6560. [Google Scholar] [CrossRef] [PubMed]
  10. Wang, H.; Seongwoo, C.; Kong, H.J.; Wang, Y.; Lu, Z. Thermal suppression of high-repetition rate SBS pulse compression in liquid media. Opt. Express 2022, 30, 38995–39013. [Google Scholar] [CrossRef] [PubMed]
  11. Chen, Y.; Tan, B.; Jin, D.; Chen, B.; Bai, Z.; Wang, K.; Wang, Y.; Lü, Z. Characteristics and suppression of beam distortion in a high repetition rate nanosecond stimulated Brillouin scattering phase conjugation mirror. High Power Laser Sci. Eng. 2024, 12, 10. [Google Scholar] [CrossRef]
  12. Park, S.; Cha, S.; Oh, J.; Lee, H.; Ahn, H.; Churn, K.S.; Kong, H.J. Coherent beam combination using self-phase locked stimulated Brillouin scattering phase con-jugate mirrors with a rotating wedge for high power laser generation. Opt. Express 2016, 24, 008641. [Google Scholar] [CrossRef] [PubMed]
  13. Wang, H.; Cha, S.; Kong, H.J.; Wang, Y.; Lu, Z. Rotating off-centered lens in SBS phase conjugation mirror for high-repetition-rate operation. Opt. Express 2019, 27, 009895. [Google Scholar] [CrossRef] [PubMed]
  14. Wang, H.; Cha, S.; Kong, H.J.; Wang, Y.; Lü, Z. Sub-nanosecond stimulated Brillouin scattering pulse compression using HT270 for kHz repetition rate operation. Opt. Express 2019, 27, 29789. [Google Scholar] [CrossRef] [PubMed]
  15. Wang, K.; Tan, B.; Chen, Y.; Wang, Y.; Bai, Z.; Lu, Z. Effect of pump light repetition rate on thermal convection characteristics in liquid SBS-PCM. Infrared Laser Eng. 2023, 52, 20230415. [Google Scholar]
  16. Ding, X.H.; Guo, Y.C.; Ding, G.G.; Han, J. ACNET: Strengthening the kernel skeletons for powerful CNN via asymmetric convolution blocks. In Proceedings of the IEEE/CVF International Conference on Computer Vision, Seoul, Republic of Korea, 27 October–2 November 2019; IEEE: New York, NY, USA, 2019; pp. 1911–1920. [Google Scholar]
  17. Hou, S.; Liu, X.; Wang, Z. DualNet: Learn Complementary Features for Image Recognition. In Proceedings of the IEEE International Conference On Computer Vision, Venice, Italy, 22–29 October 2017; pp. 502–510. [Google Scholar] [CrossRef]
  18. Singh, T.; Vishwakarma, D.K. A deep multimodal network based on bottleneck layer features fusion for action recognition. Multimed. Tools Appl. 2021, 80, 33505–33525. [Google Scholar] [CrossRef]
  19. Jaiswal, R.; Singh, B. A Comparative Study of Loss Functions for Deep Neural Networks in Time Series Analysis. In Proceedings of the International Conference on Big Data, Machine Learning, and Applications; Springer Nature: Singapore, 2021; pp. 147–163. [Google Scholar]
  20. Arize, D.; Rios, T.N. A comparison study on time series forecasting given smart grid load uncertainties. In Proceedings of the 2019 8th Brazilian Conference on Intelligent Systems (BRACIS), Salvador, Brazil, 15–18 October 2019; IEEE: New York, NY, USA, 2019; pp. 257–262. [Google Scholar]
  21. Wu, S.; Li, G.; Deng, L.; Liu, L.; Xie, Y.; Shi, L. L1-norm batch normalization for efficient training of deep neural networks. IEEE Trans. Neural Netw. Learn. Syst. 2018, 30, 2043–2051. [Google Scholar] [CrossRef] [PubMed]
  22. Kingma, D.P.; Ba, J. Adam: A Method for Stochastic Optimization. In Proceedings of the 3rd International Conference on Learning Representations, San Diego, CA, USA, 7–9 May 2015; ICLR: La Jolla, CA, USA, 2015; pp. 1–15. [Google Scholar] [CrossRef]
  23. Alipour, M.; Aghaei, J.; Norouzi, M.; Niknam, T.; Hashemi, S.; Lehtonen, M. A novel electrical net-load forecasting model based on deep neural networks and wavelet transform integration. Energy 2020, 205, 118106. [Google Scholar] [CrossRef]
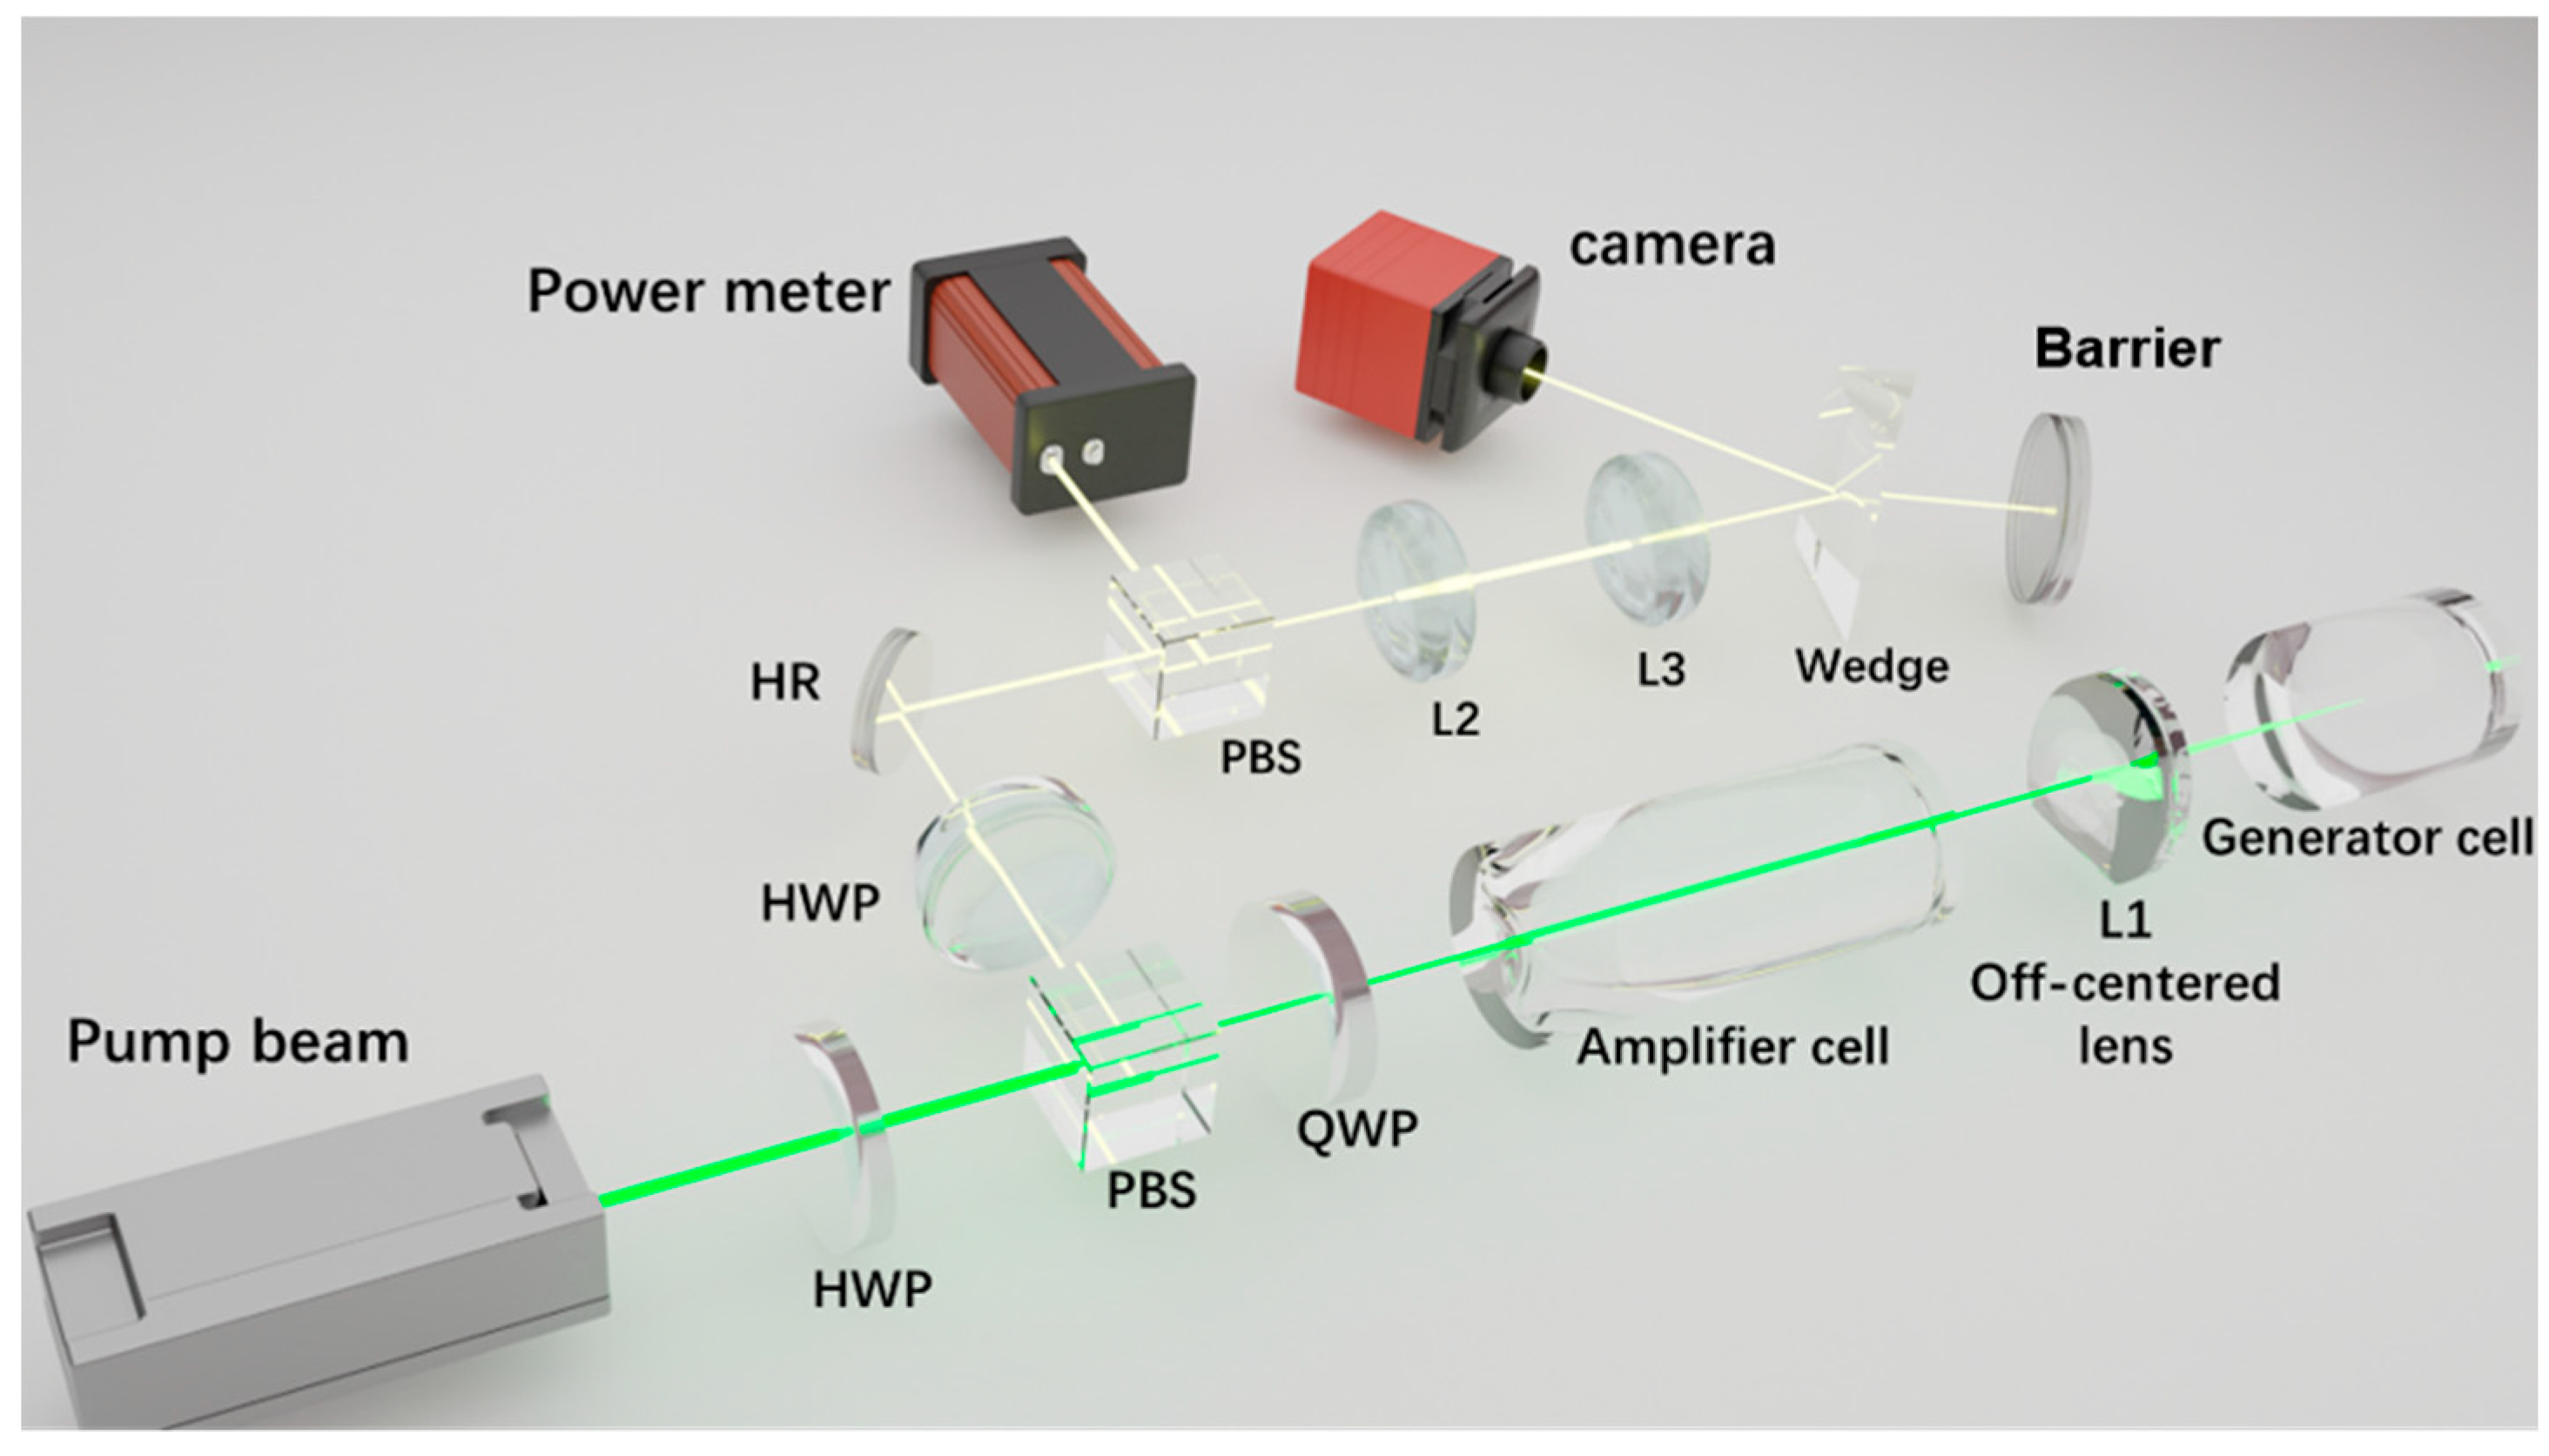
Figure 1. Experimental optical path diagram of SBS pulse compression.
Photonics 12 00784 g001
Figure 2. CNN-based framework for SBS beam profile prediction.
Photonics 12 00784 g002
Figure 3. CNN-based network architecture for SBS beam profile prediction.
Photonics 12 00784 g003
Figure 4. Size and grayscale transformation of beam spot contours.
Photonics 12 00784 g004
Figure 5. Loss function curve.
Photonics 12 00784 g005
Figure 6. Comparison of the numerical method calculation and CNN-based predicted beam spot contours in the test set data: (a) CNN results and (b) experimental data.
Photonics 12 00784 g006
Figure 7. (a) MAPE and (b) RMSE distributions between the experimental measurements and the prediction results of CNN-based method in the test set data.
Photonics 12 00784 g007
Table 1. Experimental condition settings on the test set.
CaseM/HzF/mJ
110010
210030
330020
440040
Disclaimer/Publisher’s Note: The statements, opinions and data contained in all publications are solely those of the individual author(s) and contributor(s) and not of MDPI and/or the editor(s). MDPI and/or the editor(s) disclaim responsibility for any injury to people or property resulting from any ideas, methods, instructions or products referred to in the content.