Abstract
Stress fields imparted with an ultrafast laser can correct low spatial frequency surface figure error of mirrors through ultrafast laser stress figuring (ULSF): the formation of nanograting structures within the bulk substrate generates localized stress, creating bending moments that equilibrize via wafer deformation. For ULSF to be used as an optical figuring process, the ultrafast laser generated stress must be effectively permanent or risk unwanted figure drift. Two isochronal annealing experiments were performed to measure ultrafast laser-generated stress stability in fused silica and Corning ultra-low expansion (ULE) wafers. The first experiment tracked changes to induced astigmatism up to 1000 °C on 25.4 mm-diameter wafers. Only small changes were measured after each thermal cycle up to 500 °C for both materials, but significant changes were observed at higher temperatures. The second experiment tracked stress changes in fused silica and ULE up to 500 °C but with 4 to 16× higher signal-to-noise ratio. Change in trefoil on 100 mm-diameter wafers was measured, and the induced stress in fused silica and ULE was found to be stable after thermal cycling up to 300 °C and 200 °C, respectively, with larger changes at higher temperatures.
1. Introduction
Glass exposed to focused ultrafast laser pulses exhibits local morphological changes to the bulk substrate [1]. At low pulse energies and repetition rates, quasi-periodic self-organized structures (“nanogratings”) form, oriented perpendicular to the polarization direction [2,3]. The nanogratings are associated with permanent strain, imparting a spatially varying stress field within the substrate, which responds by bending to equilibrize the ultrafast laser-induced stresses. The laser-induced stress is nominally permanent, but its stability has not been studied in detail.
Ultrafast laser stress figuring (ULSF) leverages the laser-induced stress to deterministically alter the optical figure and correct low order spatial frequency height errors up to several micrometers as a post-coating figuring process [4]. The stress pattern produces deformation akin to a thin film with a spatially varying state of plane stress and thickness . By imparting a pre-determined stress distribution, ULSF has been shown to correct up to 6th order Zernike polynomial modes with 10–20 nm RMS accuracy in 100 mm-diameter, 1 mm-thick fused silica substrates, for example [5].
Research on the stability of ultrafast laser-induced modifications and resultant birefringence have previously shown only small changes after low temperature annealing, with lifetimes predicted over 10 years at 800 °C, and fiber Bragg gratings in silica continue to perform well after being exposed to temperatures up to 1000 °C [6,7,8,9,10]. This suggests that ULSF-generated stress fields may also be stable, but the lifetime stability of the induced stress field itself has not yet been rigorously tested. To address this lack of data, we investigate the stability of ULSF modifications in uncoated fused silica (FS) and Corning ultra-low expansion (ULE) glass through a series of isochronal annealing experiments on 25.4 mm- and 100 mm-diameter wafers figured with single-Zernike term deformation. By exposing laser-figured samples to increasingly elevated temperatures, each at constant duration (i.e., isochronal), we examine the thermal stability of ultrafast laser-generated stress states in both materials. We track 15 Zernike terms throughout the thermal cycling regimen and find the stress state to be stable up to about 200–250 °C, with greater (though still small) changes in magnitude at higher temperatures for both fused silica and ULE. In Section 2 we detail materials and methods used to prepare study samples with ULSF and carry out the isochronal annealing regimen. Results of both experiments are reported in in detail in Section 3. Finally, we discuss potential sources of the observed response to thermal cycling in Section 4.
2. Materials and Methods
Two experiments were conducted to examine the stability of ultrafast laser-generated stress in fused silica and ULE glass. Experiment 1 included 16 25.4 mm-diameter samples, and Experiment 2 included five 100 mm-diameter samples to obtain higher measurement sensitivity. ULSF was used to induce deformation composed of a single Zernike polynomial: astigmatism 0° () for Experiment 1 and trefoil 30° () for Experiment 2. After ULSF, the wafers were thermally cycled between 50 and 1000 °C (Experiment 1) or 100 and 500 °C (Experiment 2). We tracked 15 Zernike terms over the course of the isochronal annealing regimen, most of which did not change significantly.
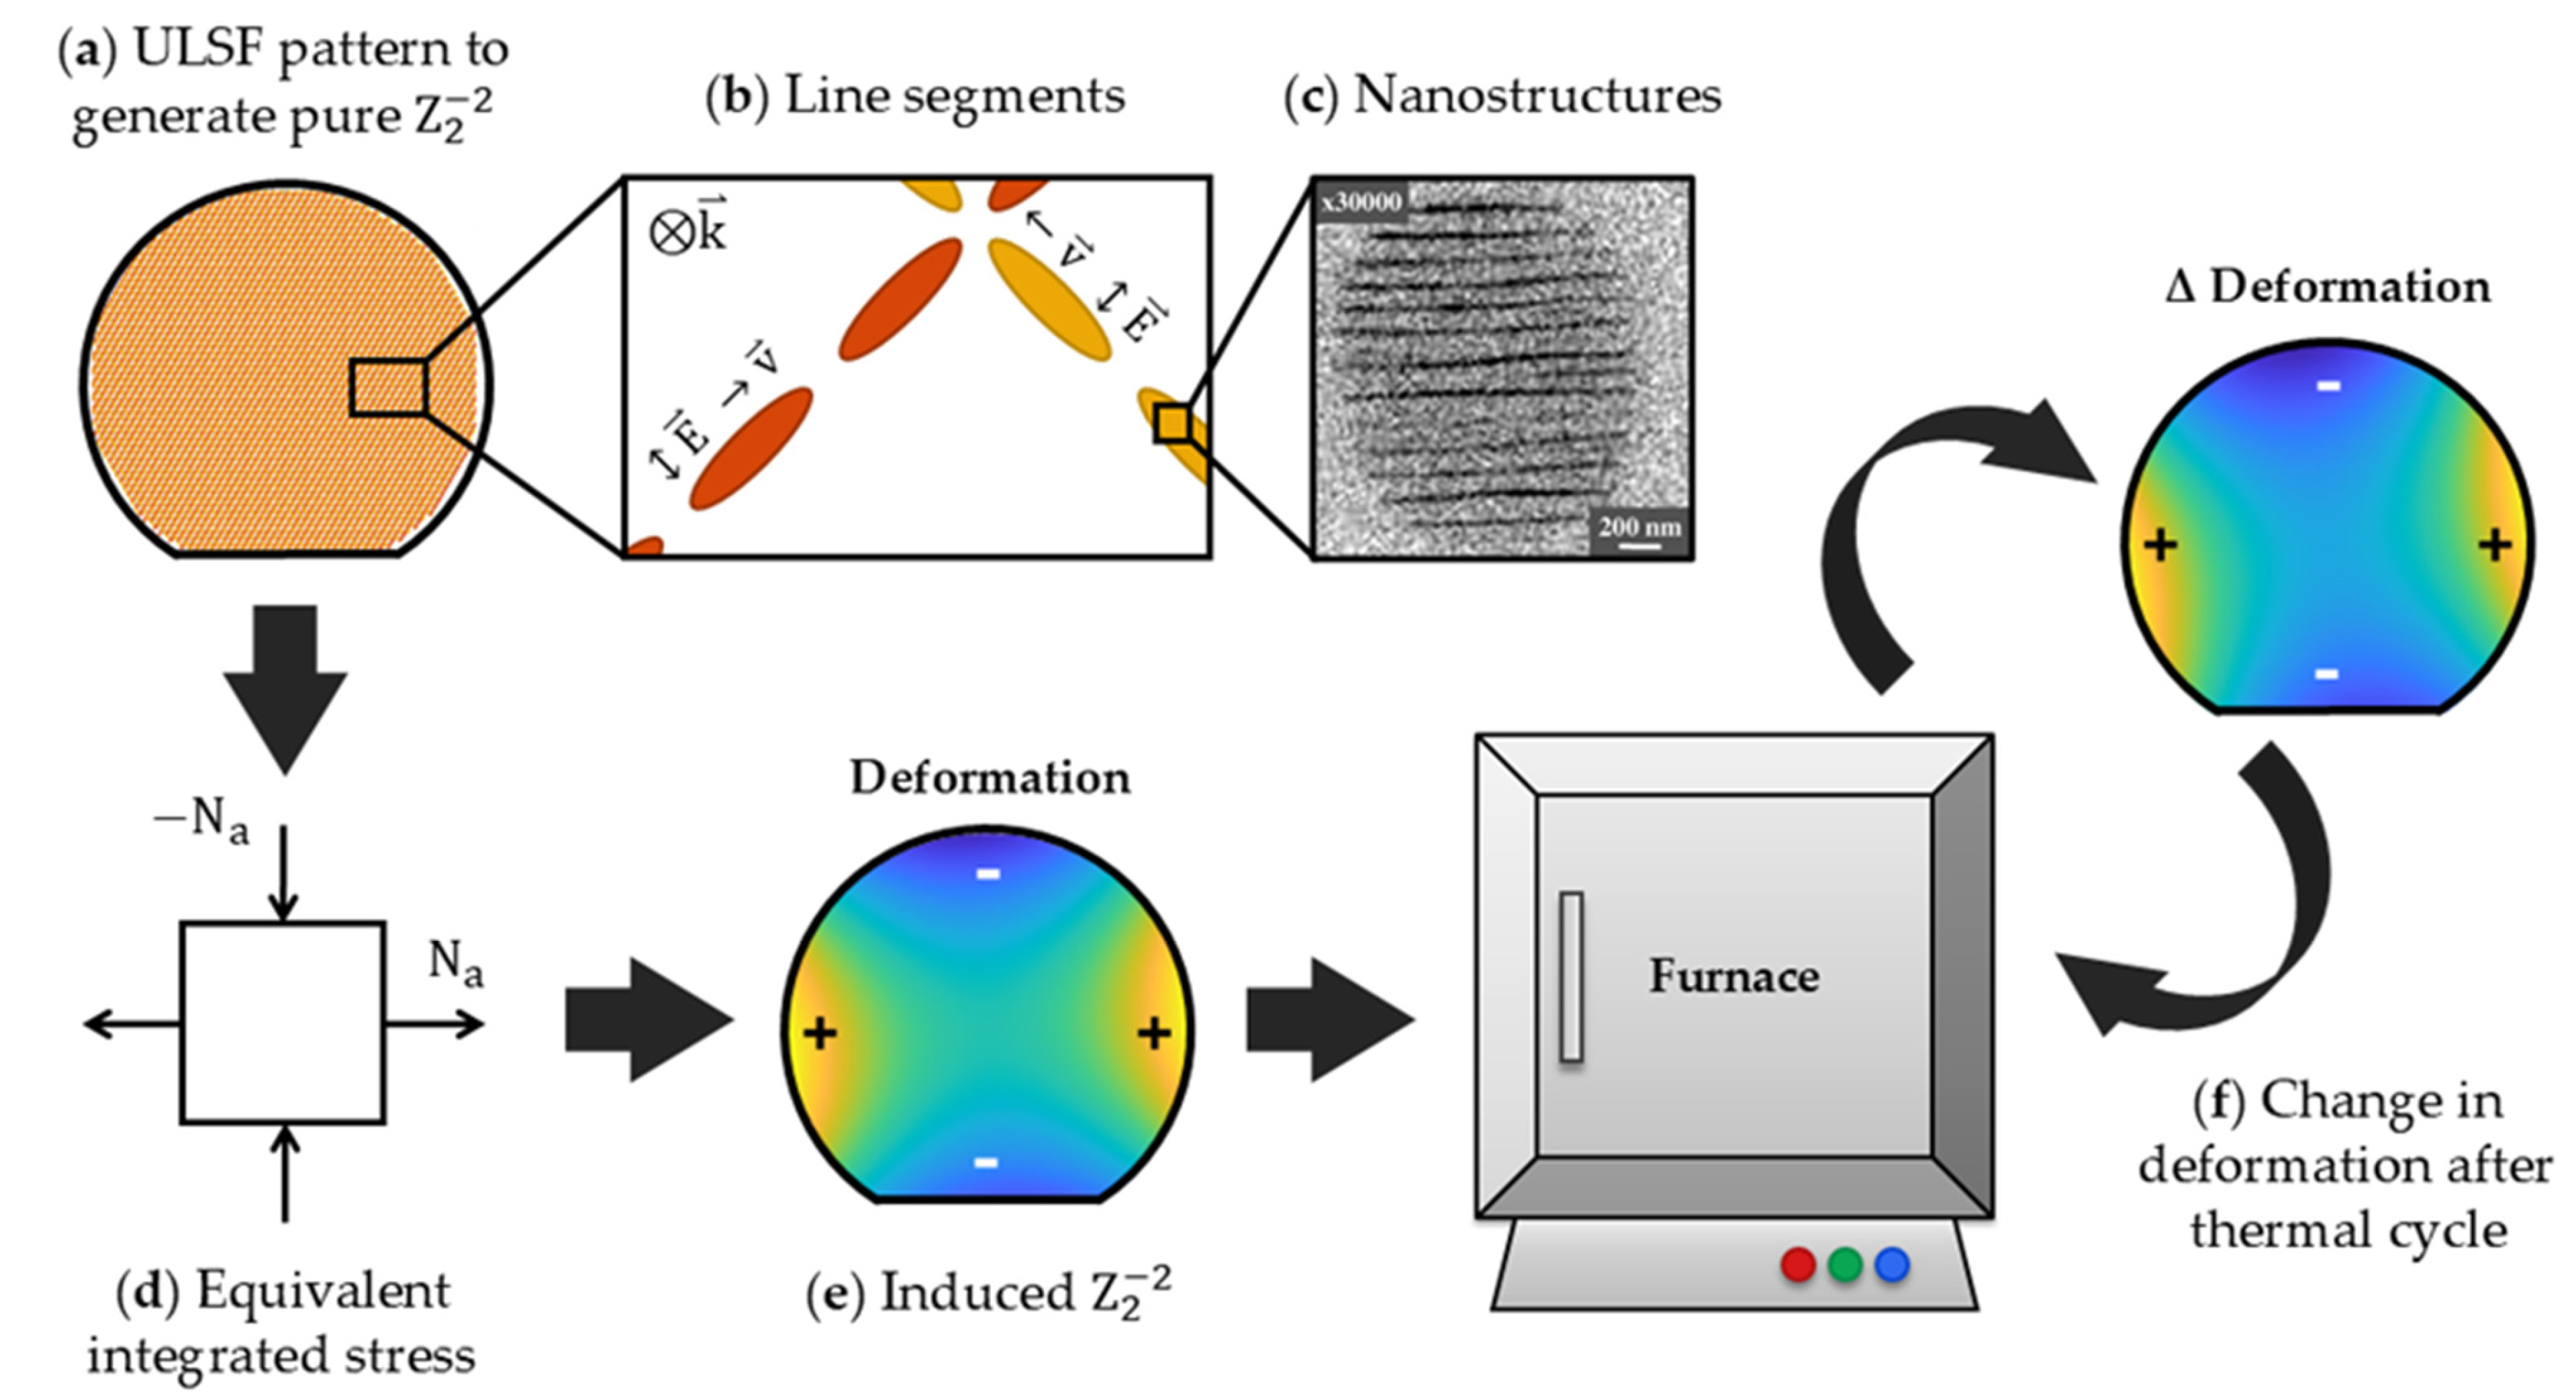
ULSF was used to induce either astigmatism 0° or trefoil 30° using pulse patterns generated for each wafer and the target deformation (Figure 1a). A convenient representation of the plane stress state are the equibiaxial (), antibiaxial (), and shear () integrated stress states, which for uniform stress distributions produce deformation corresponding to the Zernike polynomials power (), astigmatism 0° (), and astigmatism 45° (), respectively [5]. Nanogratings resulting from ultrafast laser pulses were written in 5–45 μm “line segments” within the substrate at several orientations and depths (Figure 1a–c). The equivalent stress state for patterns inducing astigmatism 0° (Figure 1d) consists of orthogonal, opposite plane stress components producing antibiaxial stress; the stress state for patterns inducing trefoil 30° consists of a combination of non-uniform antibiaxial stress and shear stress (shear stress is equivalent to a 45–rotated antibiaxial stress). The wafer bends to maintain static equilibrium in response to ULSF-induced stress (Figure 1e). The wafer shape changes in response to annealing (Figure 1f).

Figure 1.
Process flow for Experiments 1 and 2. (a) ULSF pulse patterns are generated for the target deformation. (b) Laser-induced modifications are written in 5–45 μm “segments” at varying orientations and depths within the substrate. Polarization direction and write direction are indicated along the segment write paths, and laser propagation vector is indicated on the top left. (c) Secondary electron image of ultrafast laser-generated nanostructures (“nanogratings”) [11], reproduced with permission from Y. Shimotsuma, Phys. Rev. Lett.; published by American Physical Society, 2003. (d) The equivalent antibiaxial stress state for ULSF patterns inducing astigmatism 0° consists of components producing orthogonal and opposite curvatures [3,4]. (e) Wafer deformation resulting from writing the ULSF pulse pattern. (f) The samples are thermally cycled in a furnace with a 4-h dwell at the target temperature, resulting in a change in overall wafer deformation.
For most samples, a commercial ultrafast laser (TruMicro 2030, Trumpf GmbH + Co. KG., Stuttgart, Germany) was used for ULSF, with a λ = 1030 nm source beam, 350 fs pulse duration, 1 μJ pulse energy, and 200 kHz repetition rate. The pulses were focused into the substrate with a NA 0.4 objective lens (LMH-20X-1064, Thorlabs Inc., Newton, NJ, USA) and translated with an XYZ stage (PRO165LM-200, Planar DL-200 XY, Aerotech, Inc., Pitttsburgh, PA, USA) across the substrate, with a segment length and pitch of 45 and 50 μm, respectively. The samples were either 25.4 mm-diameter or 100 mm-diameter double-side polished, uncoated wafers, made of Corning 7980 fused silica or Corning ULE 7972. The 25.4 mm-diameter fused silica wafers were 0.5 mm-thick, and all others were 1 mm-thick. All wafers had an orientation flat to facilitate metrology.
Most wafers were figured with ULSF then thermally cycled. Some wafers (“hot controls”) were not figured but were thermally cycled, and some wafers (“cold controls”) were neither figured nor thermally cycled. All figured and hot control wafers were thermally cycled in a high temperature furnace (KSL-1200X, MTI Corp., Richmond, CA, USA) at multiple dwell temperatures. The ramp rate was 6 °C per minute, and the dwell time for all cycles was 4 h, after which the furnace was shut off and the samples allowed to cool back down to 50 °C. An additional 30 min dwell was added for cycles over 500 °C at 65–75% of the target dwell temperature to mitigate ramp deceleration. The temperature was monitored using a thermocouple (XC-20-K-60, DwyerOmega, Michigan City, IN, USA). The ULE samples were thoroughly cleaned and contained within fused silica trays for the 1000 °C thermal cycle to prevent crystallization due to the risk of nucleation in the presence of atmospheric contaminants within the furnace at elevated temperatures [12].
To monitor changes in surface figure, all wafers including controls were measured on a phase-shifting Fizeau interferometer (S100|HR, Äpre Instruments, Tucson, AZ, USA) with variable coherence source illumination (SpectrÄ Gen4, Äpre Instruments, Tucson, AZ, USA) after each thermal cycle, mounted on a hexapod (Puna STD11, Symétrie, Nimes, France) for positioning with respect to a transmission flat. Zernike coefficient data was extracted and analyzed with custom software that was also used to prepare machine code to produce ULSF patterns. Equibiaxial, antibiaxial, and shear integrated stress was calculated using a modified Stoney’s equation [5].
2.1. Experiment 1
Six fused silica wafers (25.4 mm-diameter, 0.5 mm-thick) and six ULE wafers (25.4 mm-diameter, 1 mm-thick) were figured with ULSF to produce astigmatism 0° () with three different magnitudes of stress. Astigmatism 0° was chosen as the deformation term because it has a large ratio of deformation to stress. The magnitude of figured astigmatism 0° ranged from 1.1 to 3.7 μm RMS for the fused silica wafers and 0.3 to 1.2 μm RMS for the ULE wafers, corresponding to 90–350 N/m integrated antibiaxial stress (Table 1). Two additional unfigured wafers of each material were used as controls for each material; one was never annealed (cold control, FS 1 and ULE 1), and the other completed the thermal cycling regimen with the figured wafers (hot control, FS 2 and ULE 2). The 12 figured wafers and 2 hot controls were thermally cycled at dwell temperatures from 50 to 500 °C in 50 °C increments and at 750 °C and 1000 °C.

Table 1.
Samples used in Experiments 1 and 2.
2.2. Experiment 2
One fused silica and two ULE wafers (100 mm-diameter, 1.0 mm-thick) were figured with approximately 2 μm RMS trefoil 30° () in order to detect smaller changes in integrated stress (Table 1). The deformation caused by a change in stress is proportional to the square of the diameter-to-thickness ratio of the substrate, so these wafers are 4–16× more sensitive than those in Experiment 1. Trefoil 30° is preferred for wafers with larger aspect ratios due to mount-induced astigmatic deformation during measurement.
FS B, ULE B, and ULE C were figured with the same laser parameters as in Experiment 1, except ULE C was figured with a 225 kHz repetition rate as we used a slightly different calibration to generate the ULSF pattern; similar repetition rates do not significantly alter the ULSF result when all other processing parameters are held. Additionally, the segment length and pitch were 20 and 25 μm for FS B and 5 and 10 μm for ULE B. The wafers were thermally cycled between 100 and 500 °C with steps of 100 °C between cycles. We monitored the average root sum squared (RSS) of both trefoil 30° and trefoil 0° to reduce error from small clocking differences between measurements on the interferometer.
3. Results
The samples in both studies show little change within a region of stress stability up to 200 °C, after which larger changes are observed in the figured term, and other low-order Zernike coefficients up to 500 °C (Figure 2, Figure 3 and Figure 4). Further changes to power, astigmatism 0°, and astigmatism 45° after cycling the 25.4 mm-diameter sample set to 750 °C and 1000 °C (Figure 5 and Figure 6) indicate a separate stress response regime at the hottest temperatures.
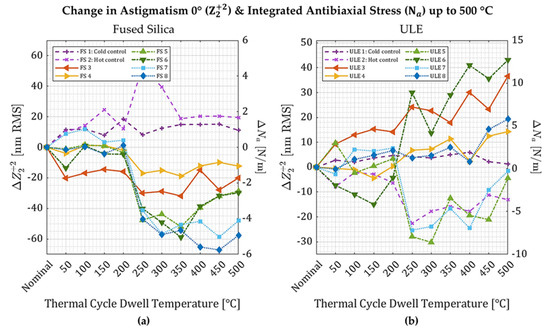
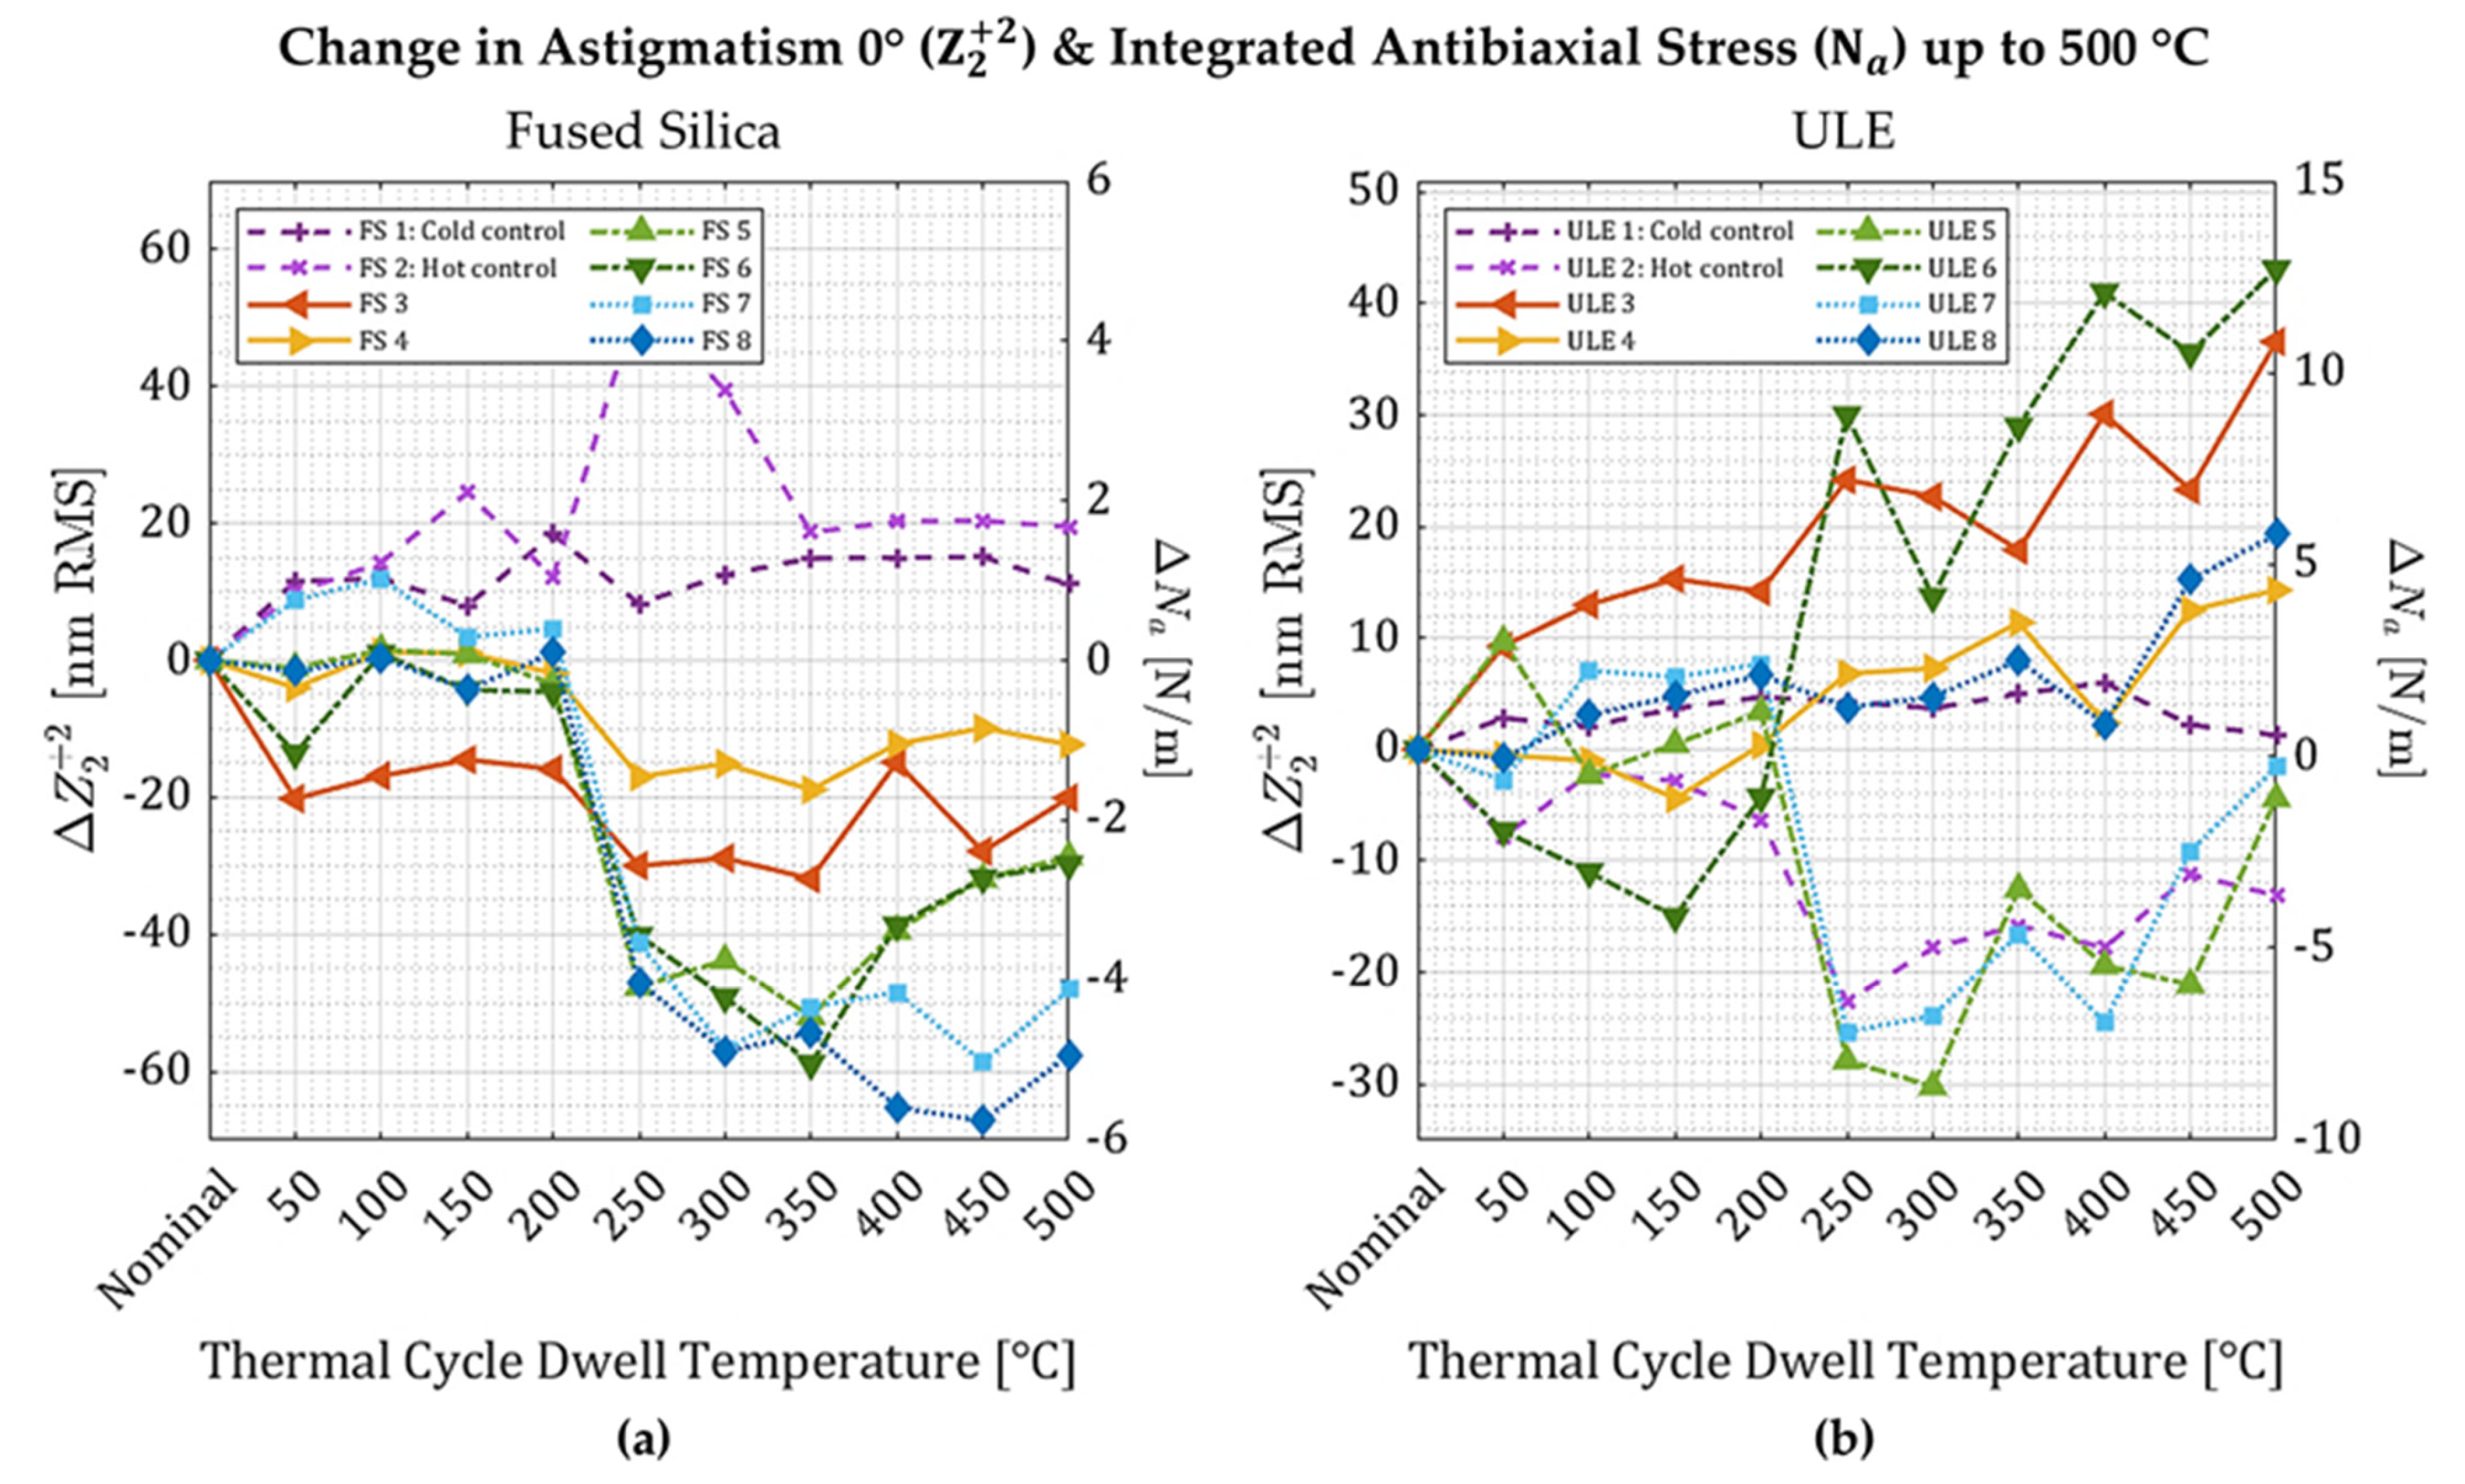
Figure 2.
Changes in astigmatism 0° (left axis) and integrated antibiaxial stress (right axis) for fused silica (a) and ULE (b) samples in Experiment 1. The 2-sigma error for astigmatism 0° is ±2.5 nm RMS, corresponding to ±0.2 N/m for fused silica (0.5 mm-thick) and ±0.7 N/m for ULE (1 mm-thick). Relaxation is in the negative direction.
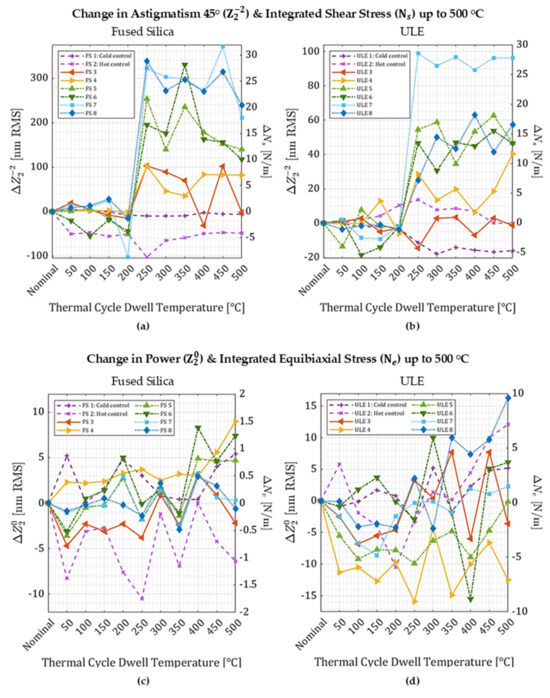
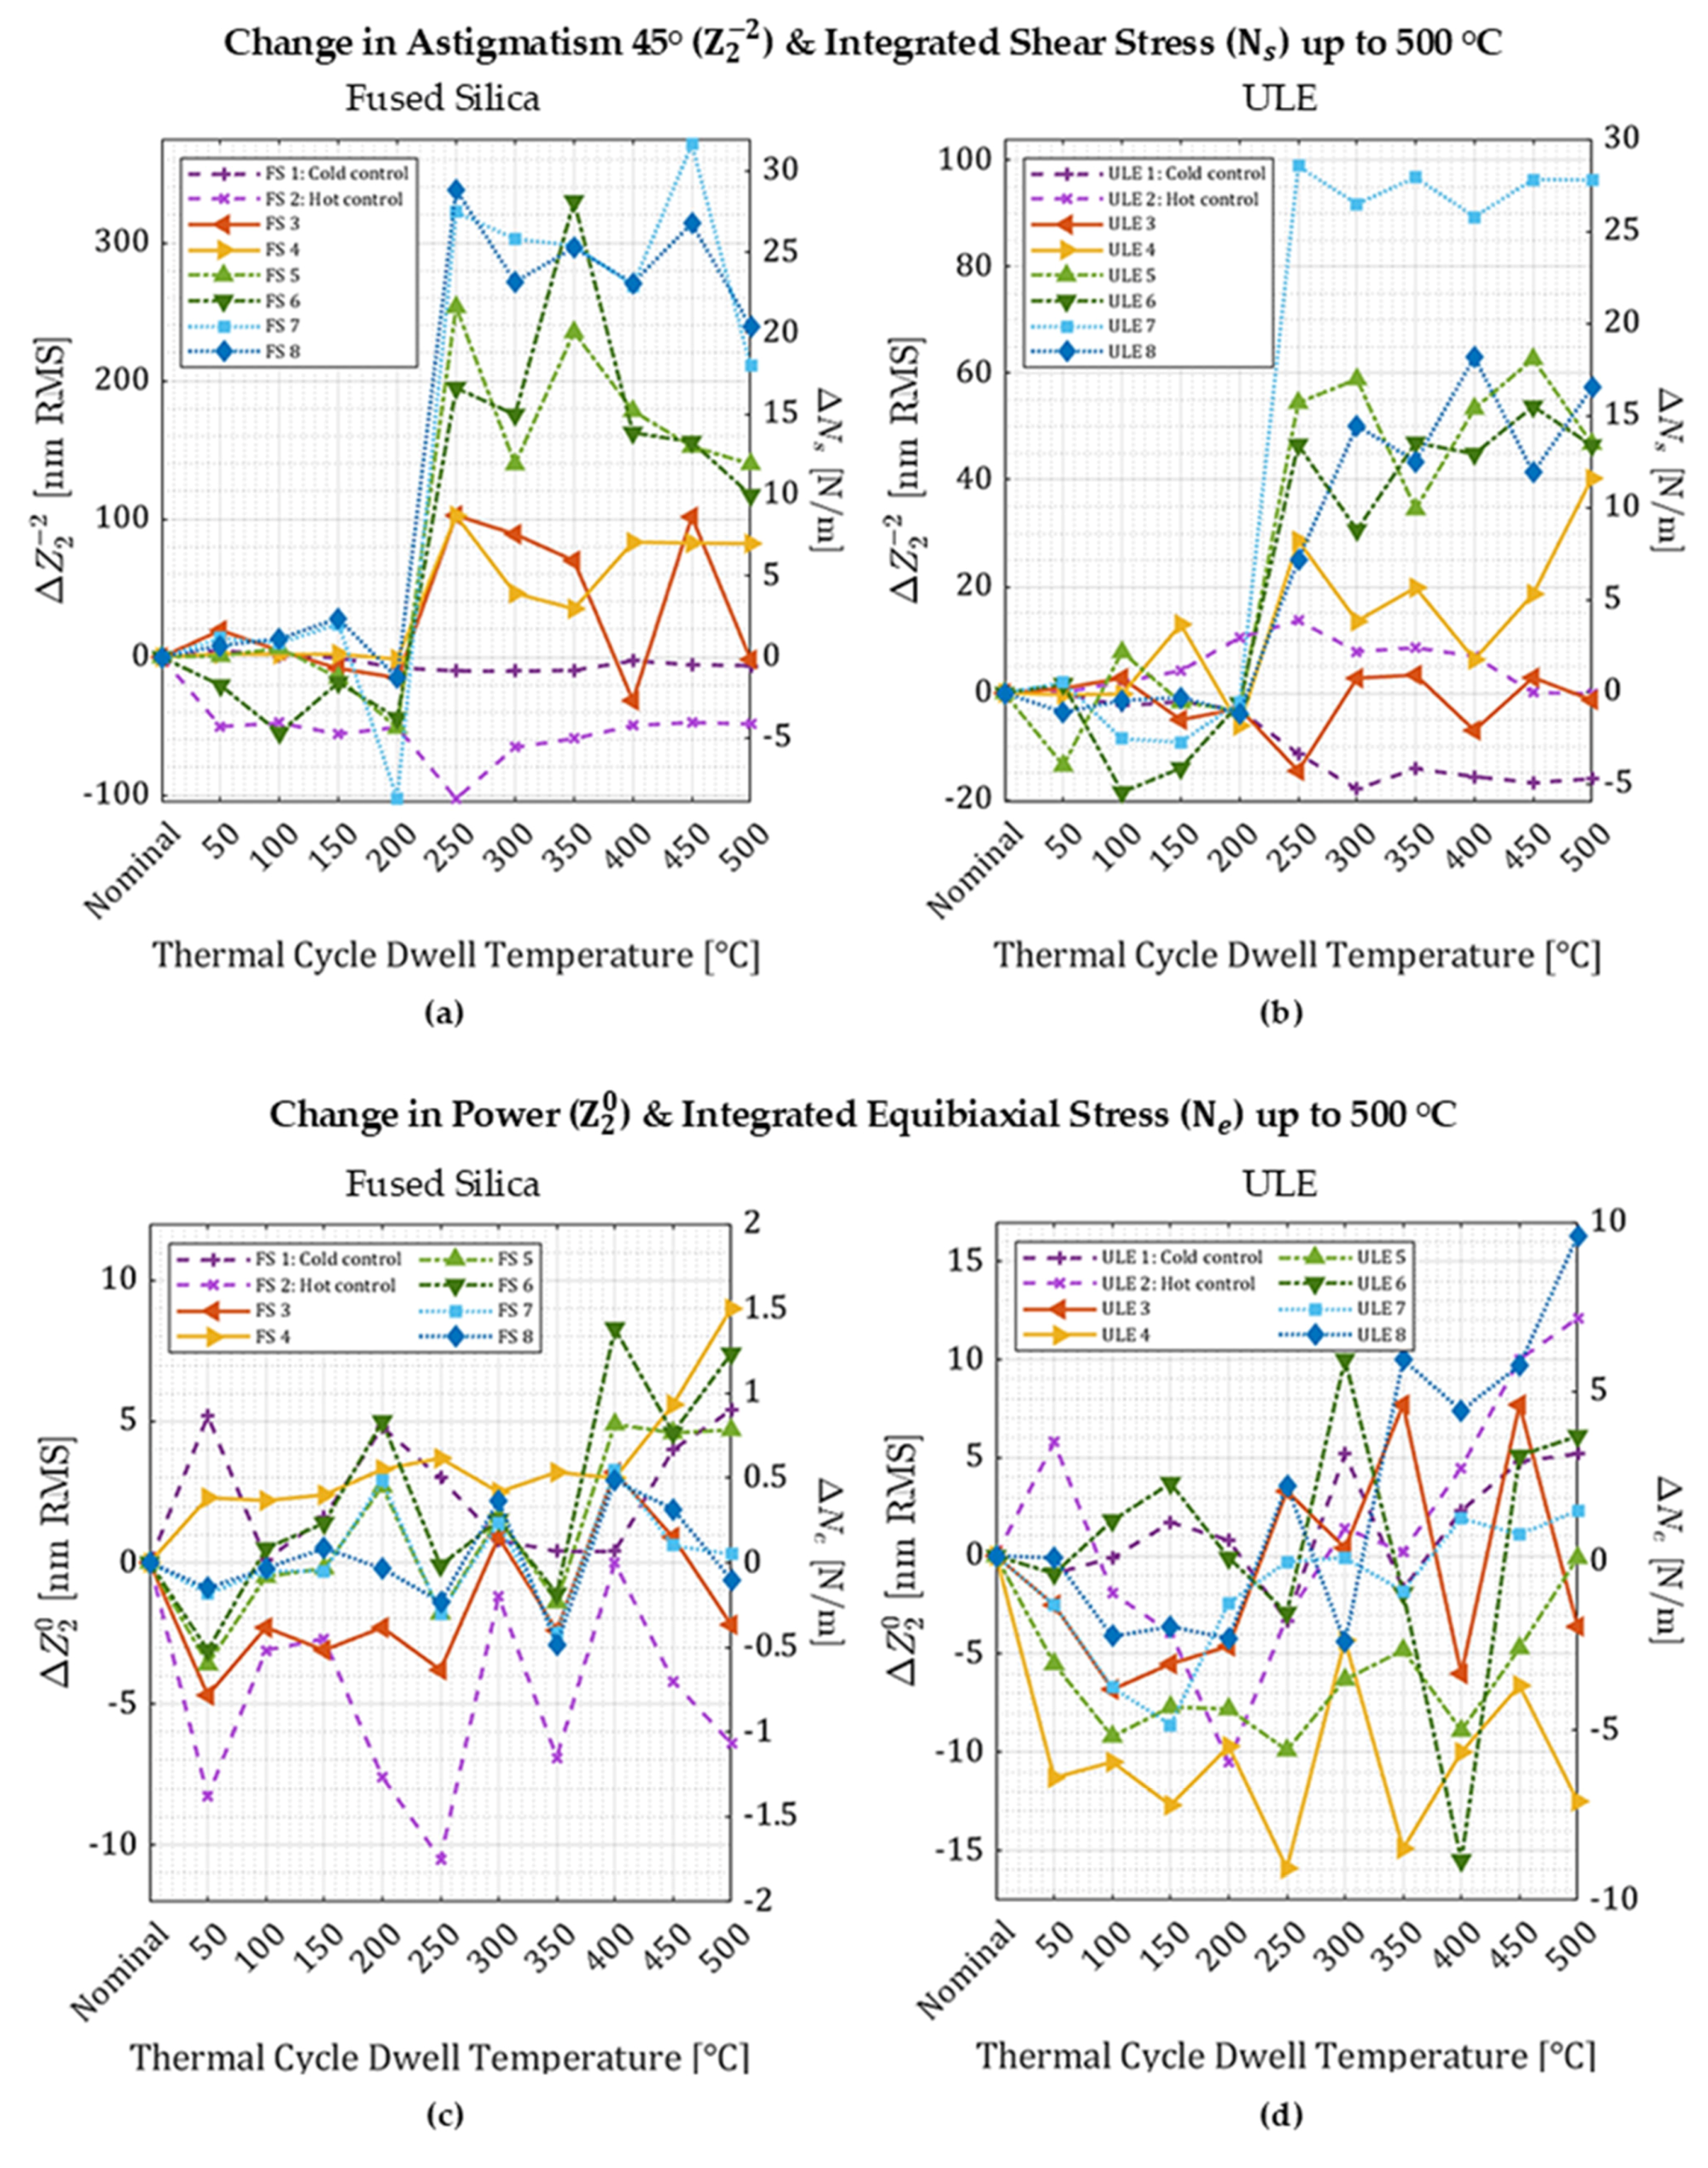
Figure 3.
Change in deformation and corresponding integrated stress for Experiment 1: (a) fused silica, astigmatism 45° (2-sigma error ±5.4 nm RMS, ±0.5 N/m), (b) ULE, astigmatism 45° (2-sigma error ±5.4 nm RMS, ±1.6 N/m); (c) fused silica, power (2-sigma error ±2.6 nm RMS, ±0.4 N/m), and (d) ULE, power (2-sigma error ±2.6 nm RMS, ±1.5 N/m).
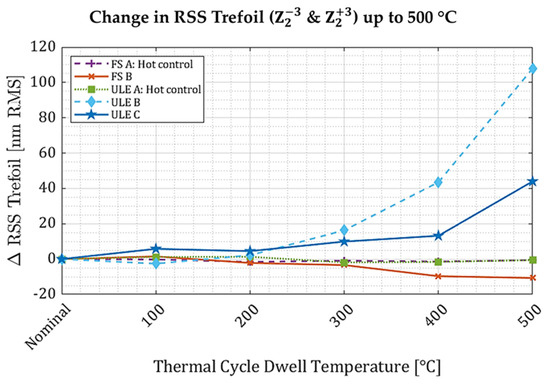
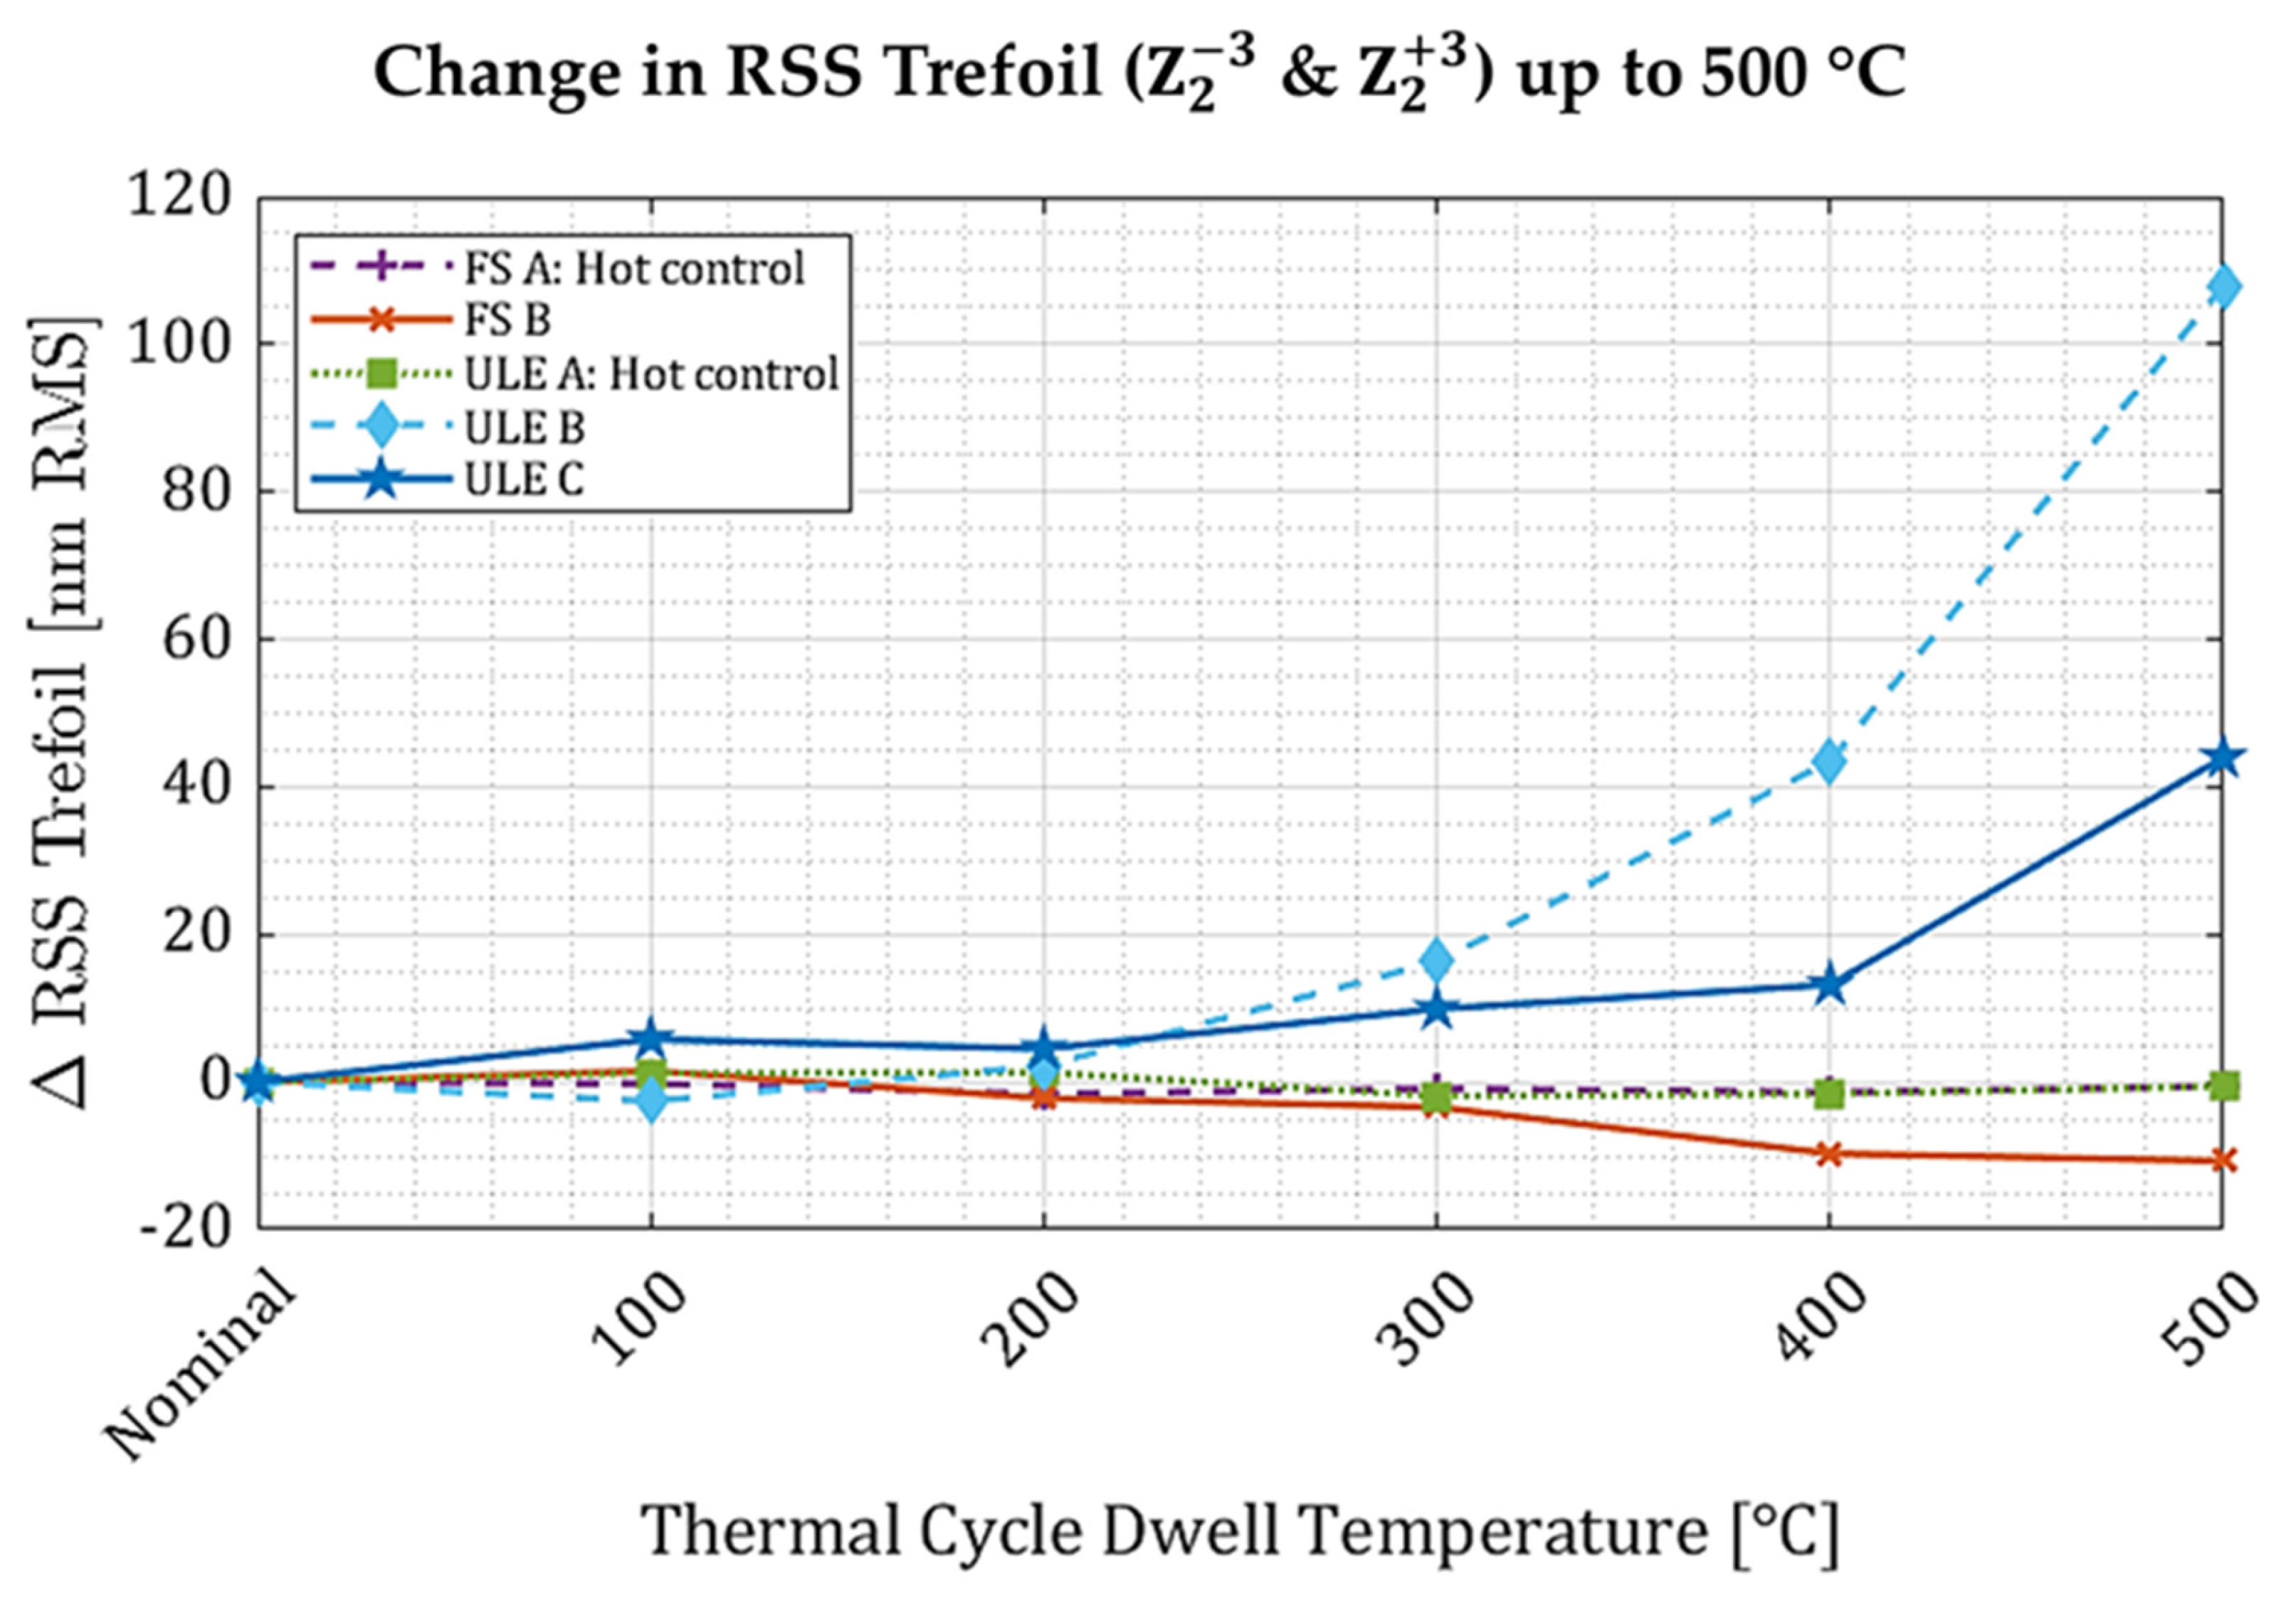
Figure 4.
Changes in RSS trefoil for all 100 mm-diameter fused silica and ULE samples. The 2-sigma error for RSS trefoil is ±8.4 nm RMS. Relaxation is in the negative direction.
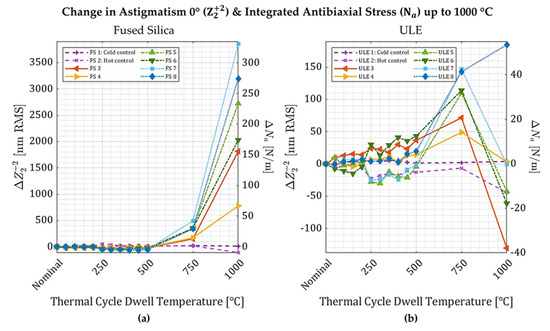
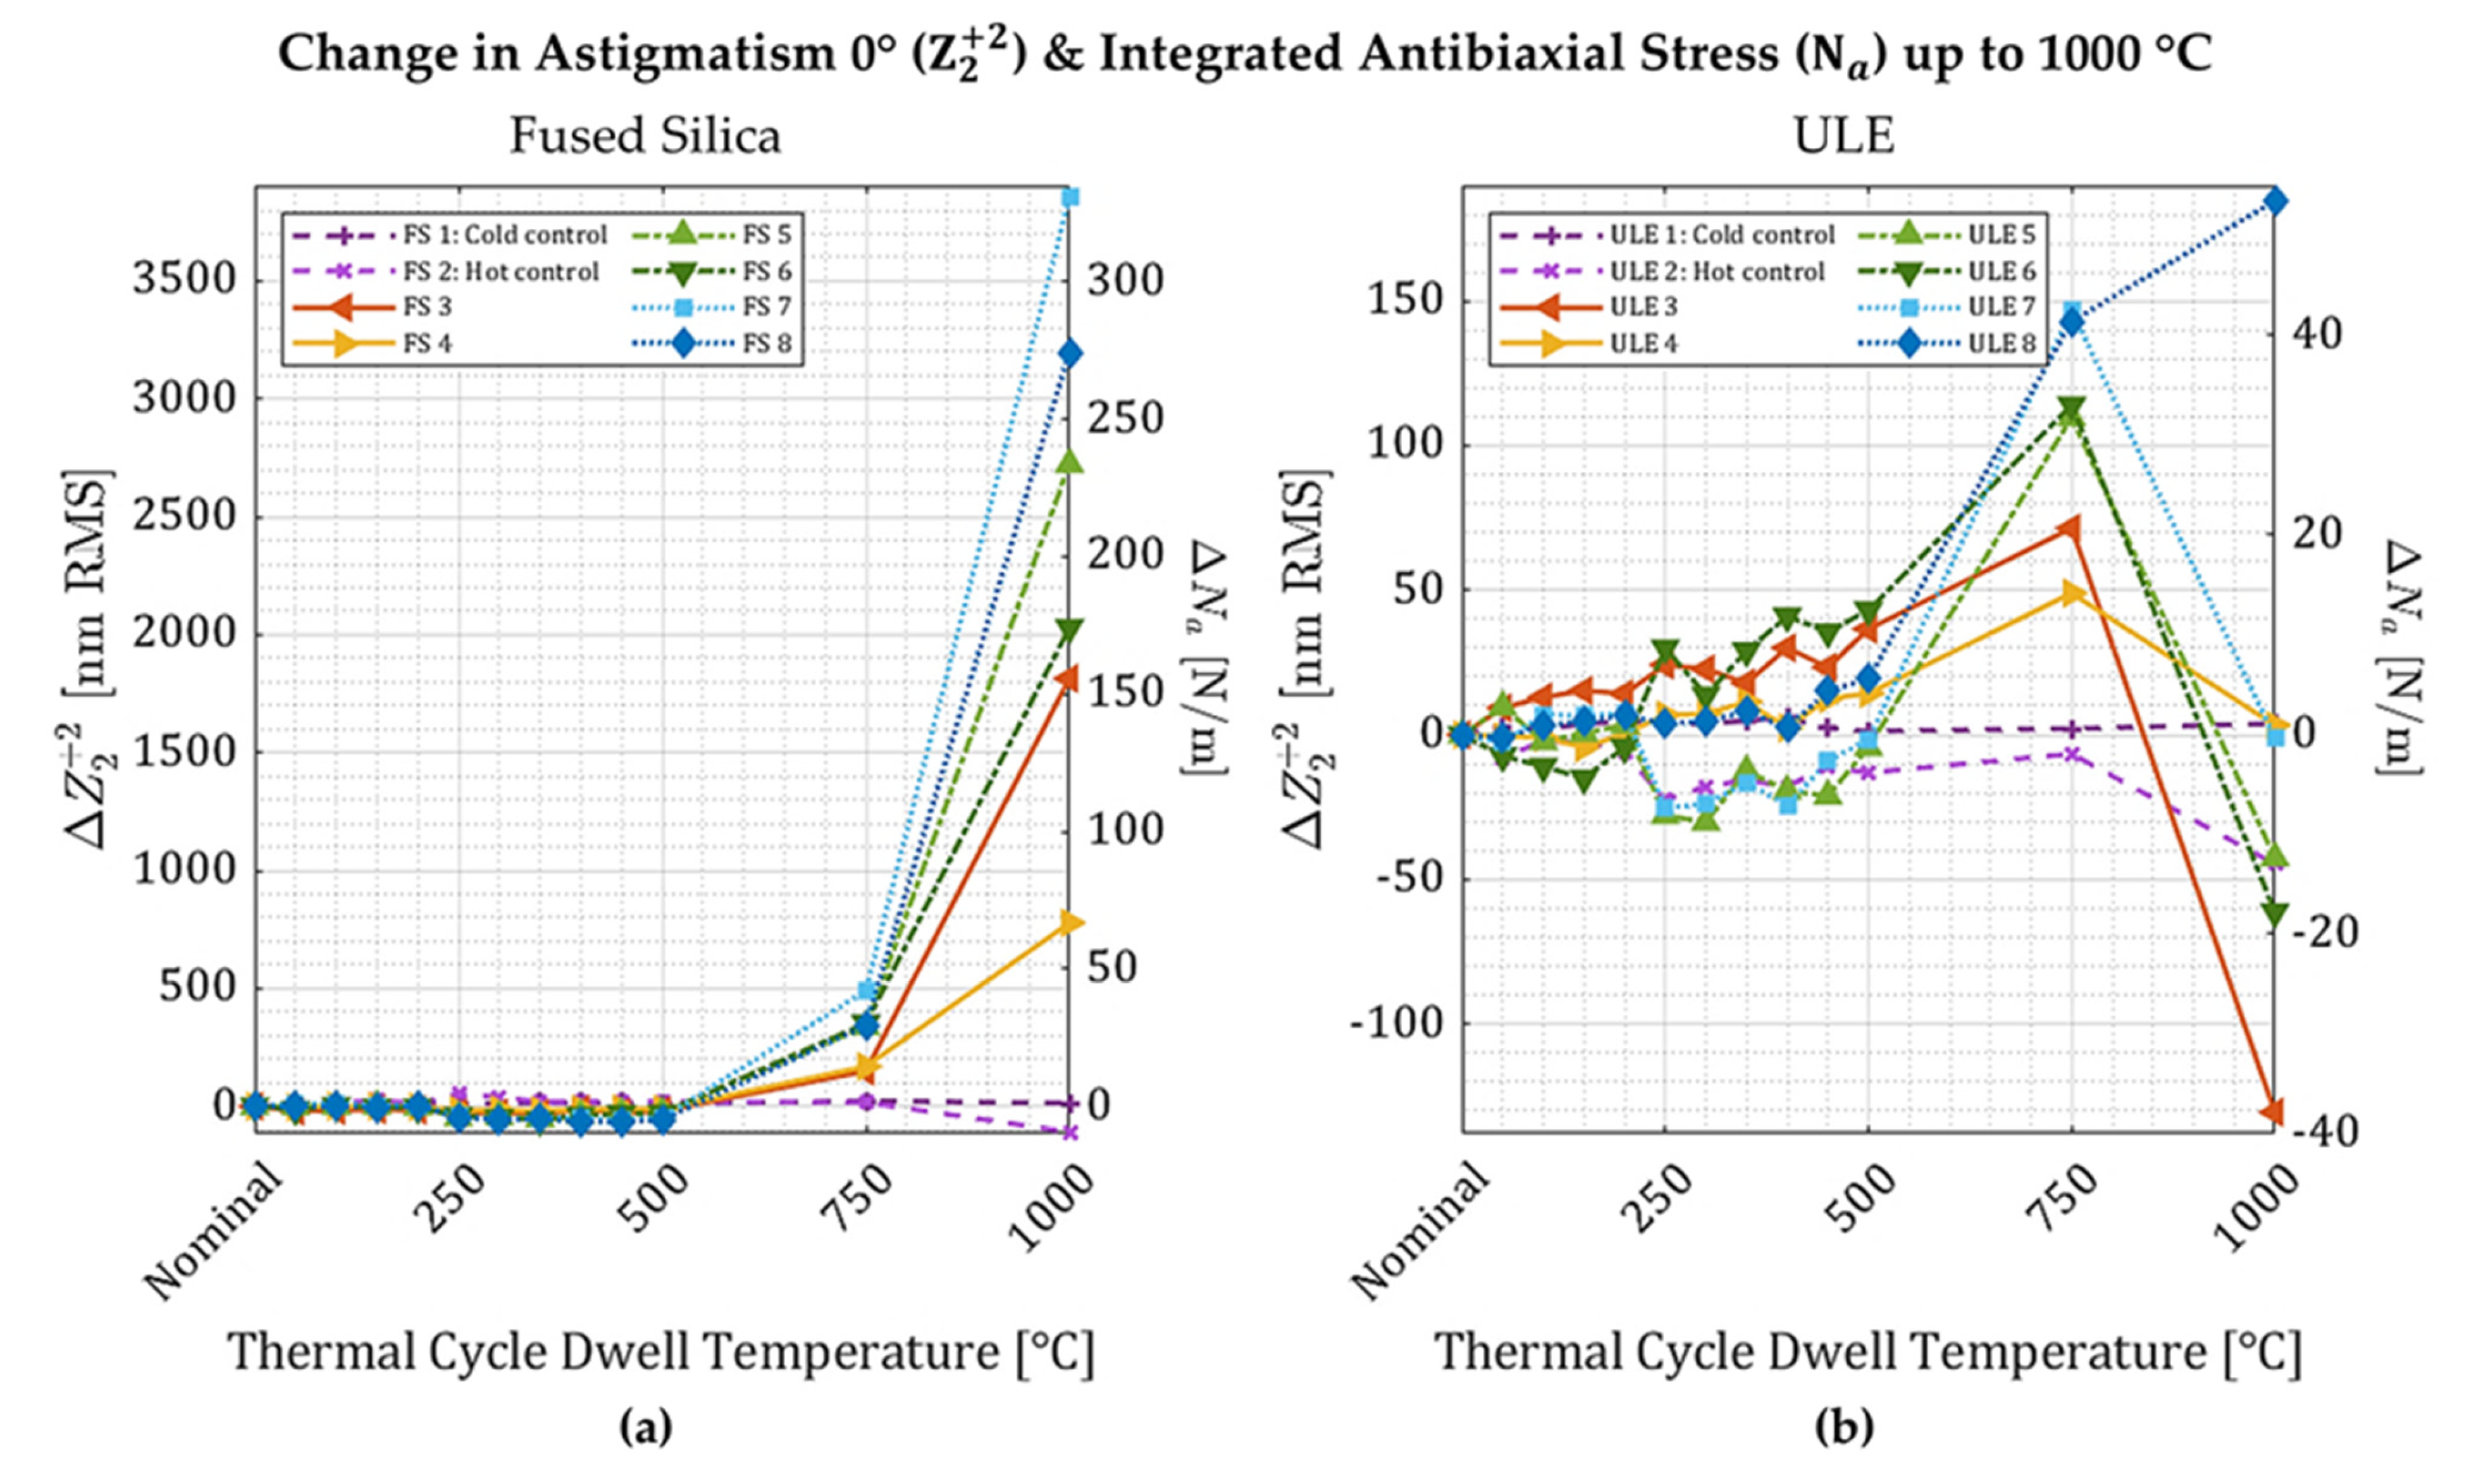
Figure 5.
Changes in astigmatism 0° (left axis) and integrated antibiaxial stress (right axis) for all fused silica (a) and ULE (b) samples in Experiment 1. Relaxation is in the negative direction. Error values for integrated stress and deformation are the same as in Figure 2.
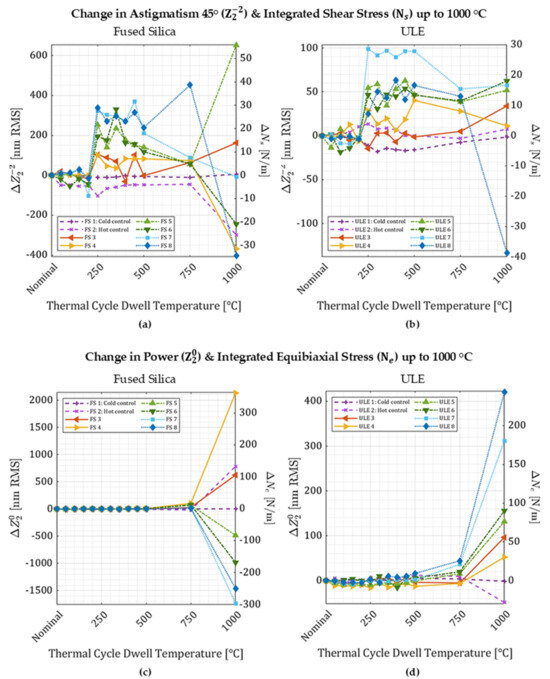
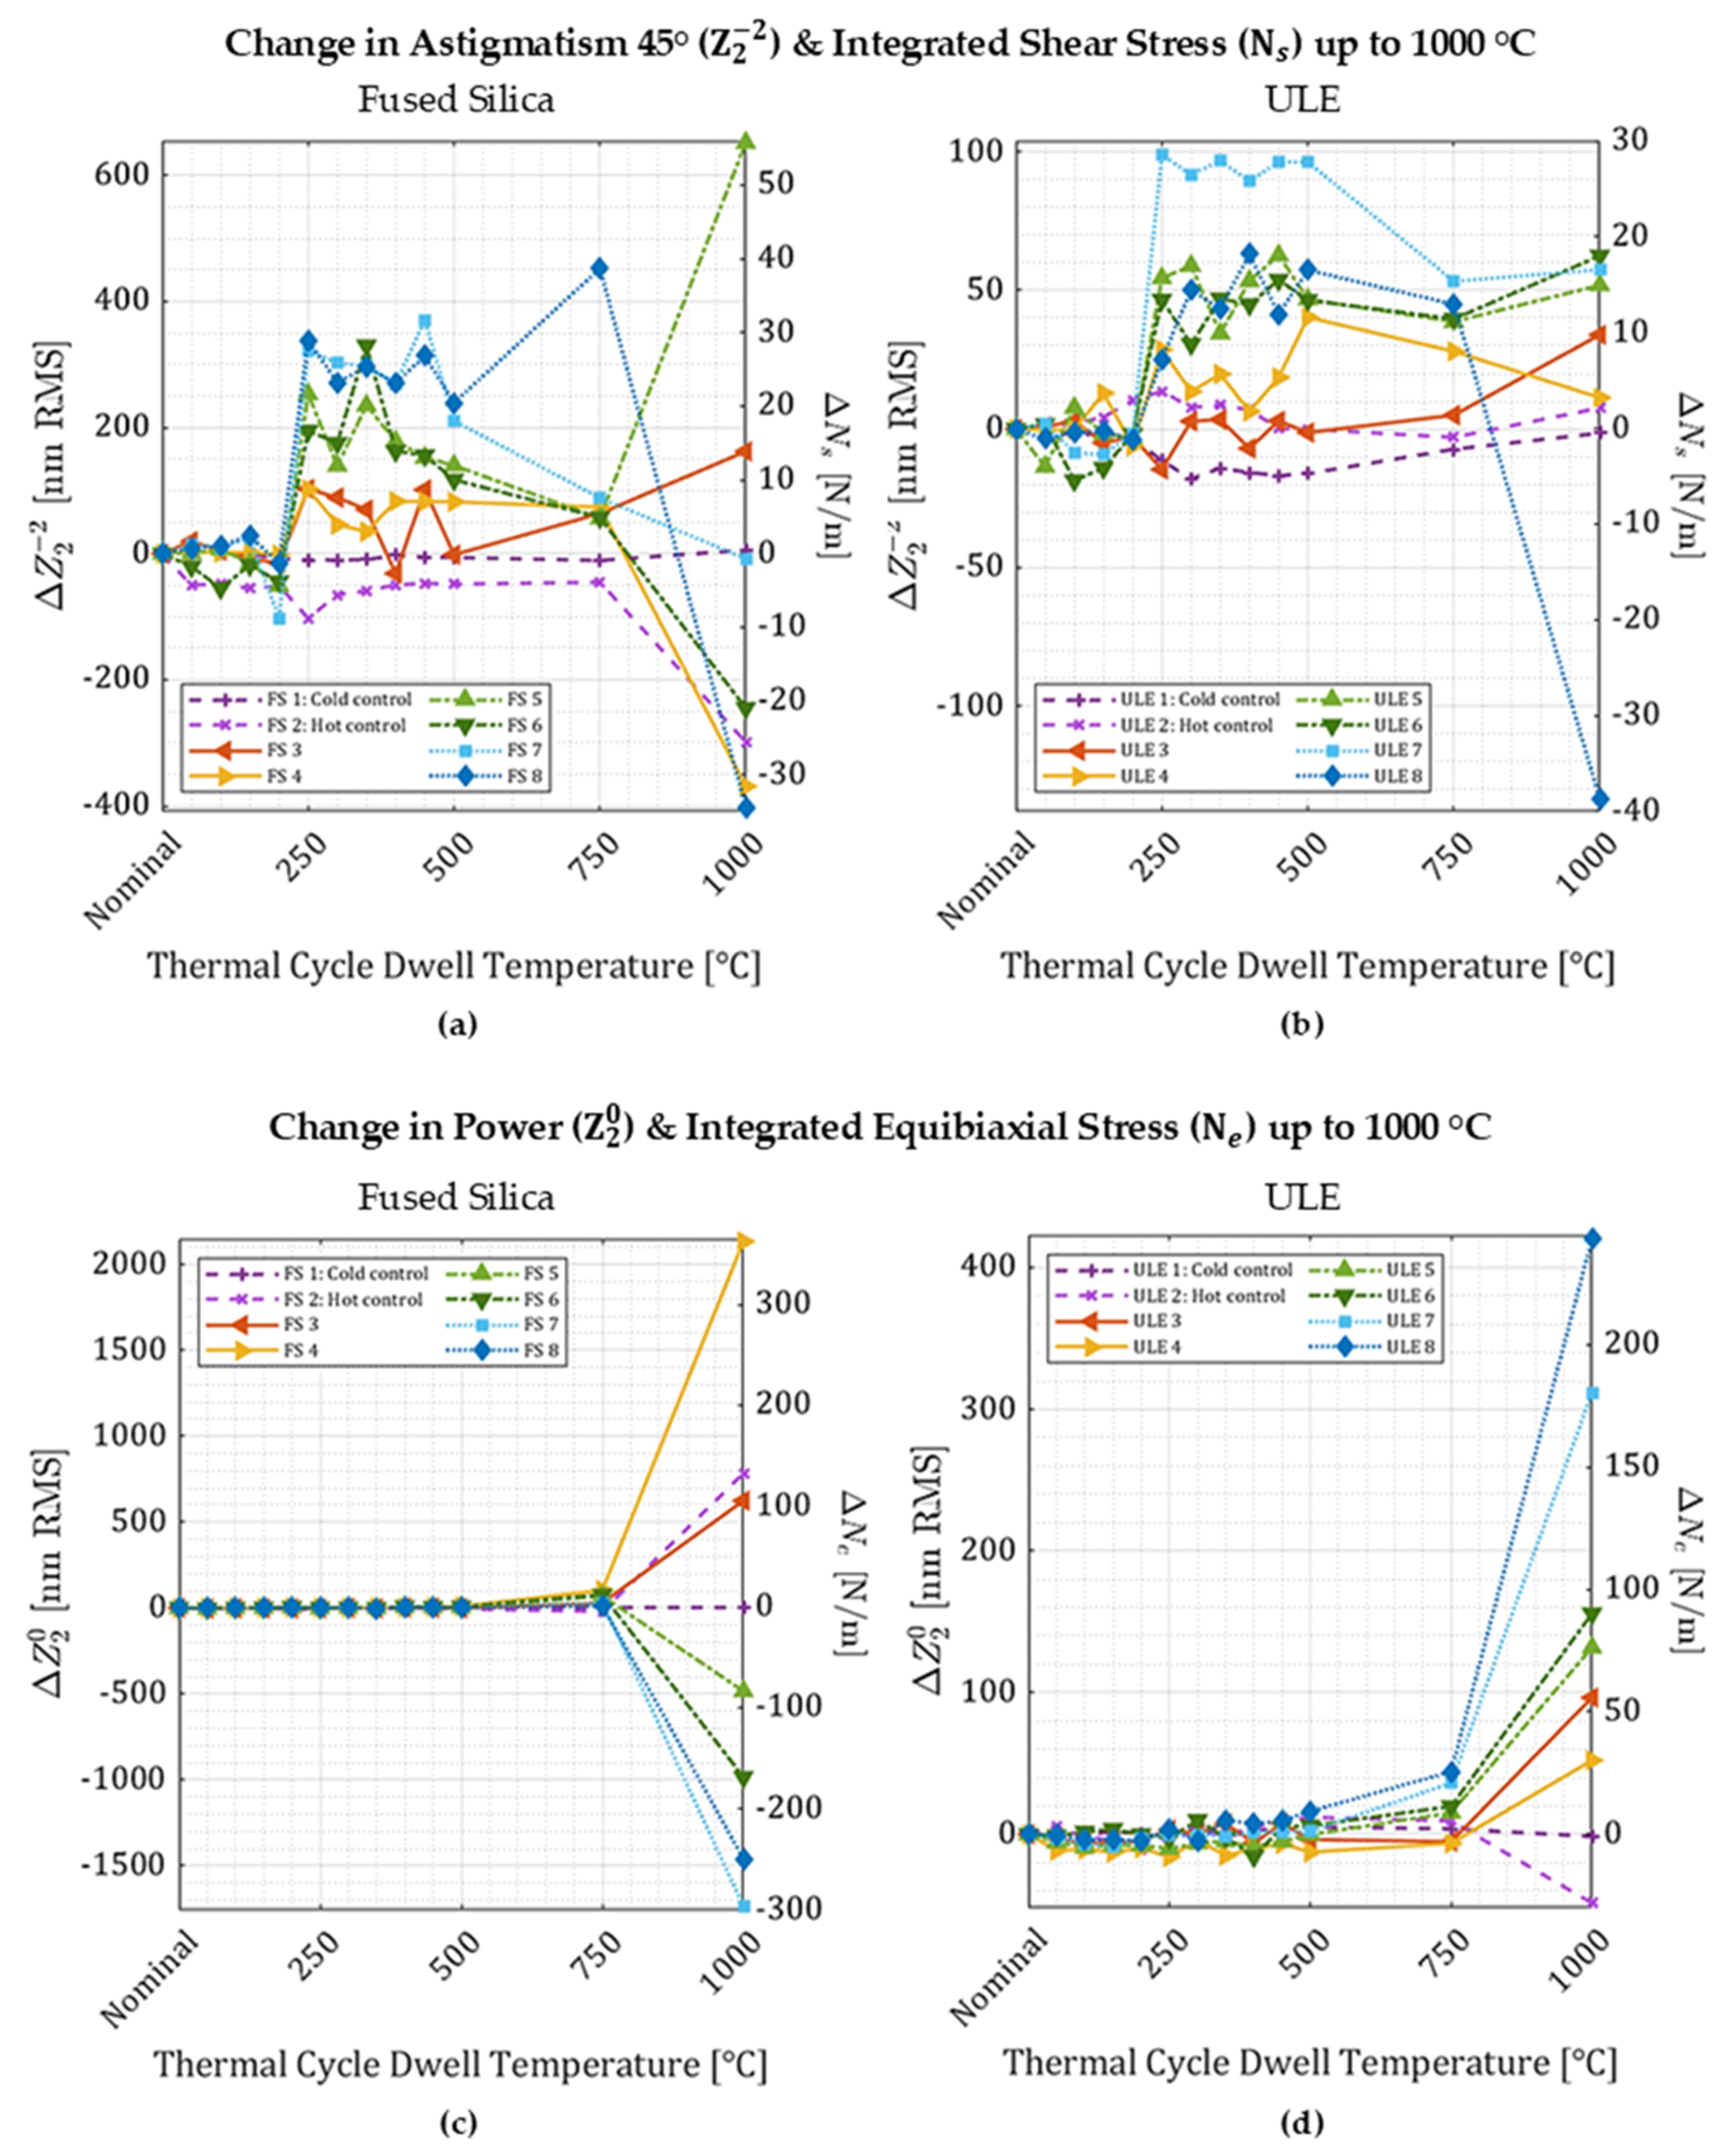
Figure 6.
Change in deformation and corresponding integrated stress for Experiment 1: (a) fused silica, astigmatism 45°, (b) ULE, astigmatism 45°; (c) fused silica, power, and (d) ULE, power. Error values for integrated stress and deformation are the same as in Figure 3.
3.1. Thermal Cycling up to 500 °C
3.1.1. Experiment 1
Thermal cycling to 500 °C changed the astigmatism 0° (and corresponding antibiaxial stress) in fused silica and ULE slightly (Figure 2). All the fused silica samples and some of the ULE samples exhibited relaxation (negative change in stress) starting after 200 °C. Only three out of the seven thermally cycled ULE samples exhibit relaxation (including the hot control), and the other four samples show an increase in stress. The deformations of the fused silica wafers correlate with the magnitude of induced deformation, but the deformations of the ULE wafers do not.
There is a marked increase in the astigmatism 45° deformation (and corresponding shear stress) for all figured samples after thermal cycling to 250 °C, and the amount it increases appears to correlate with the magnitude of induced antibiaxial stress (Figure 3a,b). This is unexpected since very little astigmatism 45° was imparted with ULSF. The power deformation (and corresponding equibiaxial stress) exhibits only very small changes in magnitude for both materials after thermal cycling to 500 °C (Figure 3c,d).
3.1.2. Experiment 2
The 100 mm-diameter samples figured with trefoil 30° exhibited small changes in trefoil 30° over the course of the thermal cycling regimen (Figure 4). After 200 °C, all samples showed changes in stress, relative to the imparted stress (Table 1), that were consistent with measurement error (Table 2). After 500 °C, the changes are more significant, especially in ULE. In contrast to the 25.4 mm-diameter samples, the 100 mm-diameter figured fused silica and ULE wafers do not exhibit a shear-dominant mode between 200 and 500 °C, and the most significant change in surface figure is the change in magnitude of the figured term trefoil 30°.
Table 2.
Percent change in integrated antibiaxial and shear stress for the trefoil 30° figured wafers in Experiment 2. The 2-sigma error is ±0.2% () and ±0.3% () for fused silica and ±0.3% () and ±0.5% () for ULE.
3.2. Thermal Cycling up to 1000 °C (Experiment 1 Only)
Only samples from Experiment 1 were thermally cycled up to 1000 °C. Astigmatism 0° (and corresponding antibiaxial stress) increases after 500 °C similarly for both materials and is correlated with the ULSF-imparted stress magnitude for both materials. After 1000 °C, the antibiaxial stress in fused silica increases further, but it decreases for most of the ULE samples. The change in antibiaxial stress in fused silica after 1000 °C is similar to the ULSF-imparted stress magnitude but in a direction that would increase the stress. The ULE samples exhibit partial relaxation of the ULSF-imparted stress, but the relaxation is not correlated with the magnitude of imparted stress.
There are small changes in astigmatism 45° and large changes in power for most samples after 1000 °C. Astigmatism 45° and shear stress stabilize after 500 °C for ULE samples 2–7. The response from fused silica at elevated temperatures is variable; FS 3 and FS 5 show an increase in astigmatism 45° while the rest (including the hot control, FS 2) exhibit a decrease similar to ULE 8, and FS 7 returns to the nominal value. There is significant change in power and equibiaxial stress in all annealed samples (including the hot controls) after 1000 °C. The two fused silica samples with the lowest amounts of induced antibiaxial stress continue to increase after 1000 °C, but the samples figured with higher amounts decrease in power after 1000 °C. The change in equibiaxial stress in ULE is correlated with the ULSF-induced stress.
As an example, the evolution of changes in surface figure is illustrated in Figure 7 for sample FS 4. After the wafer is figured with approximately 100 N/m integrated antibiaxial stress, the deformation remains stable with only very small changes to all Zernike terms after thermal cycling to 200 °C. After exposure to hotter temperatures, the change in surface figure is dominated by the acquisition of astigmatism 45° and shear stress. At 750 °C and beyond, astigmatism 0° again dominates the change in surface figure. Similar behavior is observed for nearly all samples in Experiment 1.
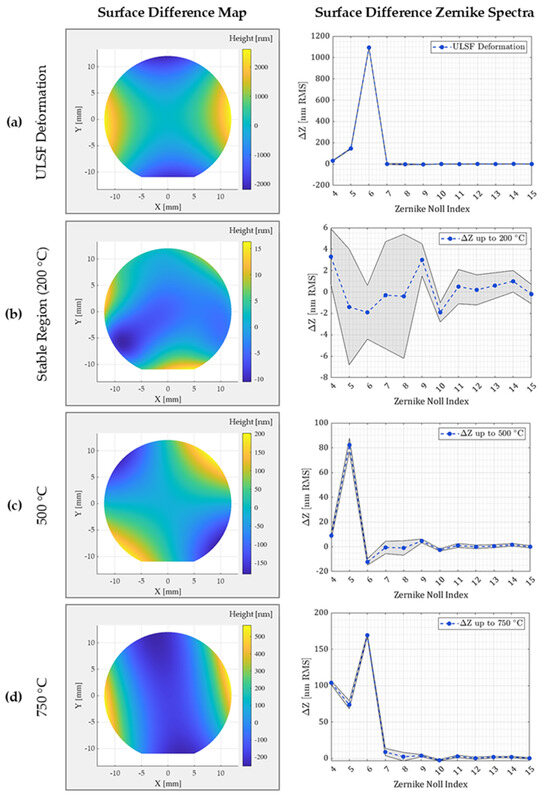
Figure 7.
Surface maps (left) and Zernike spectra (right) of sample FS 4 from Experiment 1, from ULSF-induced deformation (a) through thermal cycling to 750 °C (b–d). The shaded regions in the Zernike spectra represent 2-sigma measurement repeatability.
4. Discussion
Thermal stability of ultrafast laser-induced stress is similar in ULE and fused silica but exhibits some notable differences. After thermal cycling between 200 °C and 500 °C, fused silica samples figured with either astigmatism 0° or trefoil 30° relaxed slightly whereas the figured term for ULE sometimes relaxed like fused silica but sometimes increased. Furthermore, the behavior at very high temperatures is very different. The increase in antibiaxial stress for both materials up to 750 °C continues for fused silica at 1000 °C, but most ULE samples relax at 1000 °C. Cavillon et al. describe a “steep decay” in ultrafast laser-induced retardance, associated with erasure of nanostructures beginning around 1100–1250 °C for silica and driven by the glass viscosity behavior at high temperatures [13]. Though here the final thermal cycle was only 1000 °C, the change in antibiaxial stress in ULE samples 2–7 appear to show the beginning of such a decline. Since ULE has a lower softening point (1490 °C) than fused silica (1600 °C), it is likely that ULE requires a lower temperature to enter the erasure range which is in agreement with isochronal annealing retardance results reported in Refs. [10,13,14]. ULE is also inhomogeneous, which could contribute to more variation in behavior between samples than in fused silica, similar to Refs. [10,14].
The onset of significant low-temperature changes in stress in both materials is likely due to point defect erasure, which occurs around 200–500 °C [6,15]. Point defects—dangling silicon or oxygen bonds within the amorphous glass structure that can recombine or convert into other defects as well as affect local density—are known to occur in ultrafast laser-induced modifications [15,16,17]. Their position with respect to the nanostructures is at least partially dependent on the laser writing parameters [6,13], and whether stress increases or decreases upon erasure could be related to their location with respect to the nanostructures. Wang et al. [6] theorized that retardance from laser-generated nanogratings in silica glass decreased after thermal annealing at low temperatures when defects were between the nanostructures and increased when point defects were within the nanostructures. In the fused silica samples, erasure of point defects occurring between the nanostructures could be causing a decrease in induced stress after annealing beyond 200 °C. ULE is composed of alternating layers of titania-doped silica and undoped silica about 50–500 μm thick [18,19], and the ultrafast laser-generated modifications in this work (approximately 25–40 μm in length) fit within either a doped or undoped ULE layer [3]. If the modifications are written mostly in undoped silica layers, then point defects may occur between the nanostructures and lead to stress relaxation after cycling beyond 200 °C, similar to the fused silica samples. In titania-doped layers, the defects may occur within the nanostructures and produce an increase in the figured term instead.
The observed increase in stress at 750 °C is similar to behavior found in Wang et al. where an increase in birefringence was attributed to permanent changes in material densification leading directly to strain after annealing at temperatures between 600 and 900 °C [6]. Porous and densified material alternate within the nanostructures, and changes to the density within or between the nanogratings produces changes in stress and elastic modulus [1,16,20]. Thermal relaxation of structurally dense regions leads to net volume expansion resulting in higher compressive stress, and it has been suggested that the location of density relaxation affects whether stress (via retardance) increases or decreases in this temperature range [6]. As densified regions preferentially within the modifications gradually anneal, form birefringence and the measured retardance should decrease [6]. Relaxation of densification located preferentially surrounding the periodic structure of the nanogratings should result in an increase in material density around the nanolayers, local compression due to volume expansion, and an increase in retardance [6]. Accumulated compression in the latter situation could contribute to an increase in stress. This seems to fit with the observed behavior of ULE samples 3–7 after annealing at 750 °C as well as the fused silica samples and ULE 8 up to 1000 °C. Decreased retardance in the former situation is unlikely to cause an increase in stress since relaxation of densified regions within the nanogratings only leads to a changing fill factor in the nanostructure as pores begin to disappear [13].
Although changes in densification appear to contribute to birefringence relaxation, the experiments reviewed often report a decrease in retardance indicating a possible reduction in stress at high temperatures [6,9,10,13,14,21,22], whereas we observe an increase in stress in fused silica. Occasionally, previously published results included a sample appearing to show an increase in measured retardance during the annealing regimen, indicating a potential increase in stress [6,9,14,21]. This has been explained as a combination of relaxation of dense regions within the nanogratings and point defect erasure related to the morphology of the nanostructures and laser writing parameters occurring at different temperatures [6,13,22]. However, while we do observe changes in stress at similar annealing temperatures, the direction of change is not uniformly relaxation and not always in a uniform direction for all tracked Zernike terms. The shift we observe into increasing magnitudes of astigmatism 0°, astigmatism 45°, or power at high temperatures and in different directions suggests that there may be another mechanism at play, such as preferential relaxation of the stress fields in certain directions, and the full picture of stress behavior between 500 and 1000 °C may be obscured by measuring retardance alone. For example, in Ref. [22] the authors report that birefringence of ultrafast laser-generated nanogratings decreased during thermal annealing, but changes to the extraordinary index increased after 500 °C. They speculate that the local nanostructure material composition anneals at different rates; perhaps such behavior contributes to directional stress stability, though this is not the only possible explanation for our observations.
The large change in shear stress after 200 °C and the large change in equibiaxial stress at high temperatures is surprising and suggests that stress stability may be direction dependent. The ULSF pattern includes line segments written in three directions, with the polarization perpendicular to the writing direction (see Figure 1b). If all properties of the beam were axisymmetric (i.e., Gaussian beam profile, no wavefront error, no pulse front tilt), we would expect no difference in stress from the three writing directions (other than a coordinate transformation) or their stability. However, the stress from each writing direction is not simply related to the other directions through a coordinate rotation [5]. Therefore, some properties of our laser beam are not axisymmetric. We suspect that the shear stress and power changes occur because some writing directions have different stability than other directions. If some writing directions relaxed at a lower temperature than others (due to more point defects initially, for example), both power and astigmatism 45° deformations could result. An alternative explanation may be that the stress in some regions of the laser-written line segments, such as the start or end of each line segment where shear stress is more prevalent, relax at a lower temperature than other regions. Additional experiments are needed to test these hypotheses.
5. Conclusions
Induced deformation via ultrafast laser stress figuring (ULSF) in both fused silica and Corning ULE is stable to within our measurement noise, up to about 200 °C. Between 200 and 500 °C, induced deformation in the fused silica samples relaxed but increased in ULE, resulting in a -1.8% to +11.5% percent change from the ULSF deformation. Changes in the figured term up to 500 °C are correlated with the temperature at which point defect erasure occurs, and the effect on stress may depend on where the point defects exist. Between 250 and 500 °C there are changes in astigmatism 45° in both materials, even when this term was not induced by ULSF, for the 25.4 mm-diameter samples. All changes in stress are relatively small up to 500 °C compared to changes beyond 500 °C. Stress in ULE drops dramatically at 1000 °C, which is attributed to the onset of nanograting erasure, whereas stress in fused silica increases dramatically.
Confidence in the lifetime stability of ULSF-induced stress supports its viability as a processing tool to supplement thin optics manufacturing. We demonstrated that changes to the induced surface figure after ULSF are limited to the low tens of nanometers up to 200 °C, indicating that ULSF can survive and continue to perform well in common thermal environments. While there is some directional dependence in the stress stability in small mirrors, this is entirely absent in larger diameter mirrors. Using ULSF for post-coating figure correction has been demonstrated previously [5], and its stability likely depends on the stability of the film, not ULSF. ULSF also represents a critical step toward concurrent figuring and alignment, and it offers a contact-free method of optical surface pre-forming to reduce the need for post-alignment wavefront correction. Further areas of interest regarding thermal stability of ULSF include contributions to directional stress stability from the beam profile, substrate material, and local nanostructure morphology.
Author Contributions
Conceptualization, C.C.H. and B.D.C.; methodology, C.C.H. and B.D.C.; software, C.C.H. and B.D.C.; validation, C.C.H. and B.D.C.; formal analysis, C.C.H.; investigation, C.C.H. and B.D.C.; resources, C.C.H. and B.D.C.; data curation, C.C.H.; writing—original draft preparation, C.C.H.; writing—review and editing, C.C.H. and B.D.C.; visualization, C.C.H.; supervision, B.D.C.; project administration, B.D.C.; funding acquisition, B.D.C. All authors have read and agreed to the published version of the manuscript.
Funding
This research was funded by the National Science Foundation, grant number 2121713, and the National Aeronautics and Space Administration, grant number 80NSSC22K1484.
Data Availability Statement
The raw data supporting the conclusions of this article will be made available by the authors on request.
Acknowledgments
The authors would like to thank Ian J. Arnold and Kevin A. Laverty for equipment support and constructive criticism during data analysis.
Conflicts of Interest
The authors declare no conflicts of interest.
Abbreviations
The following abbreviations are used in this manuscript:
| FS | Fused silica |
| RMS | Root mean squared |
| RSS | Root sum squared |
| ULE | Ultra-low expansion glass (Corning) |
| ULSF | Ultrafast laser stress figuring |
References
- Bellouard, Y.; Champion, A.; McMillen, B.; Mukherjee, S.; Thomson, R.R.; Pépin, C.; Gillet, P.; Cheng, Y. Stress-State Manipulation in Fused Silica via Femtosecond Laser Irradiation. Optica 2016, 3, 1285–1293. [Google Scholar] [CrossRef]
- Gattass, R.R.; Mazur, E. Femtosecond Laser Micromachining in Transparent Materials. Nat. Photonics 2008, 2, 219–225. [Google Scholar] [CrossRef]
- Laverty, K.A.; Chalifoux, B.D. Ultrafast Laser Stress Generation Landscape in Fused Silica. Opt. Express 2025, 33, 24787–24799. [Google Scholar] [CrossRef]
- Chalifoux, B.D.; Heilmann, R.K.; Schattenburg, M.L. Correcting Flat Mirrors with Surface Stress: Analytical Stress Fields. J. Opt. Soc. Am. A 2018, 35, 1705–1716. [Google Scholar] [CrossRef] [PubMed]
- Chalifoux, B.D.; Laverty, K.A.; Arnold, I.J. Ultrafast Laser Stress Figuring for Accurate Deformation of Thin Mirrors. Opt. Express 2022, 30, 17767–17780. [Google Scholar] [CrossRef] [PubMed]
- Wang, Y.; Cavillon, M.; Ollier, N.; Poumellec, B.; Lancry, M. An Overview of the Thermal Erasure Mechanisms of Femtosecond Laser-Induced Nanogratings in Silica Glass. Phys. Status Solidi A 2021, 218, 2100023. [Google Scholar] [CrossRef]
- Wang, Y.; Lancry, M.; Cavillon, M.; Poumellec, B. Lifetime Prediction of Nanogratings Inscribed by a Femtosecond Laser in Silica Glass. Opt. Lett. 2022, 47, 1242–1245. [Google Scholar] [CrossRef] [PubMed]
- Grobnic, D.; Smelser, C.W.; Mihailov, S.J.; Walker, R.B. Long-Term Thermal Stability Tests at 1000 °C of Silica Fibre Bragg Gratings Made with Ultrafast Laser Radiation. Meas. Sci. Technol. 2006, 17, 1009. [Google Scholar] [CrossRef]
- Cavillon, M.; Lancry, M.; Poumellec, B.; Wang, Y.; Canning, J.; Cook, K.; Hawkins, T.; Dragic, P.; Ballato, J. Overview of High Temperature Fibre Bragg Gratings and Potential Improvement Using Highly Doped Aluminosilicate Glass Optical Fibres. J. Phys. Photonics 2019, 1, 042001. [Google Scholar] [CrossRef]
- Wei, S.-E.; Wang, Y.; Yao, H.; Cavillon, M.; Poumellec, B.; Peng, G.-D.; Lancry, M. Thermal Stability of Type II Modifications by IR Femtosecond Laser in Silica-Based Glasses. Sensors 2020, 20, 762. [Google Scholar] [CrossRef] [PubMed]
- Shimotsuma, Y.; Kazansky, P.G.; Qiu, J.; Hirao, K. Self-Organized Nanogratings in Glass Irradiated by Ultrashort Light Pulses. Phys. Rev. Lett. 2003, 91, 247405. [Google Scholar] [CrossRef] [PubMed]
- Mazurin, O.V.; Leko, V.K.; Komarova, L.A. Crystallization of Silica and Titanium Oxide-Silica Corning Glasses (Codes 7940 and 7971). J. Non-Cryst. Solids 1975, 18, 1–9. [Google Scholar] [CrossRef]
- Cavillon, M.; Wang, Y.; Poumellec, B.; Brisset, F.; Lancry, M. Erasure of Nanopores in Silicate Glasses Induced by Femtosecond Laser Irradiation in the Type II Regime. Appl. Phys. A 2020, 126, 876. [Google Scholar] [CrossRef]
- Wang, Y.; Wei, S.; Cicconi, M.R.; Tsuji, Y.; Shimizu, M.; Shimotsuma, Y.; Miura, K.; Peng, G.-D.; Neuville, D.R.; Poumellec, B.; et al. Femtosecond Laser Direct Writing in SiO2-Al2O3 Binary Glasses and Thermal Stability of Type II Permanent Modifications. J. Am. Ceram. Soc. 2020, 103, 4286–4294. [Google Scholar] [CrossRef]
- Witcher, J.J.; Reichman, W.J.; Fletcher, L.B.; Troy, N.W.; Krol, D.M. Thermal Annealing of Femtosecond Laser Written Structures in Silica Glass. Opt. Mater. Express 2013, 3, 502–510. [Google Scholar] [CrossRef]
- Vlugter, P.; Block, E.; Bellouard, Y. Local Tuning of Fused Silica Thermal Expansion Coefficient Using Femtosecond Laser. Phys. Rev. Mater. 2019, 3, 053802. [Google Scholar] [CrossRef]
- Richter, S.; Heinrich, M.; Döring, S.; Tünnermann, A.; Nolte, S.; Peschel, U. Nanogratings in Fused Silica: Formation, Control, and Applications. J. Laser Appl. 2012, 24, 042008. [Google Scholar] [CrossRef]
- Hrdina, K.E.; Hanson, B.Z.; Fenn, P.M.; Sabia, R. Characterization and Characteristics of a ULE Glass Tailored for EUVL Needs. In Proceedings of the SPIE, Santa Clara, CA, USA, 1 July 2002; Volume 4688, pp. 454–461. [Google Scholar]
- Rosch, W.; Beall, L.; Maxon, J.; Sabia, R.; Sell, R. Characterization of Striae in ULE for EUVL Optics and Masks. In Proceedings of the SPIE, San Jose, CA, USA, 23 March 2006; Volume 6151, pp. 560–567. [Google Scholar]
- Champion, A.; Bellouard, Y. Direct Volume Variation Measurements in Fused Silica Specimens Exposed to Femtosecond Laser. Opt. Mater. Express 2012, 2, 789–798. [Google Scholar] [CrossRef]
- Tian, J.; Yao, H.; Cavillon, M.; Garcia-Caurel, E.; Ossikovski, R.; Stchakovsky, M.; Eypert, C.; Poumellec, B.; Lancry, M. A Comparison between Nanogratings-Based and Stress-Engineered Waveplates Written by Femtosecond Laser in Silica. Micromachines 2020, 11, 131. [Google Scholar] [CrossRef] [PubMed]
- Bricchi, E.; Kazansky, P.G. Extraordinary Stability of Anisotropic Femtosecond Direct-Written Structures Embedded in Silica Glass. Appl. Phys. Lett. 2006, 88, 111119. [Google Scholar] [CrossRef]

Disclaimer/Publisher’s Note: The statements, opinions and data contained in all publications are solely those of the individual author(s) and contributor(s) and not of MDPI and/or the editor(s). MDPI and/or the editor(s) disclaim responsibility for any injury to people or property resulting from any ideas, methods, instructions or products referred to in the content. |
© 2025 by the authors. Licensee MDPI, Basel, Switzerland. This article is an open access article distributed under the terms and conditions of the Creative Commons Attribution (CC BY) license (https://creativecommons.org/licenses/by/4.0/).