1. Introduction
Compact, diode-end-pumped, passively Q-switched, eye-safe, Er/Yb-doped glass lasers operating at 1.5 μm are required in several applications, including laser range finding (LRF) and Light Detection and Ranging systems (LIDAR). Previously, these lasers have been explored for generating a single Q-switched pulse [
1,
2,
3]. To extend the maximum operating range of LRF and LIDAR systems, increased laser pulse energy is required. The maximum energy achievable in a single pulse, however, is limited by the critical threshold for optical damage of various components in the cavity. To circumvent this limit, the laser can be operated in burst mode, whereby a sequence of many pulses, each below the laser damage level, are generated. The total combined energy contained in the burst can be much larger than achievable in a single pulse. LRF or LIDAR receivers can be configured to sum up the signal returns generated by individual pulses in the burst, thereby increasing the signal-to-noise ratio and the maximum detection range. A pulse burst is generated by increasing the pump energy beyond the threshold level required to generate the first pulse in the burst. Once the laser threshold is reached, only a small addition of pump energy is required to generate each subsequent pulse in the burst. As a result, the optical efficiency is much higher in burst vs. single-pulse laser operation. Reference [
4] describes such “burst regime” operation, but for a Er/Yb glass laser side-pumped by a 100 W laser bar. The multi-pulse efficiency improvement is particularly valid for a 3-level laser which has ground-state absorption and requires higher threshold pump power compared to a 4-level laser. However, the higher pump energy required to generate a multi-pulse burst can significantly increase the heat deposited in the Er/Yb glass. This affects the evolution of the laser mode. The impact of heating on laser output characteristics should be characterized and analyzed carefully. For an end-pumped laser we show this by measuring and simulating how thermally induced changes in the optical properties of glass cause the spatial mode characteristics for the individual pulses to change as a function of their temporal position within the burst.
Our recent studies of other rare-earth-doped, passively Q-switched lasers (PQSL) have described crystalline hosts, continuous end-pumping, and repetitive self-pulsing. Simulations of their relatively weak thermal effects could be approximated by intracavity lenses using simple models. The agreement was good between our finite-difference beam propagation method (FD-BPM) and measured results of repetitive relaxation-oscillation PQSL pulses. Similar situations (CW pumping, crystalline laser hosts) have been extensively treated in the published literature since the 1970s, although most pertain to non-Q-switched operation. Pulsed Q-switched microchip, eye-safe, glass-laser versions, shorter but with 30 times lower pulse energy than in our case, have been recently reported [
5].
All relevant analyses we have found for passively Q-switched Er/Yb glass lasers solve the laser differential equations in the time domain with assumed laser modes. This type of modeling totally neglects spatial mode saturation of the gain, its consequences, and the effects of spatial mode competition. Our approach uses an opposite method: numerical finite-difference solutions for modes and material populations as a function of r and z at each iterated time increment; the latter is one round-trip during a pulse or coarser between burst pulses. The round-trip time increment is much shorter than the Q-switched pulse temporal width, so the extra time resolution provided by adaptive-step differential equation solvers is not necessary. Our “snap-shot” method [
6] was used to develop closed-form (albeit plane-wave) solutions to 3-level Q-switched lasers.
The increased thermal problems of Er/Yb-doped phosphate laser glass result from its material properties: large thermal expansion, low thermal conductivity, and significant stress-optic coefficients. Also, the efficient pumping of Er
3+ requires optical excitation of higher-concentration Yb
3+, followed by rapid energy transfer to Er
3+. The large quantum defect between pump photon energy (of the absorbing Yb) and laser-emission photon energy (from the lasing Er) increases the heating. These combined factors generally prevent CW excitation of the glass to avoid destructive damage. As a result, the required pulse pumping invalidates much of the usual CW thermal analyses, so explicit time-dependence of the thermal behavior within typical millisecond-scale pump intervals must be understood. We applied similar finite-difference techniques to the pulse-pumped, dynamic heat equation as a function of (r, z, t) as we did for the field propagation Helmholtz equation. An illustration of generic pulsed thermal evolution was shown by Koechner [
7], but for an unspecified laser rod, uniformly pumped across its entire diameter.
Our laser measurements and analysis below include the temporal evolution of thermal behavior in PQSL operation. FD-BPM simulations were developed for PQSL burst-mode operation occurring with the 6%-duty-cycle pump pulses (6 ms, 10 Hz frequency) of our laboratory measurements. Generally, simulation results for passively Q-switched operation are in good agreement with measured laser output characteristics. Pulsed pumping is required, but we must also choose laser parameters allowing repetitive passive Q-switching (PQS) within each pump interval.
2. Experimental Arrangement and Measurement Results
The laser configuration used for all measurements is shown in
Figure 1.
A 933 nm pump laser diode with a multi-mode, 105 µm core fiber pigtail operated at 10 Hz PRF, with a pulse duration of 6 ms. The top-hat multi-mode pump light-intensity distribution exiting the fiber was collected by a 1.5 mm focal length lens and imaged inside the (Er/Yb):Glass gain element. To achieve the desired pulse energy, which varied with the pump spot diameter, we selected a magnified, imaged spot diameter of approximately 600 µm. The image plane was located 4.5 mm from the input face of the glass, and the imaged spot had a near-flat-top intensity profile. Detailed ray-trace analyses from the spatially incoherent, multi-mode fiber pump source show that the pump intensity distribution, at locations away from the image, changes with the longitudinal position. We measured the pump distribution at the front face of the glass and found it to have a flattened-Gaussian shape with a 1/e
2 diameter of 420 µm. Since pump intensity distribution at the front face of the glass is less attenuated, it is more significant in affecting the lasing parameters. To simplify the numerical code in the FD-BPM, we used a Butterworth-type radial distribution (discussed in
Section 3.2) which did not vary as a function of longitudinal position in the glass. A full width at half maximum (FWHM) of 440 μm resulted in the best agreement between simulated and measured output characteristics.
The laser cavity resonator was formed by a dichroic, highly reflective (>99.5% at 1535 nm) back mirror and a flat output coupler mirror with 92.5% reflectivity. Note that this flat–flat configuration does not have stable laser modes without pumping. A cavity length of 20 mm was chosen to achieve a compact laser configuration and allow the generation of the required pulse energy and pulse duration while keeping the internal energy fluence below the optical damage threshold. The 5.3 mm-long, 2 mm-thick, 4 mm-wide SCHOTT LG-940 glass element had a measured pump absorption coefficient of 3 cm−1, resulting in 80% of the pump light being absorbed. Passive Q-switching was achieved via a Co:Spinel saturable absorber with an unsaturated transmission of 96%.
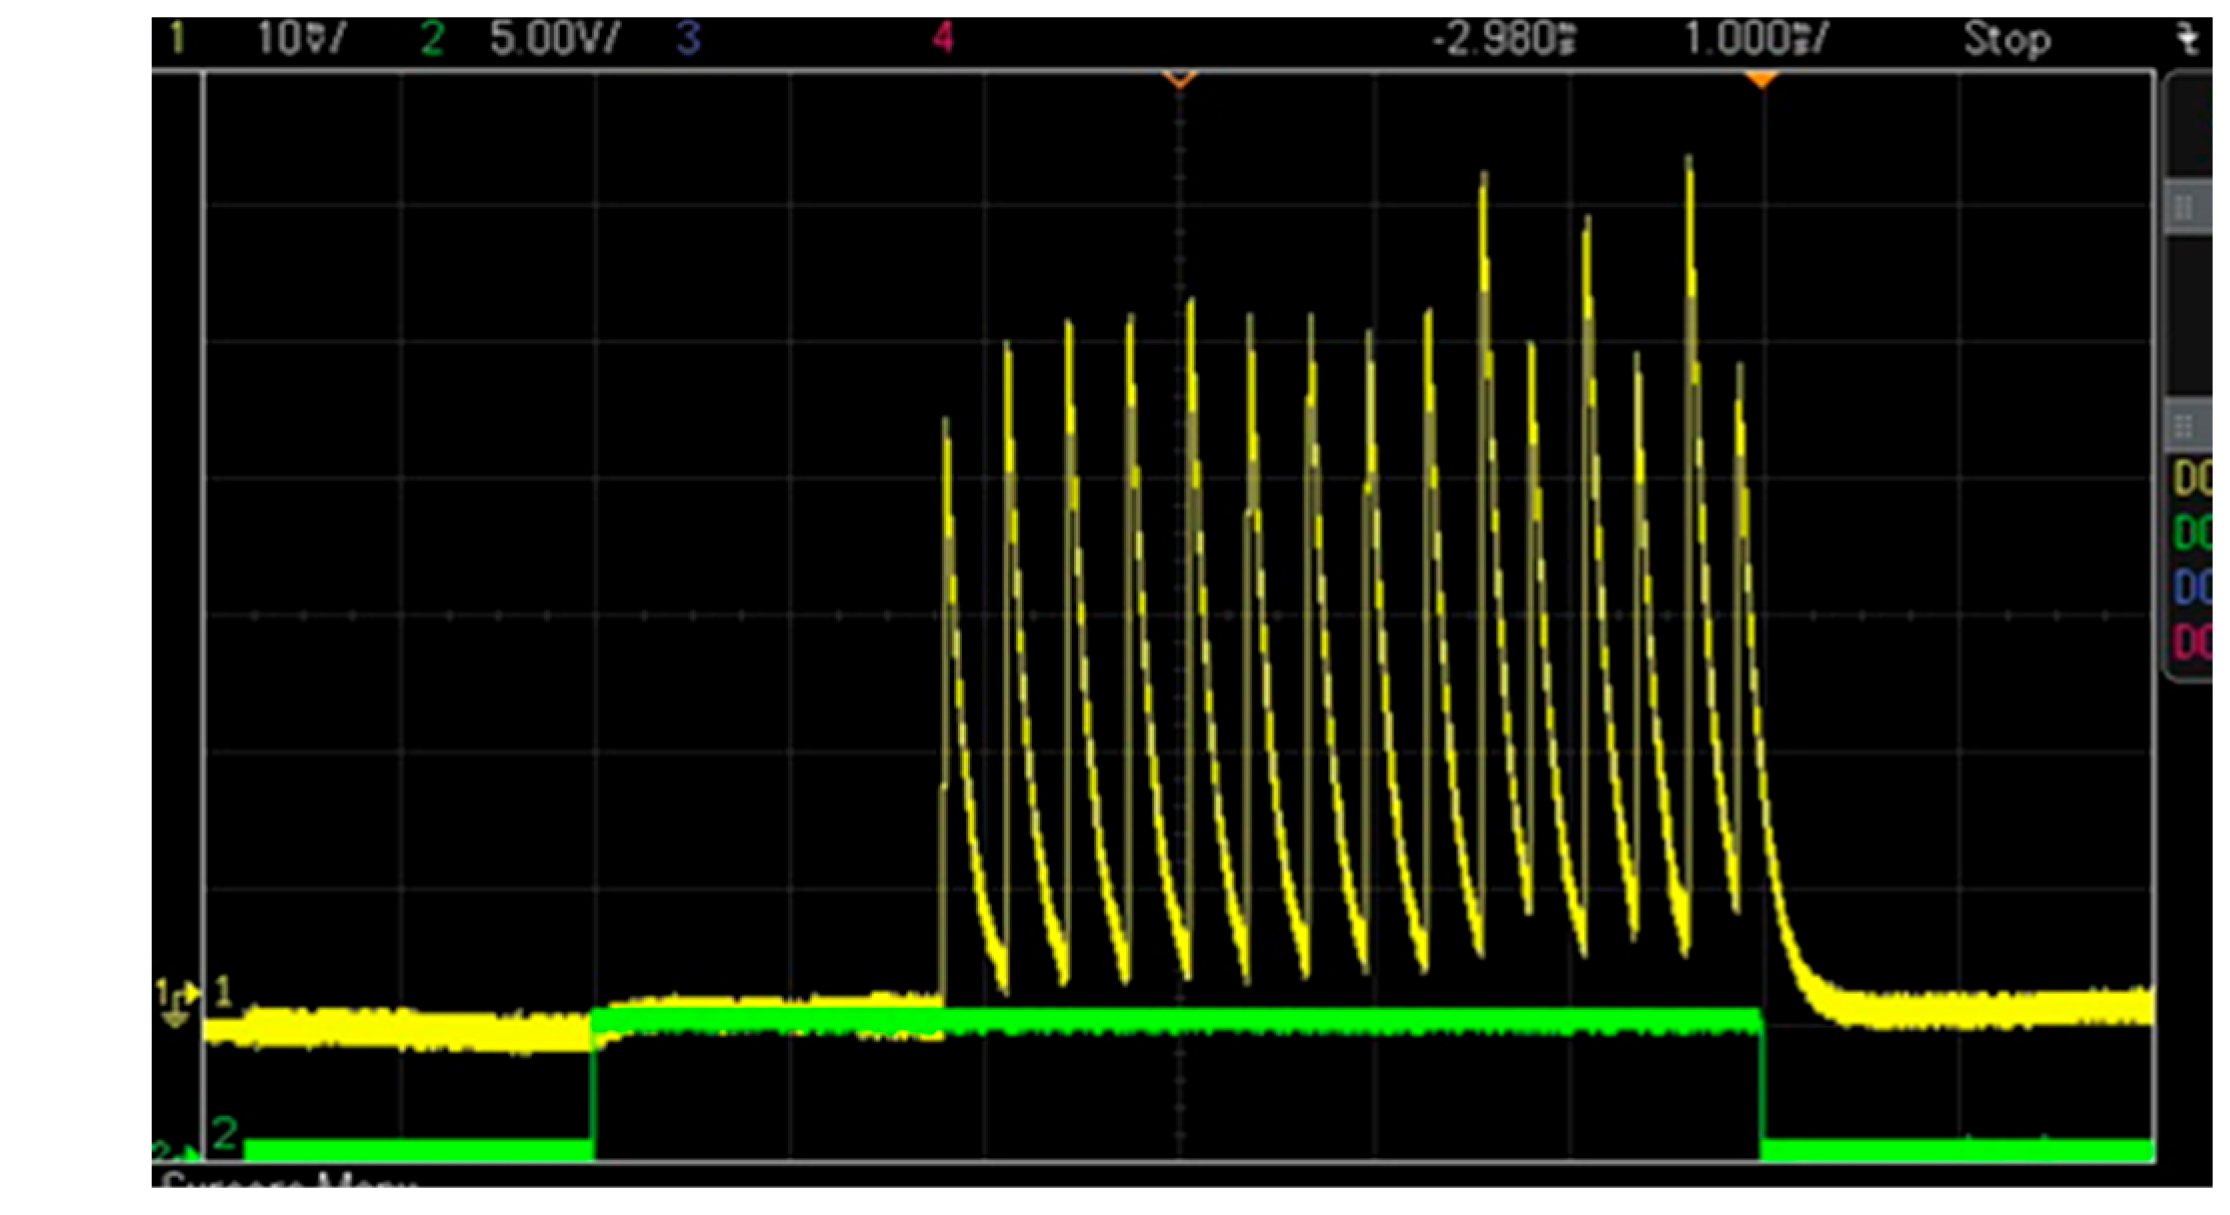
Figure 2 shows an oscilloscope trace of a 15-pulse laser output burst containing a total energy of 5.8 mJ, measured with a pump energy of 62 mJ incident on the glass. A detector with a response time of ~50 µs, much longer than each actual PQS pulse duration, was used so that the height of each pulse in the trace is proportional to the integrated energy in the pulse rather than its peak power. Separately, using a sub-nanosecond response time detector, we measured a 11.7 ns full width at half-maximum (FWHM) of an individual Q-switched pulse.
It can be noted that the optical efficiency of the laser was 9.4% when operating in burst mode, compared with 1.4% efficiency for single-pulse operation where only the first pulse in the burst was generated with a pump energy of approximately 28 mJ. The nearly seven-fold efficiency increase illustrates one significant benefit of burst-laser operation. The efficiency advantage would increase further if a longer burst was generated, with optical efficiency approaching 16%, equal to the measured optical slope efficiency of the burst laser. However, increasing thermal effects might degrade beam quality and cause irregular pulsing.
Measured pulse energies in
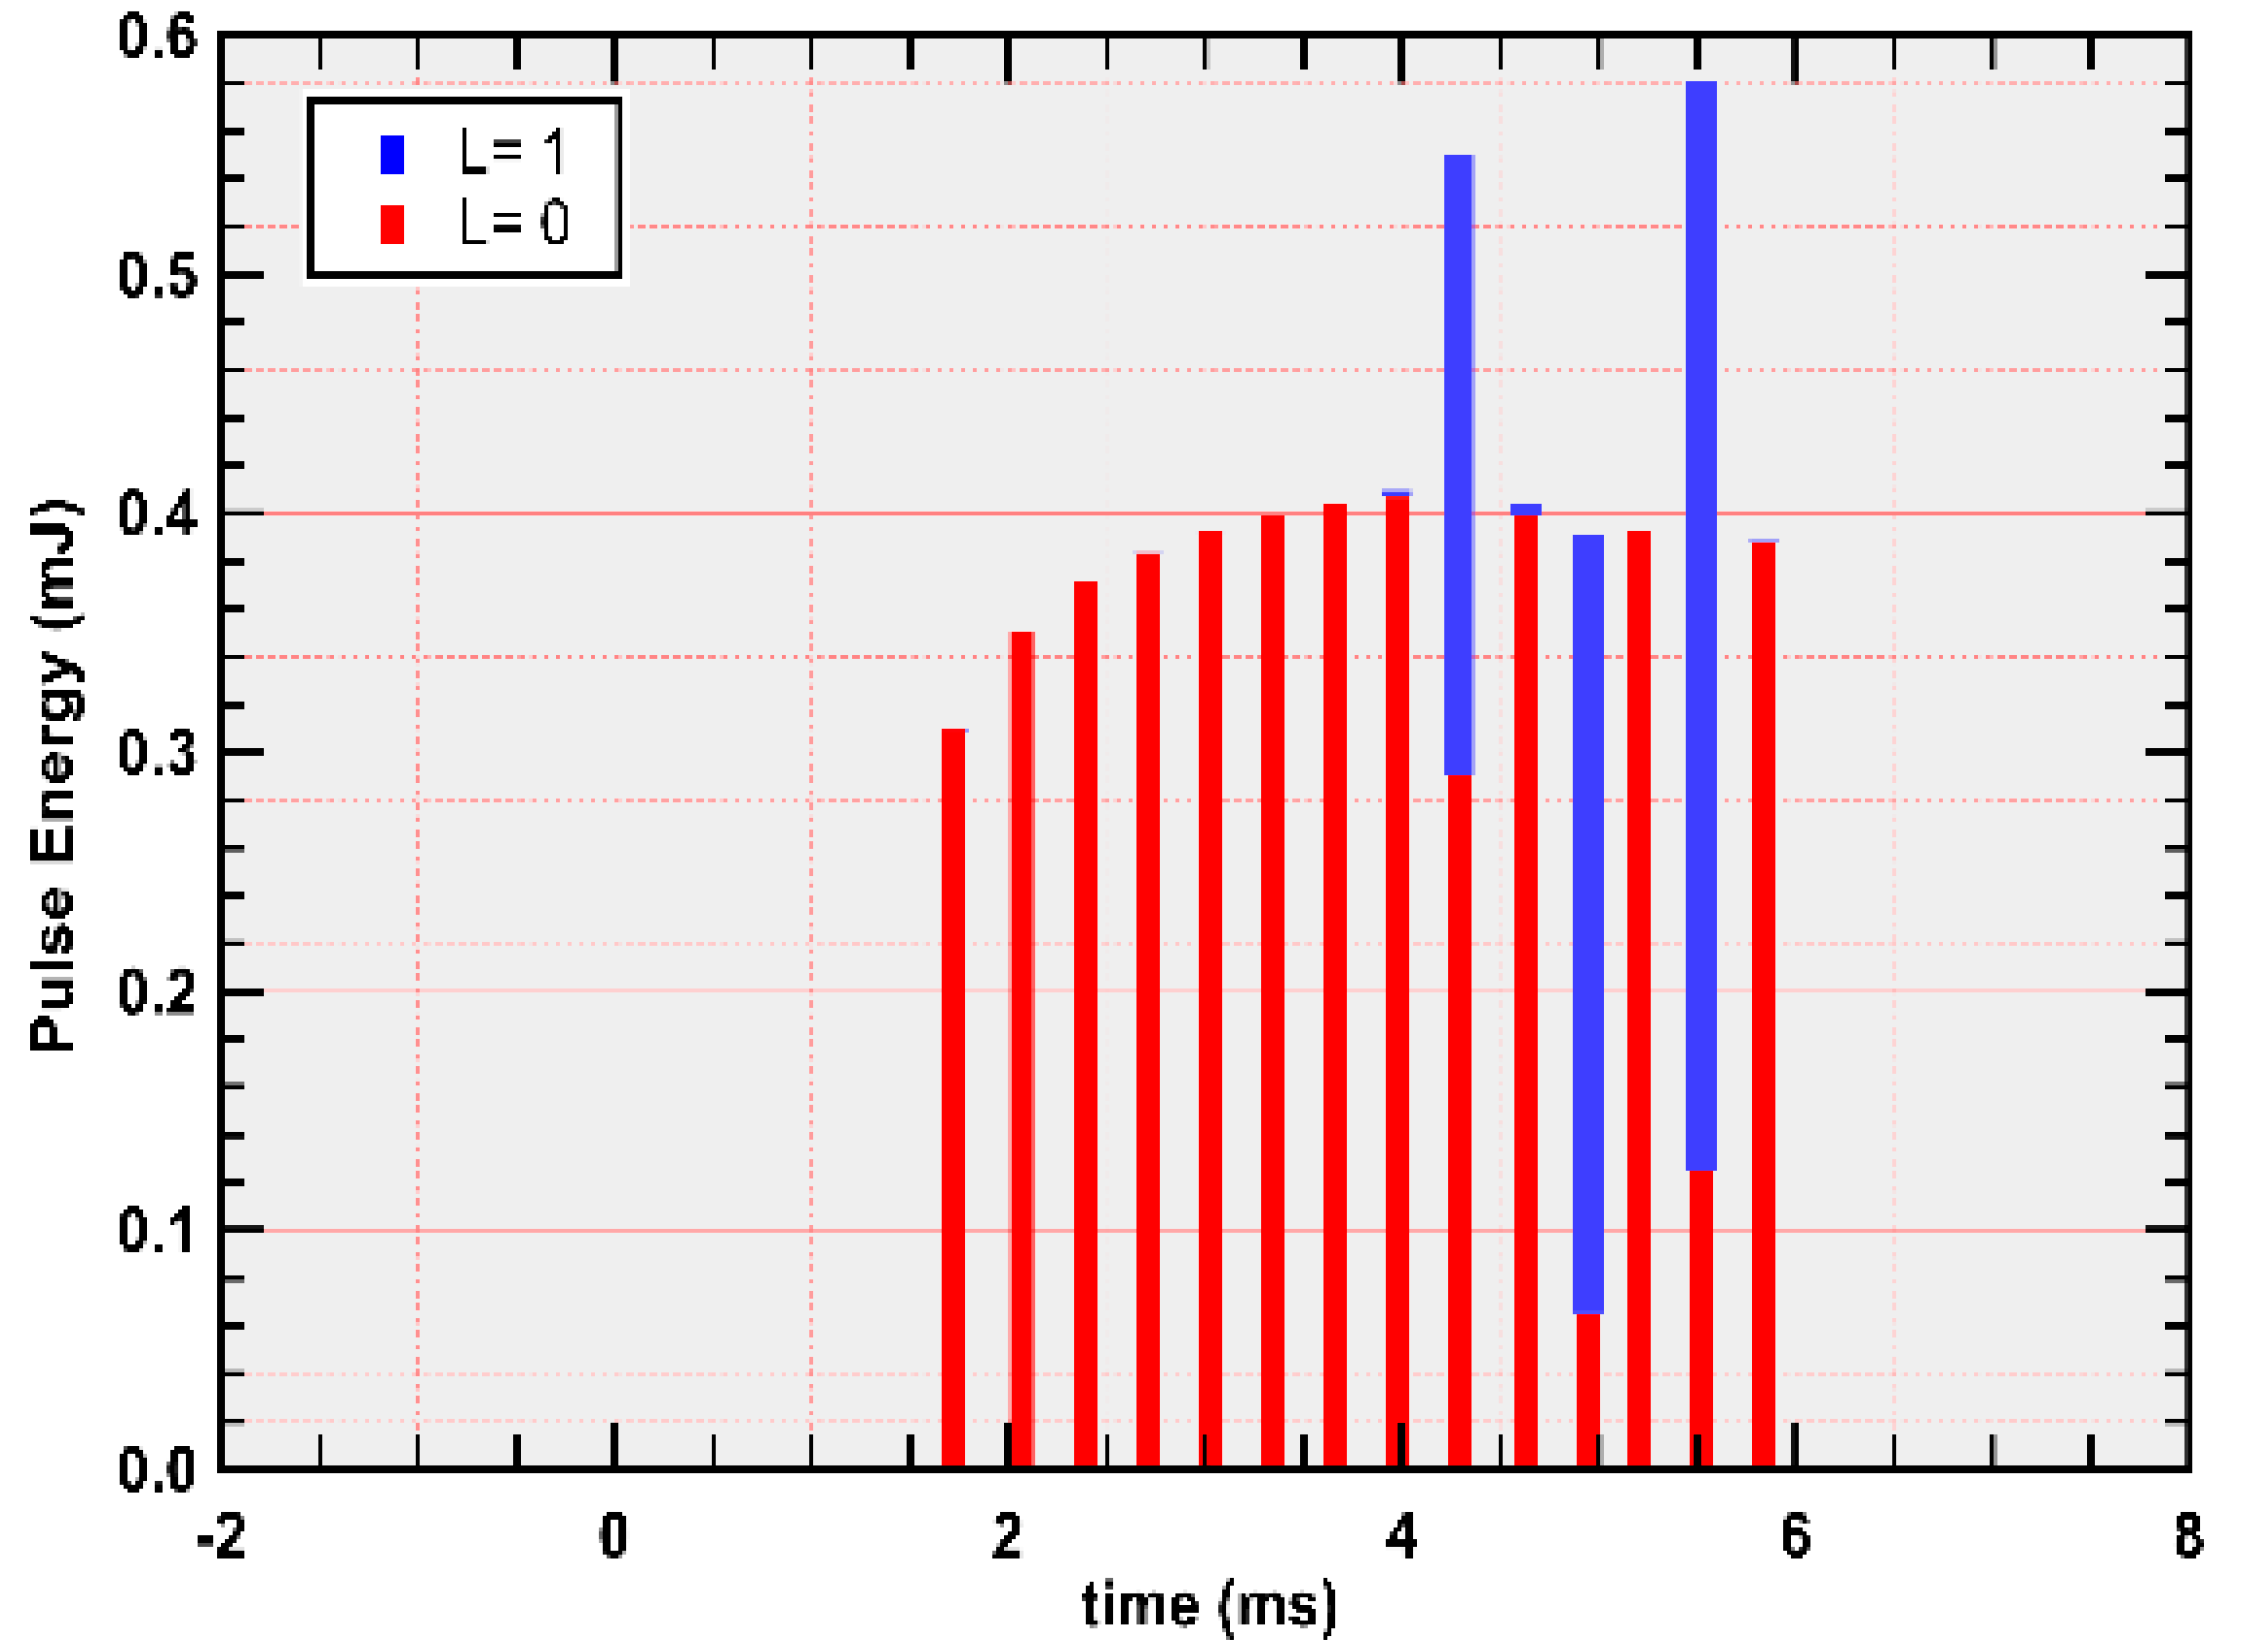
Figure 2 can be seen to increase monotonically for the first five pulses, then remain relatively constant for the remainder of the burst, except for the 10th, 12th, and 14th pulses that exhibit higher energies. As we show below, these three pulses are correlated with a non-fundamental laser spatial mode, whereas the other pulses correspond to fundamental mode emission. As discussed later, the appearance of high-order mode pulses near the end of the burst is predicted by the results of the FD-BPM numerical simulation, as shown in
Figure 3, where the amount of each pulse’s energy in fundamental and high-order mode is shown in red and blue bar heights, respectively. The average energy for all pulses in the burst was 387 µJ and 408 µJ for the measurement and simulation, respectively. The sizes and time scales of
Figure 2 and
Figure 3 have been adjusted to align with each other. Pulse amplitudes of
Figure 2 are in calibrated voltages.
The measured and calculated total burst energy is plotted as a function of the pump energy incident on the Er/Yb glass in
Figure 4, where the pump energy was varied by changing the pump diode power while maintaining the 6 ms-pump-pulse duration.
Burst energy increased linearly with pump energy as the number of pulses in the burst increased from 3 to 15 at pump energies of 34 mJ and 62 mJ, respectively. The measured and simulated optical slope efficiencies were 16% and 15%, respectively. The average pulse energy within the burst remained relatively constant at all pump levels.
Many laser applications, including LRF and LIDAR, require fundamental spatial mode emission, which results in a smooth far-field intensity distribution and minimizes beam divergence. To determine spatial mode properties of the Er/Yb glass laser operating in the burst mode, we measured near-field (NF) and far-field (FF) intensity distributions, as well as beam divergence. The NF intensity distribution was measured by using a lens to image the laser emission exiting the output coupler mirror directly on the focal plane of an InGaAs camera (Coherent Inc. Lasercam, Saxonburg, PA, USA). The FF distribution represents the angular distribution of the laser emission, corresponding to the diffraction pattern of the laser emission that would appear at large distances. It was measured by using a spherical mirror to focus the laser emission onto the camera focal plane located at the mirror focal point. By gating the camera and varying the time delay of the gate relative to the start of the pump pulse, we were able to measure the NF and FF distributions for each of the pulses in the burst, making it possible to observe how laser modal characteristics evolve as a function of time during the burst.
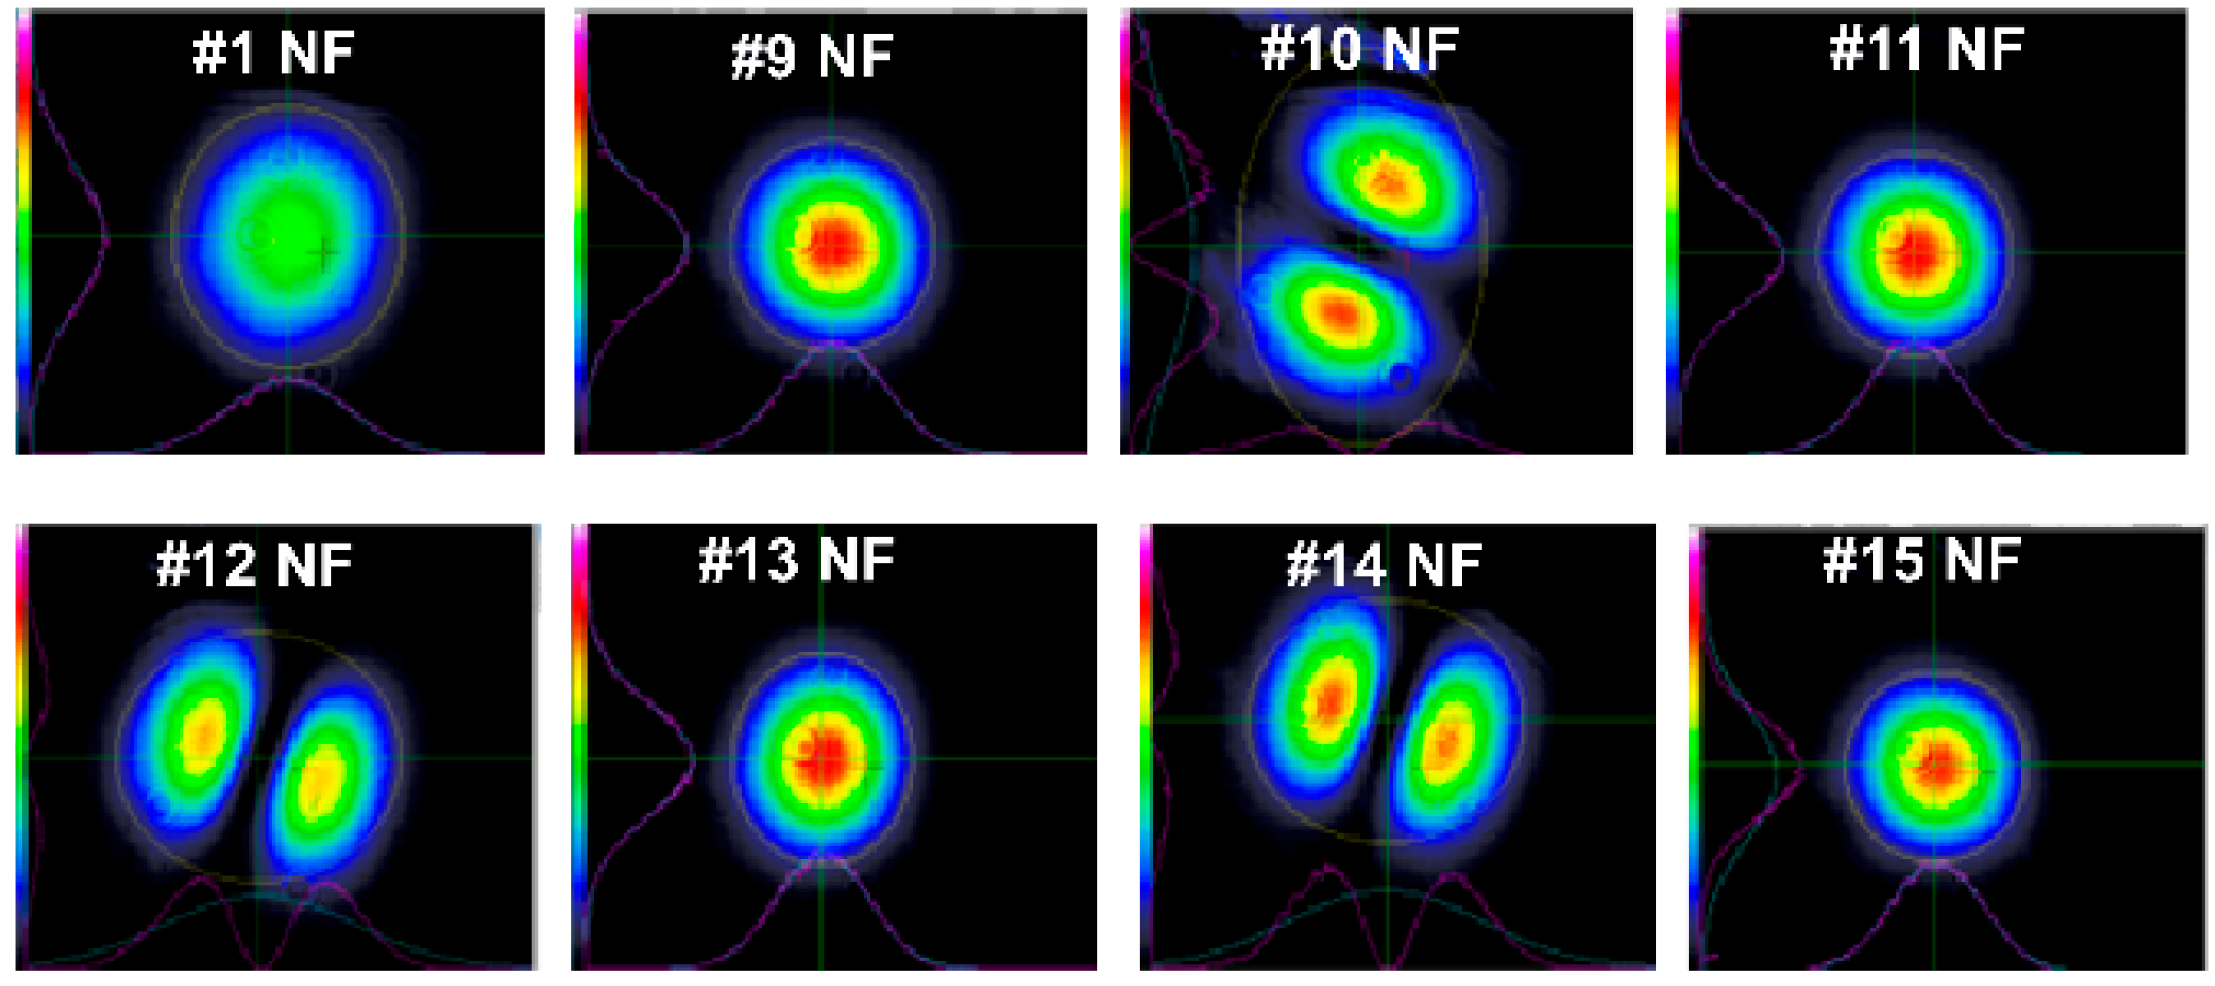
Figure 5 shows the laser NF intensity profiles for 8 selected pulses from the 15-pulse sequence in the burst.
The NF distributions of pulses #1 to #9 exhibited fundamental near-gaussian mode intensity profiles. For pulses #10 to #15, the emission alternated between the high-order mode and fundamental mode.
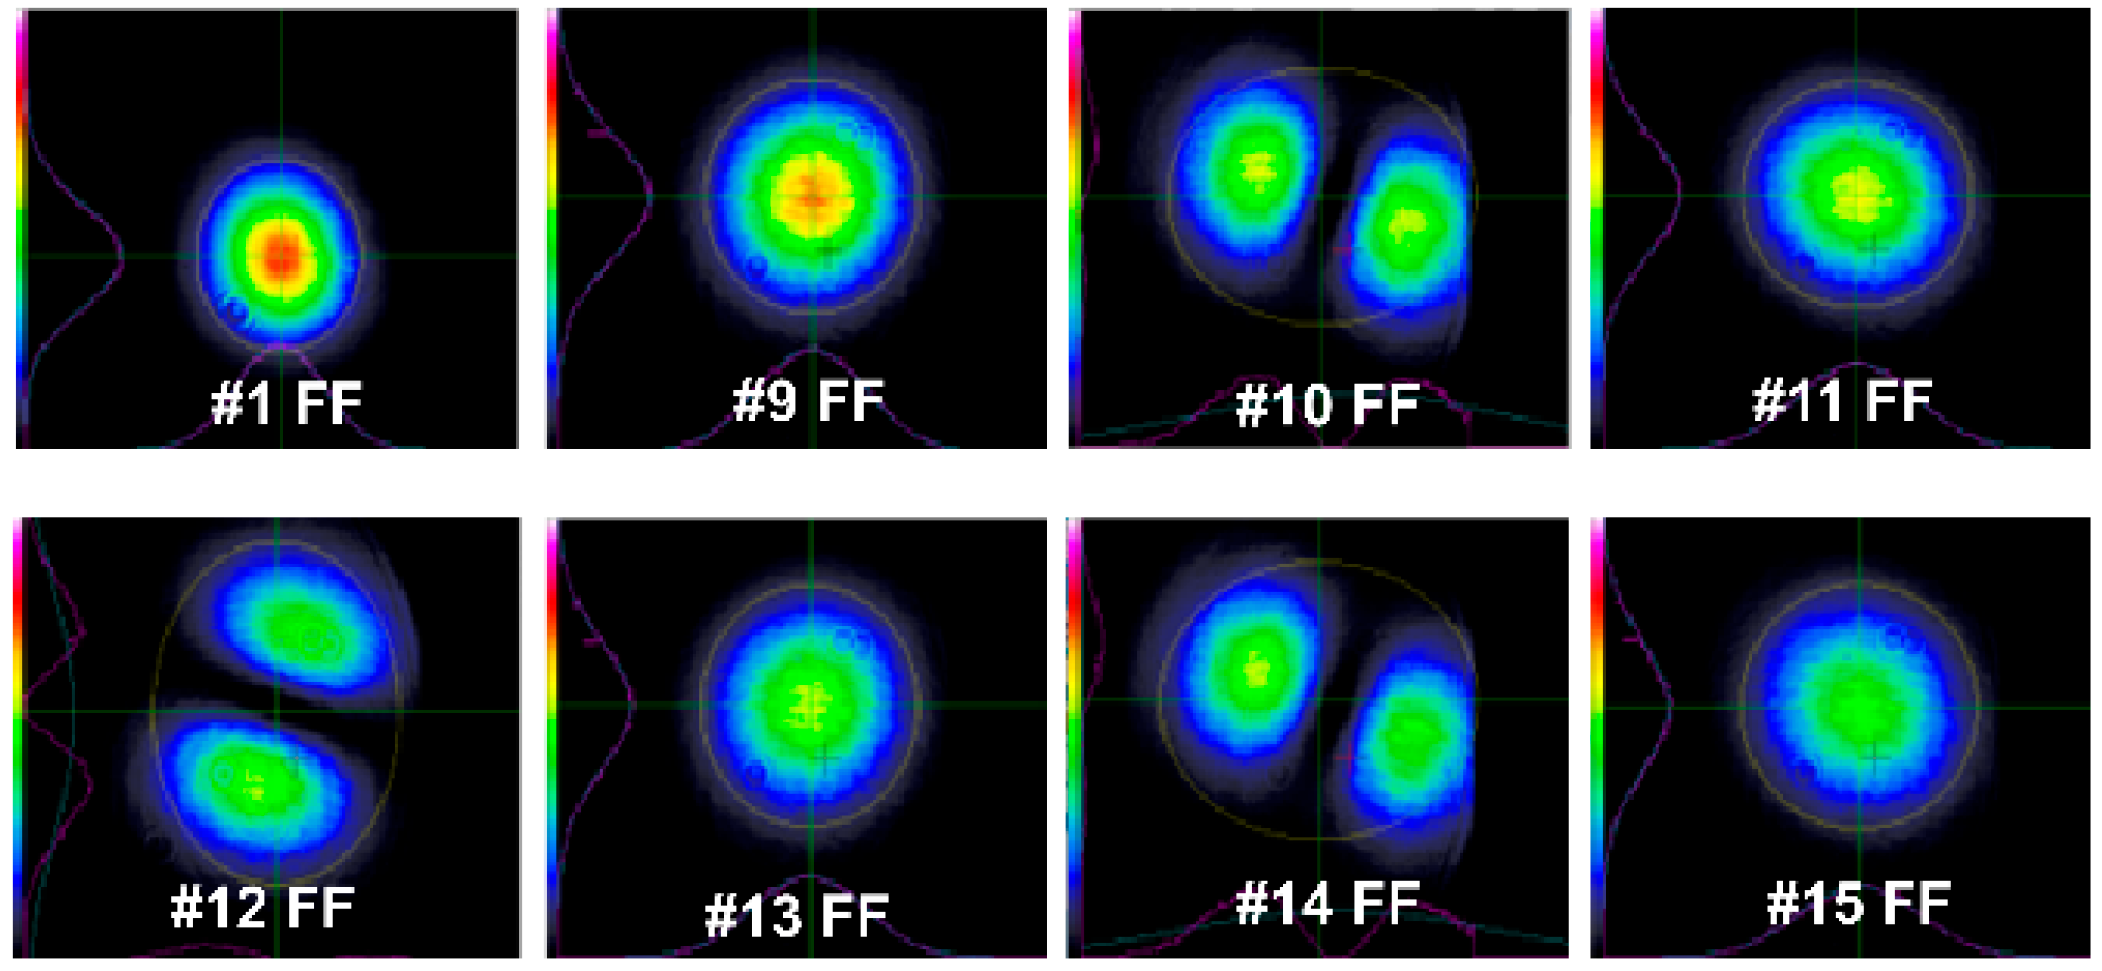
The measured FF intensity distributions for the same eight selected pulses, shown in
Figure 6, were consistent with the observed near-field distributions in exhibiting fundamental mode diffraction patterns for the first nine pulses and alternating fundamental and high-order mode diffraction patterns pulses #10 to #15. It should be noted that the NF and FF were recorded for different bursts. Since the angular orientation of the double-lobed patterns changed from burst-to-burst, their alignment in
Figure 5 and
Figure 6 do not always match.
Diameters (1/e
2) of the NF distributions and measured angular beam divergence of pulses with fundamental mode are plotted in
Figure 7. The NF diameters decreased monotonically with their increasing temporal position in the burst, from 0.33 mm for the first pulse, emitted at 1.7 ms after the start of the pump pulse, to 0.25 mm for the last pulse at 6 ms. We attribute this narrowing of the near-field distribution to thermally induced refractive index changes in the (Er/Yb):Glass.
The measured far-field 1/e
2 full divergence angles for fundamental mode pulses increased as a function of pulse temporal position in the burst, from 5.6 mR for the first pulse to 7.4 mR for the last pulse. The divergence angles were consistent with simultaneous narrowing of the near-field distribution;
Figure 7 plots the divergence angles calculated for ideal Gaussian beams using 1/e
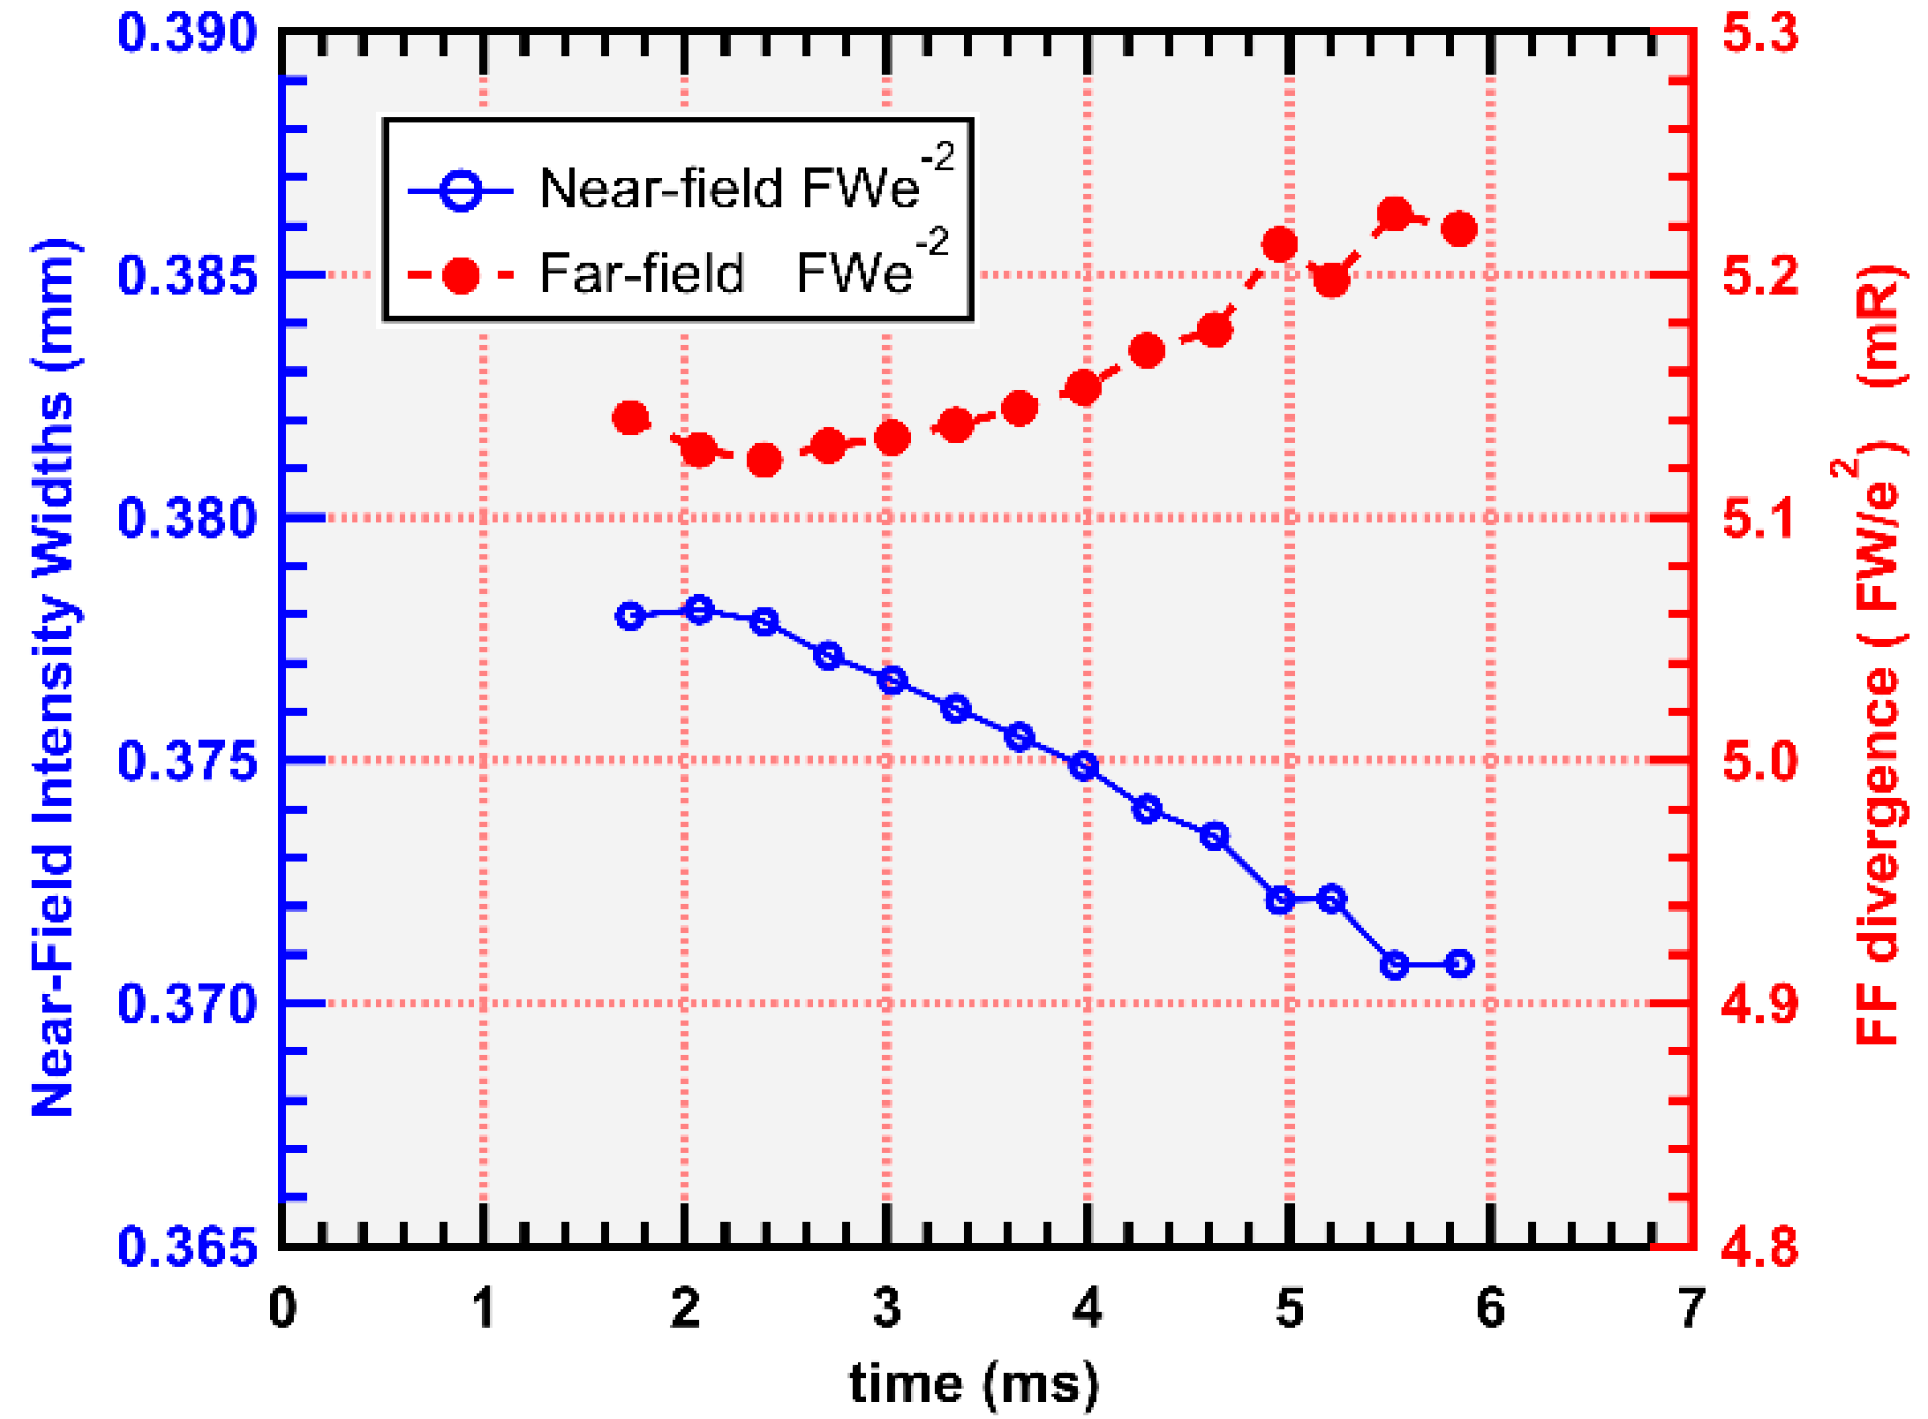
2 waist diameters of measured NF intensity distributions for all the pulses emitted with fundamental mode. Good agreement between the directly measured and calculated values confirms that the fundamental mode emission has a nearly Gaussian intensity distribution. We note that at large radii (>400 µm), the tails of the intensity profiles predicted by the FD-BPM showed an exponential linear decay coefficient, instead of a Gaussian, but the deviations are too small to be accurately measured. For comparison, the values of the near-field and far-field intensity distribution widths calculated using the FD-BPM are shown in
Figure 8. Although changes in the widths exhibit similar trends to those in the measurement, they have a much smaller magnitude. The causes of this discrepancy are currently under investigation.
3. Laser Model
3.1. Summary of FD-BPM
The details of the FD-BPM have been published in our earlier work [
8] and are not repeated here. The method uses numerical solution of the Helmholtz optical propagation equation ([
8] Equation (1)) in a medium with radial symmetry and spatially varying complex optical permittivity. Radial symmetry for the pump and laser modes requires only one lateral coordinate and greatly simplifies the analysis. Perturbations to the real part of the permittivity are caused by thermal effects, and changes to the imaginary part come from the material gain or loss. The finite-difference method produces numerical matrix equations for the optical field (as a function of radial coordinate
r, for each longitudinal position
z) that have a tri-diagonal form, with a fast, efficient solution. Our implicit Crank–Nicolson method also incorporates a first-order correction to the usual paraxial approximation, while maintaining the tri-diagonal form. These propagation equations are repeated over the laser cavity spatial round-trip, representing a quasi-static snapshot of the complex medium. When the laser field is sufficiently high, the corresponding calculation time step is a round-trip propagation time. After the saturating Q-switched pulse is over (and the laser field has decayed), a much larger time-increment (typically thousands of round-trips) can be used for faster calculation between burst pulses. The local (
r,
z) laser intensities in the active media are saved after each round-trip iteration and used to increment the material rate equations solutions.
The rate equations for the material populations use the emission and absorption cross-sections of the Er
3+ ions in the lasing transition between the ground state
4I
15/2 and excited state
4I
13/2 manifolds. Excitation occurs by energy transfer from the optically pumped
2F
7/2 2F
5/2 transition of higher-concentration Yb
3+ ions to the short-lived
4I
11/2 Er
3+ level; this excitation rapidly decays to the upper metastable
4I
13/2 lasing level. The Yb-pump wavelength (933 nm) is on the phonon-broadened high-energy tail of the transition to provide temperature insensitivity and appropriate absorption coefficient. All other rare-earth levels are neglected. The passive Q-switch saturable absorber is Co
2+: spinel. A more detailed energy level/transition diagram is shown in [
9]. Some internal laser-related parameters we use are shown in
Table 1.
We include, in the FD-BPM, simultaneous propagation in fundamental and higher-order radial modes, characterized by an integer index l for the azimuthal field phase solution. The index for the single-lobed fundamental mode is 0, denoted by label L = 0. The index l for the first higher-order mode is ±1, whose mode we denote by L = 1. Since we assume cylindrical symmetry, the L = 1 mode will have Laguerre Gaussian mode symmetry (although our FD-BPM field solutions are not constrained to be Gaussian). The L = 1 field and intensity vanish at r = 0 (the so-called ‘donut’ mode). If a small non-cylindrical refractive index perturbation exists, the Laguerre radial degeneracy is lifted, producing observed x- or y-oriented Hermite Gaussian type double-lobed modes. Summing both their x- and y-oriented intensities also approximates a cylindrically symmetric ‘donut’ distribution, for gain saturation purposes. The intensities from both L = 0 and 1 modes are used in the rate-equation saturation terms. The finite difference, tri-diagonal propagation equations for L = 1 require changes to some propagation matrix coefficients, caused by the zero-field boundary end-condition at r = 0. Inclusion of the L = 1 mode is essential to describe the observed dynamically changing multi-spatial-mode laser behavior.
The imaginary part of the permittivity is proportional to laser gain or loss. In our earlier work the real part of the permittivity was set to zero but now becomes proportional to the real refractive index change from the time-varying temperature analysis (starting in
Section 3.2). To a good approximation, the
z thermal dependence is that of the optically attenuated pump. The
r- and
t-dependencies within the 6 ms-pump are provided by the refractive index profiles shown later. The FD-BPM iterated, dual-time step, asynchronous calculation uses the thermal refractive index profile with closest calculated thermal step time (refractive index steps are not applied during a short, passively Q-switched pulse).
Much of the following analysis concentrates on the thermal cavity lensing effects, but the gain induced confinement is also critical in establishing stable laser oscillation. There is no simple analytic method to include the shape of the non-Gaussian modes and the non-uniform transverse gain saturation from both laser spatial modes. However, the numerical FD-BPM includes these effects intrinsically from its complex permittivity without resorting to numerically intensive time-varying overlap integrals. This situation of pulsing an intrinsically unstable laser cavity is in sharp contrast to the case of curved mirror, cavity-dominated modes where the gain and thermal lensing can be treated as perturbations.
In our method, the simulation starts with trial functions for the L = 0 and L = 1 fields. These evolve according to the propagation algorithms and have no predetermined shape. Qualitatively, the solutions resemble Gaussians. However at large radii, the field profiles decay with exponent arguments proportional to −r rather than −r2, as previously mentioned. This agrees with the asymptotic behavior of Bessel functions, the general basis for radially symmetric problems.
3.2. Finite-Difference Method for Temperature Evolution
Thermal evolution is critical to the (Er/Yb):Glass laser operation; most previous discussions of CW laser heating do not apply to our example. Koechner [
10] has analyzed larger-scale laser rods with repetitive pulse pumping but using Bessel function expansions and a parabolic temperature distribution. The simplifications and boundary conditions make that method inappropriate for our (Er/Yb):Glass lasers. We use a more general and simpler numerical approach, like the FD-BPM techniques. The key details and approximations of our time-varying temperature analysis are as follows:
The cylindrical rod outer radius has a heat-sink boundary temperature of 0 °C, chosen as a convenient reference. The intrinsic laser material parameters, per se, are assumed to be temperature independent.
Each local longitudinal thermal solution uses a thin-slice, disk-like geometry with its individual z-dependent heat source; the Yb pump absorption is calculated in a self-consistent manner and the quantum defect energy factor is proportional to the difference between Yb
3+ pump and Er
3+ lasing photon energies. This thin-slice approximation is used in [
11] for CW Yb-doped laser hosts and is substantiated by their measurements.
The thermal PDE solution uses an implicit finite-difference method, with time increment adjusted to the pump state (ON or OFF). In intervals between pumps the temperature profile is updated using a time-step that is coarse, but smaller than the thermal diffusion time. During a pump interval, the heat source has a smoothed top-hat (Butterworth-type) radial distribution, which approximately matches the measured profile of the pump light in the glass. The heat source was assumed to start at t = 0 (Heaviside step-function); time increments (0.1 ms) are small compared to the 6 ms pulse duration.
The time-dependent equation for temperature
T (adapted from ref. [
11]) at each local Q (heat generation) value is as follows (with parameter values in
Table 2):
Other SCHOTT LG-940 Laser glass (SCHOTT, Duryea, PA, USA) parameters are available by download [
12].
The second-derivative finite-difference transverse Laplacian operator of the heat-equation (in radial coordinates) is
where
is the radial temperature at given
z, discrete radial coordinate index
j, and temporal step
n. Temperature variation in the
z direction is primarily due to pump optical attenuation. The one-dimensional arrays for the upper and lower matrix bands have one less radial element than the diagonal. The thermal boundary condition of zero temperature for the outer point is applied. The same FD-BPM radial increment (Δ
r = 2 µm) is used for each 100 µm longitudinal
z slice. The initial solution at
t = 0 has no heat generation, which is added in the following time increments. For such diffusive partial differential equations, a method that provides the highest stability and accuracy is to average the variable expressions containing terms from iterations ‘
n’ and ‘
n + 1’ [
13]. In this example, that implicit Crank–Nicolson finite difference equation is (with thermal diffusion coefficient D)
After collecting common iteration indices, and separating iteration index terms, (
I is the unit diagonal identity matrix):
Each unknown temperature profile vector (1-D array) can be found from its predecessor. This implicit equation has a known source vector on the right-hand side. The left side has an unknown temperature vector, pre-multiplied by a tridiagonal thermal diffusion matrix. The above equation applies to thermal decay with pump turned off. Within the pump pulse, after each short-time increment, the small power-driven temperature increment is added to the latest temperature profile, prior to the next tridiagonal solution. Over a very short increment of time (much less than a thermal diffusion time), the increment of radially dependent temperature can be derived from the quantum defect energy of the pump, the pump radial profile, local pump absorption coefficient, plus glass density, and specific heat. This method allows for more precise time-variation within the pump pulse by using sufficiently short thermal computation sub-intervals (0.1 ms).
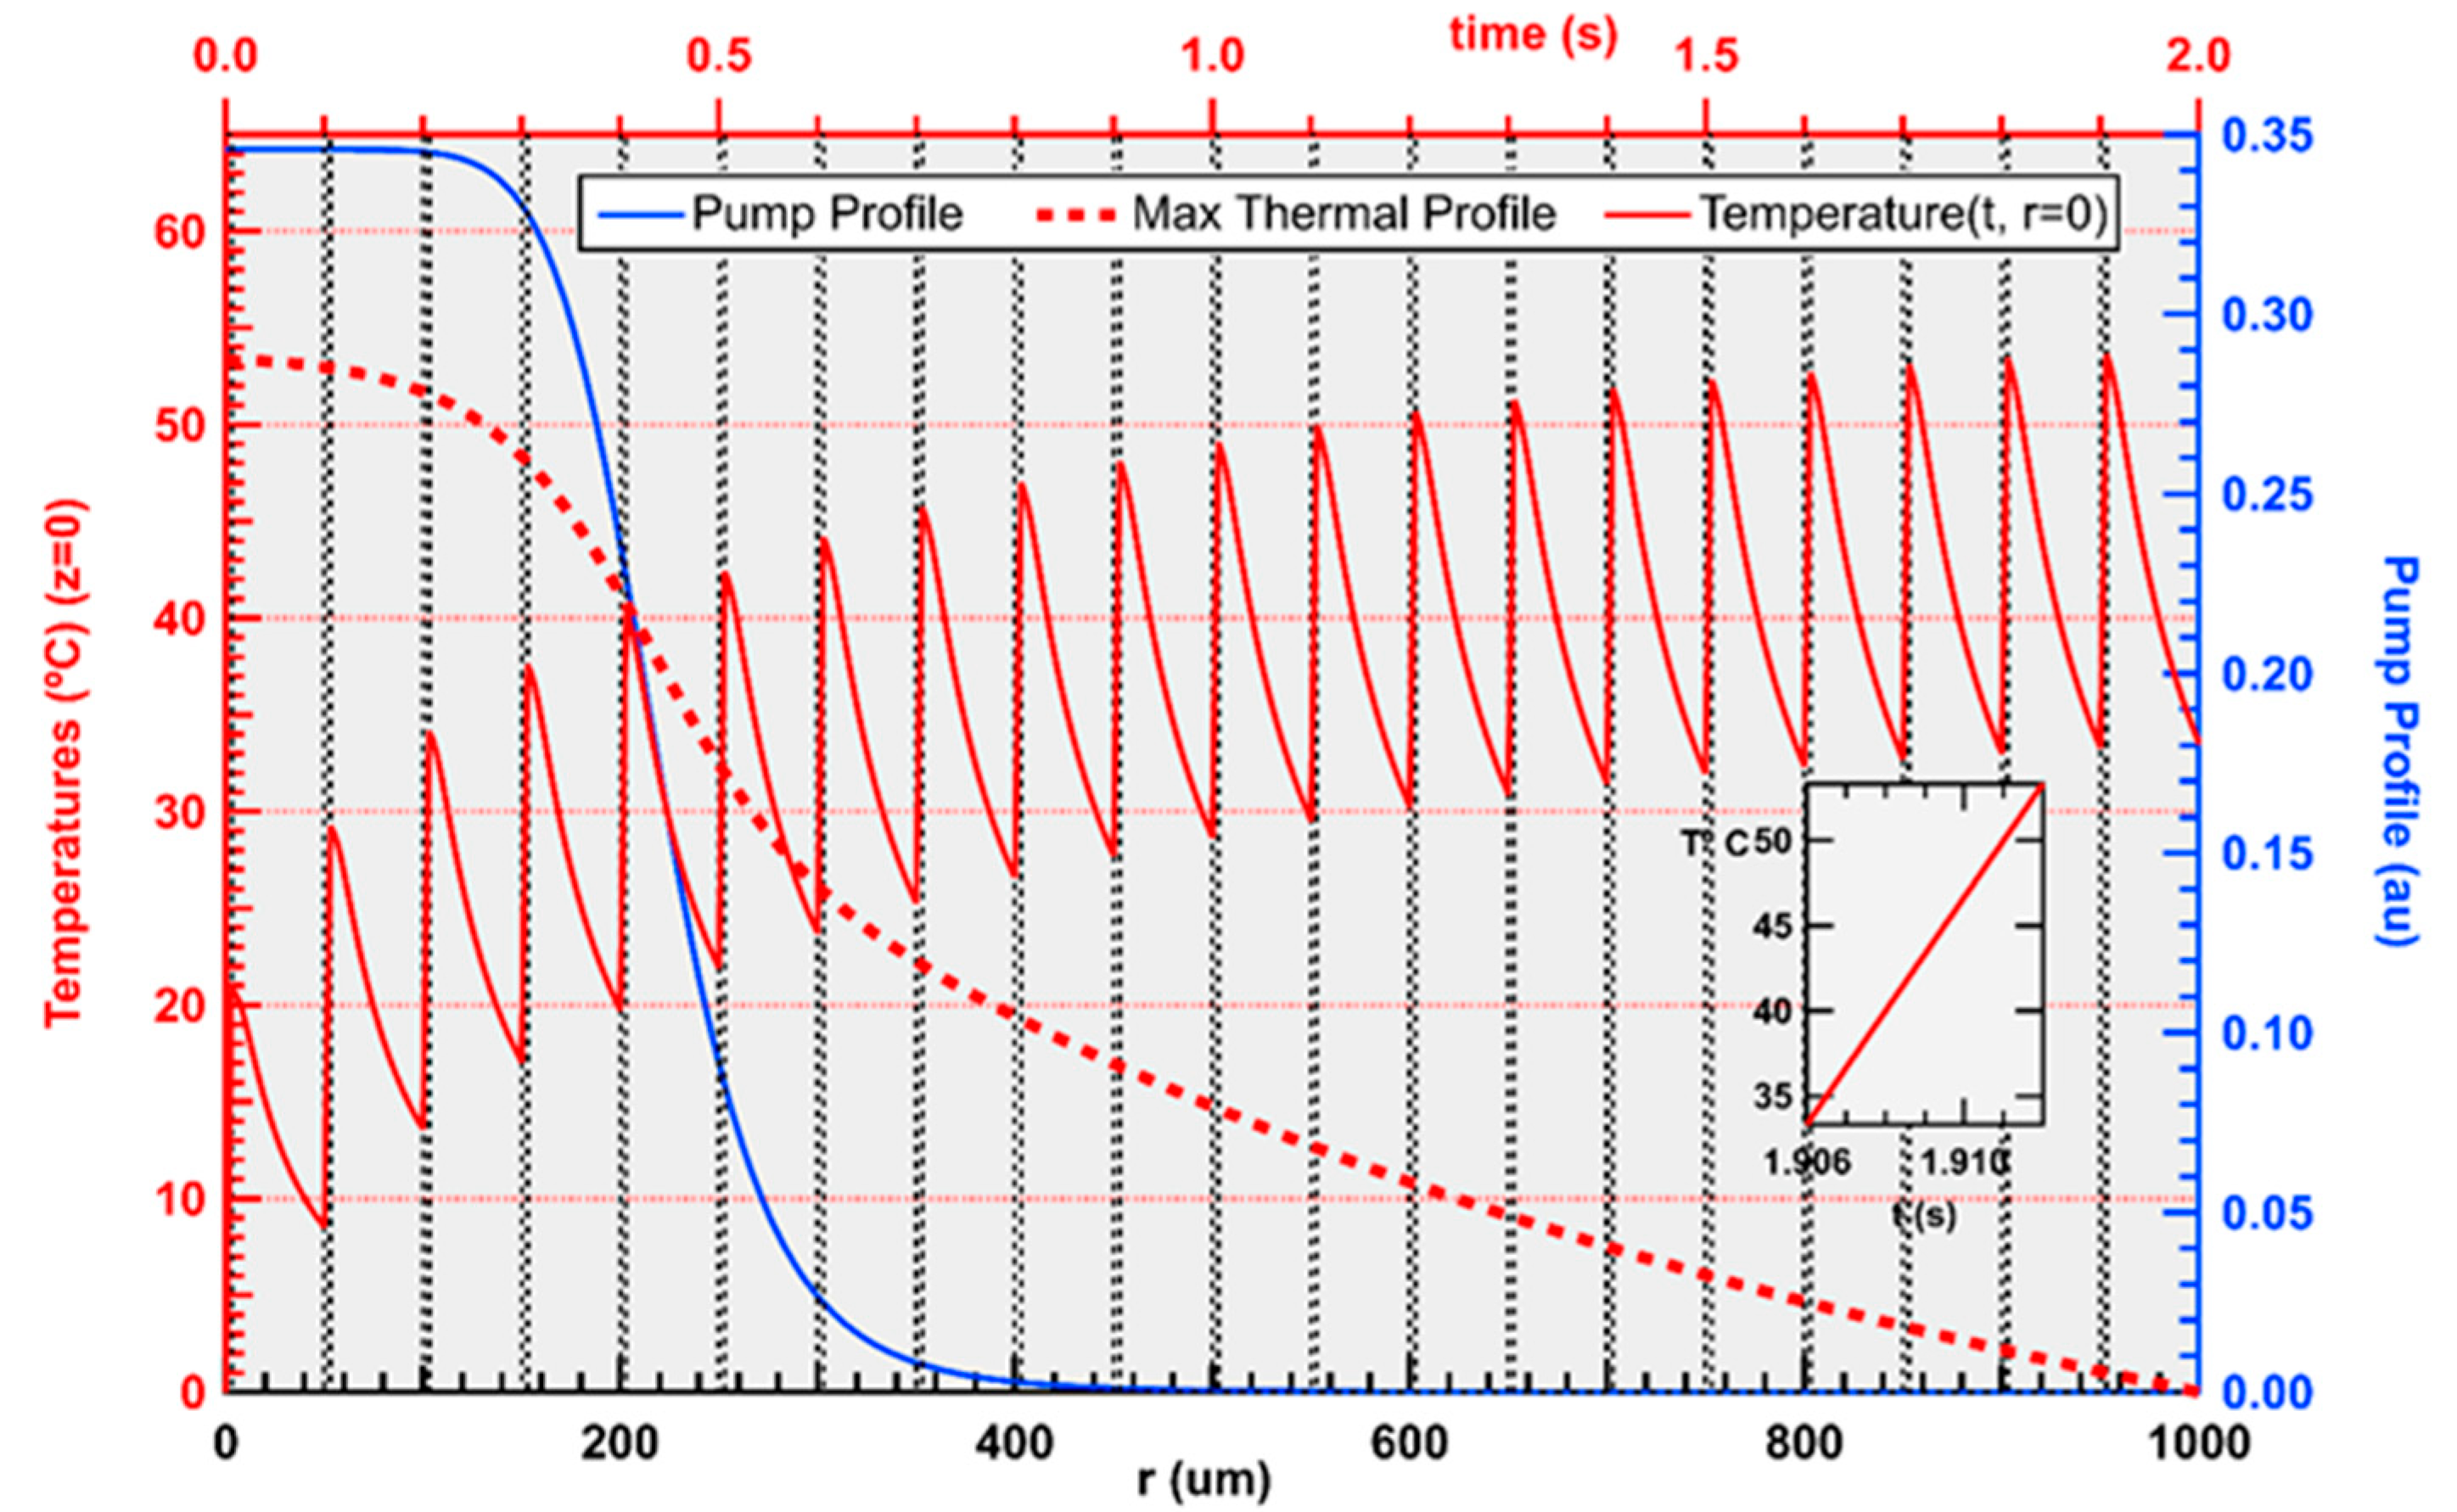
Figure 9 shows an example of the temporal variation in the temperature peak (at r = 0, z = 0) over 2 s, calculated at maximum pump energy of 62 mJ.
There are 60 sampling points within each rising edge, taken 0.1 ms apart. Heat increments are added only during the 6 ms-pump intervals, 100 ms apart. To simulate periodic pumping in a glass laser during most laboratory measurements, the pump cycle is repeated until a periodic steady state is reached. The final maximum temperature radial profile, at the pump face after 6 ms, is also shown in the red, dashed trace. When each pump pulse is turned off, the temperature diffuses more slowly toward equilibrium. The expanded inset graph within the final rising edge shows the 6 ms temperature range for our thermal FD-BPM simulation. We note that simulations of only an initial single pulse have also been performed, which are more characteristic of laser range-finder operations with long delays between ranging pulses. In that situation the initial laser temperature is uniform at the heat-sink temperature. Subsequent thermal profiles during the single-pump pulse then have flatter shapes than shown in the profiles below.
This sampling provides the basis for the thermal 2-D simulation image shown later in
Section 3.4.1 below. Its temperature
T(
r,
t) map at
z = 0 occurs during the 6 ms of the last rising edge (at 1.9 s) of the pump-pulse sequence in
Figure 9. Temperatures for longitudinal locations within the rod are proportional to the z = 0 results but reduced by the local exponential pump absorption.
The right-hand vertical axis for the radial traces in
Section 3.4.1 shows thermally induced refractive index values corresponding to temperature at
z = 0 of the final pump pulse in
Figure 9. Transformation of temperature to refractive index change is discussed in
Section 3.3. For clarity, half of the 60 traces have been removed, with 0.2 ms between plotted traces. Details of the conversion of temperature to index are discussed in
Section 3.3 and
Section 3.4 below.
3.3. Thermal (Non-Stressed) Refractive Changes in the FD-BPM
The first, additive refractive index perturbation we consider comes from the laser glass intrinsic negative temperature coefficient (dn/dT) generally applicable for all times and temperatures. While simple in form, it is also one of the dominant negative-lensing contributions for LG-940 laser glass.
The next positive-lensing effect has been previously derived from geometrical arguments. The conventional CW approach [
11,
14] was to evaluate the optical path difference in the laser rod from longitudinal strain effects along pencil-like (ray) paths at different radial distances. In principle, if no stresses are present, these strains should cause no variation in refractive index [
15]. However, the path-length changes (assumed quadratic in r) alter the ray-path angles exiting the rod. The z-integrated strains contribute to a single equivalent lens at the end of the laser rod (this is often called the ‘bulge’ factor).
We must use a different approach to evaluate similar differential strain effects within the rod. The FD BPM is constrained to use fixed perpendicular reference planes perpendicular to z. Instead of tracing unperturbed parallel rays over different path lengths in the rod, we examine the local effects on plane wave propagation. Within each 100 µm coarse axial step, a thermal path-length differential perpendicular to z will not significantly alter the diffractive propagation but will cause radial phase changes. The FD-BPM does not explicitly evaluate the phase of the laser modes; we avoid use of any cavity mode boundary conditions on the lasing wavelength because of the rapid temporal changes and short optical pulse length. However, we can apply small radial thermal phase changes to the laser mode(s), in addition to the gradual changes accrued in beam propagation (e.g., diffraction spreading). For computational efficiency, we integrate all the thermal differential phases over the z steps (including pump attenuation reduction in temperature) and use an approximate, single, radial phase transformation applied to the laser field at the rod pump face. In practice, the actual pump shape will deviate with z from our simplified Butterworth profile, so the integrated thermal phase distribution is subject to a single adjustable reduction factor. The effects of this spatial phase transformation are independent of other optically stressed refractive index perturbations and are not included in the refractive index calculations and traces in the figure of
Section 3.4.1 below.
In the FD-BPM the rod’s end surfaces cannot be altered (no ‘bulge’), but a thermal-strain lateral phase change in the mode will occur. Such an alteration is equivalent to a lensing effect (which may be aberrated). In addition, the conclusion of recent thermal simulations of various laser glasses was that the structural bulge was the smallest of all thermal focusing effects [
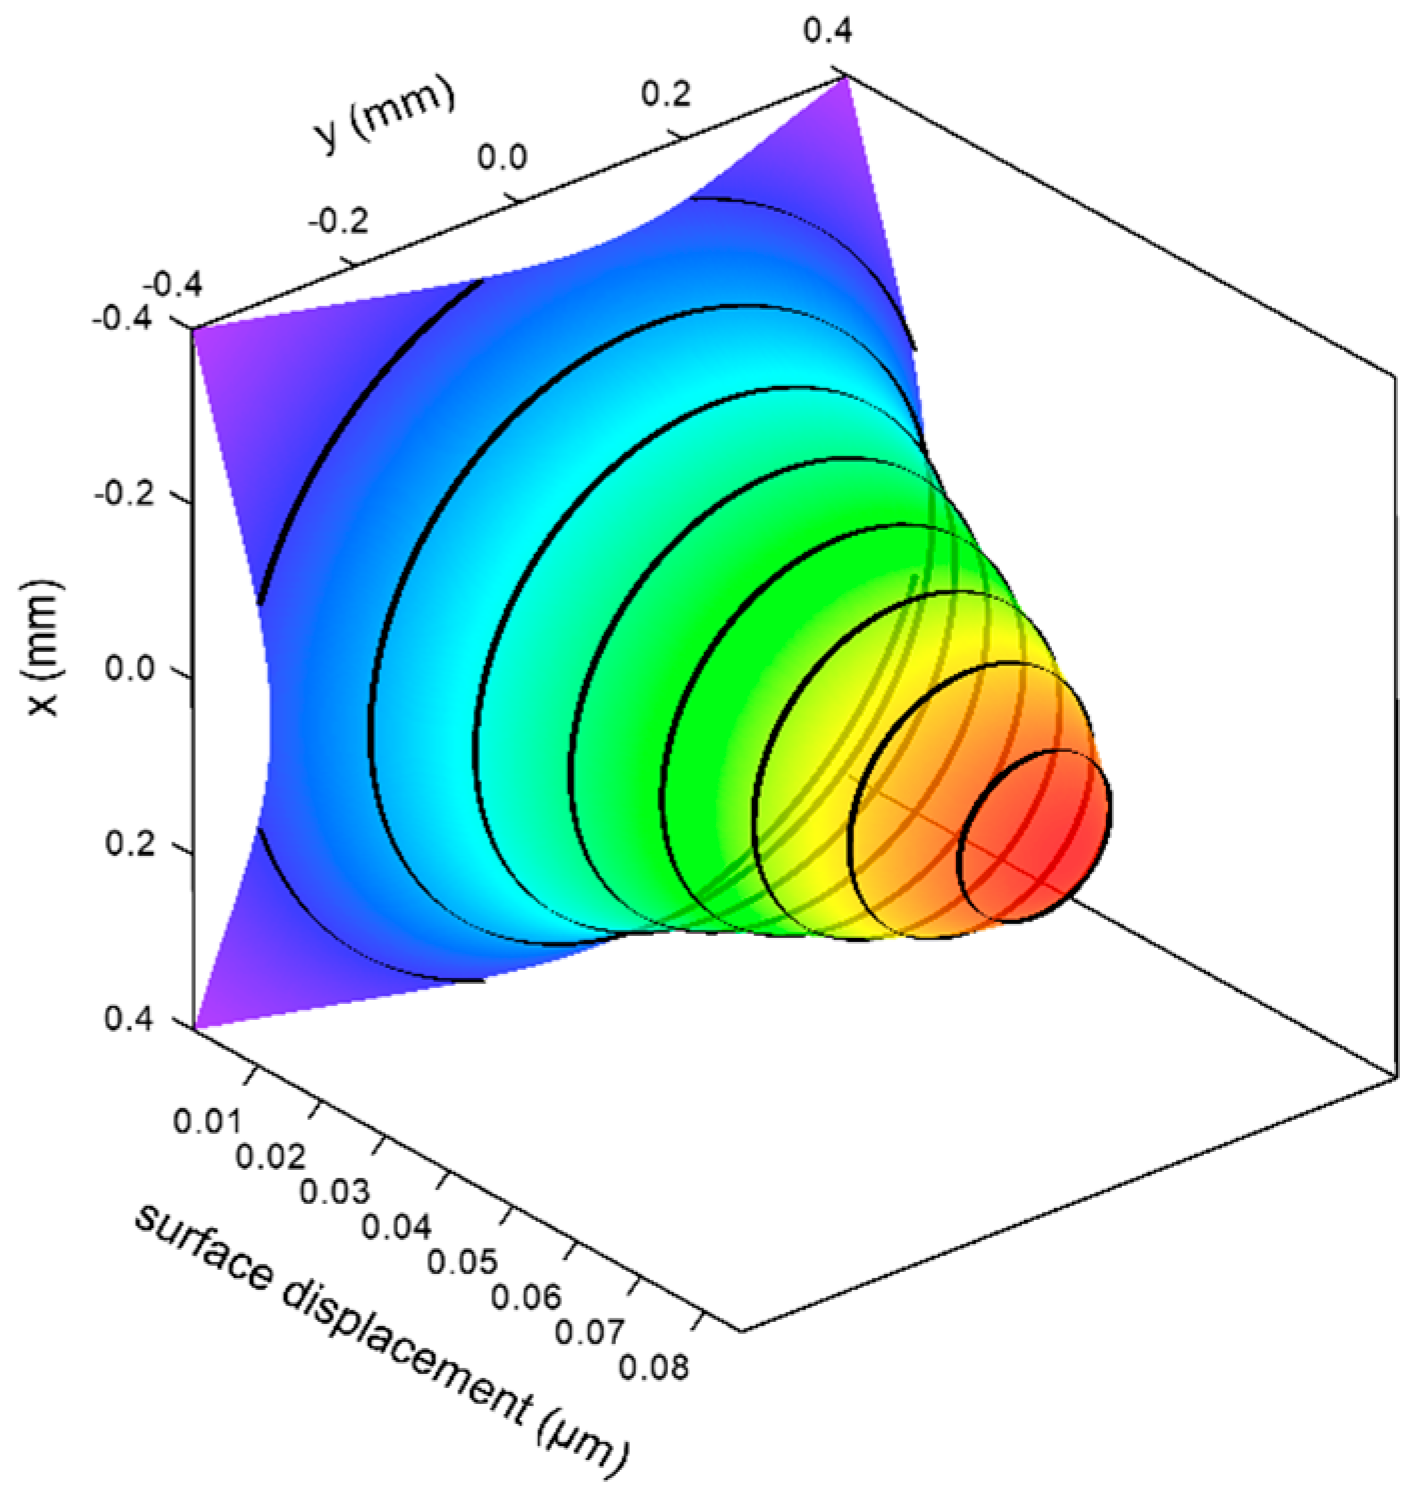
16]. We have performed a separate FEA thermal benchmark for the pumped glass end-face after 6 ms (the highest temperature condition). Its deformation is shown in
Figure 10. Analysis of the central curvature deformation gives a long, negligible focal length even at the maximum time-dependent temperature.
The surface displacement contour separations are 0.01 µm apart (0.65% of the lasing wavelength), and the resulting structural bulge lens effect is far weaker than the internal path-difference factors we calculate.
3.4. Thermally Stressed Refractive Changes in the FD-BPM
3.4.1. Lateral Stresses
We assume that the mounting of the laser rod exerts no significant stress on it. Thermal stresses are caused only by pump heating [
14].
These are radial (outward) and tangential stresses (in an arbitrarily rotated coordinate frame). E is Young’s modulus. The fixed-limit integrals over the entire rod area do not contribute to the stress-optic lensing. The bracketed temperature functions above will be referred to as T
rad (radial) and T
tan (tangential), both functions of the radial coordinate r, from the T(r) dependence and integration limits. For amorphous glass, only two independent stress coefficients are required, removing the necessity of complicated tensor analysis. The relations between stresses and refractive indices take a particularly simple form in a Cartesian frame, using orthogonal axes parallel or perpendicular to the applied external stress [
16].
We note that the Finite Element Analysis comparison in ref. [
17] of Nd:Glass and Nd:YAG found a sign error in the analytic treatment of lateral thermo-optical stress in ref. [
11].
We use the above Cartesian stress description to define the variables
The heat generation has radial symmetry, so we can choose the azimuthal angle to be zero and align the parallel and perpendicular axes to coincide with ‘x’ and ‘y’, respectively. Similarly, the radial and tangential stress orientations can be chosen to align with the Cartesian axes. The result for the thermally birefringent refractive indices along any rotated axis frame:
Note that Young’s modulus numerators and denominators have canceled each other in the temperature-to-index conversion. With the constraint of cylindrical symmetry and the scalar nature of the FD-BPM simulated laser field, the simplest approximation for applying the FD-BPM to any mode polarization is to take the average value of the two birefringent indices of refraction. Both refractive index profiles for LG-940 laser glass are positive near r = 0, with different curvatures. The polarization-averaged lateral stress index contributes to positive focusing of the laser field; it is one component of the refractive index perturbation traces whose values are shown in the right axis of
Figure 11.
Figure 11’s dotted trace (with normalized peak amplitude) shows a typical laser L = 0 field amplitude, provided for comparison with the radially varying refractive indices. The vertical dashed line shows the HWHM radius of the pump.
3.4.2. Longitudinal Stress
We apply another positive refractive index contribution, the generally neglected longitudinal stress
for any optical polarization perpendicular to the propagation axis ([
17] Equation (5), [
18] (Equation (243)). The small change in perpendicular refractive index from weak axial stress is
Its total z-stress coefficient value with respect to temperature is 2.54 × 10⁻⁶/°C and provides some offset to the negative stress-free index coefficient, −3.6 × 10⁻⁶/°C.
A summarized list of lensing corrections is: (1) negative refractive index, (2) positive strain-induced phase lens, an average of the positive transverse stress-induced refractive indices, and (3) positive longitudinal stress-induced change to the refractive index for any polarization orthogonal to z. The polarization average of the radial and tangential stress index perturbations is used to approximate their combined positive-lensing effect on any laser mode polarization perpendicular to the z axis.
Only factors from
, average lateral stress-index, and longitudinal stress are included in the total thermally induced changes shown by the multiple traces at increasing times in
Figure 8. The single effective lateral phase transformation at the pump face is not part of the z-distributed index perturbations of the other factors within the glass; it is a positive lensing contribution necessary to simulate high-order mode growth.
Understanding the competition between the fundamental (L = 0) mode and the next highest ‘donut’ (L = 1) mode depends not only on the influence of the refractive indices but the gain confinement and non-linear gain saturations as well. In many of the FD-BPM simulations it appears that the role of beam-focusing is important in determining the onset of multi-mode oscillation. Weaker focusing may suppress the L = 1 modes but may also degrade efficiency. Measurements show a general trend of L = 1 mode thresholds occurring near the end of the pump pulse.
4. Discussions and Conclusions
We present, to our knowledge, the first complete experimental characterization of the output characteristics of a compact, passively Q-switched (Er/Yb):Glass laser in burst-pulse operation, and a matching FD-BPM laser model that incorporates the effects of distributed, time-dependent, localized heating in the glass. As shown in
Figure 2, the model accurately predicts the energy distribution of the individual pulses in the burst, and the appearance of high-order spatial modes for few pulses near the end of the 6 ms-pump pulse. We note that unless all the positive-lensing thermal effects we described are included, the model does not predict the observed appearance of high-order modes. This is consistent with the SCHOTT analysis of larger CW lasers [
16]; LG-940 has the most highly balanced thermal lensing effects among the types of Er-doped eye-safe laser glasses. Our simulation also shows a large degree of cancelation of positive and negative lensing factors.
A comparison between various measured and simulated emission characteristics is shown in
Table 3. Reasonable agreement between simulated and measured laser output characteristics is demonstrated. These include total burst energy, individual pulse energy, pulse FWHM, starting NF diameter and FF divergence, and appearance of high-order spatial mode for pulses at the end of the burst.
The main discrepancy between the measurement and simulation occurs in the change in near-field diameter and far-field beam divergence with time during the burst. The measured 23% decrease in the NF diameter and similar increase in the FF divergence during the burst were significantly smaller than the 1.5% changes in the two parameters predicted by simulation. The cause of this disagreement is under investigation.
The code we developed is similar to C/C++ but is based on the language/graphics environment of Igor Pro 9 [
19]. Many other Software Development Environments (e.g., MATLAB, Python) with general scientific, linear algebra, and graphics functions could be used. Any general-purpose PC with a few-GHz CPU clock and >16 GB memory should be adequate. We hope that our simulation techniques can provide a simpler, less complicated, and inexpensive method for comprehensive modeling of this class of laser. The developed model makes it possible to predict the impact of changing laser-cavity parameters on the output characteristics of this important type of compact, eye-safe pulsed source that is used in numerous applications.

